
Abstract
Recent studies puzzle over why it is that democratically elected governments have not responded to rising inequality by engaging in more redistribution. While some scholars argue that low- and middle-income citizens have not responded to rising inequality in the way we would expect, others argue that policymakers are not responsive to the demands of these citizens. We argue that both solutions to the “lack-of-redistribution puzzle” leave something to be desired and that variation across policy domains sheds new light on the issues at stake in this debate. Based on an original 2019 survey replicating questions asked by the European Social Survey in 2008, we show that support for progressive income taxation and more egalitarian unemployment insurance has increased in most West European countries since 2008. Tax policy has moved in the same direction as public opinion, but unemployment policy has not. We conclude that public opinion should be conceived as a constraint on policymakers motivated by political-economy considerations rather than a driver of policy developments.
Keywords
Over the last couple of decades, the politics of income inequality and redistribution has emerged as an exciting field of inquiry that bridges American and comparative politics and also bridges the study of public policy and the study of political behavior. While Americanists working on this topic commonly consider the United States to be an exceptional case, comparativists have increasingly come to frame their work in terms of a general puzzle: democratically elected governments across advanced capitalist countries have failed to compensate low- and middle-income citizens—the majority of citizens—for a pervasive and dramatic increase in top income shares. Broadly speaking, two alternative solutions to this puzzle have been proposed. One solution posits that low- and middle-income citizens do not respond to rising inequality by demanding more redistribution, either because they do not accurately perceive what has happened to the income distribution or because they consider inequality as fair and/or conducive to economic growth. The other solution posits that persistent, possibly increasing, income bias in democratic representation explains the lack of compensatory redistribution.
This article takes stock of proposed solutions to the lack-of-compensatory-redistribution puzzle, identifies weaknesses on both sides of the debate, and suggests new paths for theorizing and empirical research. We argue that the literature on preferences for redistribution ought to focus more on public support for specific policies with redistributive implications, as opposed to general attitudes toward inequality and the role of the state. We argue further that the literature on unequal policy responsiveness errs to the extent that it conflates a very wide range of policy issues and that insights about the sources of unequal policy responsiveness can be gained by exploring temporal dynamics and variation across policy domains, as well as variation across countries.
The literature on unequal policy responsiveness contests the idea that government policy caters to swing voters in the middle of the income distribution, but most contributions to this literature seem to embrace the premise that policy changes can (should) be explained by changes in the policy preferences of some citizens. The alternative perspective that we will sketch toward the end of this article posits that citizens’ policy preferences are a constraint on government choices pertaining to redistribution rather a (let alone the) driver of policy change. We argue that reelection prospects feature crucially in the decision-making calculus of (partisan) policymakers and that reelection prospects depend on economic performance. Macroeconomic policy paradigms as well as objective economic conditions determine the extent to which governments take account of the policy preferences of different groups of citizens.
To illustrate our approach as well as the limitations of existing studies that speak to the lack-of-compensatory-redistribution puzzle, we present data on public opinion and government policies pertaining to tax progressivity and unemployment compensation in twelve West European countries over the period from 2008 to 2019. Our empirical analysis relies on only a few measures of public opinion and rather crude indicators of government policy, observed for twelve units at two points in time. We do not aspire to test alternative hypotheses, let alone to identify “causal effects,” but rather to reframe the debate about the lack of compensatory redistribution and suggest ways in which relevant literatures might be advanced.
The following discussion is organized into three parts. Addressing the literature on preferences for redistribution, the first part shows that public support for redistributive taxation and unemployment compensation increased across Western Europe in the decade following the financial crisis of 2007–8. Addressing the literature on unequal responsiveness, the second part shows that government policy shifted along with public opinion with respect to income taxation, but not with respect to unemployment compensation. 1 The third part mobilizes insights from comparative political economy to explain the contrast between the two policy domains as well as cross-national variation within each domain.
Part 1: Preferences for Redistribution
State of the Literature
The comparative literature on preferences for redistribution relies heavily on a question fielded by the International Social Survey Program (ISSP) since the mid-1980s and by the European Social Survey (ESS) since 2002. Asking respondents whether or not they agree that “the government should take measures to reduce differences in income levels,” the standard redistribution question provides five response options: “strongly disagree,” “disagree,” “neither agree nor disagree,” “agree,” and “strongly agree.” Many studies dichotomize these answers and then estimate the effects of individual-level and country-level variables on the probability that an individual agrees or strongly agrees that the government should take measures to reduce income differences.
It is commonplace to point out that responses to the standard redistribution question are not consistent with the model of demand for redistribution put forth by Meltzer and Richard. 2 Assuming that demand for redistribution is strictly motivated by short-term income maximization, the Meltzer-Richard model predicts that individuals with incomes above the mean are always opposed to redistribution and that demand for redistribution among individuals with incomes below the mean rises with top-end inequality. 3 Contrary to the first prediction, a majority of European survey respondents in the top income quartile agree with the proposition that the government should take measures to reduce income differences. Contrary to the second prediction, support for redistribution across the income distribution has been remarkably stable over the last twenty to thirty years.
Based on ESS data for the twelve West European countries that will feature in our discussion of specific redistributive policies, Figure 1 illustrates the latter challenge to the Meltzer-Richard model by tracking the percentage of survey respondents who agree (more or less) that the government should take measures to reduce income differences from 2002 to 2018. We observe statistically significant increases in support for redistribution from 2002 to 2018 in Austria, Germany, the Netherlands, and the United Kingdom and statistically significant declines in France, Ireland, and Sweden, but there are only two instances in which changes from 2002 to 2018 exceed 5 percentage points (Austria and Germany). 4
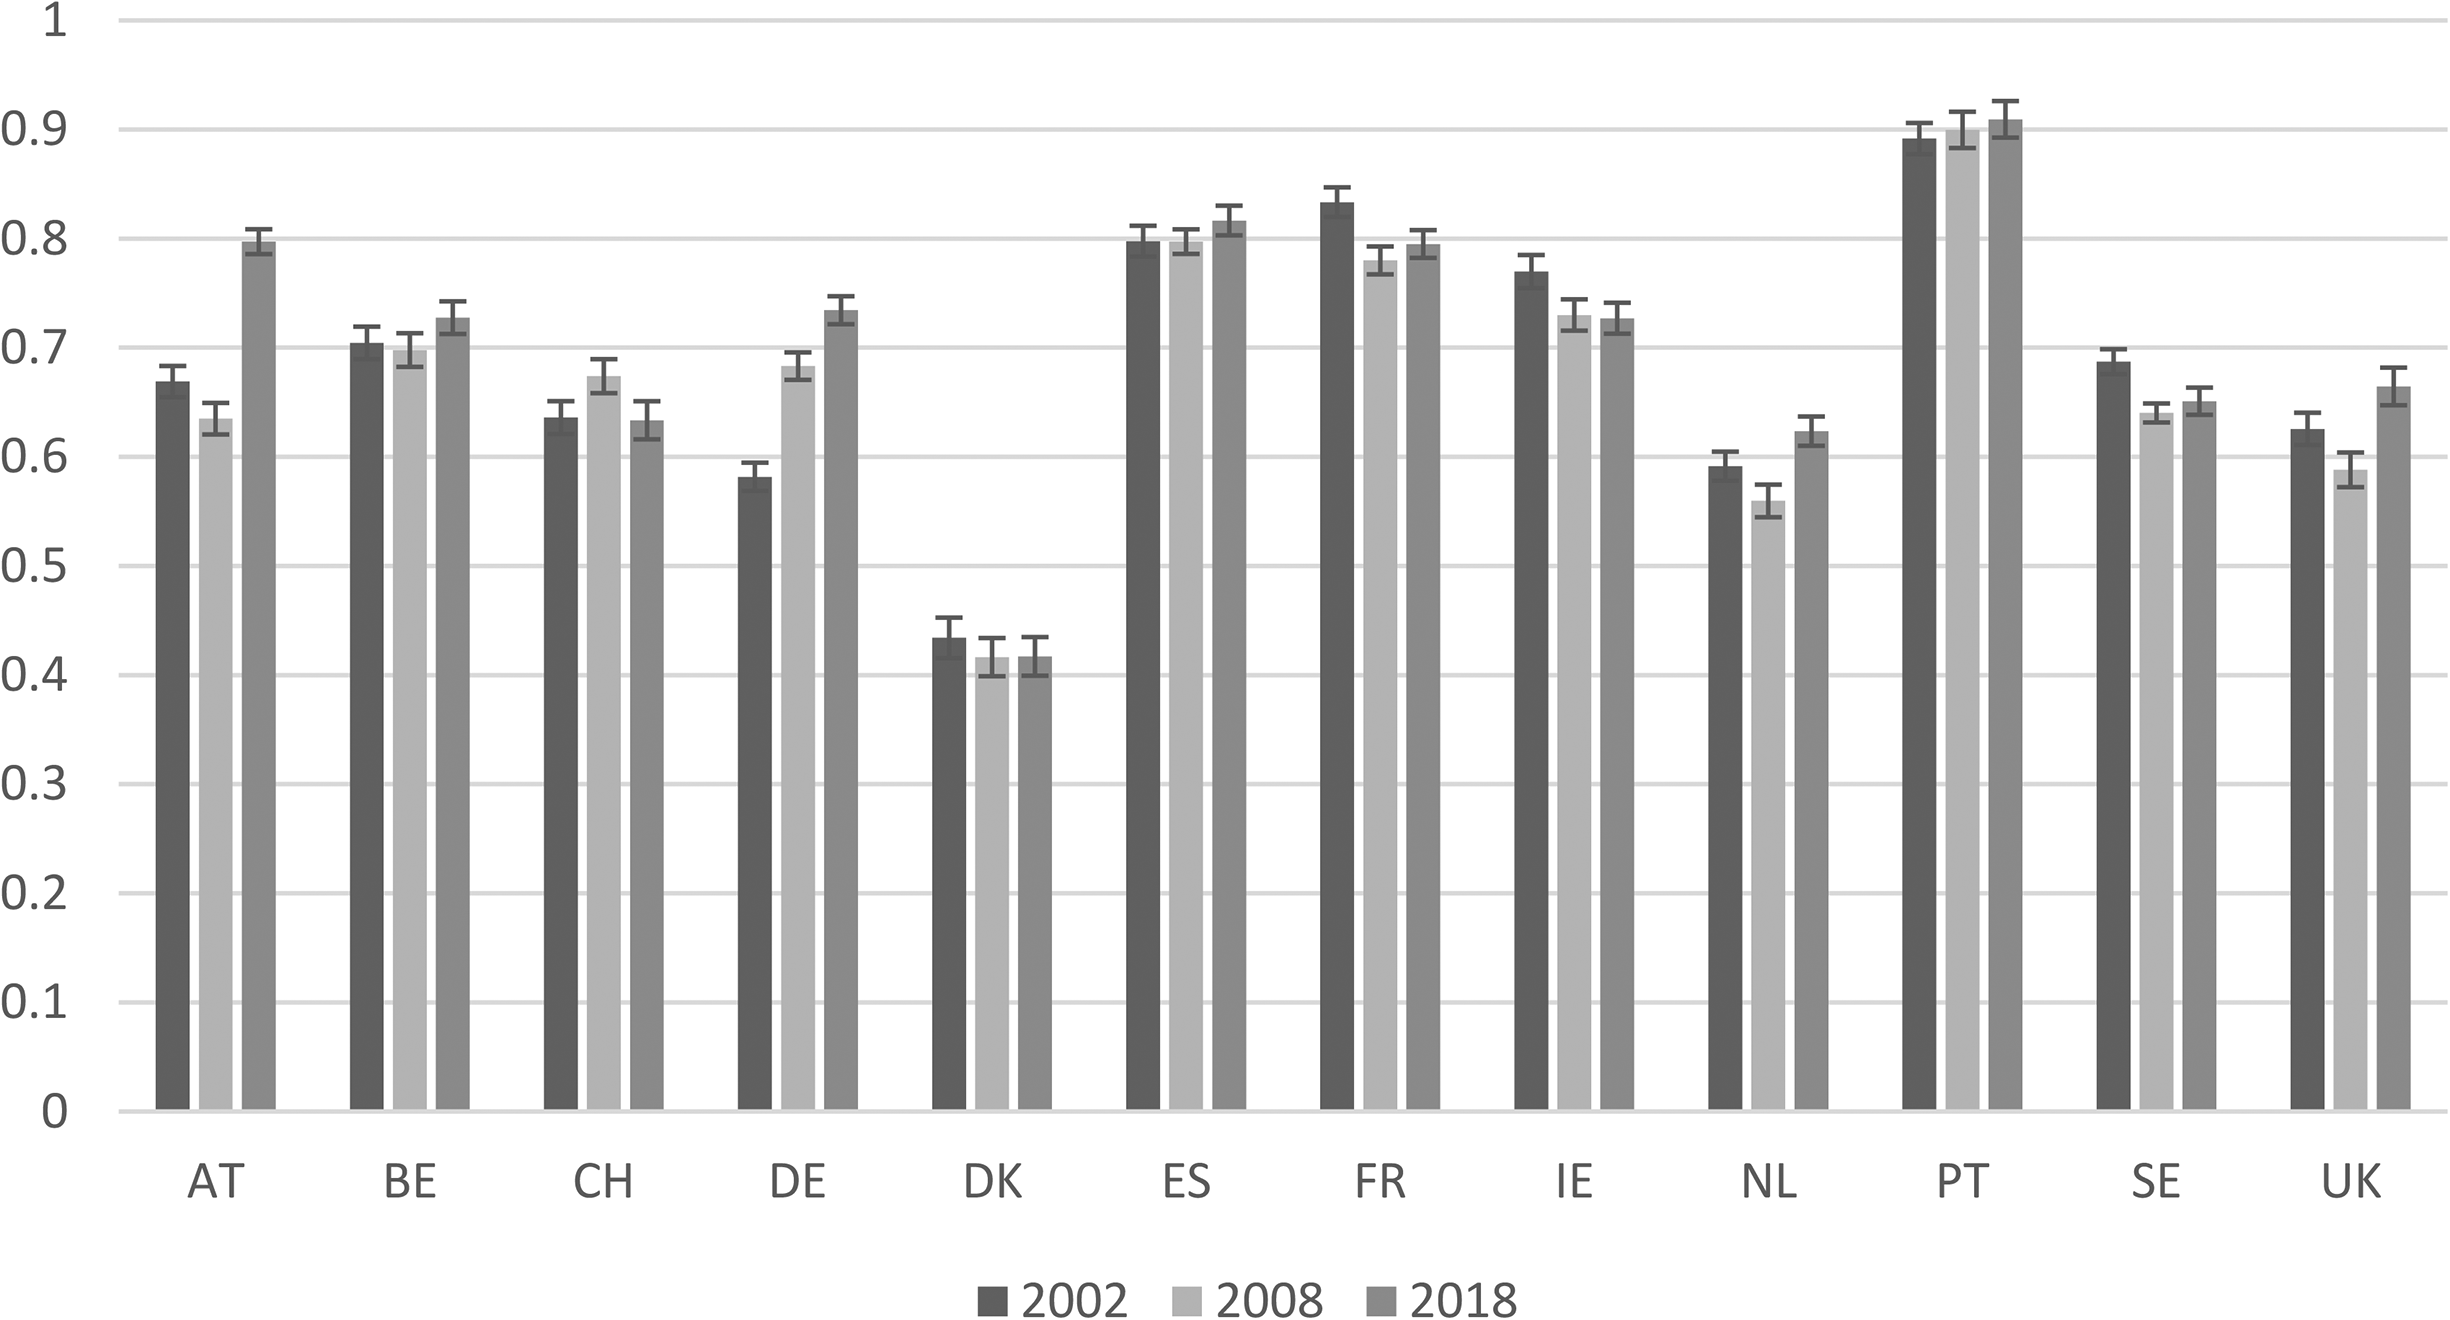
Share of ESS respondents who agree or strongly agree that the government should take measures to reduce income differences, 2002–18.
The apparent stability of demand for redistribution in the face of rising inequality has motivated scholars to explore subjective perceptions of inequality. The Meltzer-Richard model assumes that low- and middle-income individuals know where they are in the income distribution and that they accurately perceive changes in the income distribution, hence recognize that they stand to gain more from redistribution as (top-end) inequality rises. Research on perceptions of inequality teaches us that these assumptions do not necessarily hold. 5 Specifically, two persistent biases uncovered by this research might plausibly explain the stability of demand for redistribution in the face of rising inequality: people tend to underestimate the extent of inequality in their country, and they tend to think that they are closer to the median than they actually are.
Scholarship with a “subjectivist” bent also emphasizes fairness assessments as a critical link between perceptions of inequality and demand for redistribution. “Inequality aversion” is often invoked to explain support for redistribution among affluent citizens. 6 More relevant for our present purposes, low- and middle-income citizens who correctly perceive the income distribution and their own place in it may well consider income differences to be fair rewards for hard work and talent. The idea that people want to believe that they live in a just world and adjust their perceptions of what constitutes fair rewards as inequality rises features prominently in this strand of the literature on preferences for redistribution. 7 As emphasized by Cavaillé in 2023, fairness considerations pertain to redistribution as well as inequality: people who accurately perceive inequality and consider large income differences to be unfair may oppose universalistic policies with redistributive implications because such policies benefit people deemed to be undeserving of public support (e.g., recently arrived immigrants). 8 As support for redistribution supposes that citizens consider government to be trustworthy and competent, rising distrust in public authorities might also be invoked to explain why rising inequality has not been accompanied by increased support for redistribution as measured by the standard ISSP/ESS question.
We do not wish to dismiss the relevance of subjective perceptions and fairness assessments, but we want to suggest, in the same spirit as Rueda and Stegmueller, 9 that objective conditions still matter to preferences for redistribution. Observational studies consistently find that support for redistribution, as measured by the standard ISSP/ESS question, falls with respondents’ relative income. It is difficult to see how this persistent finding would come about if people were completely confused about their place in the income distribution. It also deserves to be noted that affluent survey respondents are more likely to consider perceived inequality as fair, suggesting that fairness judgments are not entirely independent of self-interest. 10
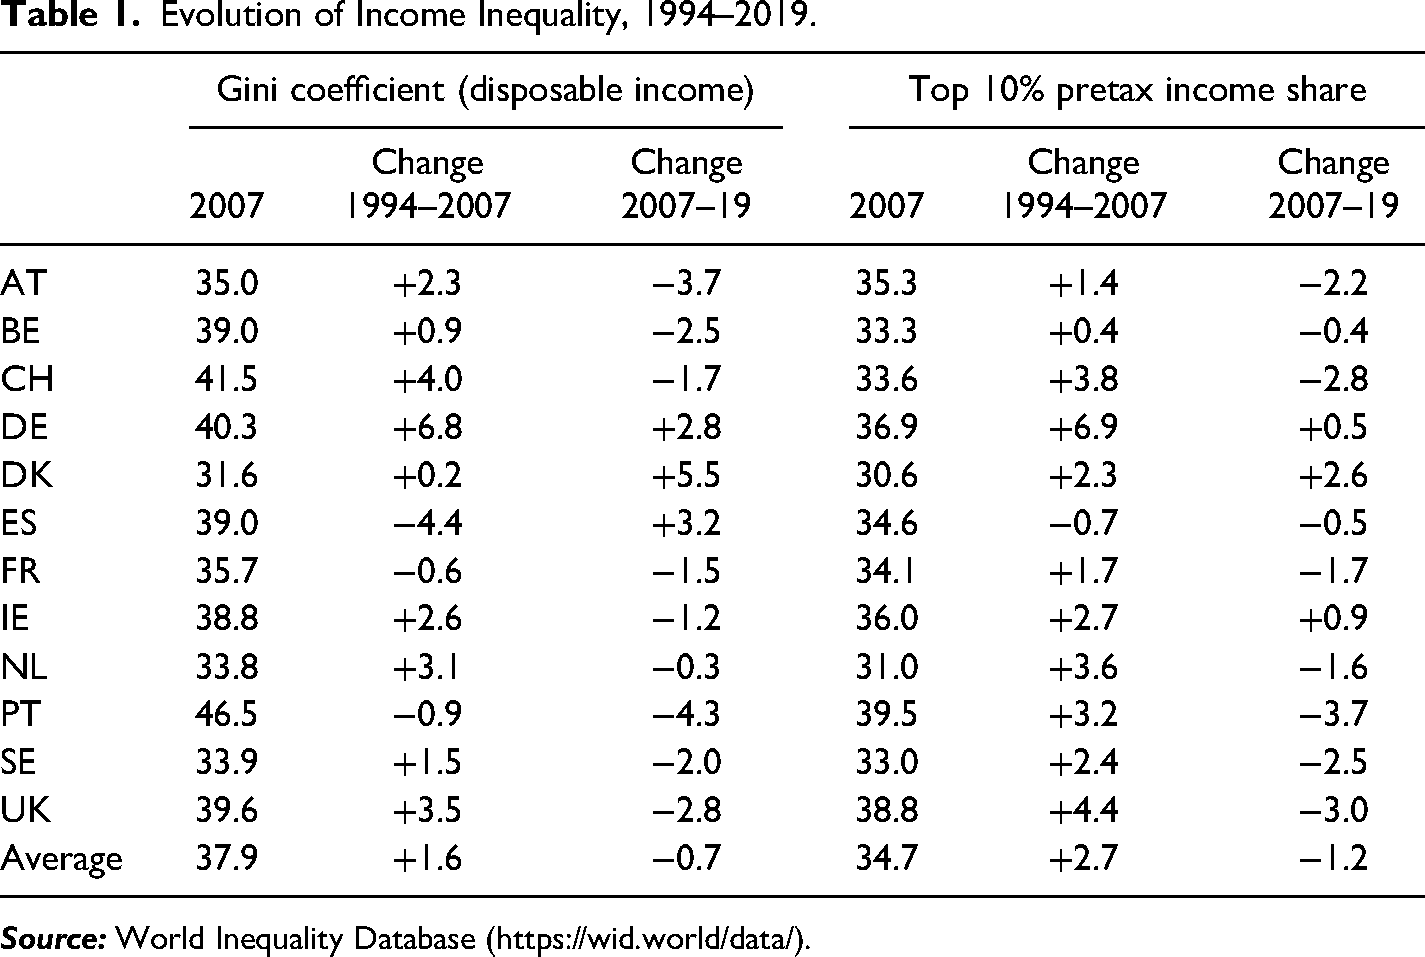
The common framing of the “subjectivist turn” in terms of citizens failing to respond to ever-rising inequality also needs to be qualified. As shown in Table 1, top 10 percent income shares and Gini coefficients for disposable household income increased significantly in most West European countries in the period leading up to the financial crisis of 2007–8. However, the story is quite different for the postcrisis period. From 2007 to 2019, the top 10 percent income share increased by more than 1 percentage point in only one country (Denmark) and declined by more than 1 percentage point in seven out of twelve countries. Over the same time period, the Gini coefficient for disposable household inequality increased by more than 1 percentage point in three countries (Denmark, Germany, and Spain) and declined in eight out of twelve countries. 11 To the extent that there is a “demand-side puzzle” to be solved, this is first and foremost a precrisis puzzle. And, as we argue elsewhere, the fact that low- and middle-income households enjoyed fairly robust income growth in the period between the recessions of the early 1990s and the late 2000s provides at least a partial explanation of this puzzle. 12
Evolution of Income Inequality, 1994–2019.
Finally, we want to emphasize the limitations of the standard ISSP/ESS redistribution question, already pointed out by quite a few survey researchers. 13 Many respondents undoubtedly interpret it to be a question about redistribution of income, but the question actually does not specify what kinds of measures governments should take to reduce income differences. “Market liberals” committed to the promotion of equal opportunity as well as leftists committed to tax progressivity ought to—and presumably do—answer the question in the affirmative. The question also seems likely to solicit positive answers on social desirability grounds as disagreement with the statement that the government should take measures to reduce income differences would seem to imply that one likes income inequality. Especially when redistribution support is measured by combining the two positive response options (agree and strongly agree), levels of support are very high and, as a result, there is not much room for redistribution support to change in response to changes in inequality (or income growth). For all of these reasons, the literature on preferences for redistribution needs to move beyond its reliance on the standard ESS question by identifying questions in existing surveys that probe support for specific policies with redistributive implications and by developing new survey instruments along these lines. 14
New Empirics
The European Social Survey of 2008 included a special module on welfare attitudes that asked respondents for their views of alternative designs of income taxation and social insurance provisions with clear implications for redistribution of income. As several of these questions were not included in the 2016 version of the welfare-attitudes module, we replicated them in a cross-national survey fielded in 2019, which we refer to as the Inequality and Politics (IAP) Survey. In what follows, we use data from ESS and the IAP Survey to track changes in support for progressive taxation and redistributive unemployment compensation across the twelve countries included in Figure 1 (and Table 1) above. 15
A few words about the comparability of the two surveys are in order before we proceed. The ESS survey is based on face-to-face interviews with a sample based on strict random probability methods and no quotas. By contrast, the IAP survey was a web-based survey based on an opt-in panel with quotas for region, age, gender, income, and education to ensure that the sample was representative of broader populations. Differences in data collection and sampling methods are bound to affect response rates and response patterns as well as the characteristics of respondents. 16 We also note that the IAP survey included more questions about inequality and redistribution than the ESS 2008 survey, possibly priming respondents to express egalitarian values. (On the other hand, we would expect social desirability to be a more relevant factor in the face-to-face setting of the ESS.)
To allay some of these concerns, we show in Appendix 1 that cross-national differences in responses to three questions that appeared in the ESS of 2018 and the IAP survey are closely correlated and that responses are quite similar in terms of absolute levels. (All appendixes are online only.) Most importantly for our purposes, the correlation between the percentages of respondents agreeing with the statement in the standard redistribution question in ESS 2018 and the IAP survey is .946 (p < .001), while the cross-country average is practically the same (70.8 percent in ESS 2018 and 71.6 percent in the IAP survey). Substituting IAP observations for the ESS 2018 observations in Figure 1 does not change the picture of overall support for redistribution being consistently stable over the period from 2008 to the late 2010s.
Starting with income taxation, the ESS 2008 question that we replicated in our survey reads as follows: “Think of two people, one earning twice as much as the other. Which of the three statements comes closest to how you think they should be taxed? (1) Pay same share of earnings in tax; (2) Higher earner pay a higher share of earnings in tax; or (3) Pay same amount of money in tax.” With support for redistributive taxation measured by the percentage of respondents who think that higher earners should pay a higher share of their earnings in taxes, Figure 2 displays aggregate support by country in 2008 and 2019. 17
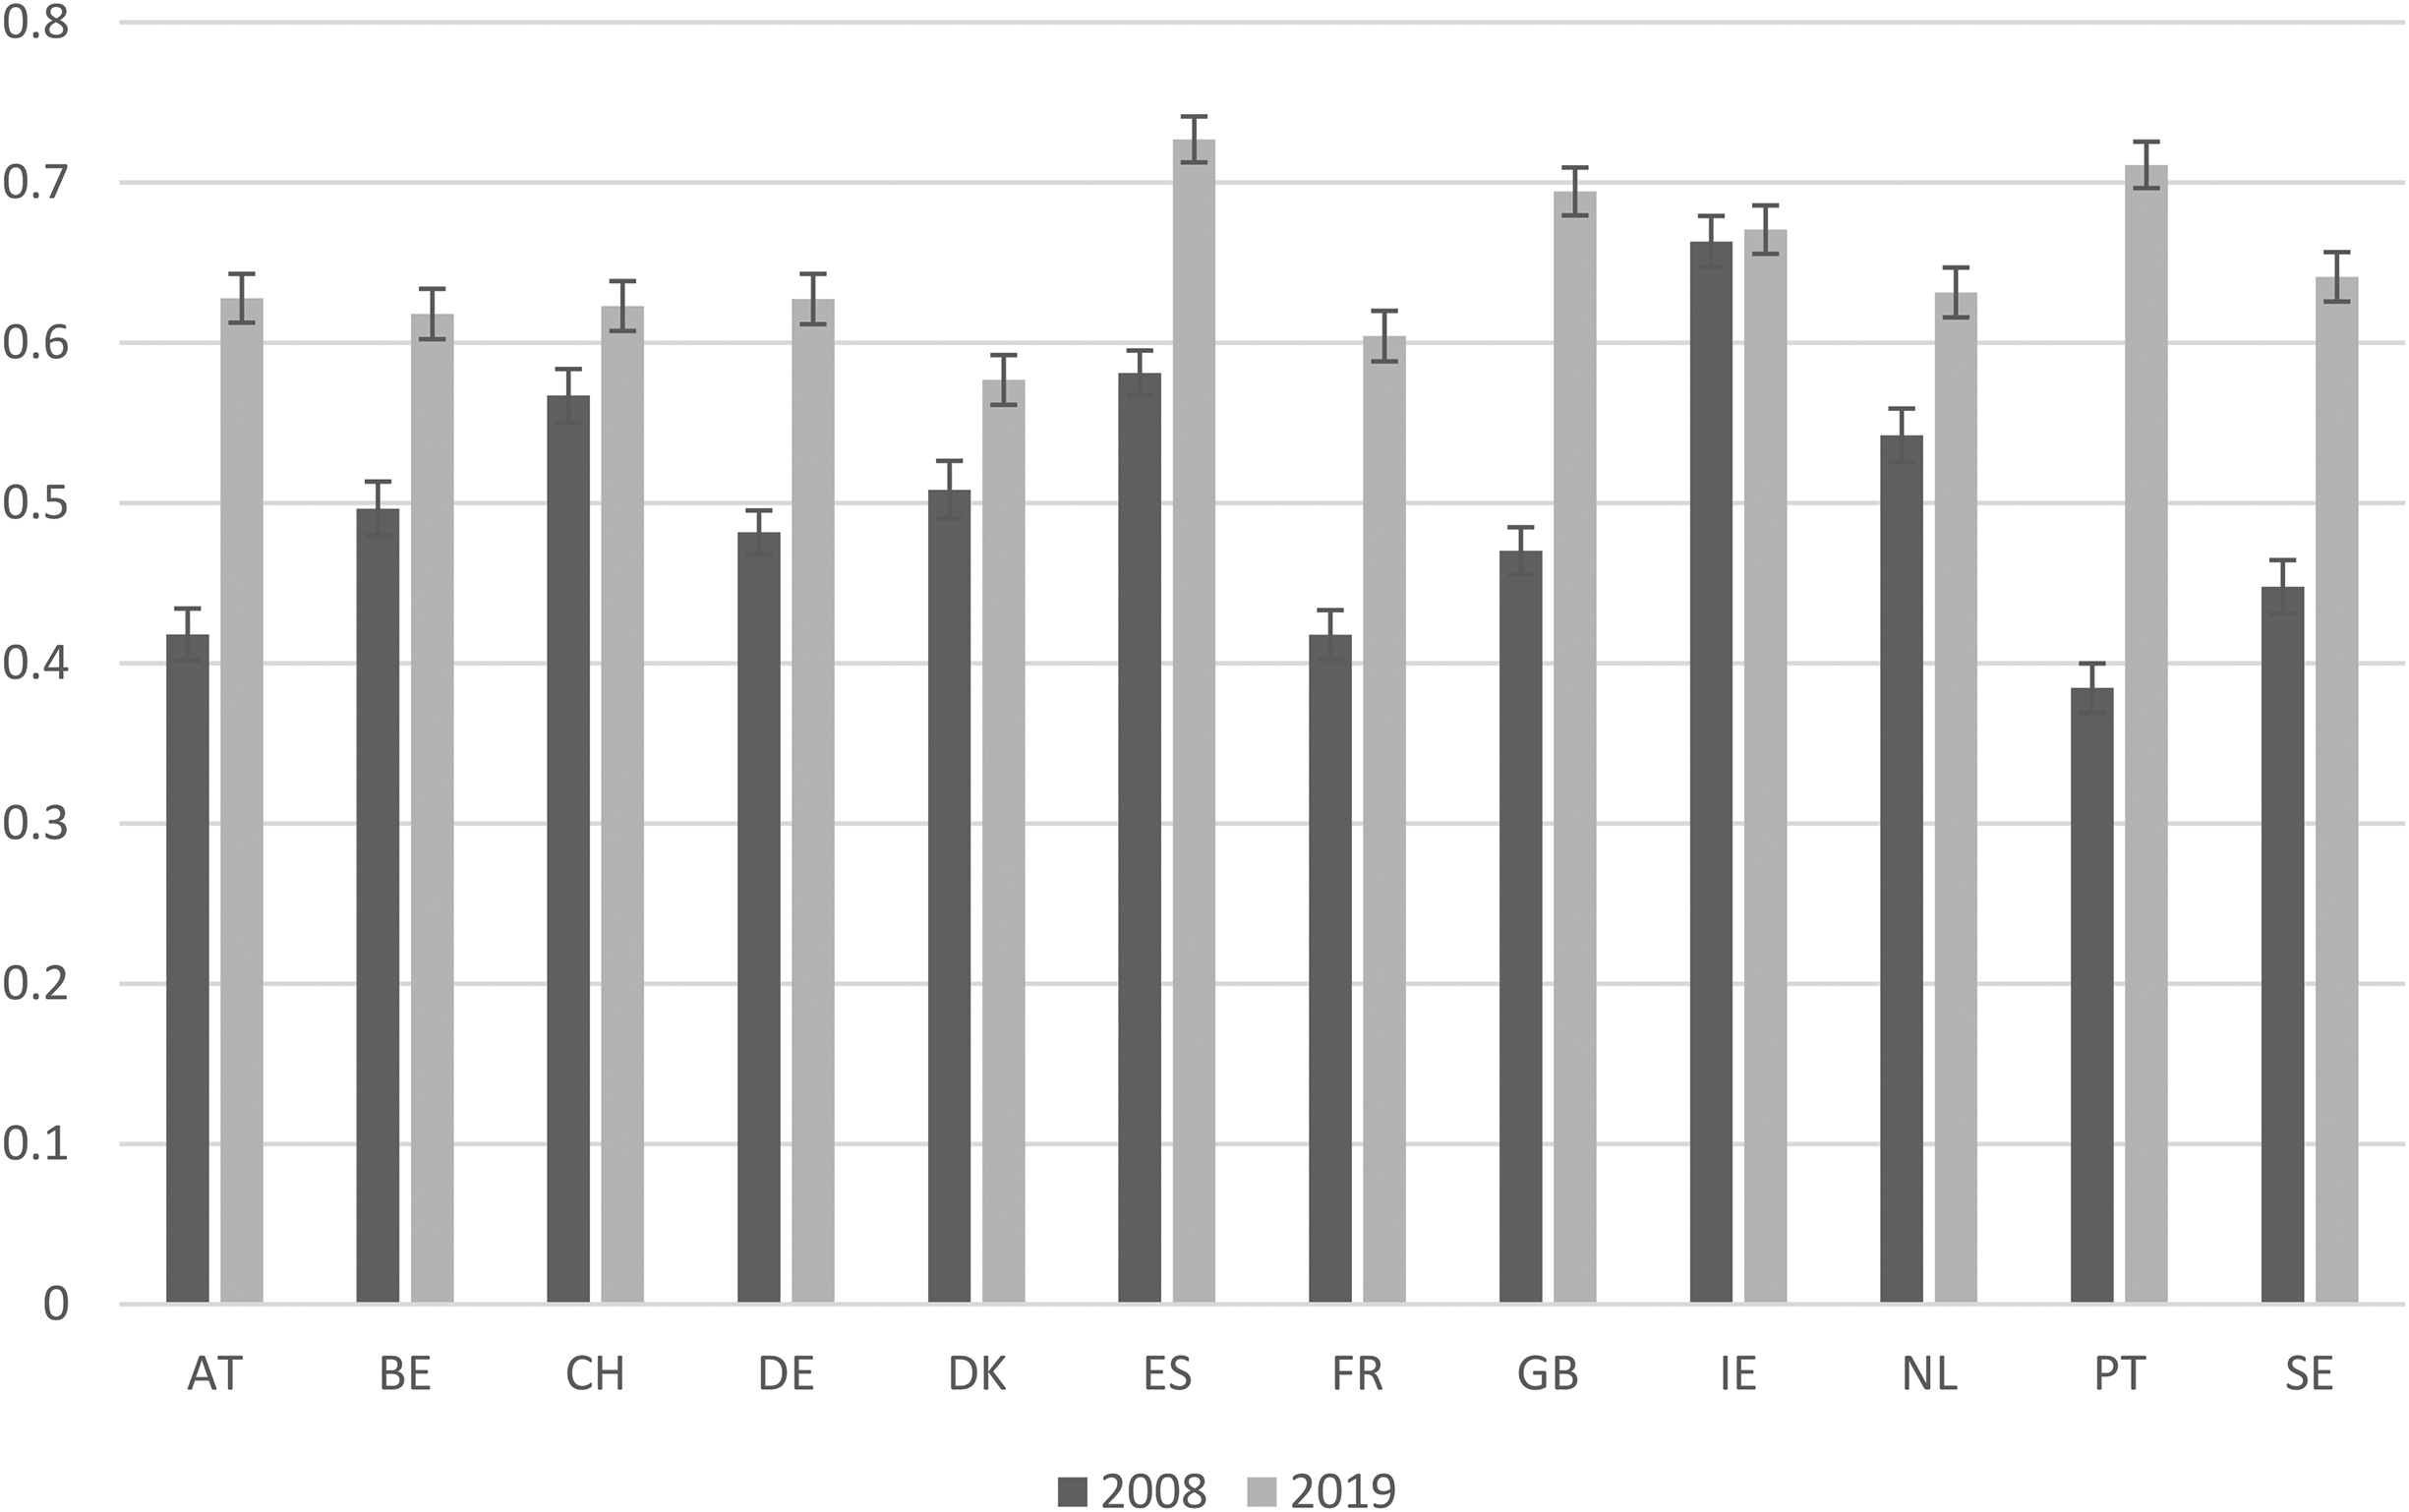
Share of ESS/IAP respondents who support income-tax progressivity, 2008 and 2019. Sources: ESS and IAP.
In contrast to the stability of overall support for redistribution shown in Figure 1, Figure 2 shows a uniform and quite dramatic shift of public opinion in favor of redistributive income taxation. This shift easily clears the 95 percent threshold of statistical significance in all but one of the twelve countries. The one exception, Ireland, stands out as the country with the highest level of support for tax progressivity in 2008. As measured here, support for redistributive income taxation increased by 5–10 percentage points in Switzerland, Denmark, and the Netherlands; by 18 points in Sweden; 21 points in Austria; 22 points in Great Britain; and by a whopping 33 points in Portugal. Averaging across the twelve countries, the percentage of respondents supporting the proposition that the tax rate should rise with income increased from 49.8 percent in 2008 to 64.6 percent in 2019.
For subsets of the countries included in Figure 2, ISSP surveys provide for somewhat different assessments of changes in support for progressive taxation. As we document and discuss in Appendix 2, ISSP surveys fielded in 2009 and 2019 asked respondents whether “high-income earners” should pay a larger share of their income in taxes than “low-income earners.” Across seven West European countries included in both surveys, the percentage of respondents who answered this question in the affirmative in 2009 was consistently much higher than the percentage of ESS respondents who supported progressive income taxation in 2008. We observe only small changes in response to the ISSP question from 2009 to 2019, but these changes actually turn out to be correlated, cross-nationally, with the large changes reported in Figure 2. On the other hand, we observe large changes from 2006 to 2016 in the percentage of ISSP respondents who thought that high-income earners paid too little and low-income earners paid too much in taxes in four out of seven countries, but changes in support for progressive taxation measured in this manner are less closely correlated with our ESS/IAP-based estimates. 18
These discrepancies can partly be explained by the timing of initial observations, relative to the financial crisis of 2007–8 and the ensuing recession, but they also point to the importance of the wording of surveys questions. In particular, the ISSP question asked in 2009 and 2019 primes respondents to think about taxation of people at (or near) the top of the income distribution while the ESS question does not. Public policy preferences are fluid and malleable. 19 The estimates of support for progressive taxation presented in Figure 2 are by no means definitive, but there is no obvious reason to prefer the 2009 ISSP question about relative tax burdens over the 2008 ESS question. The “truth” about public support for tax progressivity probably resides somewhere between the story suggested by 2009–19 ISSP data—broad and persistent support for progressive taxation—and the story suggested by ESS and IAP data—support for progressive taxation rising sharply from relatively moderate levels in 2008. The discussion of the relationship between public opinion and policy shifts that follows does not depend on one or the other of these stories being the correct one.
Turning to unemployment compensation, the IAP survey replicated two questions asked in ESS 2008. Similar to the question about the structure of taxation, one of these questions pertains to the relationship between earnings from employment and unemployment benefits. The wording of the question is as follows: “Some people say that high earners should get more benefits when they are temporarily unemployed because they paid more in tax, whilst others think that lower earners should get more because they are in greater need. Which of the three statements comes closest to your view?” Respondents are then presented with the following three statements: (1) “higher earners who become unemployed temporarily should get more in benefit”; (2) “high and low earners should get the same amount of benefit”; and (3) “lower earners who become unemployed temporarily should get more in benefit.” Combining respondents who chose the second or third statement as the statement closest to their own view yields a measure of opposition to the principle that benefits be proportional to income (as they would be in a private insurance scheme).
The comparative welfare-state literature teaches us that earnings-related social benefits tend be more generous than flat-rate and means-tested benefits. The standard explanation for this regularity is that earnings differentiation renders middle- and high-income citizens more willing to fund social insurance and thereby allow for more generous average benefits. 20 We would not want to interpret a shift against the proportionality principle as a shift in favor of redistribution if the individuals who make this shift also shift in favor of less generous unemployment benefits. To address this potential complication, we rely on another question fielded in the IAP survey as well as ESS 2008, asking respondents to indicate whether they think that it should be the responsibility of the government to ensure a “reasonable standard of living for the unemployed” on a scale from 0 (“not government's responsibility at all”) to 10 (“entirely government's responsibility”). Previous studies treat responses to this question as indicative of support for generous public unemployment benefits. 21 In line with this reasoning, we propose to measure support for redistributive unemployment compensation as the percentage of survey respondents who prefer a benefits structure favoring low-wage workers and place themselves above a minimum threshold on the question about government responsibility. Figure 3 shows the estimates that we obtain when we set the minimum threshold at 6 (a response that corresponds to or exceeds the average 2008 response in all twelve countries). 22
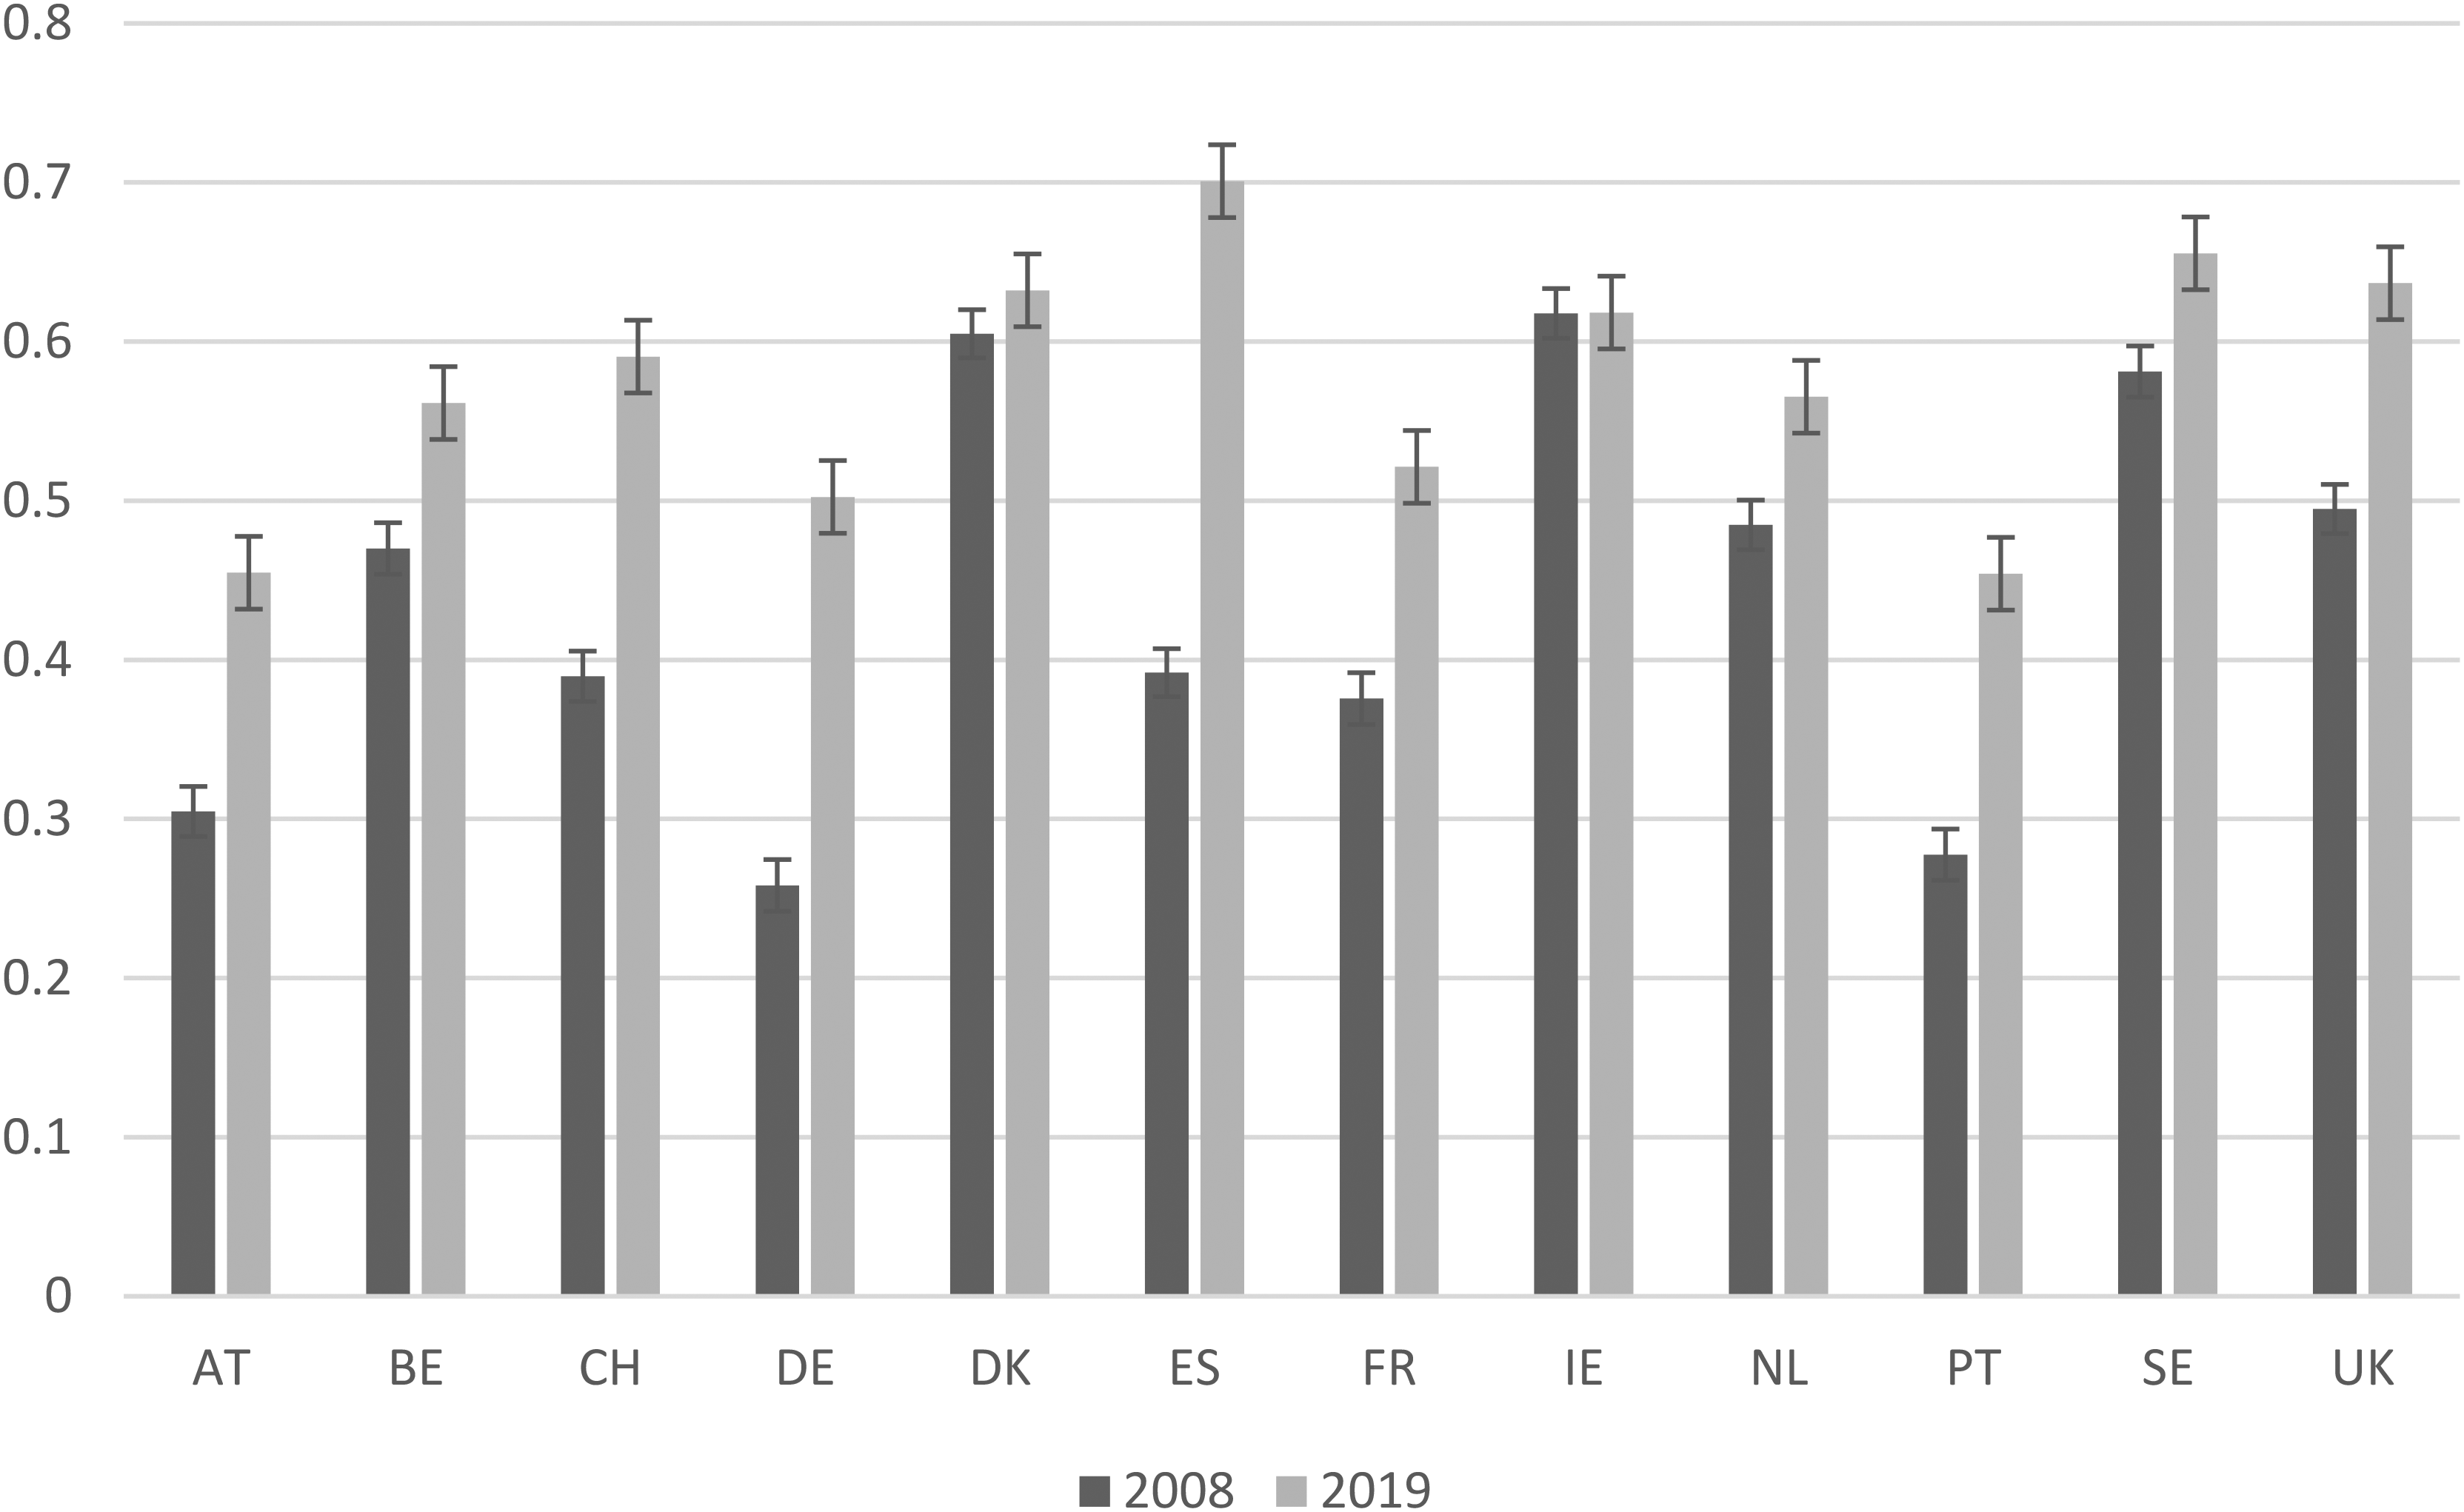
Share of ESS/IAP respondents who support redistributive unemployment compensation, 2008 and 2019. Sources: ESS and IAP.
We observe significant increases in the percentage of citizens who support redistributive unemployment compensation in ten countries. The exceptions are Denmark and Ireland, where such support was high to begin with. The increases are very substantial in Germany, Spain, Portugal, and Austria. Operationalized in this manner, average support for redistributive unemployment compensation across the twelve countries increased from 42.5 percent in 2008 to 57.4 percent in 2019. Such a shift seems quite plausible against the backdrop of sharp increases in unemployment in 2007–10 and persistently high levels of unemployment in many countries through the mid-2010s. Our findings in this regard dovetail with Marquis and Rosset's observation, based on Eurobarometer data, that the Great Recession triggered a broad change in explanations of poverty among European publics, with the share of respondents attributing poverty to “societal injustice,” as distinct from laziness or bad luck, increasing in almost all countries, often by more than 10 percentage points. 23
From the perspective of the literature on preferences for redistribution as well as the literature on unequal policy responsiveness (to be discussed below), the obvious question that arises is whether the public opinion shifts documented in Figures 2 and 3 are common to all income groups. We address this question by estimating linear probability models, pooling individual-level ESS/IAP data for all twelve countries and interacting a dummy for 2019 with dummies for the income quintiles to which respondents belong. 24 Figure 4 shows the results of this exercise for the first, third, and fifth quintiles. Black dots are our estimates of support for redistributive policies for 2008, and gray dots our estimates for 2019. Generalizing across the twelve countries, low-income citizens (Q1) were about 10 percentage points more likely than high-income citizens (Q5) to support redistributive taxation as well as redistributive unemployment compensation in 2008. Q5 support for redistributive taxation increased slightly more than Q1 support from 2008 to 2019. By contrast, the increase in Q5 support for redistributive unemployment compensation was half as big as the increase in Q1 support (and not statistically significant at the 95 percent level). In other words, affluent citizens appear to have become willing to shoulder a larger share of the tax burden but remain strongly committed to the idea that unemployment benefits should be proportional to earnings. By contrast, the preferences of low- and middle-income citizens seem to have shifted in favor of redistributive unemployment compensation as well as tax progressivity.
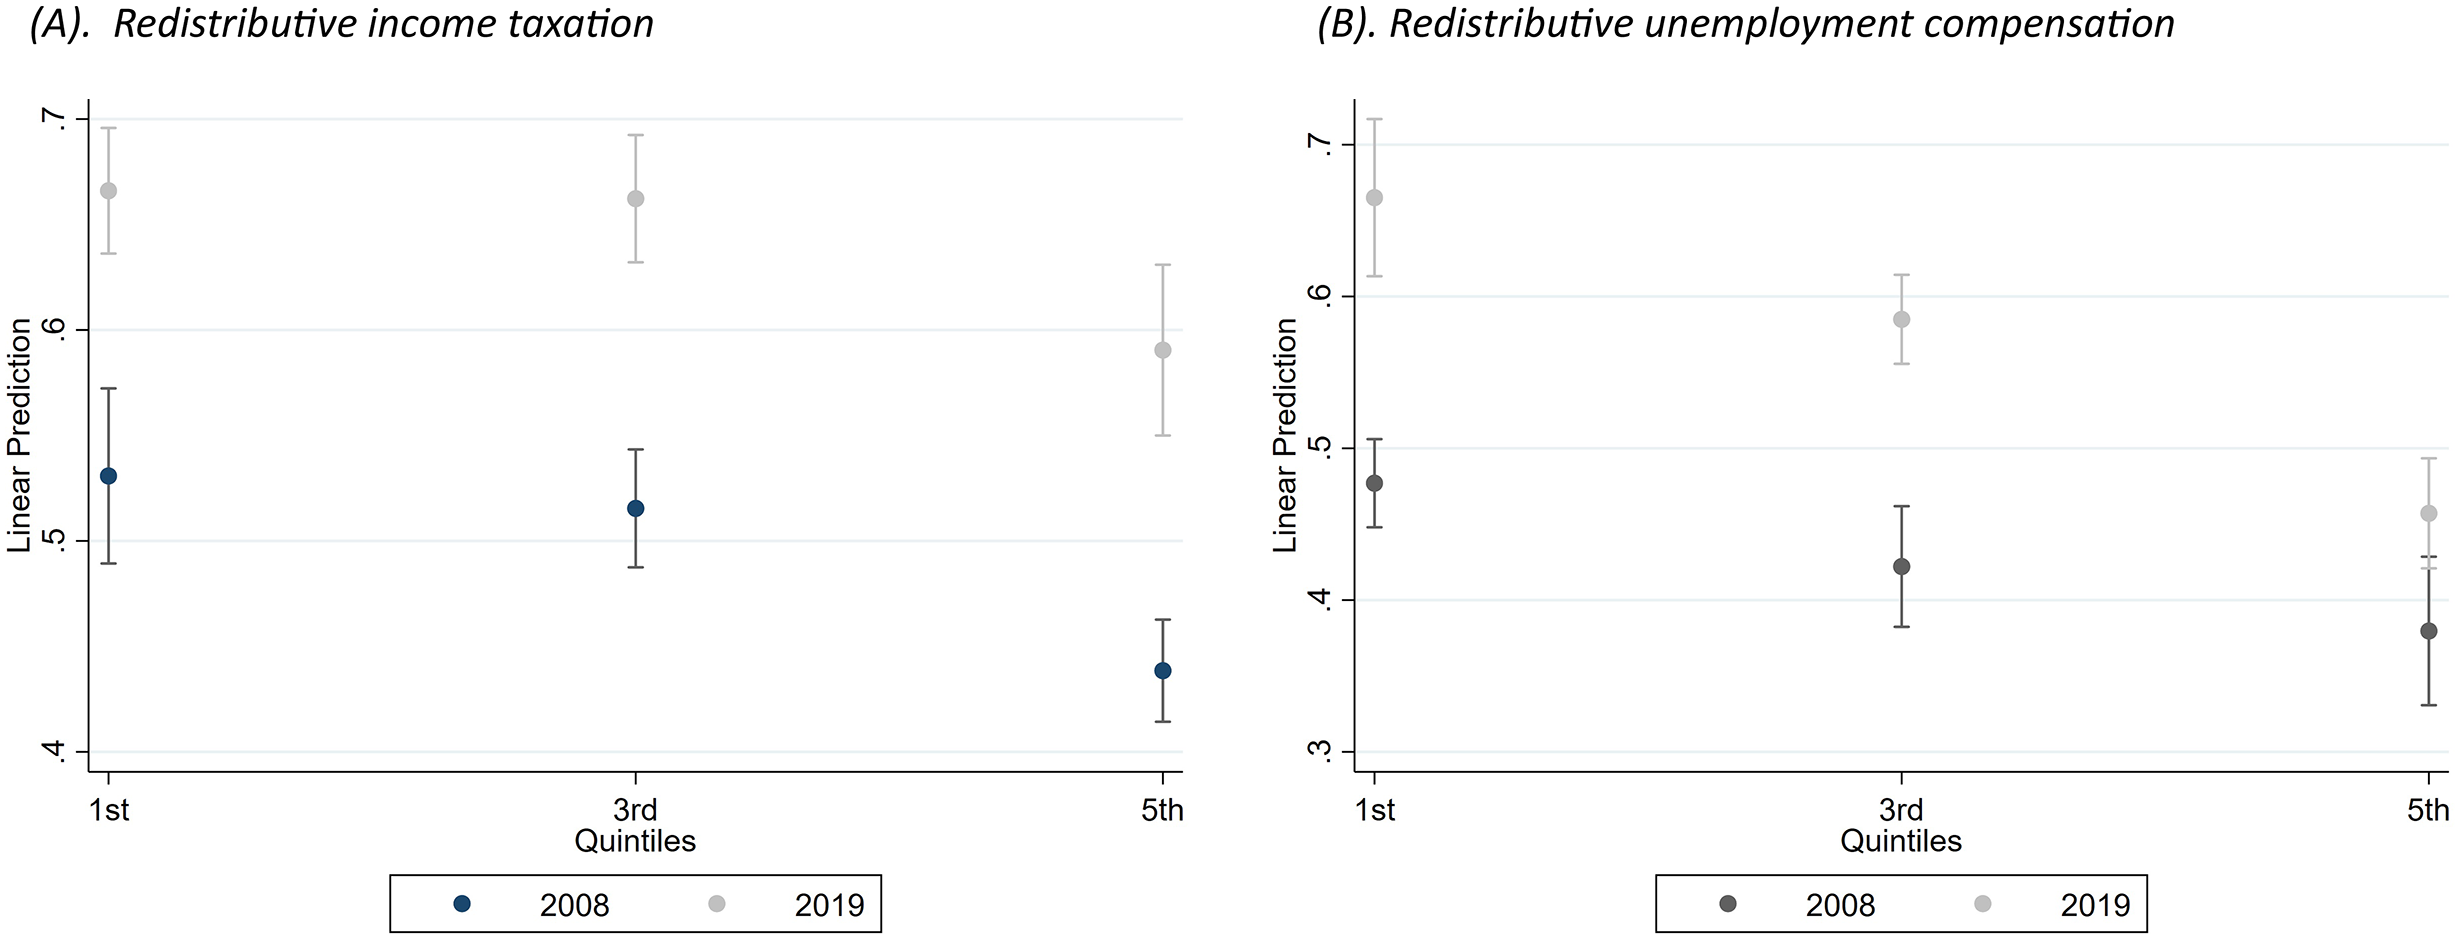
Predicted probabilities of support for redistributive policies by income quintile, 2008 and 2009 (twelve countries pooled). Authors’ elaboration. See Appendix 6 for full regression results.
As income inequality held steady or declined in most countries in the decade following the financial crisis of 2007–8 (see Table 1), the public opinion shifts documented here can hardly be construed as a response to contemporaneous increases in inequality, but they might plausibly be seen as a response to the dramatic rise of inequality, especially of top-end inequality, in the ten to fifteen years preceding the financial crisis. Plotting changes in our estimates of support for redistributive policies among low- and middle-income citizens against changes in inequality before or after the crisis does not yield any clear patterns, but levels of inequality in 2007 turn out to be positively associated with changes in support for redistributive policies from 2008 to 2019. The annual growth rate of GDP per capita from 2007 to 2018 also turns out to be associated, negatively, with growing support for tax progressivity and redistributive unemployment compensation. In simple ordinary least squares models, the top 10 percent income share in 2007 and GDP growth are significant predictors of public opinion changes in both domains, and the Gini coefficient for disposable household income is a significant predictor of changes in support for redistributive unemployment compensation (see Appendix 8). Based on only twelve observations, these results must obviously be taken with a grain of salt, but they do suggest that support for redistributive policies has increased more in countries characterized by high levels of inequality and in countries experiencing slow economic growth.
Although we cannot identify when policy preferences changed in the period from 2008 to 2019, arguments and evidence presented by a number of authors suggest that the financial crisis of 2007–8 and the ensuing recession triggered the opinion shifts that we have uncovered. 25 The implications for the literature on preferences for redistribution would seem to be important: rather than assuming that people incrementally update their perceptions of inequality, fairness assessments, and policy preferences, this literature should pay more attention to moments in time when attitudes across these three dimensions shift.
Part 2: Policy Responsiveness
State of the Literature
More than any other scholarly work on the topic, Gilens's study of policy responsiveness in the United States has stimulated research and debate on income (and class) biases in democratic representation. 26 Sorting survey respondents by relative income and estimating the probability of policy change based on survey items soliciting support for specific reform proposals, Gilens finds that the preferences of high-income citizens predict policy change, but the preferences of low-income and even middle-income citizens have no influence on policy outcomes when they diverge from the preferences of high-income citizens. It is tempting to suppose that the income biases documented by Gilens are unique to the United States, with its exceptionally unequal distribution of income and institutions that allow for money to play such an outsized role in the electoral process. However, recent studies replicating his research design find strikingly similar patterns in a number of West European countries, including Germany, Norway, the Netherlands, and Sweden. 27 Pooling some three thousand survey items from thirty countries over the period 1978–2017, Persson and Sundell implement Gilens's approach on a larger scale and also find that governments are, on average, more responsive to the policy preferences of affluent citizens than to the policy preferences of low- and middle-income citizens. 28 Further evidence of unequal policy responsiveness being a ubiquitous feature of liberal democracies is provided by Bartels, by Elkjaer, and by Schakel and coauthors, all of whom analyze how government spending relates to the spending preferences of different income groups. 29
Studies implementing Gilens's research design suggest that policy responsiveness is more biased in favor of affluent citizens in Germany, Sweden, and the Netherlands than in the United States. 30 Be that as it may, the ubiquity of unequal responsiveness calls into question the standard explanations invoked by students of American politics. Turnout in elections is not perfectly equal across income groups, money certainly has some influence on electoral campaigns and outcomes and corporate lobbying happens in Northwestern Europe as well as the United States, but if these were the key sources of income bias, then income bias should surely be less pronounced in Sweden and the Netherlands than in the United States. With the literature taking a comparative turn, the occupational (class) background of elected politicians seems to have emerged as the most prominent explanation of unequal policy responsiveness. Although national legislators in other OECD countries are not nearly as rich as members of the US Congress, they are overwhelmingly university-educated and typically come from upper-middle-class backgrounds. 31
The apparent ubiquity of unequal responsiveness raises questions about the Gilens approach as it has been applied to date. As noted by the authors of Gilens-inspired studies as well as their critics, an obvious limitation of these studies is that they pool a wide range of survey items and lack any information about the salience of different policy proposals for respondents. In other words, these studies cannot rule out the possibility that low- and middle-income citizens lose out to affluent citizens on issues that are not terribly important to them but get their way on a few critical issues. (Studies that measure policy responsiveness by government spending are arguably less vulnerable in this respect.)
The literature on unequal responsiveness is also vulnerable to objections based on reverse causality or, more broadly, endogeneity. Along these lines, Joosten argues that affluent citizens are more knowledgeable about politics, anticipate policy decisions that are about to be taken, and adjust their policy preferences to conform with those decisions. 32 In Joosten's formulation, the Gilens approach tells us more about “unequal adaptation” by citizens than about “unequal responsiveness” by policymakers. In a similar vein, Elkjaer and Iversen (2020) argue that affluent citizens and political elites alike (and independently of each other) become more favorable toward government spending during economic downturns while this is not the case for low- and middle-income citizens, who lack the information (or sophistication) necessary to be “New Keynesians.” 33 Over the long run, however, policy decisions reflect the interests of the middle class according Elkjaer and Iversen.
Most importantly, in our view, the results of applying the Gilens approach to European cases are truly puzzling from the perspective of the comparative literature on welfare states and redistribution, for the latter literature documents that the combined effects of taxes and income transfers are much more redistributive in Northwest Europe, especially Scandinavia, than in the United States. If the pro-affluent bias in policy responsiveness is indeed as big in these countries as it is in the United States, how could it possibly be that their tax-transfer systems are so much more redistributive? The answer to this question might be that tax-transfer systems were established in an era when (for example) Swedish policymaking was more equally responsive than American policymaking and that Sweden has become more like the United States in this regard in recent years. The paucity of appropriate survey data going back to the postwar decades makes it difficult to assess, in the Gilens manner, whether policy responsiveness has changed over time. However, Mathisen and coauthors generate tentative evidence in support of this line of argumentation by pooling data for Germany, the Netherlands, Norway, and Sweden from 1970s to the 2010s. 34 These authors distinguish between survey items pertaining to social and economic policies (i.e., policies with distributive implications) and survey items pertaining to other issues. They also distinguish between Left- and Right-leaning governments and between the period before 1998 and the period after 1998. Their results suggest that government policy has always been biased in favor of affluent citizens on “other issues” and that this holds for Left as well as Right governments. In the domain of redistributive issues, however, Left governments were equally responsive to the poor and the affluent in the pre-1998 period, but Left and Right governments alike were more responsive to affluent citizens (relative to middle-income as well as poor citizens) in the post-1998 period. 35 To the extent that the political influence of low- and middle-income citizens has declined, this development arguably has to do with the strategic reorientation of mainstream Left parties and attendant changes in the composition of their activists and candidates for public office as well as their links to trade unions.
It is hard to reconcile the evidence presented by Mathisen and coauthors with the reverse-causality interpretation of unequal-responsiveness studies proposed by Joosten. Why should the affluent (well-educated) anticipate policy changes under some governments but not others and in some policy domains but not others? At the same time, there are good reasons to suppose that citizens across the income distribution retroactively adapt their policy preferences to the status quo, conceived in terms of redistribution as well as inequality. Affluent Swedes may be just as privileged in terms of political influence as affluent Americans are today, but they are less opposed to redistribution than affluent Americans. This is arguably due to the fact that the United States and Sweden inherited very different policy legacies from the postwar era, an era when affluent Swedes were less politically privileged. 36
Elkjaer and Iversen make a welcome contribution by linking redistributive policy to macroeconomic management (a topic to which we shall return), but their effort to explain away the evidence for unequal responsiveness seems problematic on two counts. To begin with, the argument about countercyclical fiscal policy as the basis for congruence between affluent voters and policymakers only applies to policy outputs that involve government spending, as distinct from the structure of taxation or the regulation of immigration and employment protection (let alone “cultural issues”). And even if the spending preferences of affluent citizens are countercyclical while the preferences of less affluent citizens are not, this surely does not mean that there are no differences between the kinds of spending favored by low-income and high-income citizens.
Our understanding of unequal policy responsiveness might be advanced not only by distinguishing between policy domains and time periods but also by adopting a more dynamic perspective. Virtually all the aforementioned studies regress policy outcomes (typically policy adoption conceived as a binary outcome) on measures of the level of support for policy change at different points in the income distribution. Following Stimson and colleagues, the obvious alternative is to ask how policy responds to changes in public policy preferences. 37 In what follows, we briefly illustrate how this perspective might be mobilized to shed light on unequal representation in the domain of distributive politics.
New Empirics
As measured by the standard ISSP/ESS question, support for redistribution did not change much from 2008 to 2019, but our replication of 2008 ESS questions indicates that support for redistributive taxation and unemployment compensation increased in many countries over this period. According to our estimates, high-income citizens moved in favor of redistributive taxation more or less to the same extent as low-income citizens, but preferences pertaining to unemployment compensation became more polarized: low- and middle-income citizens became more supportive of the principle that unemployed low-wage workers should receive better benefits than unemployed high-wage workers (in percentage of their previous earnings), whereas high-income citizens remained strongly supportive of the proportionality principle.
Did government policy move in the same direction as public opinion over the period from 2008 to 2019? The literature on unequal responsiveness would lead us to expect congruence between opinion and policy shifts in the domain of income taxation, but not in the domain of unemployment policy. By contrast, the median-voter perspective would lead us to expect policy shifts with redistributive implications in both policy domains. Although we do not have any comparable observations of policy preferences pre-dating ESS 2008, policy developments before the financial crisis ought to be taken into account, for we would hesitate to attribute policy shifts between 2008 and 2019 to public opinion shifts over the same time period if they represent a continuation of policy developments that precede 2008.
Table 2 presents data from the OECD for two indicators of policy change in the domain of income taxation and two indicators of policy change in the domain of unemployment compensation. Our first indicator of tax policy change involves the statutory top rate of personal income taxation (PIT). It is quite commonplace to treat the top PIT rate itself as a measure of tax progressivity, 38 but this practice is potentially problematic for two reasons: first, readily available data on top PIT rates fail to take tax deductions into account; and, secondly, a high PIT rate on top incomes could simply mean that the rate of income taxation is high across the entire income distribution. In Table 2, we address the latter issue by reporting the top-to-average ratio, that is, the ratio of the (statutory) top PIT rate to the (effective) PIT rate of a single person earning the average wage. Our second, less top-focused, measure of tax progressivity is the ratio of the effective PIT rate at 167 percent of the average wage to the effective PIT rate at 67 percent of the average wage (henceforth the “167/67 ratio”). 39
Indicators of Policy Change, 2000–19.
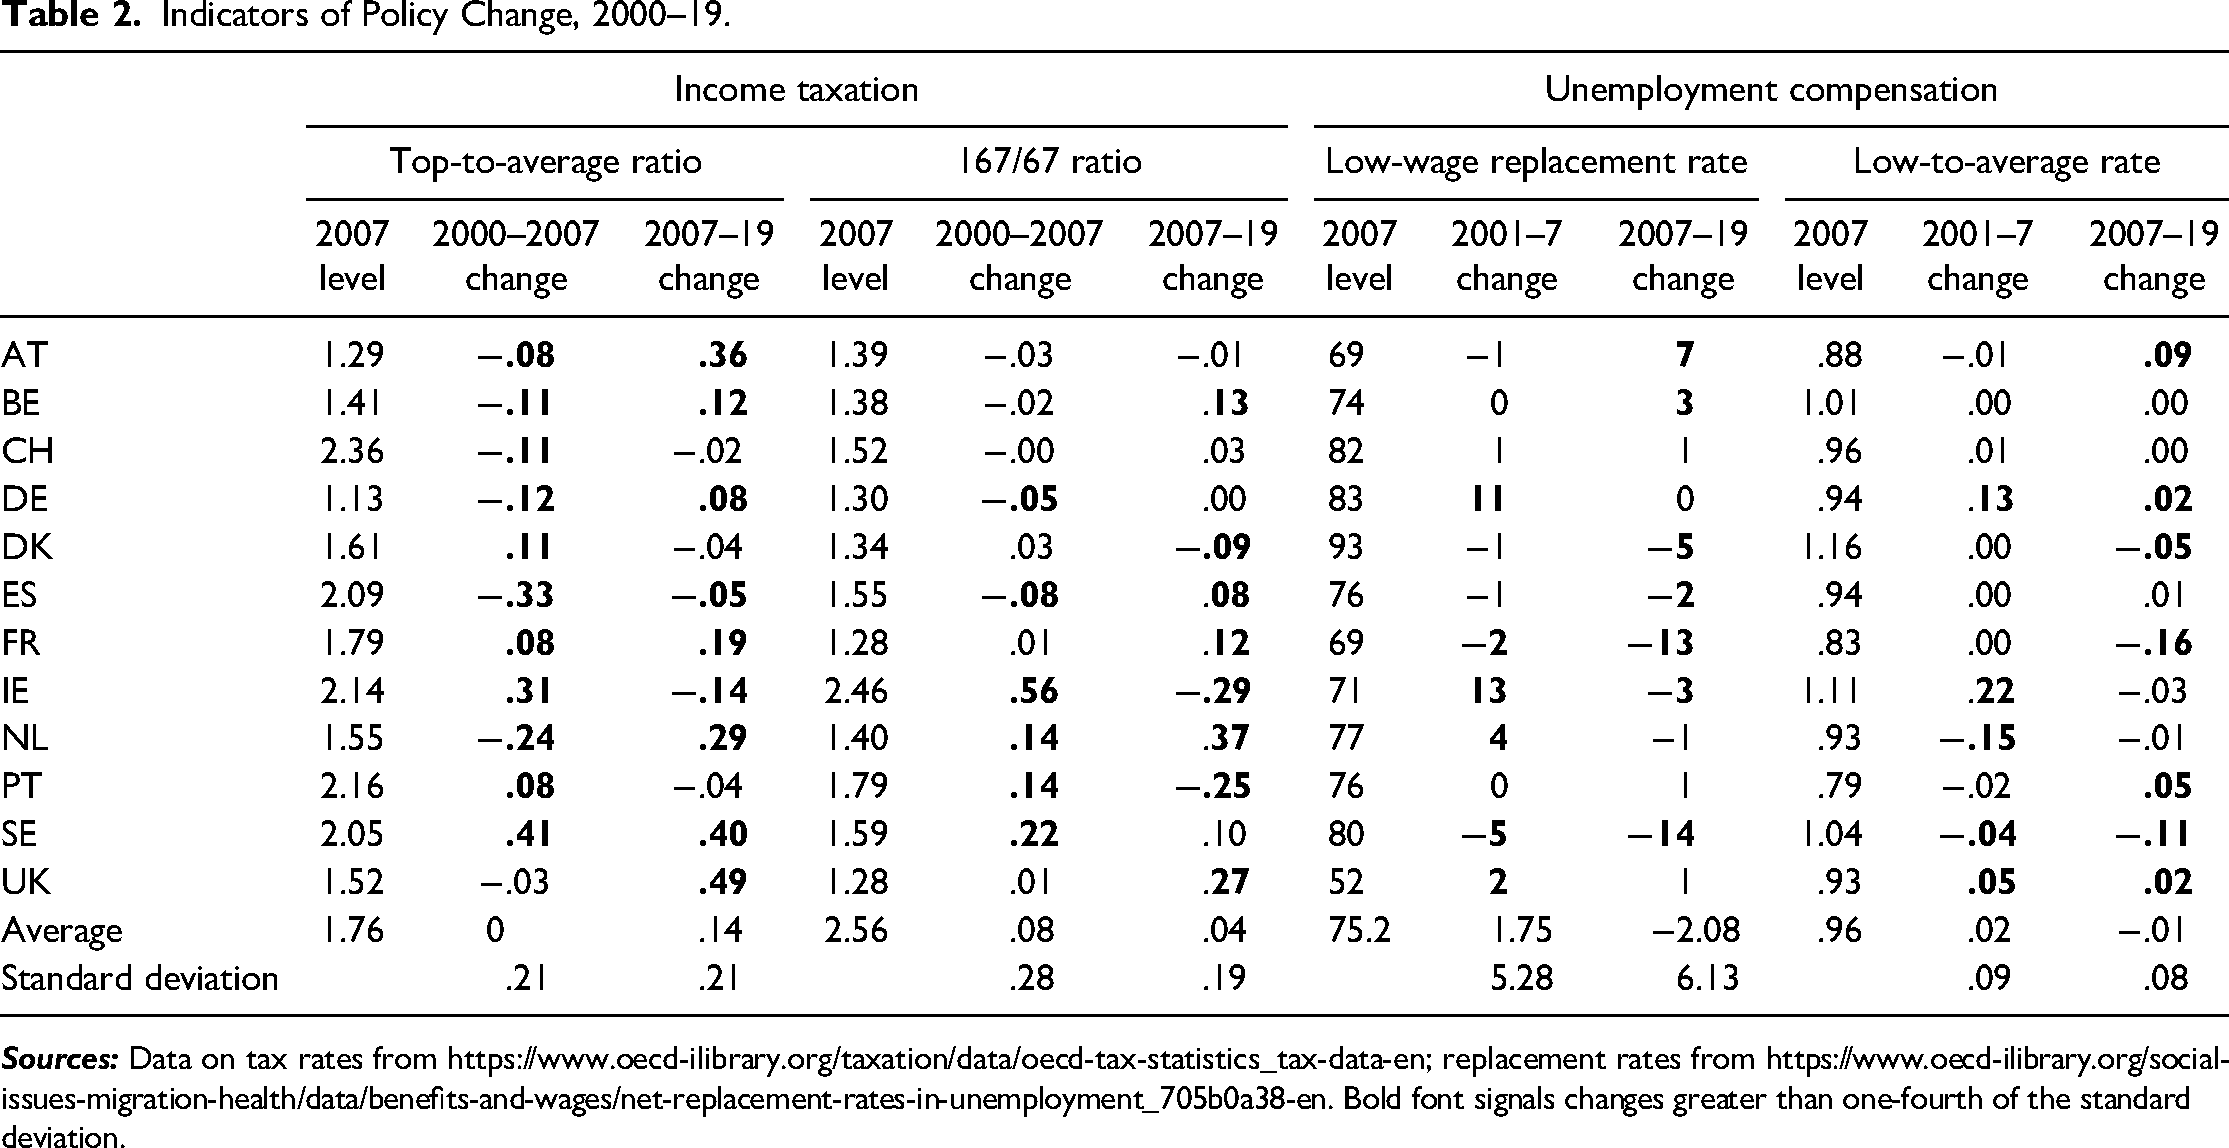
Turning to unemployment compensation, Table 2 first reports OECD estimates of the net (posttax) income replacement provided by unemployment insurance and other cash transfers to a person unemployed for six months, earning 67 percent of the average wage prior to unemployment, with a spouse who does not work and two children. The second indicator is the ratio of that figure to the net replacement rate for a person unemployed for six months, earning the average wage prior to unemployment, with a spouse earning the average wage and no children (henceforth the “low-to-average replacement ratio”). 40
For each of the four policy indicators, Table 2 shows the level in 2007 and changes from 2000 (taxation) or 2001 (unemployment compensation) to 2007 as well as changes from 2007 to 2019. It is important to keep in mind that the OECD data series on income tax rates, starting in 2000, fails to capture the extensive reductions of top rates that many countries introduced in the 1980s and 1990s. 41 With one-quarter of a standard deviation above or below zero as the criterion for a significant (substantively meaningful) policy change, the top-to-average tax ratio increased in five countries and declined in six countries from 2000 to 2007 while it increased in seven countries and declined in two countries from 2007 to 2019. The postcrisis period is distinguished from the precrisis period not only by a clear tendency for tax progressivity to increase, but also by the fact that top-to-average ratios have increased more (or declined less) than 167/67 ratios in all but three cases (Belgium, the Netherlands, and Spain). Before the financial crisis, reductions in tax progressivity consistently favored the rich relative to the upper middle class. By contrast, countries that have increased top PIT rates since 2007 have commonly protected the (upper) middle class by increasing the threshold at which the top rate kicks in (see Appendix 9). 42
Turning to unemployment compensation, the pattern of policy changes in the pre-crisis period is again mixed. From 2001 to 2007, the income replacement rate for low-wage workers declined in France and Sweden, but it increased significantly in Germany and Ireland and, to a lesser extent, in the Netherlands and the United Kingdom as well. Over the same time period, the structure of unemployment benefits, measured by low-to-average ratio, became less egalitarian in the Netherlands and Sweden, but more egalitarian in Germany, Ireland, and the United Kingdom. 43 In the other seven countries, the low-wage replacement rate and the low-to-average ratio did not change significantly. For the period since 2007, we observe significant cuts in the low-wage replacement rate in five countries and significant increases in two countries. While the structure of benefits became significantly more egalitarian in Austria and Portugal, to some extent in Germany and the United Kingdom as well, it became significantly less egalitarian in France, Sweden, and Denmark. In sum, the data presented in Table 2 suggest that tax policy has either been unchanged or has shifted in a more progressive direction since 2007 while there is no consistent cross-country policy trend in the domain of unemployment compensation.
The indicators of policy change presented in Table 2 leave a great deal to be desired. As suggested already, the redistributive effects of increases in the statutory top PIT rate may have been offset by more generous tax deductions or by increases in the threshold for the top rate. Perhaps more importantly, the unemployment policy indicators not only ignore cuts in benefits to the long-term unemployed, but also the fact that the percentage of the unemployed who are eligible for insurance benefits has declined as a result of the expansion of “non-standard” forms of employment (fixed-term, marginal part-time, and solo self-employment) since the 1990s.
Change in the Redistributive Effects of Income Taxation and Unemployment Compensation from 2007–11 to 2019 (2018 for United Kingdom).
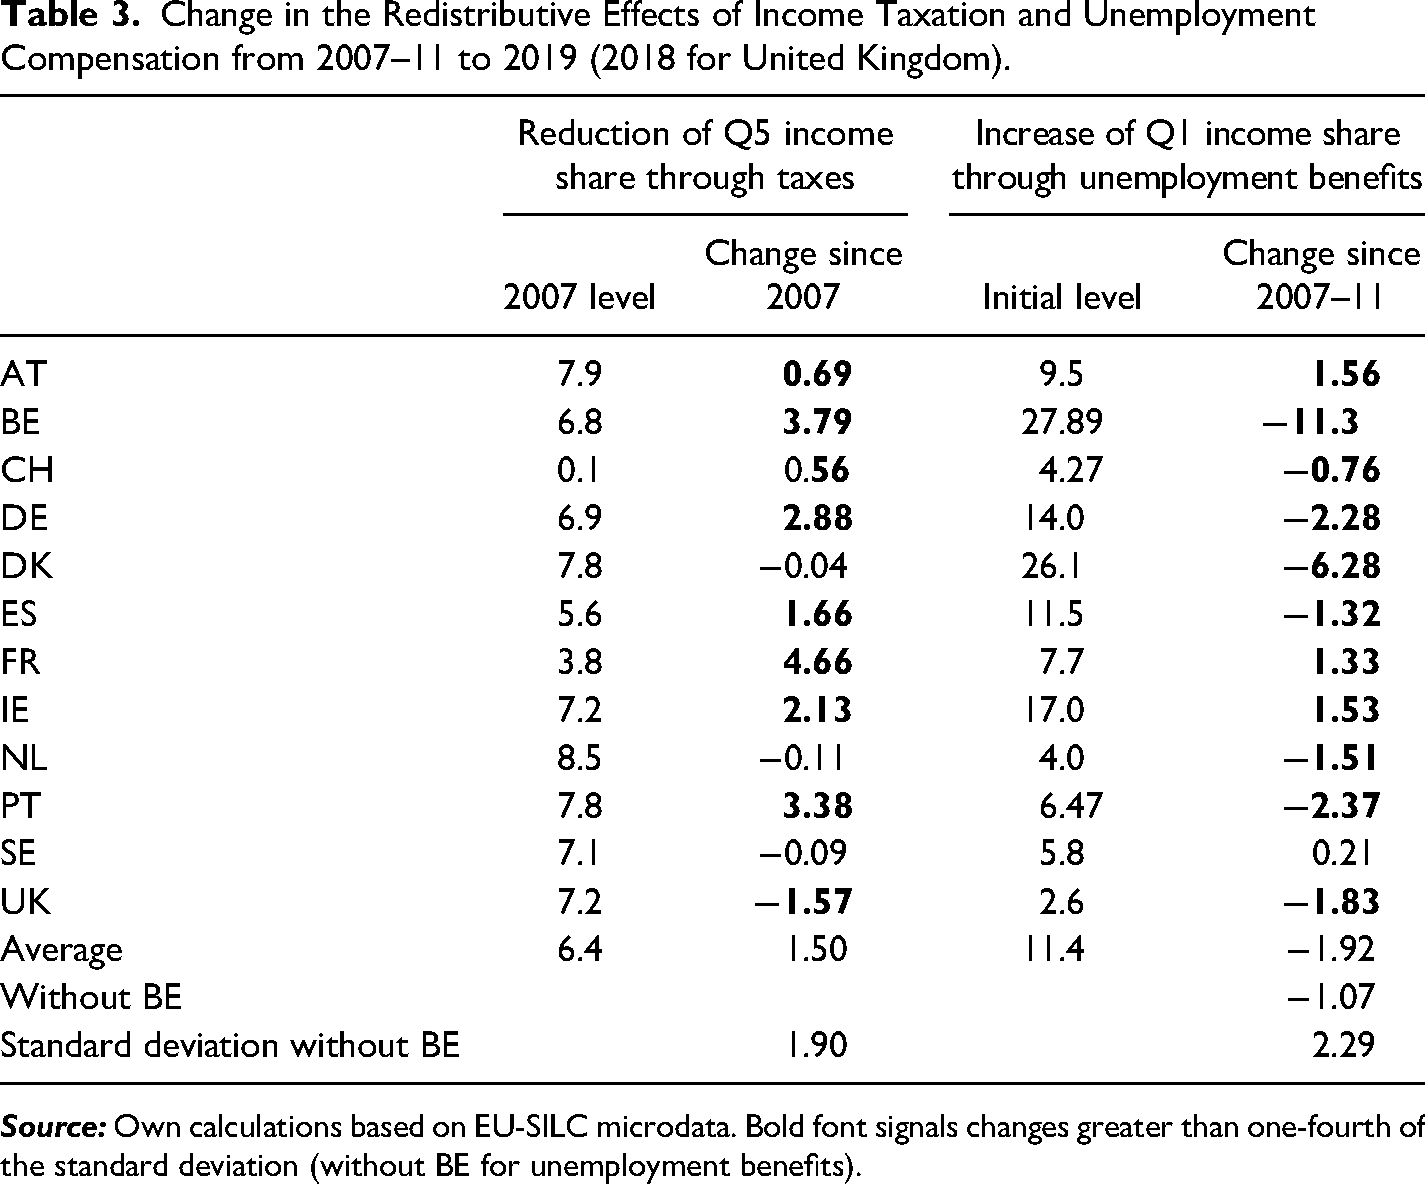
With one-quarter of a standard deviation above or below zero as the criterion for significant change, the United Kingdom stands out in Table 3 as the one country in which the redistributive effect of income taxation declined from 2007 to 2019. In eight of the twelve countries, we observe significant increases in the redistributive effects of income taxation since 2007. In marked contrast, we observe significant increases in the redistributive effects of unemployment benefits in three countries (Austria, France, and Ireland) and significant reductions in eight countries. Measured in this fashion, the contrast between trajectories in the two policy domains becomes sharper than suggested by the policy indicators presented in Table 2.
Matching our data on public preference shifts (Figures 2–3) with the data on policy outputs in Tables 2–3, and again relying on one-quarter of a standard deviation as the criterion for a meaningful policy change, Table 4 sorts country observations of the six policy indicators into three categories: (1) the policy indicator moves in the same direction as public opinion (congruence); (2) the policy indicator does not move even though public opinion moves (non-responsiveness); and (3) the policy indicator moves in the opposite direction to public opinion (perverse responsiveness). Two considerations that we have already touched on motivate this exercise: first, we should not take precise estimate of public opinion shifts too seriously, but rather focus on the direction of public opinion shifts; and, secondly, we should measure policy changes across several different indicators.
Country-Indicator Cases Coded as Congruent with Public Opinion Shifts (+), Unresponsive (0), or Perversely Responsive (−).
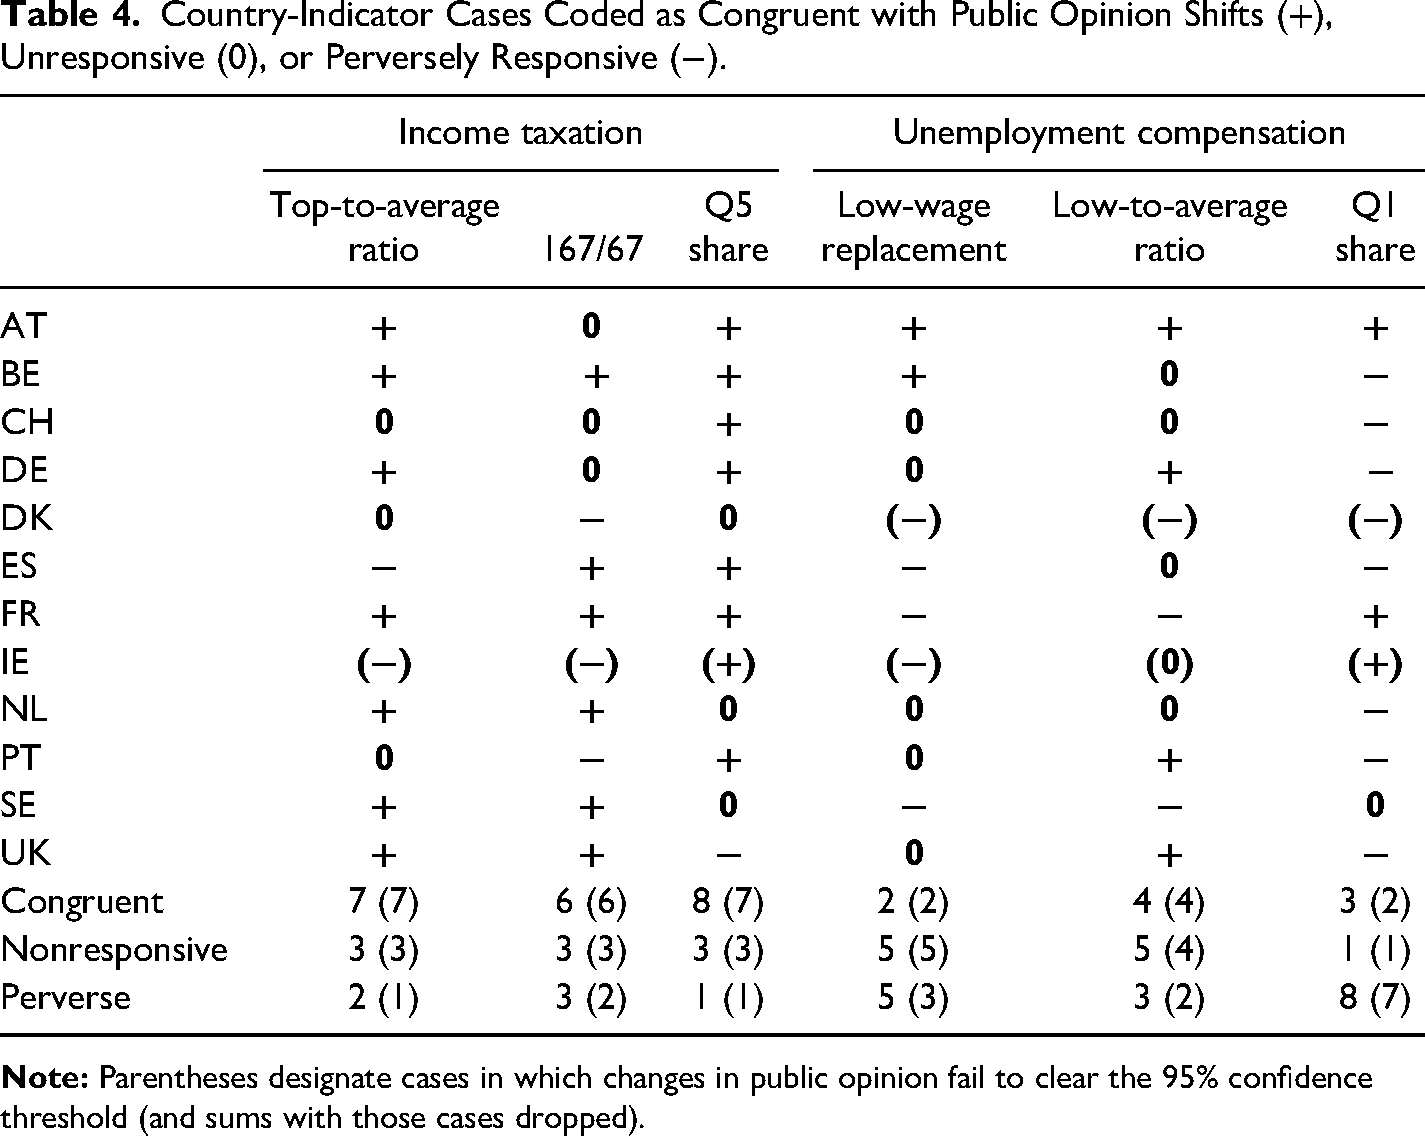
For each of the three indicators of tax policy change, congruent cases either outnumber or equal cases of nonresponsiveness and perverse responsiveness combined. For the two indicators of unemployment policy that are based on replacement rates, the distribution of cases across the three categories is more even (no category outnumbers the other two), but perverse responsiveness emerges as the dominant pattern for the redistributive effects of unemployment benefits. Pooling the three policy indicators and ignoring cases in which public opinion shifts fail to clear the 95 percent threshold for statistical significance, congruent cases account for 64 percent and perverse cases for 12 percent of all cases in the domain of income taxation, as compared to 27 percent and 40 percent, respectively, in the domain of unemployment compensation. 44
The disconnect between preference shifts and policy outcomes in the unemployment domain calls into question not only the proposition that middle-income preferences drive policy changes but also the proposition that citizens adapt their preferences in response to policy changes. The fact that high-income citizens as well as low- and middle-income citizens became more supportive of tax progressivity in the period, while low- and middle-income citizens alone became more supportive of redistributive unemployment compensation, would seem to provide a compelling explanation of the contrast between policy trajectories in the two domains. However, the literature on “tipping points” suggests an alternative explanation that deserves some consideration. Contributors to this literature argue sensibly that the effects of public opinion shifts depend on initial levels. 45 Simply put, we should not expect policy to change if support for a policy change increases from 10 to 20 percent or from 80 to 90 percent, but we should expect policy to change if a similar shift means that supporters of policy change become a majority or, at least, a large enough constituency that political parties might increase their chances of participating in government by promising to change the policy. On average, public opinion shifts in favor of tax progressivity and redistributive unemployment compensation have been similar in magnitude according to our data, but support for tax progressivity was higher to begin with. Returning to Figures 2 and 3, it is indeed the case that aggregate support for redistributive taxation has more often crossed the 50 percent threshold (commonly deemed to be a critical tipping point). Yet the story of unemployment policy being unresponsive or moving in the opposite direction to public opinion continues to hold if we restrict the analysis to country cases in which aggregate support for redistribution passed the 50 percent threshold (see Appendix 11).
Figure 5 presents evidence that might be interpreted as a more serious challenge to the argument that divergent policy trajectories in the domains of income taxation and unemployment compensation reflect income bias in policy responsiveness. The left-hand panel of this figure plots changes in the low-to-average unemployment compensation ratio against our estimates of changes in support for redistributive unemployment compensation among survey respondents in the bottom three income quintiles. The right-hand panel in turn plots (the same) changes in the low-to-average ratio against changes in support for redistributive unemployment compensation among respondents in the top two quintiles. Strikingly, the correlation between preference shifts among low- and middle-income citizens and policy shifts appears to be stronger than the correlation between preference shifts among affluent citizens and policy shifts. Though unemployment policy has not typically moved in the same direction as the preferences of low- and middle-income citizens, the (changing) preferences of these citizens appear to have constrained policy shifts in the opposite direction. 46
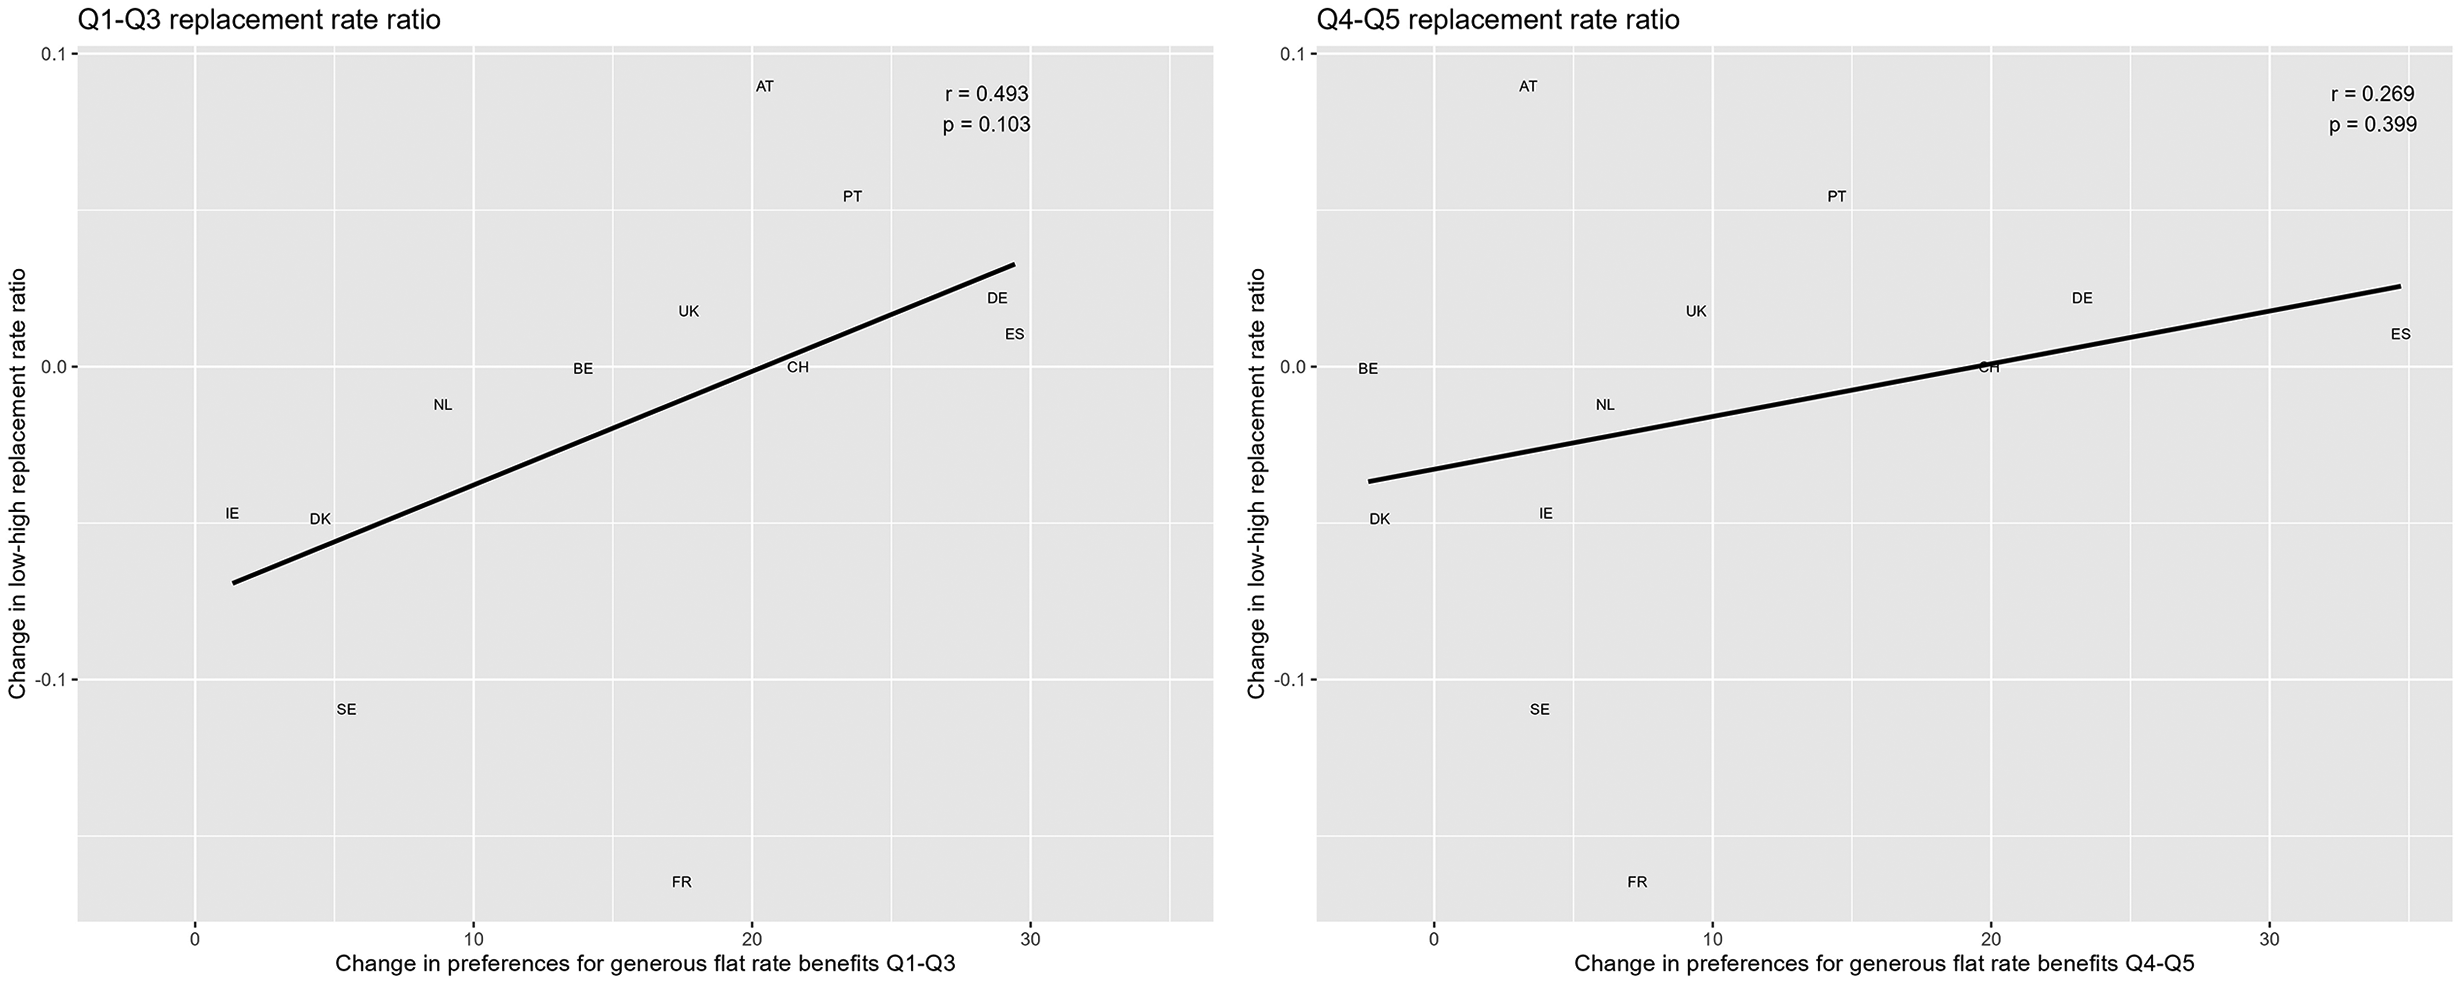
Changes in the low-to-average ratio of unemployment compensation plotted against changes in support for redistributive unemployment compensation among low- and middle-income respondents (Q1–Q3) and among affluent respondents (Q4–Q5). Authors’ elaboration. Without France, the correlation coefficient for the left-hand panel is .713 (p = .014).
The setup of Figure 5 resembles the core research design of the unequal responsiveness literature in that preferences of different income groups are used to predict policy change with regard to an issue on which income groups disagree, but the number of observations in Figure 5 is very small indeed. Also, we hasten to reiterate that precise estimates of public policy preferences must be taken with a grain of salt. We do not conceive of Figure 5 as evidence that policymakers are more responsive to the preferences of low- and middle-income citizens than to the preferences of affluent citizens. The point we want to make is the following: while preference shifts among affluent citizens provide a compelling explanation of the contrast between tax policy and unemployment policy trajectories, they do not seem to be the key to understanding cross-national variation in policy change within policy domains. The next (and final) part of our discussion briefly sets out an analytical framework intended to account for both kinds of variation.
Part 3: Bringing Political Economy into the Picture
We do not wish to deny that electoral politics and citizens’ policy preferences matter, but rather to reframe how (and when) they matter. The literature on unequal policy responsiveness has perhaps too readily accepted the core premise of median-voter theory, namely, that the policy preferences of some citizens—now affluent citizens rather than middle-income swing voters—drive policy developments. Positing that economic performance is the key to the reelection prospects of governing parties, the literature on economic voting provides an important antidote to this line of reasoning and suggests that policy responsiveness is selective in a twofold sense. On the one hand, governing parties will only respond to public opinion shifts if they believe that doing so will enable them to mobilize electoral support without undermining economic performance. 49 On the other hand, seeking to maximize their reelection prospects renders governing parties highly responsive to the policy demands of key business actors (the financial sector as well as large firms in sectors that contribute disproportionately to innovation, employment, and export earnings).
Fully fleshing out this analytical perspective is a task that we must leave for another article. For the present purposes, let us simply illustrate how attention to political-economic variables sheds light on the policy shifts documented above and, by extension, on the role of public opinion in these policy shifts. Our point of departure is that all West European government embraced some form of fiscal austerity in the early 2010s. While Left-leaning governments appear to have been somewhat more inclined to raise taxes and Right-leaning governments more inclined to cut public spending, reductions of public deficits and, by extension, reductions in the costs of servicing public debt emerged as key priority of all governments around this time. In the cases of Ireland, Portugal, and Spain, this policy orientation was imposed by external actors (the “troika”) in return for financial bailouts; elsewhere it was strongly favored by mainstream economists as well as key business actors.
A straightforward explanation of divergent policy trajectories in the domains of income taxation and unemployment compensation is that raising top income tax rates was coherent with the austerity consensus of the 2010s while increasing the generosity of unemployment compensation for low-wage workers was not. The shift in favor of tax progressivity among affluent citizens (or persistently strong support for tax progressivity among affluent citizens) arguably created a permissive environment for the first policy shift while the shift in favor of redistributive unemployment compensation among low- and middle-income citizens represented a constraint on government efforts to rein in spending on the unemployed. By this account, public opinion shifts played a role in both policy domains, but they were not the primary factors motivating policy choices. 50
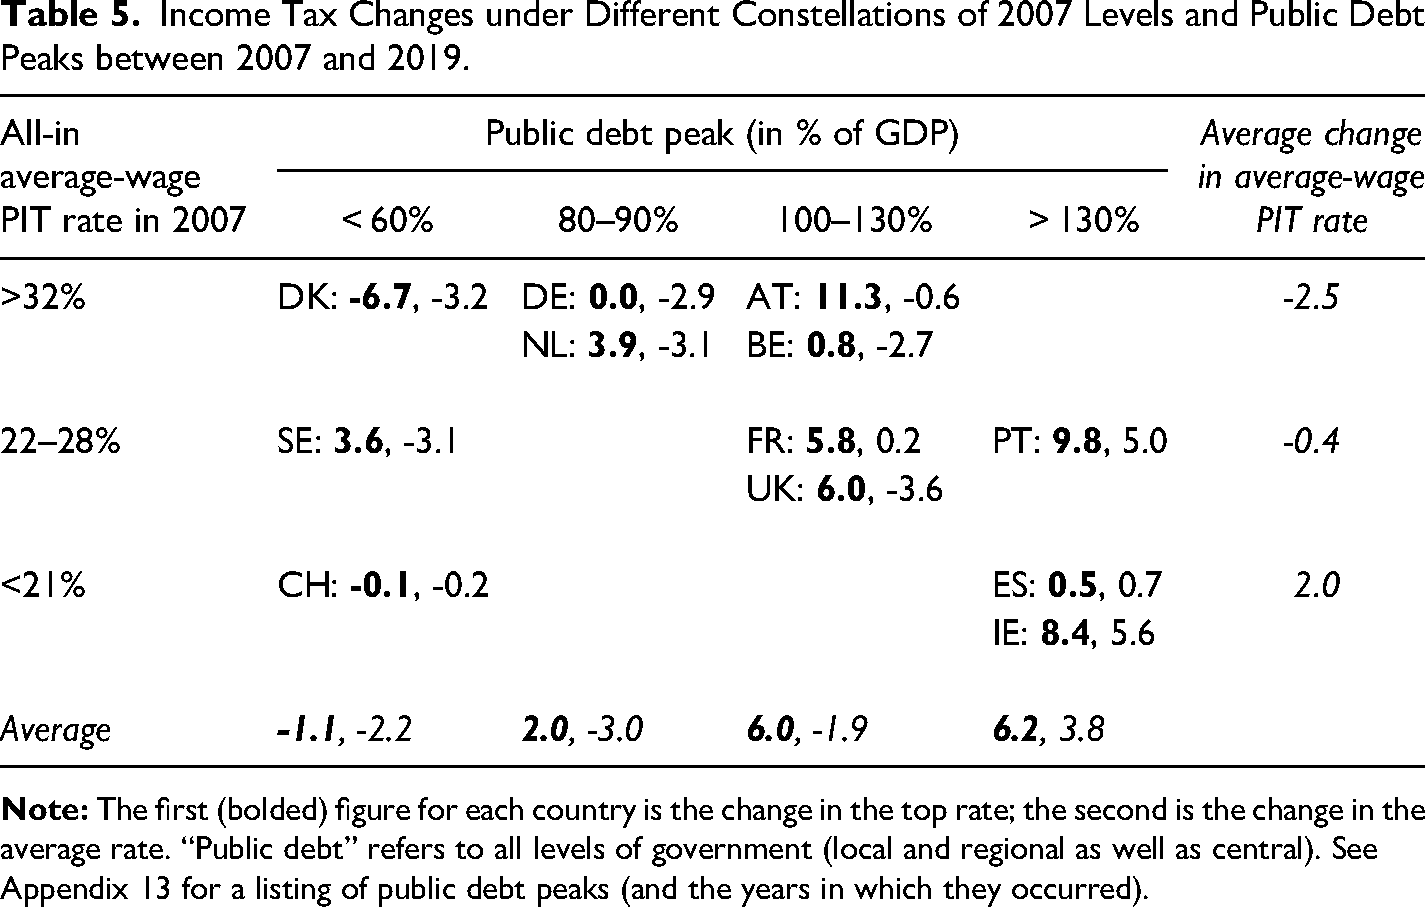
To elaborate further, Table 5 sorts our twelve country cases according to two criteria that might plausibly shape the evolution of tax progressivity: on the vertical axis, the initial PIT rate for the average income earner and, on the horizontal axis, the peak level of public debt during the period covered by our analysis. For each country, we report changes in the top PIT rate (the first figure, in bold font) and the PIT rate for the average income earner (the second figure). Several noteworthy findings emerge from this exercise. Most obviously, the three countries that experienced deep debt crises in the early 2010s—Ireland, Spain, and Portugal—stand out as the only countries in which the PIT rate on the average income earner was raised significantly from 2007 to 2019. (The PIT rate for the average income earner increased in France as well, but only very slightly.) In most other countries, tax progressivity increased not only because top rates were increased, but also because average rates were reduced. Reluctant to increase public spending and unable to stimulate growth by reducing interest rates, governments relied on middle-income tax cuts to compensate for the stagnation of world trade triggered by the financial crisis of 2007–8. 51 Raising top income tax rates was arguably conceived, first and foremost, as a means to minimize the budgetary consequences of this policy orientation. It is also noteworthy that the extent to which top rates were increased is consistently associated with levels of public debt and that cuts in the PIT rate for average income earner have tended to be larger in countries that started with higher rates.
Income Tax Changes under Different Constellations of 2007 Levels and Public Debt Peaks between 2007 and 2019.
Shifting the distributional profile of unemployment benefits could have been achieved without exacerbating government deficits had policymakers been willing to cut compensation for middle-income earners. Not surprisingly, they were reluctant to pursue such a course in the wake of the Great Recession. Hence there is an almost perfect correlation between changes in the low-wage replacement rate and the low-to-average replacement ratio from 2007 to 2019 (r = .933, p < .001). 52 On the premise that the budgetary costs (benefits) of increasing (cutting) the replacement rate for low-wage earners rise with the rate of unemployment, we would expect governments pursuing fiscal austerity to be more prone to cut unemployment benefits when unemployment is high (rising). On the other hand, public opinion may be an important constraint in this regard. And on the premise that unemployment compensation is a more salient concern for citizens in the bottom half of the income distribution, we might expect governments to be particularly wary of going against the preferences of low- and middle-income citizens in this domain.
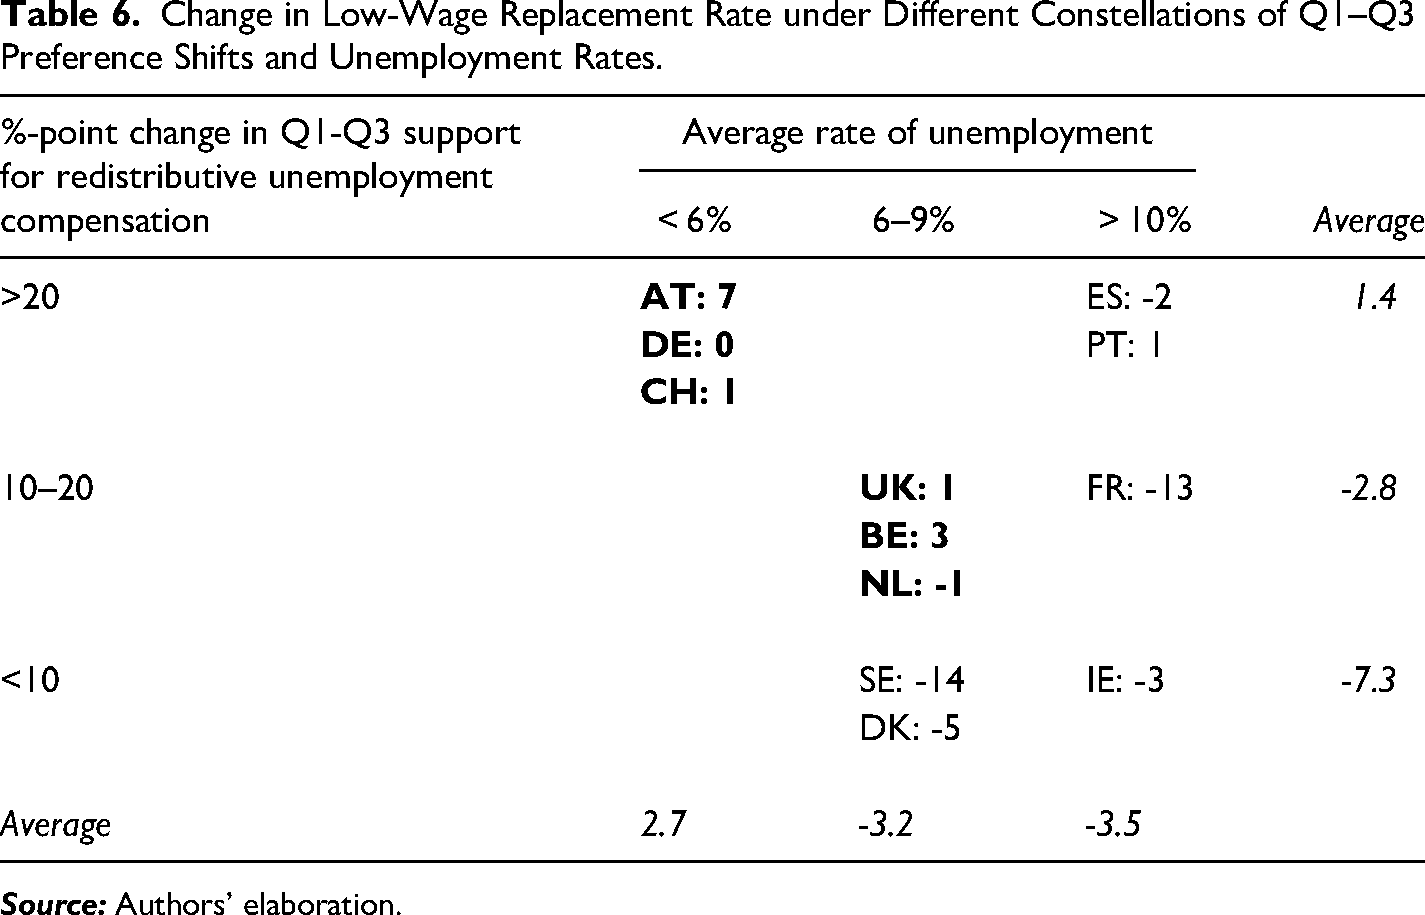
As a preliminary test of these ideas, Table 6 again sorts the country cases according to two criteria: on the horizontal axis, the average rate of unemployment over the period 2007–19; and, on the vertical axis, the increase in support for redistributive employments, as measured by ESS/IAP questions, in the bottom three quintiles of the income distribution. For each country, we report changes in the income replacement for low-wage households provided by unemployment benefits from 2007 and 2019. Setting the exceptional case of Spain aside, the results seem to be quite consistent with the idea that higher rates of unemployment are associated with bigger cuts in the unemployment replacement rates for low-income households. On average, we also observe less decline in replacement rates in countries where support for redistributive unemployment compensation in the middle of the income distribution has risen more sharply, but Table 6 suggests that responsiveness to public opinion is conditional on macroeconomic conditions. The six countries identified in bold font are characterized by the combination of unemployment rates below 9 percent and increases in low- and middle-income support for redistributive unemployment compensation above 10 percentage points (as measured by ESS/IAP). Averaging across these six countries, the low-wage replacement rate increased by 1.8. By contrast, the low-wage replacement rate declined by an average of 6.0 in the other six countries.
Change in Low-Wage Replacement Rate under Different Constellations of Q1–Q3 Preference Shifts and Unemployment Rates.
In closing, let us reiterate that the arguments sketched in this section do not hinge on the observation that public support for tax progressivity rose sharply from 2008 to 2009. The same logic applies if it were the case, as suggested by some ISSP data, that broad support for redistributive taxation has persisted over time. By the same token, the observation that support for redistributive taxation was higher (and remains higher) than support for redistributive unemployment compensation does not contradict the arguments that we have advanced.
Conclusion
We have sought to reframe the debate about the lack of compensatory redistribution in capitalist democracies and to propose a new approach to the politics of inequality and redistribution. For starters, we hope that we have convinced the reader of two points pertaining to public support for redistribution. The first point is that rising income inequality is not a continuous linear trajectory in advanced capitalist countries. In most West European countries, income inequality has held steady or even declined since 2008. The second point concerns measures of public support for redistribution. Measuring support for redistribution as the percentage of survey respondents who agree (more or less strongly) with the statement that the government should take measures to reduce income differences yields estimates of public support that are very high, very stable over time, and not very meaningful. We observe more change over time if we instead look at support for specific policies with redistributive implications. Taking these two points together, it is not so obvious that low- and middle-income citizens are oblivious to rising inequality or, in other words, that there really is a “demand-side puzzle” to be resolved.
Regarding policy responsiveness, our discussion has highlighted the importance of distinguishing between policy domains and adopting a dynamic perspective, focusing on the effects of preference shifts and changes in policy outputs over time. Encompassing all political issues, the literature on unequal policy responsiveness captures features that all capitalist democracies have in common. First, affluent citizens are more likely to participate actively in politics and more able to make themselves heard. Secondly, politicians typically come from upper-middle-class backgrounds: their values and preferences resemble those of affluent citizens, and they are more likely to understand what affluent citizens want. 53 Thirdly, the interests of affluent citizens are more closely aligned with the interests of corporations and organized business actors with direct influence in the policymaking processes through lobbying and through the provision of information on which government officials rely. 54
These broad parameters of democratic politics in capitalist societies certainly have policy implications, but we observe important differences in policy outputs, notably in policy outputs that bear on the distribution of income, across countries where—and across time periods when—they are present to more or less the same degree. As argued by many political economists and welfare-state scholars, tight labor markets, strong unions and a permissive macroeconomic policy consensus (Keynesianism) tilted the playing field in favor of low- and middle-income citizens in the three decades following the Second World War (les trentes glorieuses). This shift was particularly pronounced in Sweden and other countries where parties with a principled commitment to redistribution held government power on a regular basis.
Though we lack the public opinion data necessary to analyze policy responsiveness in the postwar decades in the manner proposed by Gilens, there are good reasons to suppose that redistributive policy responsiveness became more unequal in many countries in the course of the 1980s and 1990s. However, two caveats deserve to be noted. First, the consequences of increased inequality in policy responsiveness depend on the preferences of affluent citizens (and employers), and these preferences vary as a result of postwar legacies. Secondly, we observe significant differences in responsiveness across policy domains related to income redistribution.
Finally, we have sought to illustrate how, in the context of the European austerity consensus of the 2010s, changes in policy preferences can be thought of as factors that enable or constrain policy changes motivated by economic conditions and macroeconomic policy paradigms. The rules of liberal democracy alone do not ensure that governments implement the wishes of the “median voter,” let alone the wishes of the majority of citizens. It seems equally clear that affluent citizens—or “the rich”—do not always get their way in redistributive politics. Instead of choosing between, in Elkjaer and Iversen's formulation, 55 “middle-class supremacy” and “rule by the rich” as the defining feature of liberal democracy, we should inquire further about the economic, social, and political conditions that render government policy more or less responsive to the poor, the middle, and the affluent.
Supplemental Material
sj-pdf-1-pas-10.1177_00323292241283293 - Supplemental material for Unevenly Unequal Responsiveness: Public Opinion and Redistributive Policy Shifts in Western Europe Since 2008
Supplemental material, sj-pdf-1-pas-10.1177_00323292241283293 for Unevenly Unequal Responsiveness: Public Opinion and Redistributive Policy Shifts in Western Europe Since 2008 by Jan Rosset, Jérémie Poltier and Jonas Pontusson in Politics & Society
Footnotes
Acknowledgments
For detailed comments on previous versions of the article, we are grateful to Lucio Baccaro, Larry Bartels, Charlotte Cavaillé, Lea Elsässer, Nathalie Giger, Lukas Haffert, Konstantin Käppner, and Noam Lupu.
Declaration of Conflicting Interests
The authors declared no potential conflicts of interest with respect to the research, authorship, and/or publication of this article.
Funding
The authors disclosed receipt of the following financial support for the research, authorship,and/or publication of this article: The research for this paper was funded by the European Research Council (grant no. 741538).
Supplemental Material
Supplemental material for this article is available online.
Notes
Author Biographies
Supplementary Material
Please find the following supplemental material available below.
For Open Access articles published under a Creative Commons License, all supplemental material carries the same license as the article it is associated with.
For non-Open Access articles published, all supplemental material carries a non-exclusive license, and permission requests for re-use of supplemental material or any part of supplemental material shall be sent directly to the copyright owner as specified in the copyright notice associated with the article.