
Abstract
While young people’s electoral behaviour in voluntary voting systems has been extensively studied, we know little about this in compulsory systems. To investigate, we examine the drivers of voting, not voting and not registering of Generation Z youths in Australia, which has long had compulsory registration and voting. We argue that Gen-Z voters, abstainers (registered, but who do not vote) and unregistered will differ according to their socio-demographics, socio-political engagement and political attitudes, following a ‘hierarchy of disengagement’. Drawing on original survey data from around 1500 Gen-Z Australians, we find that non-voters are distinguished by their unemployment status, lower political interest and weaker faith in democracy. Among non-voters, the differences between abstainers and unregistered mostly relate to their socio-economic backgrounds. Finally, we show that the most common reason for voting is not to get fined, while almost a third of unregistered Gen-Z citizens attribute their behaviour to lack of knowledge.
In voluntary voting systems, young people are not only less inclined than their elders to register to vote, but they are also less inclined to vote once they are on the electoral roll (Blais et al., 2004; Pickard, 2019). This reluctance to participate in elections has been attributed to a range of factors, including disillusionment with party politics and greater interest in non-electoral activism (Cammaerts et al., 2014; Kimberlee, 2002). But what happens when young people are legally obliged to register and to vote? While there are only a handful of democracies that place the onus on citizens to perform both these tasks, the question is not a moot point. After all, compulsory voting has regularly been suggested by political scientists as a way to improve democratic representation (Hill, 2006; Lijphart, 1997), including that of the young (Wattenberg, 2024). And we know that in countries like the United Kingdom and the United States, efforts to increase youth turnout have focused at least as much on registration as on actual voting (Holbein and Hillygus, 2016; Pickard, 2015). In this article, we therefore examine the electoral behaviour in a compulsory system of Generation Z (Gen-Z) citizens. 1 Specifically, we ask: When registration and voting are compulsory, what drives Gen-Z youths to register and vote, to register and not vote, or to not register at all? And how do they explain their choices?
To answer these questions, our theoretical framework proposes that, notwithstanding the ‘equalising’ effects of compulsory registration and voting (Hill, 2006; Lijphart, 1997), there should remain systematic differences between Gen-Z who vote and do not vote even in countries with compulsory voting. In addition, we theoretically innovate from previous studies by devising a typology which distinguishes between two groups of non-voters: (1) ‘abstainers’ (those who register but do not vote) and (2) ‘unregistered’ (those who do not register). In conjunction with this new typology, we advance the novel argument that we should find a ‘hierarchy of disengagement’ among Gen-Z voters, abstainers and unregistered, by which abstainers are more engaged than the unregistered but are less so than voters. Based on the literature on youth political participation, the extent to which Gen-Z youths in a compulsory setting will be willing to break the law and risk a financial penalty should depend on three groups of factors: first, their socio-economic backgrounds; second, their political and societal engagement; and third, their political attitudes (Blais and Loewen, 2011; Fieldhouse et al., 2007; Kimberlee, 2002; Pickard, 2015). In short, Gen-Z voters will likely have better socio-economic backgrounds, greater political and societal engagement, and more positive attitudes towards democracy and parties than Gen-Z non-voters; and so will abstainers in comparison to the unregistered.
We test this argument on Australia, an established democracy which, for federal elections, has had compulsory registration since 1911 and compulsory voting since 1924 (Mackerras and McAllister, 1999: 218–221). Notably, Australia is one of just three democracies where the combination of compulsory citizen-led registration and compulsory voting allows us to investigate whether there are any differences between abstainers and the unregistered. In most other countries, these two groups tend to be conflated either because voting is voluntary or because registration is automatically done by the state. Although registration and voting rates are very high in Australia compared to elsewhere, the same pattern of young people participating less than their elders has long been present. For example, at the end of 2023, the percentage of unregistered citizens aged between 18 and 24 was estimated to be around 10% compared to an overall national unregistered figure of 2%. 2 To investigate the drivers of youth voting and non-voting behaviour, we therefore conducted a nationwide survey in late 2023 of about 1500 Gen-Z Australians. Given our research aims, we deliberately oversampled non-voters, meaning that more than half of our respondents had either not registered or not voted at the 2022 federal election.
Our results show that Gen-Z Australian non-voters are distinguished by their unemployment status, lower political interest and weaker faith in democracy. However, they are not necessarily more disengaged from their communities, and they do not hold more negative attitudes towards political parties than voters. We also find that the only significant differences between Gen-Z who abstain and those who do not register are that the latter are more likely to be students and better off economically. Overall, therefore, the socio-economic background of Gen-Z has a greater impact on their electoral behaviour than their attitudes and networks, reiterating the key role that material resources play in fostering political participation (Brady et al., 1995; Verba et al., 1995). In addition, our survey highlights the impact of even a small financial deterrent like the $20 AUD penalty for not voting in an Australian federal election. 3 In fact, almost half of the voters among our respondents say that the main reason they turned out at the 2022 election was because they did not want to get fined. At the same time, only a third of them said they would definitely have voted if it had not been compulsory. Finally, our results indicate that information matters: about 3 in 10 Gen-Z youths who did not register to vote attributed this to the fact that they either did not know they had to register or they did not know how to do so. Given that over 84% of these said they intended to vote at the next election, their non-participation does appear more due to a lack of knowledge rather than a deliberate choice.
Our study makes several contributions to the literature on voting and youth political participation. First, we have devised a typology of non-voters (abstainers and unregistered) which can be applied in research on other countries, regardless of whether they have compulsory voting or not. This distinction, largely overlooked in the literature which has tended to treat non-voters as a monolithic block (cf. Sigelman et al., 1985), is important for understanding what drives different forms of non-participation, and for addressing inequalities between those who turn out and those who do not. Second, we provide one of the most complete pictures to date of turnout among Gen-Z youth anywhere, and certainly the most complete one of Gen-Z youth in a compulsory system. Third, while most of what we know about youth electoral behaviour comes from voluntary voting settings (especially the United States and the United Kingdom), our study is the first to focus on youth voting in a compulsory setting. Given how, even in countries with mandatory voting, young people tend to vote less than older generations (Quintelier, 2015; Singh, 2015), our study provides new insights into youth (dis)engagement with the political process. Fourth, and finally, our study contributes not only to the long-standing normative debate about whether voting should be voluntary or not (Hill, 2006; Lijphart, 1997), but to the question of the effects of mandatory voting on the young (Wattenberg, 2024). In particular, our findings support Wattenberg’s (2024) contention that enforcing compulsory voting, even with relatively small financial penalties, positively affects youth turnout. While such a measure could prove controversial in countries which have no tradition of compulsory voting, its democratic representation benefits arguably outweigh the drawbacks of being constrained to participate.
The article proceeds as follows. In the next section, we set out our theoretical framework and develop four hypotheses on how Gen-Z voters, abstainers and unregistered might be distinguished from one another. In the third section, we present our case study, Australia, and describe the survey method and data used to test our hypotheses. In the fourth, we present the results of our statistical analyses, while, in the fifth, we discuss our descriptive results regarding how Gen-Z voters, abstainers and unregistered explain their electoral behaviour. We conclude by summarising the key findings of our study and highlighting promising paths for future research.
Youth Voting and Non-Voting
Young people in the twenty-first century have generally voted less than previous generations of young people, exacerbating the participation gap between young and old in many democracies (Blais et al., 2004; Dalton, 2017; Martin, 2012). Indeed, Kostelka and Blais (2021) find that this decrease in voting from generation to generation is the main cause of overall turnout decline across a range of established democracies (see also Gallego, 2009). Moreover, the same pattern is found outside Europe and North America. As Resnick and Casale (2013) discuss, youth turnout is falling also in sub-Saharan Africa, and for many of the same reasons as in Global North countries. Beyond its impact on turnout, this generational disparity also affects outcomes. For example, in the 2016 United States Presidential election, 43% of those aged between 18 and 29 voted, well below the 71% of over 60s who did so (Pew Research Center, 2018). The same year, in the UK’s Brexit referendum, 64% of young people voted, compared to the 90% of those aged 65 and over who participated (Hobolt, 2016). In both cases, the preferred outcome of the older generation, and not that of the younger one, was successful.
Although there is division in the literature on whether the cause of reduced electoral participation is due to apathy or greater interest in other political activities (Marsh et al., 2006), young people’s decisions whether or not to vote have generally been attributed to three sets of factors: socio-economic background, political and societal engagement, and attitudes towards politics (Blais and Loewen, 2011; Fernández Guzmán Grassi et al. 2024; Fieldhouse et al., 2007; Kimberlee, 2002). However, while these have been extensively used to assess youth voting in non-compulsory systems, particularly those of the United States and the United Kingdom (Henn et al., 2002; Wattenberg, 2024), they have not been applied to the study of youth voting in compulsory ones. As such, we do not know if the main explanations for why young people do and do not vote hold when voting is a legal duty and citizens risk financial penalties if they do not fulfil it.
In this regard, the literature suggests that compulsory voting can significantly level the playing field: by generating close to full participation in the electoral process, it should reduce systematic differences between those who turn out to vote and those who do not (Bugarin and Portugal, 2016; Hill, 2006; Lijphart, 1997), especially in countries where compulsory voting is enforced via sanctions (Panagopoulos, 2008). Empirical evidence supporting the claim that compulsory voting increases turnout is abundant (Birch, 2009; Kostelka et al., 2024). However, the extent to which it can enhance the participation of individuals who usually would not vote is less straightforward. For instance, Singh (2015) finds that where voting is mandatory, differences between voters and non-voters are less dependent on the usual socio-demographic and attitudinal predictors of turnout. At the same time, other studies show that compulsory voting does not greatly reduce inequality between voters and non-voters; on the contrary, it can sometimes increase it (Cepaluni and Hidalgo, 2016; Maldonado, 2011; Power, 2009). Notably, based on survey data from 38 countries, Quintelier et al. (2011) find that compulsory voting strengthens age differences since younger people react less to the obligation to vote than older people. More generally, age remains a predictor of turnout in countries where voting is mandatory, with younger people voting less (Singh, 2011, 2015). In our theoretical framework, therefore, we start from the assumption that even in a country with compulsory voting, there should be systematic differences between young people who vote and young people who do not.
We also do not know what, if anything, differentiates young people in compulsory systems who do not register to vote from those who are registered but then do not cast their ballot. These two forms of electoral behaviour arguably represent different degrees of disengagement. It is one thing to be on the electoral register and eventually, for whatever reason, not to vote. It is another, however, not to even give oneself the option of voting. Although political science has largely treated non-voters as a single group and overlooked differences between abstaining and not registering (see Sigelman et al., 1985, for a rare exception), this is not a mere theoretical distinction. 4 In fact, policy efforts to increase youth voting in both compulsory and non-compulsory systems, like Australia and the United States, have focused more on making registration easier than making voting easier (Holbein and Hillygus, 2016; Pickard, 2015). Given the importance of both steps (registration and casting a ballot) in the electoral process, in our study we distinguish between two types of non-voters: (1) abstainers – those who are registered but do not vote and (2) unregistered – those who do not register. Our typology is illustrated in Figure 1. Moreover, we propose that there should be a ‘hierarchy of disengagement’ among voters, abstainers and unregistered. In other words, we anticipate that the abstainers will be less engaged than the voters, but they will be more engaged than the unregistered. Similar to Amnå and Ekman (2014), therefore, who distinguish between ‘different varieties of political passivity’ among young people by classifying them as ‘active citizens’, ‘manifestly passive citizens’ and ‘standby citizens’ (who ‘stand somewhere in between’), we seek to develop a more nuanced understanding of non-voters rather than simply viewing them as a monolithic category.
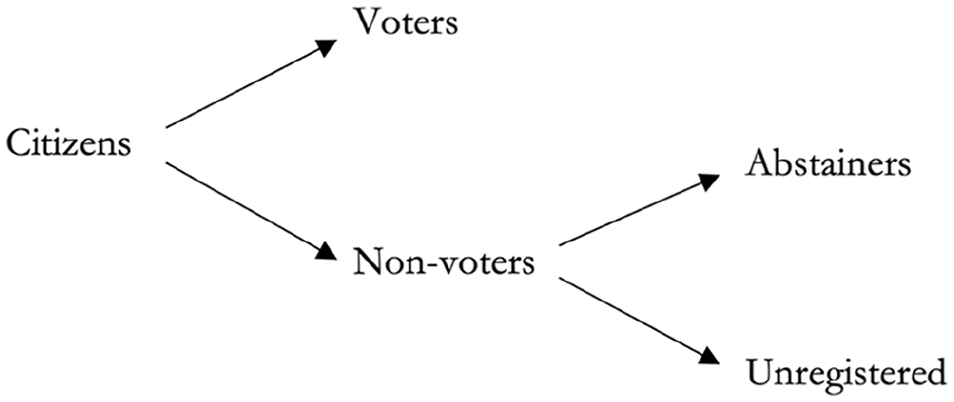
Typology of Voters and Non-Voters.
In the remainder of this section, we develop four hypotheses to investigate the reasons why Gen-Z youths vote, abstain or are not registered in compulsory systems. Three of these explore the differences between Gen-Z voters and non-voters, while the fourth focuses on the distinction in the latter category between abstainers and the unregistered.
The first set of motivations concerns the socio-economic backgrounds of young people, namely their economic well-being, employment status and level of education. Resource-based models of political participation have long shown that possessing a higher socio-economic background generally leads to higher levels of voting. The mechanism underpinning this trend is twofold: on the one hand, individuals with greater resources are more likely to develop those ‘civic attitudes’ which are key to political participation, such as political efficacy and a sense of civic duty; on the other hand, they are also more likely to be embedded in social networks which make them targets of mobilisation efforts by political parties (Brady et al., 1995; Verba et al., 1995; Verba and Nie, 1972). Empirical evidence suggests that resources are positively associated with voting also in the specific case of young people. For example, young Canadians who vote tend to come from wealthier households than those who do not (Blais and Loewen, 2011). Education is an important resource too. Gallego (2009: 38) finds that in Norway and Sweden, turnout declines are particularly evident among ‘young, poorly educated citizens’. More broadly, across Europe, the length of time spent in education and the attainments achieved are positively correlated with turning out to vote (Fieldhouse et al., 2007; Quintelier, 2007; Sloam, 2016). Furthermore, according to studies on life-cycle effects, being employed full time also serves as a driver of young people’s voting (Quintelier, 2007; Smets, 2016). Likewise, Resnick and Casale (2013: 1184) find that turnout is lower among young people in sub-Saharan Africa ‘who are unemployed or looking for work’. Based on all the above, we expect Gen-Z youths from higher socio-economic backgrounds to vote in greater proportions than those from lower ones.
The second set of motivations said to affect youth turnout can be broadly termed ‘political and societal engagement’. This comprises not only people’s interest in politics but also their involvement in the community via civil society organisations (CSOs) and their participation in non-electoral political activities. Political interest is one of the strongest predictors of political participation (Brady et al., 1995; Smets and van Ham, 2013). Similarly, membership of CSOs like charities and churches can enhance participation by acting as ‘schools of democracy’ that teach individuals key skills and values to be politically active (Tocqueville, 2002[1835]; Verba et al., 1995). The same mechanisms are at play among young people: youths with greater levels of political interest are more likely to vote (Blais and Loewen, 2011; Fieldhouse et al., 2007; Resnick and Casale, 2013), and CSOs are important in the political socialisation process of young people as they foster the habit of participation (Quintelier, 2015: 65; see also Fieldhouse et al., 2007). For instance, Holecz et al. (2022) find that involvement in ‘socialising spheres’, and particularly in what they term ‘community activities’ (e.g. volunteering and/or raising money for charity), encourages young Europeans to be politically active. At the same time, youths have become ever more involved in what Norris (2004: 16) calls ‘cause-oriented political action’ such as signing petitions, boycotting products and participating in demonstrations (see also Quintelier, 2007; Sloam, 2016). While some scholars have argued that taking part in these activities may lead young people to turn their backs on voting (Kimberlee, 2002), empirical evidence from Canada shows that such participation results in higher levels of political interest and hence greater involvement in the electoral process (Blais and Loewen, 2011). In short, political and societal engagement should encourage Gen-Z youths to participate in politics, including by voting. Our second hypothesis thus envisages the following:
A third set of factors said to influence youth voting behaviour is attitudes towards democracy in general, and towards political parties in particular. Individuals are more inclined to vote if they perceive the democratic system to be legitimate, efficient and fair, and consider politicians competent and responsive (Birch, 2010; Karp and Banducci, 2008; Powell, 1986). By contrast, feelings of alienation and cynicism towards parties and candidates can depress turnout (Callander and Wilson, 2007; Heath, 2018). Younger generations are no different in this regard. In fact, rather than seeing young people simply as apathetic and disengaged, a substantial body of work emphasises how low turnout among young people reflects their disenchantment with political parties and the system of government. For example, in the United Kingdom, Henn et al. (2005: 574) find that young people perceive parties and politicians to be ‘self-serving, unrepresentative, and unresponsive’ to their demands. Furthermore, Cammaerts et al. (2014) show that the low turnout of young European voters is driven by their discontent with the political process and the belief that parties do not care about them. Similarly, Anderson and Goodyear-Grant (2008) observe that cynicism towards parties among young people in Canada significantly increases the likelihood of them not voting. On the flip side, however, positive attitudes towards democracy are associated with higher levels of voting among young people (Fernández Guzmán Grassi et al., 2024). We therefore expect the following:
Our final hypothesis builds on the argument that young non-voters are not a monolithic block (Amnå and Ekman, 2014). As Sigelman et al. (1985: 750) observe, ‘a person who does not vote in a particular election may not even be registered to vote, may be registered but seldom or never vote, may vote fairly regularly, or may have always voted except for this one time’. The same is true of young non-voters: these may have had reasons for not voting in a specific election but have nonetheless been registered to vote for elections in general; or, on the contrary, they may have no desire to vote at all and therefore have never registered. If we were to put ‘not registering’ and ‘registering but not voting’ on a scale of political participation, the latter is obviously more demanding than the former. Following on from the rationales for our previous three hypotheses, therefore, it is likely that people who are registered to vote (even if they do not eventually do so) will possess more of the material, cognitive and social resources we have attributed to voters than unregistered youths do – that is, they will display higher socio-economic backgrounds, greater political and societal engagement, and more positive attitudes towards parties and democracies. This would be in line with the civic voluntarism model, which shows that the more demanding a political activity is, the more resources, skills and motivation it requires (Verba and Nie, 1972; Verba, Schlozman and Brady, 1995). It is also consistent with the little we know about unregistered voters in systems where the onus is on the individual to register. For example, a study of eligible citizens who did not register to vote at the 2012 presidential election in California found that the main reason given for not doing so was a lack of interest in politics (García Bedolla and Echaveste, 2015).
At the same time, it is possible that the three categories of features might affect the electoral behaviour of Gen-Z abstainers and unregistered in distinct, ‘non-linear’ ways. For example, it could be the case that the unregistered instead have greater socio-economic resources than abstainers. The mechanism underpinning this would be that well-resourced young people who do not want to vote purposedly do not register in order to reduce the chances of getting fined. Likewise, abstainers may hold more negative attitudes towards parties than the unregistered: abstainers actively choose not to cast their vote for any party, while the unregistered may not be sufficiently aware of politics to have developed any strong views towards parties at all. In other words, whether you are in one category or the other may depend on your affective dispositions towards politics, with abstainers being ‘enraged’ and the unregistered simply ‘disinterested’ (Ferrín and García -Albacete, 2024). Given the novelty of our typology of voters, abstainers and unregistered, this hypothesis is necessarily the most exploratory of our study. Nonetheless, in light of the empirical evidence discussed in the previous paragraph, we believe it ultimately makes sense to conceive of the unregistered as the most disengaged of the non-voters, and to therefore expect that they will hold less of those material, social and cognitive resources which foster turnout. Based on these considerations, our fourth hypothesis states that:
Case, Method and Data
We test our theoretical framework in the case of Australia, whose adult citizens are legally obliged to vote in all elections and face financial penalties if they fail to do so (Dassonneville et al., 2023: 5). 5 Unsurprisingly, given its high ‘state capacity’ (Kostelka et al., 2024) and the fact that it enforces sanctions for not voting, Australia has one of the highest turnout rates in the world, with participation rates regularly above 90% (Australian Electoral Commission, 2023). It is also one of just three democracies in the world which combines compulsory voting with individual responsibility for registration, as shown in Table 1. The table presents a typology of how countries differ according to registration procedures and whether or not they have compulsory voting. All countries included in the table have been, or are, electoral democracies, since they have had a value of 0.7 or above according to Varieties of Democracy (V-Dem) Polyarchy Index at some point between 2000 and 2020 (Coppedge et al., 2024). As the table illustrates, voter registration in most democracies is done automatically by the state. While the Australian Electoral Commission (AEC) sometimes uses information from other government agencies to directly enrol people, the obligation to register rests with the individual. 6 The Australian case is thus ideal to study the three electoral behaviours that interest us – voting, abstaining and not registering. For example, our study would not be possible either in Belgium (compulsory) or Spain (non-compulsory), since registration in both is not the responsibility of individuals and therefore the category of ‘unregistered’ does not exist. It would also not be as straightforward in countries with voluntary voting and citizen-led registration, like the United States, since people in these countries who want to abstain can simply not register.
Number of Democracies (2000–2020) by Type of Election Registration and Voting Participation.
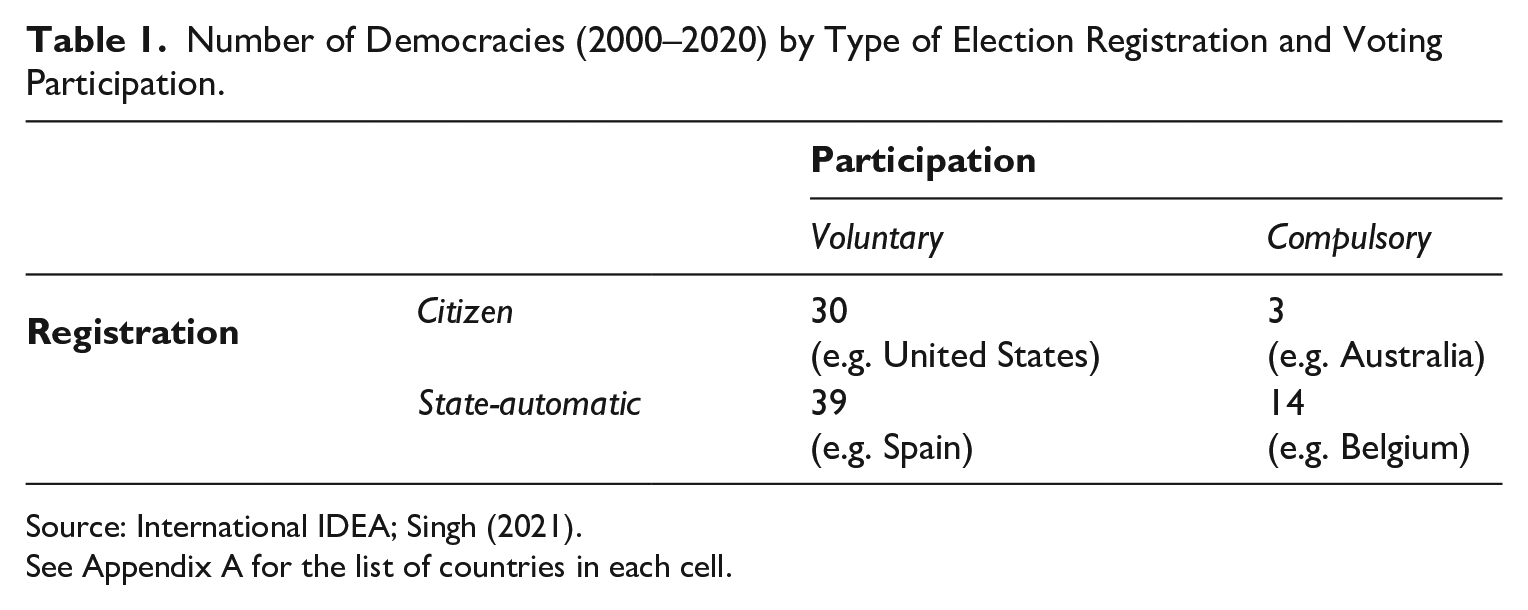
Source: International IDEA; Singh (2021).
See Appendix A for the list of countries in each cell.
To investigate youth electoral behaviour in Australia, we fielded an online survey between 7 August and 28 December 2023. 7 Our target population was citizens aged 19–27 at the time of the survey (meaning respondents were in the 18–26 Generation Z bracket age when the May 2022 federal election was held). We received a total of 1498 responses, comprised of 622 voters, 280 abstainers and 596 unregistered. We oversampled non-voters in order to achieve sufficient numbers of respondents and better understand their characteristics and motivations. The survey asked respondents whether they were registered at the time of the 2022 federal election and, if they were, whether they voted. We created two dependent variables from these questions. The first measures if respondents are non-voters (abstainers and unregistered), coded as 1, or voters, coded as 0. The second gauges if non-voter respondents are abstainers, coded as 1, or unregistered, coded as 0. To investigate the differences between Gen-Z voters and non-voters, on the one hand, and between Gen-Z abstainers and unregistered, on the other, we run two binomial logistic regressions (one for each dependent variable) with robust standard errors.
In line with our theoretical framework, the models included three sets of independent variables. 8 The socio-economic background of respondents was measured with three standard variables: student status, occupational status and family economic well-being. The first is a dichotomous variable that distinguishes respondents who are studying (coded as 1) from those who are not (coded as 0). The second is a three-level categorical variable determining whether respondents are working full time, part time or are not working. The third is a three-level categorical variable which measures whether the respondent’s family needs help to meet living expenses, makes enough to survive but not to save, or makes enough not only to survive, but to save.
The political and societal engagement of respondents was assessed by five variables. The first two, political interest and membership in CSOs, are often used as predictors of political participation (Brady et al., 1995; Quintelier, 2015). In line with this work, we measured political interest with a continuous variable ranging from 0 (not at all interested) to 10 (extremely interested). The variable measuring membership in CSOs is dichotomous and accounts for whether respondents were members of a charity, church, business, environmental or humanitarian association (coded as 1), or not (coded as 0). In addition, engagement in non-electoral political activities was gauged using three dichotomous variables that measured whether respondents had signed a petition, boycotted products or attended a public demonstration in the past 2 years (coded as 1) or not (coded as 0). These three activities were chosen since they are the most common forms of non-electoral political participation (Sloam, 2016: 74).
The variables assessing respondents’ attitudes towards democracy and parties were obtained from a survey question which asked the extent to which they agreed on a 0 to 10 scale with the following three statements: ‘Democracy is the best system of government’; ‘Parties do not care about people like me’; and ‘Parties are all the same’. All three variables are continuous, with higher values indicating stronger agreement. The first statement is a standard survey item in public opinion surveys (e.g. Pew Research Centre, World Values Survey), while the latter two reflect common grievances that young people tend to have against political parties, according to the literature on youth and politics (Cammaerts et al., 2014; Henn et al., 2005).
Finally, we also included the following controls drawn from the literature on youth voting: gender of respondents; whether they were born in Australia or not; their age; the competitiveness of the 2022 federal election contest in their constituency, which is a continuous variable obtained from the AEC and measures the vote share difference between the first and second party in the electoral division; a nominal variable gauging whether respondents lived in regional areas, regional centres or cities; and a nominal variable for the Australian state or territory where they were from. The correlation matrix reveals that there is no multicollinearity among our variables.
The Distinguishing Characteristics of Gen-Z Voters, Abstainers and Unregistered
In this section, we present the findings of our survey and test our hypotheses. To do so, we compute two binomial logistic regressions: one which predicts non-voting at the 2022 federal election and one which predicts not being registered to vote at that election. We begin by discussing the main differences between Gen-Z voters and non-voters (i.e. both abstainers and unregistered). Table 2 shows the estimated effects of our three sets of explanations on voting behaviour. 9 The first group of reasons concern the socio-economic background of respondents. Here, we find partial support for H1. As we can see, being a student does not affect the likelihood of having voted or not; nor does the perceived economic well-being of one’s family. The latter finding thus counters studies of youth voting in non-compulsory settings which show a positive association between economic standing and voting (Blais and Loewen, 2011). However, the relationship between the occupational status of respondents, specifically unemployment, and non-voting is strong and statistically significant. As expected, Gen-Z citizens who are not working are less likely to have voted in the election. To facilitate the interpretation of this result, we use Model 1 as a basis for calculating the estimated probabilities of a Gen-Z person being a voter or a non-voter depending on their occupational status. We find that unemployed Gen-Z youths are 16 percentage points more likely (64%) not to have voted than those who were working full time (48%), and 8 percentage points more likely not to have done so than those who were working part time (56%). This finding is consistent with the literature examining life-cycle effects on youth voting in non-compulsory systems: namely, having a job is an important milestone that encourages people to participate in elections (Smets, 2016).
Binomial Logistic Regression Predicting Not Having Voted in the 2022 Australian Federal Election.
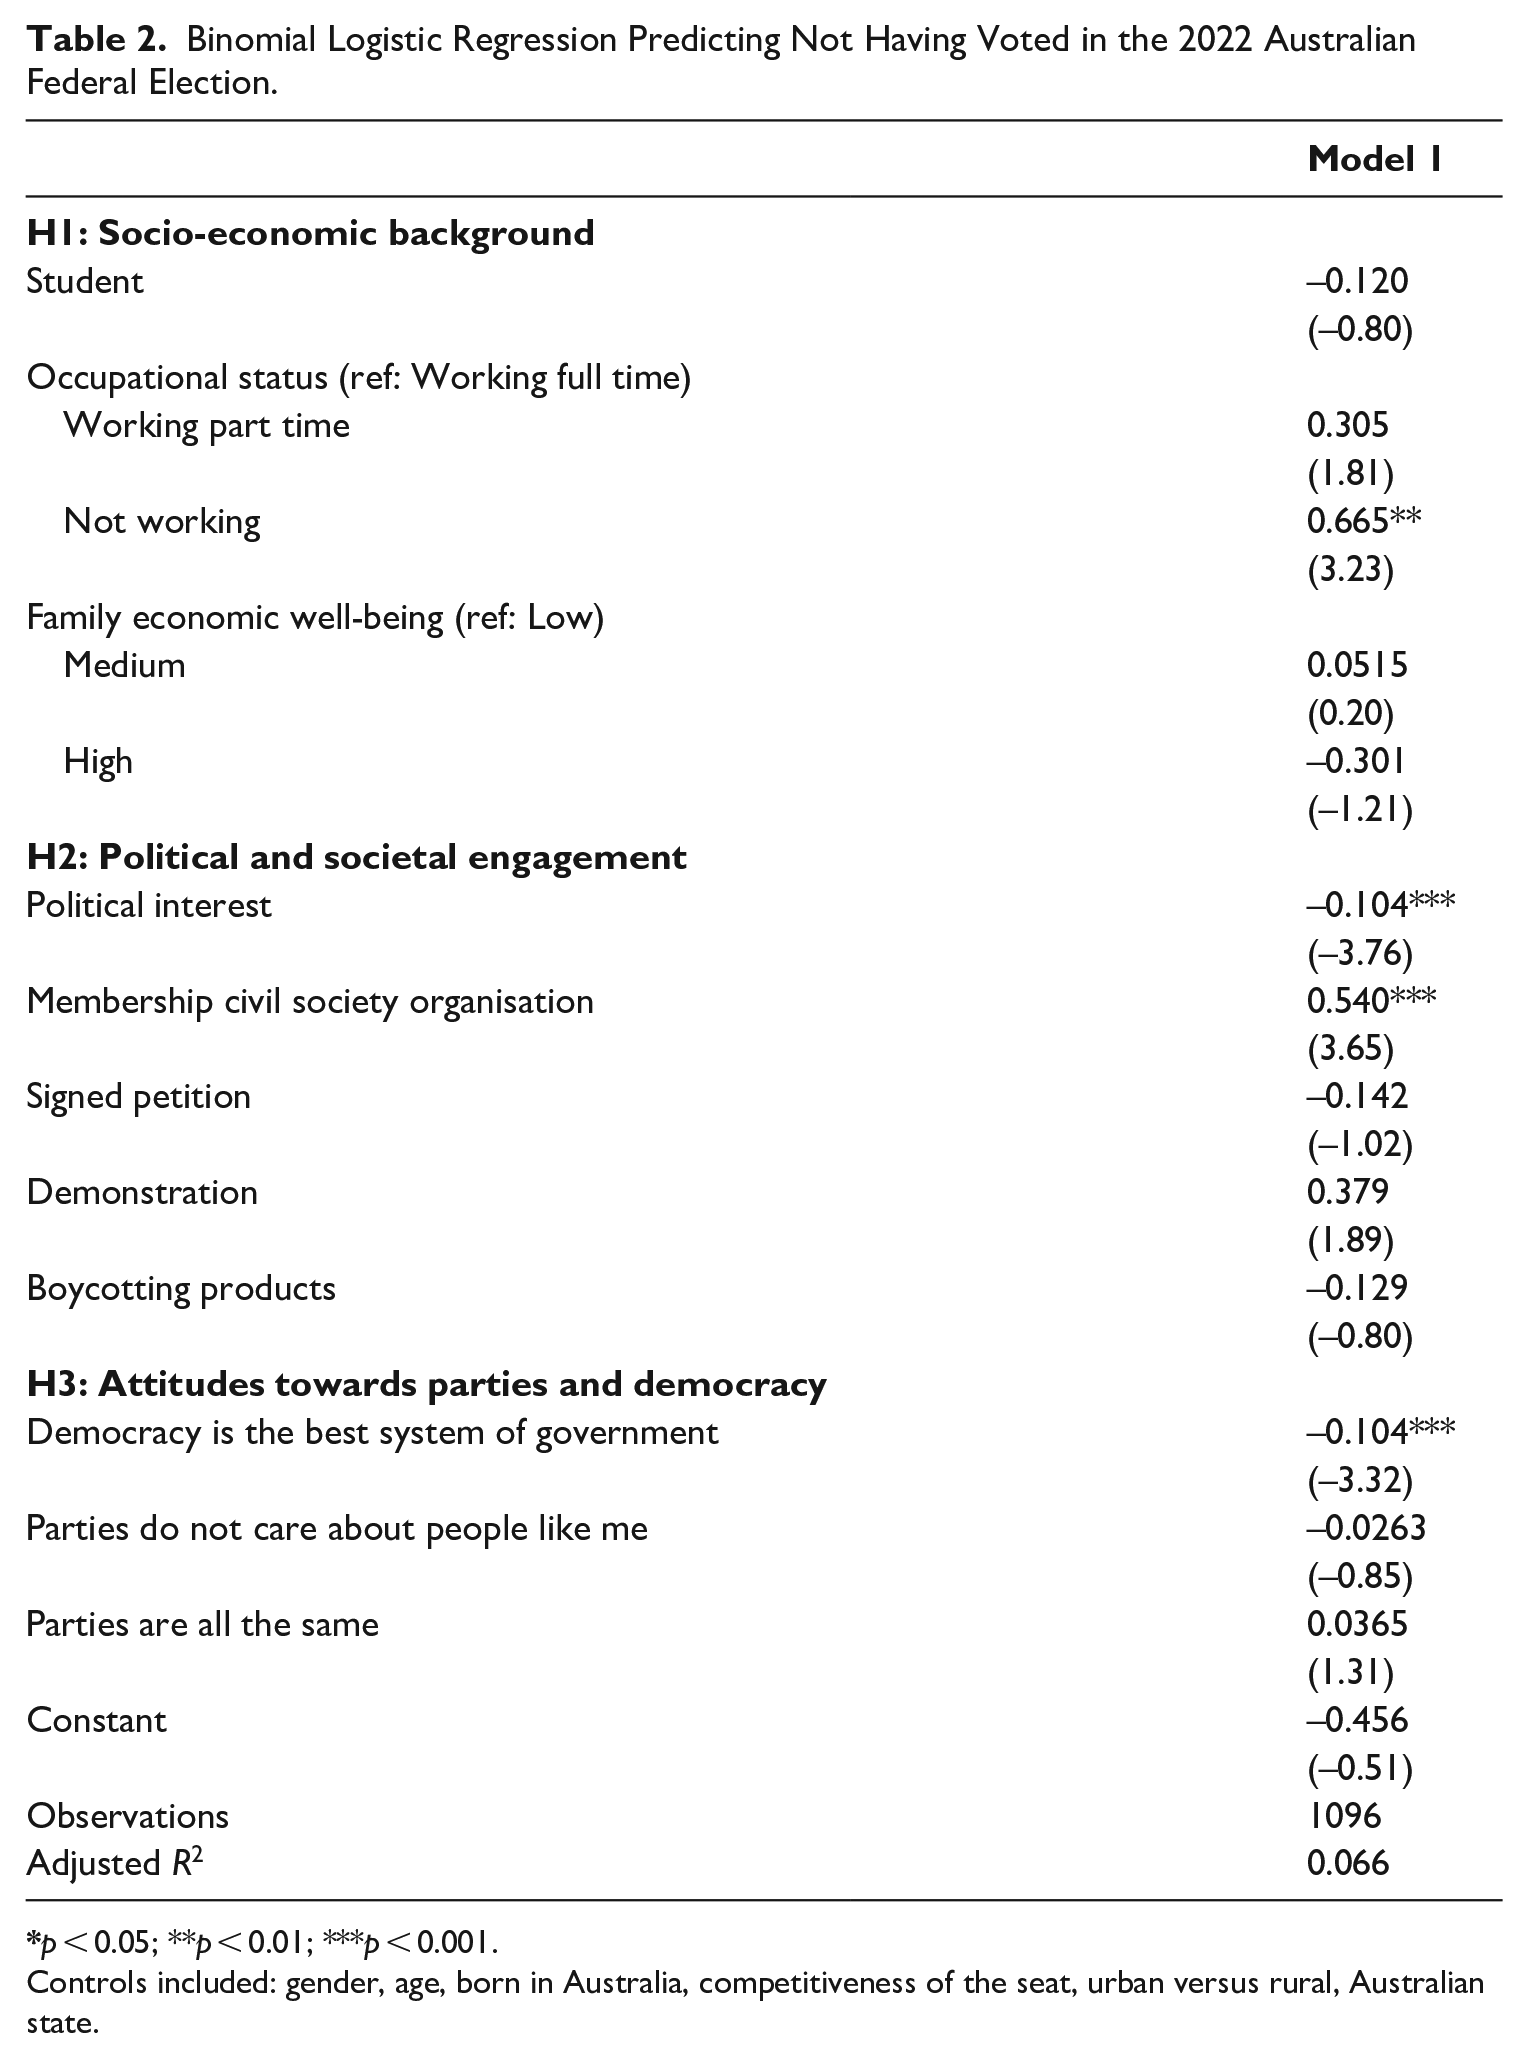
Controls included: gender, age, born in Australia, competitiveness of the seat, urban versus rural, Australian state.
Our second hypothesis investigates the role of political and societal engagement in shaping youth turnout. Here, we get mixed results compared to our expectations. On the one hand, the lower the level of respondents’ political interest, the more likely they are not to have voted. This echoes the conclusions of work on youth political participation in non-compulsory voting countries (Blais and Loewen, 2011; Fieldhouse et al., 2007). On the other hand, we encounter a surprising finding as regards the effects of societal engagement on voting behaviour. Contrary to our expectations, and differently from what Fieldhouse et al. (2007) find in their study of youth voting in Europe, being a member of a CSO is significantly and positively correlated with not having voted in the last federal election. In terms of estimated probabilities, respondents who are members of a CSO are 13 percentage points more likely to be non-voters than voters (63% vs 50%). In other words, while Gen-Z Australian non-voters may be less interested in politics, this does not mean that they are disengaged from society. In addition, there does not seem to be a relationship between participating in elections and participating in other forms of political activities, since the coefficients of the variables measuring signing petitions, boycotting products and attending public demonstrations all fail to reach statistical significance. These findings provide some nuance to studies pointing to young people’s preference for non-electoral political activities over voting (Kimberlee, 2002; Norris, 2004; Sloam, 2016), while also countering the results of Blais and Loewen (2011) which show that, in Canada, these two forms of participation are correlated. The reason behind the latter divergence may lie in the different voting systems that Canada and Australia have (voluntary vs mandatory, respectively). In countries where voting is voluntary, Gen-Z will tend to vote in order to have an impact on the political process, and to maximise this, they may decide to get involved in other ways, for instance by signing petitions or joining protests. By contrast, in countries where voting is mandatory, the reasons why Gen-Z turn out to vote may have little to do with having an impact (as we will see more in-depth in the next section). Consequently, non-electoral participation in these contexts may not necessarily lead to electoral participation.
The third group of motivations we consider are Gen-Z youths’ attitudes towards parties and democracy. Interestingly, we find a clear division between these two sets of attitudes. As shown in Table 2, while Gen-Z Australians who have a negative view of parties are just as likely to be voters as they are to be non-voters, those with a negative view of democracy are significantly more likely to be non-voters. For instance, those who on a 0–10 scale put ‘2’ for their agreement with the statement that democracy is the best system of government are 16 percentage points more likely to be non-voters than those who put ‘8’ (68% vs 52%, respectively). Our results echo those of Fernández Guzmán Grassi et al. (2024), who show that young non-voters in Europe are characterised by more negative attitudes towards democracy. 10 Our findings, however, do not support the idea that young people who opt out of the electoral process are any more disillusioned with parties than their counterparts who vote (see Anderson and Goodyear-Grant, 2008; Cammaerts et al., 2014; Henn et al., 2005). In sum, sceptical views of democracy and of parties do not have the same impact on voting behaviour: Gen-Z Australians who are critical of democracy are less inclined to turn out than those who are critical of parties.
We now turn to the main differences between the abstainers and unregistered. As explained, we expect to find a ‘hierarchy of disengagement’ separating these two groups of non-voters. Accordingly, unregistered respondents should have a lower socio-economic background than abstainers, be less engaged with politics and society, and display more negative attitudes towards democracy and parties. Table 3, however, which shows the estimated effects of our independent variables on the likelihood of not having been registered for the 2022 election, provides little support for these expectations. 11 Two of the three sets of factors do little to distinguish the abstainers from the unregistered. Notably, while political interest and negative attitudes towards democracy were strong predictors of not voting, they are not more prominent among one group of non-voters compared to the other. The remaining set of factors – socio-economic background – does distinguish between the two, but in the opposite direction to our expectations. In particular, the only statistically significant differences between these groups are their student status and their families’ economic well-being. First, being a student is positively correlated with being unregistered. To give an illustration using predicted probabilities based on Model 2, students are 9 percentage points more likely to be unregistered than respondents who are not studying (73% vs 64%, respectively). Second, economic well-being is positively associated with not having registered for the last federal election. For instance, respondents whose families make enough money to save (variable level: ‘High’) are 16 percentage points more likely (69%) to be unregistered than those whose families need help to meet living expenses (53%; variable level: ‘Low’).
Binomial Logistic Regression Predicting Not Having Been Registered for the 2022 Australian Federal Election.
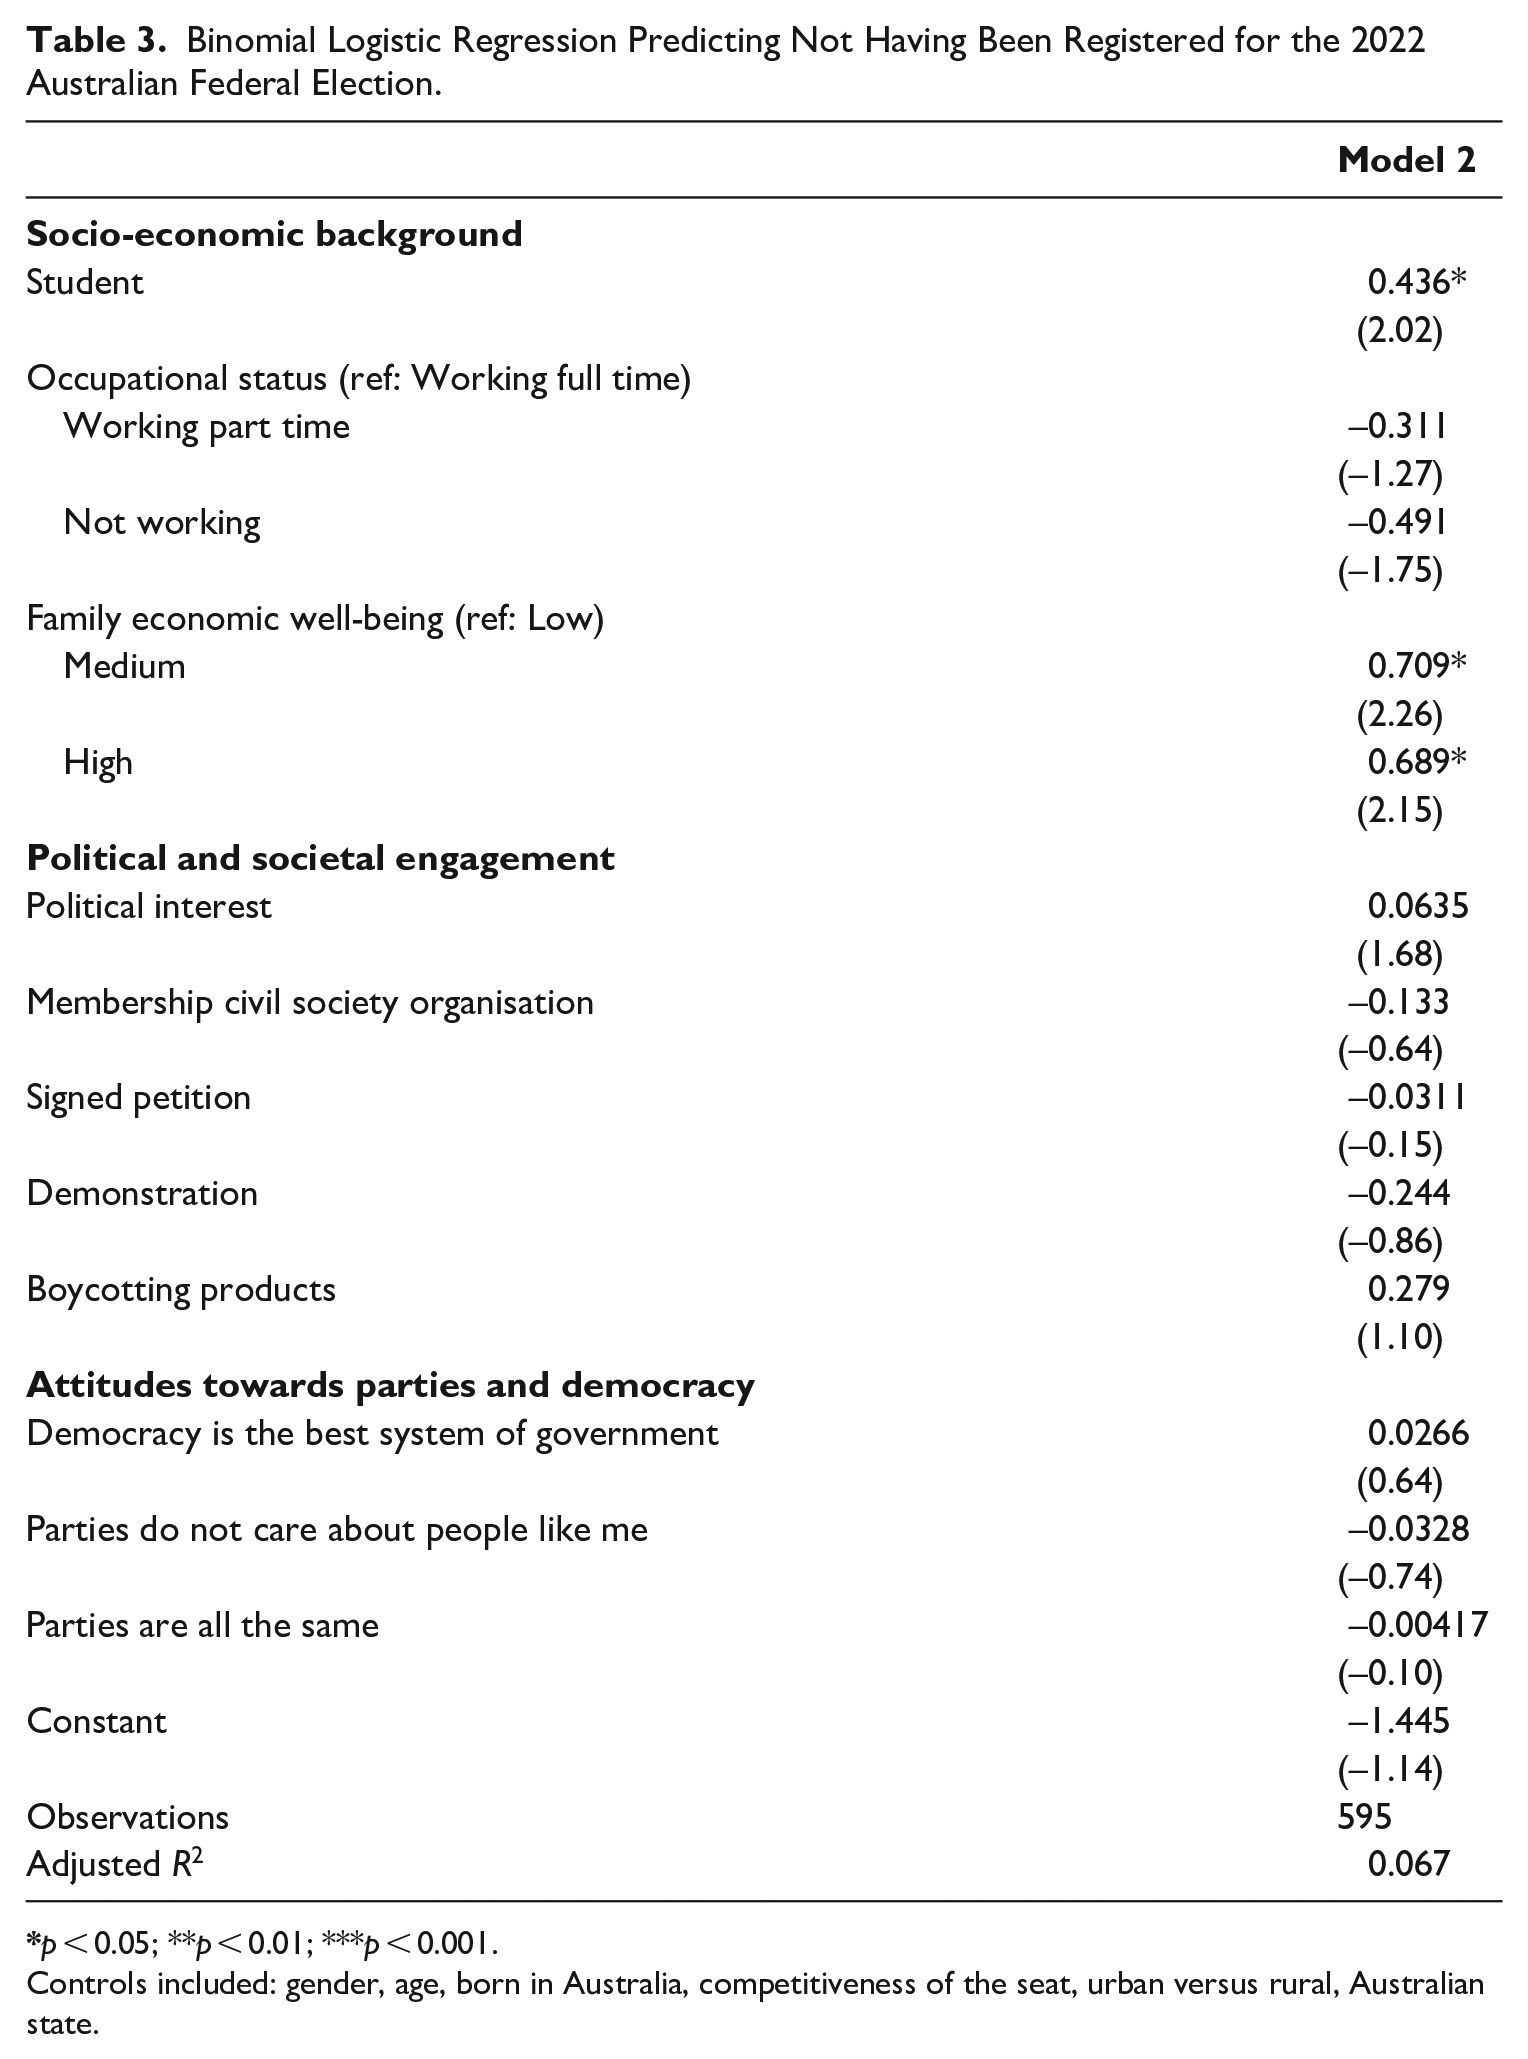
Controls included: gender, age, born in Australia, competitiveness of the seat, urban versus rural, Australian state.
While these results largely run contrary to our expectations, there are some potential explanations. One was flagged in the theory section. Namely, in a compulsory setting, the unregistered person may not necessarily be the most disengaged non-voter, but may be someone who rationally chooses not to register so that they have a better chance of not being discovered, and hence not being fined. Seen from this perspective, the main driver of being unregistered rather than an abstainer may lie not in different societal engagement or political views, but simply in the greater desire to minimise the costs of not voting. As regards our result of students being more likely to be unregistered, this may reflect the fact that students tend to change address more frequently than other young people (in particular, by moving to new cities). If they do not inform the relevant authority once they move into a new electorate, they will not be registered to vote, even if they had been in the past.
To delve further into our typology of voters and non-voters, we also ran stratified binomial logistic regressions to uncover what distinguishes Gen-Z Australian voters, abstainers and unregistered (see Table E2 in the Appendix). In terms of socio-demographic profile, voters tend to be younger, employed and are significantly more likely to have been born in Australia; abstainers tend to be men who are not studying, not working and from families with a low level of economic well-being; and the unregistered tend to be older Gen-Z whose families have a medium level of economic well-being. As for their attitudes, voters have higher levels of political interest than abstainers and the unregistered, and are less sceptical towards democracy. At the same time, abstainers and the unregistered are significantly more likely to be members of CSOs. Ultimately, these results suggest that a ‘hierarchy of disengagement’ does exist but, differently from what we envisaged, abstainers are more disengaged than the unregistered. Finally, we should note there are some similarities among the three groups too. The levels of participation in non-electoral activities of Gen-Z Australian voters, abstainers and unregistered are similar: few of them report having attended a public demonstration or boycotted certain products, while about half say that they had signed a petition (see also Tables B2–B4 in the Appendix). Moreover, they tend to think that political parties do not care about people like them and are somewhat split on the question of whether parties are all the same.
To test the robustness of our findings, we conducted tests for different sub-sets of the sample and model specifications (see Appendix D). First, we re-computed the two models by excluding respondents from one state at a time (Tables D1 and D2). 12 The main results of Model 1 are supported by these sensitivity tests. As for Model 2, the results confirm that there are very few statistically significant differences between abstainers and non-voters, except for their student status and families’ economic well-being (in four out of six models). Second, we re-calculated the two regressions by randomly dropping a percentage of the observations from the analysis (10%, 20%, 25%, 30%, 35% and 40%). In Model 1, the results are the same for all variables apart from the variable measuring occupational status, which ceases to be significant after dropping 40% of the sample. In Model 2, we again find that the key statistically significant differences concern respondents’ student status and the economic well-being of their families. Finally, we ran two alternative models. Following our ‘hierarchy of disengagement’, we created a new ordered dependent variable measuring whether respondents were voters, abstainers or unregistered, and we computed an ordered logistic regression (Table D5). In addition to this, we estimated a multinomial logistic regression (Table D6). Our findings are robust also to these alternative modelling strategies.
Explaining Voting, Abstaining and Not Registering
In order to obtain a more fine-grained picture of Gen-Z Australians’ reasons for voting, abstaining and not registering, we asked respondents to indicate the reasons for their electoral (non-)participation in the 2022 federal election. To do so, we compiled a list of potential reasons drawn from the literature on youth and voting (Cammaerts et al., 2014; Henn et al., 2005; Laughland-Booÿ et al., 2018) and asked respondents to rank the relevance of each with a value ranging from 0 (not at all important) to 10 (extremely important). We considered the item with the highest score as their most important reason for voting/abstaining/not registering. If respondents gave the highest score to two or more items, a follow-up question asked them to indicate the most important of these. Since we are conscious that the self-reporting of motivations can be subject to biases like social desirability, recall errors and post hoc rationalisation (Wilson, 2002), we also ran further analyses to identify which individuals provide motivations that are rooted in (a lack of) political efficacy, political interest and civic duty, and which individuals instead give ‘non-political’ or ‘non-civic’ reasons for their electoral behaviour. These can be found in Table E3 in the Appendix and are discussed below.
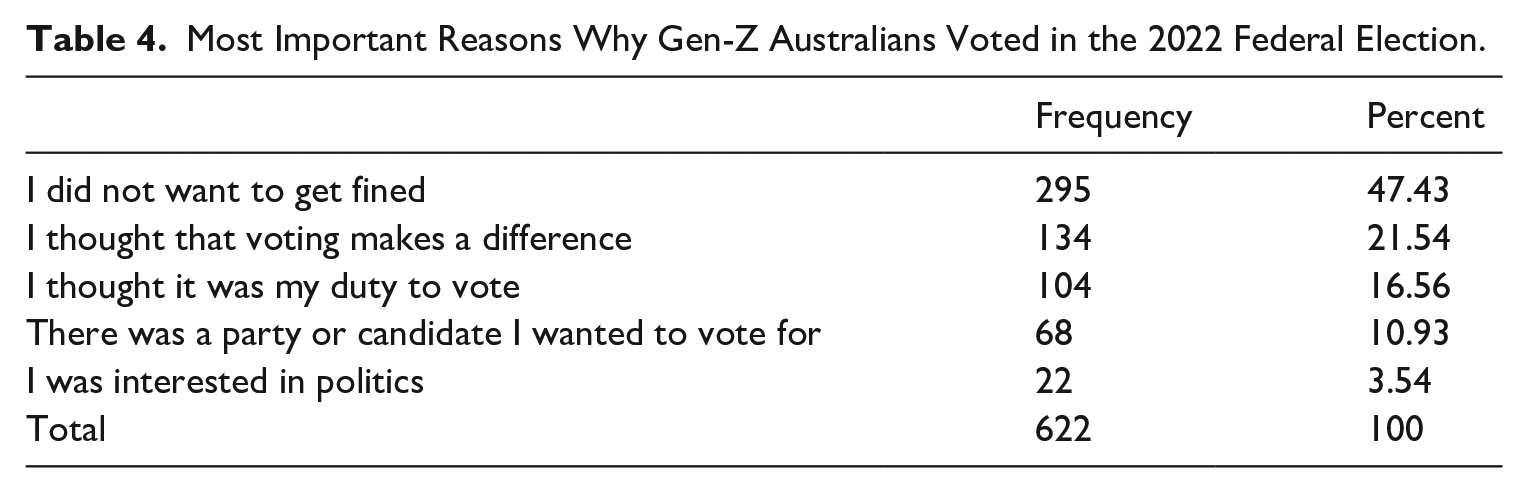
In this section, we report the descriptive findings for our three groups. We begin with the motivations of voters, which Table 4 displays in order of importance. Strikingly, over 47% of Gen-Z Australians who voted in 2022 say they did so primarily in order not to get fined. This underlines how even modest financial penalties can be a powerful incentive to cast a ballot. Further supporting this conclusion, our survey also revealed that only one-third of Gen-Z voters would definitely have voted in 2022, had it not been compulsory (see Table E4, Appendix E). Beyond fearing financial penalties, the next most important drivers of voting for Gen-Z Australians were two ‘civic’ motivations: voting makes a difference (over one in five respondents) and voting is a duty (around one in six). The latter result is noteworthy, since a sense of civic duty is usually considered a key motivation for turning out among young people (Daoust and Feitosa, 2016; Fieldhouse et al., 2007; Martin, 2012). Finally, although we saw in Table 2 that Gen-Z voters are characterised by higher levels of political interest than their non-voting counterparts, only a small proportion cited political interest as the most important reason for turning out. Table E3 in the Appendix reveals that, as one would expect, respondents who said they voted because they did not want to get fined are significantly less interested in politics than those who gave civic or political justifications. Notably, they are also more likely to live in regional areas.
Most Important Reasons Why Gen-Z Australians Voted in the 2022 Federal Election.
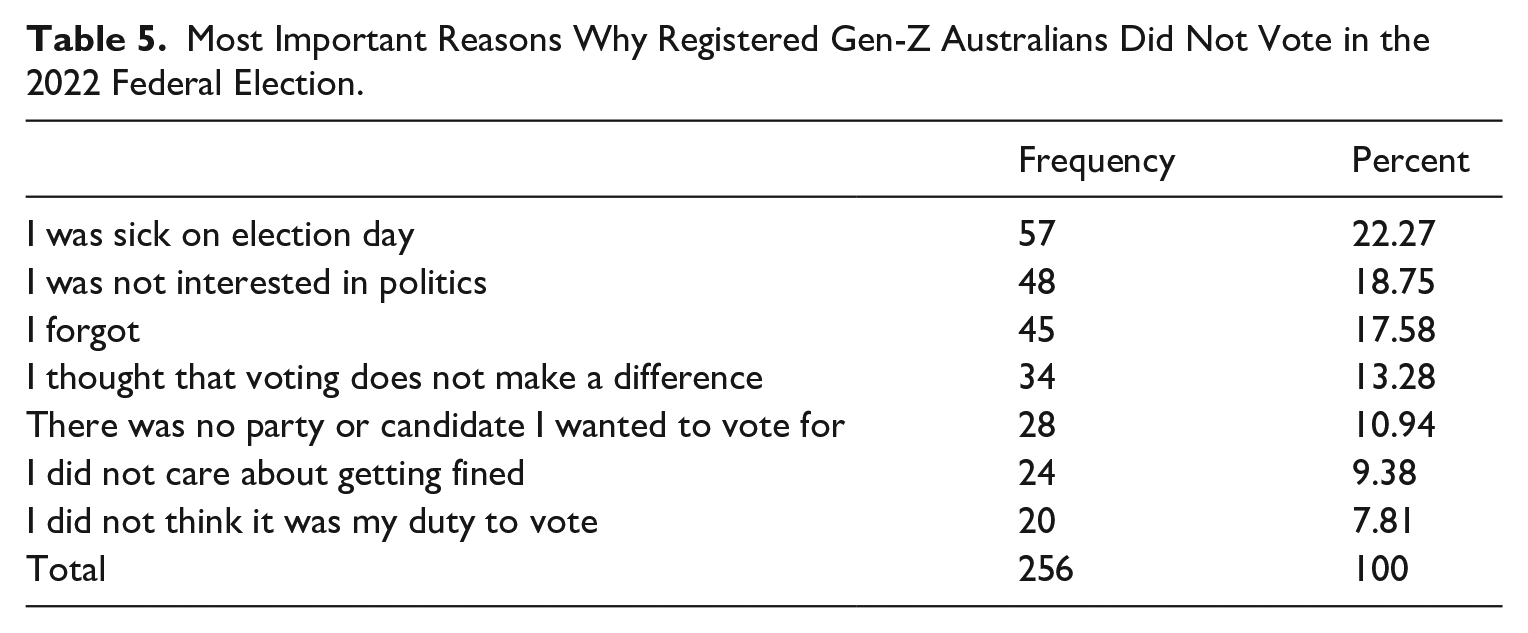
Moving on to the abstainers, Table 5 shows their main motivations for not voting. The most frequently cited reason was having been sick on election day (over one in five respondents), suggesting that some social desirability bias might have been at play. In addition, over 50% of abstainers attributed their choice to a sense of disengagement either from the whole political process or from parties and politicians specifically. These individuals tended to display significantly lower levels of political interest than other abstainers (see Table E3). In addition to these explanations, about a quarter of respondents justified their behaviour by saying that they forgot they had to vote, or that they did not care about getting fined.
Most Important Reasons Why Registered Gen-Z Australians Did Not Vote in the 2022 Federal Election.
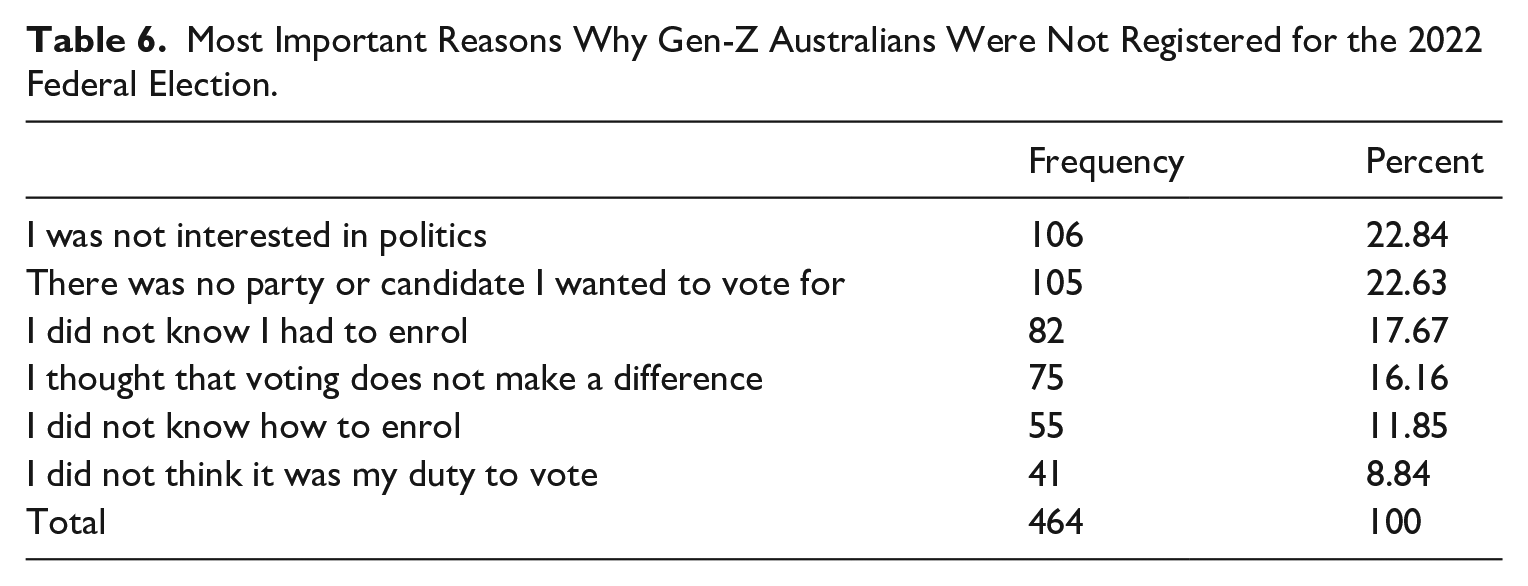
Finally, Table 6 below displays the most important motivations for not registering to vote in the 2022 election. While the leading reason for these respondents is their lack of interest in politics, what is most striking is that about 30% blamed their failure to register on a lack of knowledge. Specifically, over one in six said they did not know they had to enrol, and over one in eight said they did not know how to enrol. Table E3 indicates that these people are significantly younger than the other unregistered. This suggests there is a section of (very) young people that the Electoral Commission is failing to inform about their obligations and how to fulfil them. As for the remaining motivations, it is noteworthy that, compared to the abstainers, approximately double the proportion of unregistered respondents stated that there was no one they wanted to vote for (11% vs 23%, respectively). By contrast, the proportions of those saying they did not feel a duty to vote or that they thought voting does not make a difference were similar within the two groups of non-voters. It thus appears that the unregistered perceive themselves as more distant from the electoral competition because they do not feel represented by those contesting it. In fact, respondents who attributed their choice to ‘civic’ or ‘political’ reasons were less politically interested than the rest, and more likely to believe that parties are all the same (see Table E3). Nonetheless, and reinforcing the impression that a lack of information underpins failing to register, over 84% of the unregistered respondents reported that they intend to vote at the next election – 12 percentage points more than the proportion of abstainers who said likewise (see Table E5, Appendix E).
Most Important Reasons Why Gen-Z Australians Were Not Registered for the 2022 Federal Election.
Conclusion
In this article, we have looked at what young people do when they are obliged to both register and vote. Based on a nationwide survey of about 1500 Gen-Z Australians, we found that non-voters are more likely not to be working, are less politically interested and are less enthusiastic about democracy. However, they are also more likely to be members of CSOs and they do not view political parties more negatively than Gen-Z youths who vote. When we looked specifically at the two types of non-voters – abstainers and unregistered – we found few significant differences between them, beyond some aspects of their socio-economic background. Our results thus indicate that, overall, material resources are the main discriminant among Gen-Z voters, abstainers and unregistered. Finally, when we asked our three groups to explain their decisions, we uncovered a number of striking findings: first, almost half of Gen-Z voters said the main reason they turned out was because they did not want to be fined; second, around 3 in 10 of the unregistered attributed their failure to register to a lack of knowledge about the process.
Our findings have a number of implications for studies of youth political participation in democracies. First, our research underlines that young people who do not vote are not necessarily more disengaged from society than those who do vote. While this may sound like good news, the less cheerful reality it is that the reason we do not find major differences in terms of attitudes towards parties is not because of widespread enthusiasm for them, but because young voters are just as sceptical as young non-voters about the extent to which parties care about them and offer distinct platforms. This interpretation is supported by the fact that only around 1 in 10 Gen-Z Australian voters said they turned out because they wanted to support a specific candidate or party. Hence, our study speaks to broader international research on youth disillusionment with party politics (Cammaerts et al., 2014; Henn et al., 2005; Pickard, 2019). As we show, beneath the rosy veneer of high youth turnout created by compulsory voting in Australia lies the same disenchantment with political parties as found across the Global North. Additional studies into youth voting in compulsory systems could delve further not only into how young people perceive parties but also how parties present themselves to young people and how they try to get them to vote. After all, since parties in countries like Australia do not feel the same pressure to ‘get out the vote’ as their counterparts in voluntary systems, they may neglect efforts to encourage young people to register and vote in the same way, for example, as the Democratic Party and its affiliates in the United States have historically done.
Second, our study is the first to focus on the electoral behaviour in a compulsory setting of Generation Z citizens. Of course, ours is a one-case study of a system that is more stringent than other compulsory ones. It would therefore be interesting to examine Gen-Z voting both in other compulsory cases which enforce penalties such as Uruguay, and in those that are more relaxed about it, like Belgium (Singh, 2021: 19–21). This would help us to further unpack the dynamics of voting among Gen-Z citizens and understand better the interaction of electoral structures and youth agency in the decision to participate. It would also be useful to conduct studies of Gen-Z voting and non-voting over several elections, given that non-voters in a specific election may be serial non-voters or may have just missed that particular election for various reasons (Sigelman et al., 1985). Relatedly, our typology of voters, abstainers and unregistered should be of use to researchers conducting fine-grained analysis of non-voting (both among Gen-Z and older generations). For example, it would be interesting to see if, unlike what we found in Australia, Gen-Z abstainers and unregistered in other compulsory and voluntary systems are differentiated by additional factors beyond their socio-economic background.
Third, our study underlines how information matters. The fact that so many of our survey respondents who did not register to vote in 2022 admit that this was due to ignorance is striking, especially in a country where the Electoral Commission has invested a lot over the past decade to raise youth enrolment and turnout. While those campaigns have led to increased numbers of young people voting, they are still failing to reach some sections of the youth population. On this point, it is interesting to note that the AEC did not set up a TikTok account during the 2023 ‘Voice’ referendum campaign, 13 despite having been repeatedly encouraged to do so by TikTok. 14 This seems particularly relevant, given the finding of Andersen et al. (2021: 135) that Gen-Z and Baby Boomers are the two generations most mobilised politically by their news media use and social media exposure. Further research could investigate the dynamics by which Gen-Z youths remain unaware of the basic requirements of voting, for example by conducting focus groups with those who have fallen through the enrolment net.
Finally, our study speaks to the wider debate about the effects of compulsory voting on democratic participation and representation, especially as regards the younger generations. In his study of declining youth turnout in the United States, Wattenberg (2024: 172) concludes that, having assessed all other proposals to reverse the trend, ‘compulsory voting appears to be the only definitive answer to the problem’. Our findings support this and suggest that making voting an obligation – and imposing modest financial penalties for not doing so – have a considerable effect on many young people. In the case of Australian federal elections, the fine is only $20 AUD, equivalent to around $13 USD, 12 Euro or roughly three Big Macs in Australia at the time of the election. And yet, at least according to our voting respondents, this was sufficient to get many of them to the ballot box. In countries like the United Kingdom and the United States where policymakers have long been concerned about the lower registration rates and/or turnout of young people, introducing the Australian model would be an efficacious, albeit controversial, remedy. The costs of imposing voting on the population are seen by some as excessive, but the benefits in terms of ensuring that young people participate in the electoral process (and continue to do so as they get older) may outweigh these. Moreover, even though the link between descriptive and substantive representation is not necessarily straightforward, it is likely that, if young people voted in greater numbers, politicians would take their short- and long-term needs more into consideration. Ultimately, this would provide for more representative democracies.
Supplemental Material
sj-docx-1-psx-10.1177_00323217251314603 – Supplemental material for Young Voters, Abstainers and Unregistered: Generation Z Turnout in a Compulsory System
Supplemental material, sj-docx-1-psx-10.1177_00323217251314603 for Young Voters, Abstainers and Unregistered: Generation Z Turnout in a Compulsory System by Sofia Ammassari, Ferran Martinez i Coma and Duncan McDonnell in Political Studies
Footnotes
Acknowledgements
We would like to thank the members of the ‘People, Elections and Parties’ research group of the Centre for Governance and Public Policy (CGPP) at Griffith University – Sarah Cameron, Fernando Feitosa, Max Grömping, Lee Morgenbesser and Francesco Vittonetto – as well as the participants of the 2024 AusPSA Youth and Politics workshop in Brisbane for their extensive feedback on previous drafts of this article. We owe a special word of thanks to Shaun Ratcliff from Accent Research for his work on conducting the survey.
Declaration of Conflicting Interests
The author(s) declared no potential conflicts of interest with respect to the research, authorship, and/or publication of this article.
Funding
The authors received financial support for the survey from the Centre for Governance and Public Policy at Griffith University.
Supplementary Information
Additional Supplementary Information may be found with the online version of this article.
Appendix A – Further information on case selection and method
Table A1. Number of democracies (2000–2020) by type of election registration and voting participation.
Appendix B – Descriptive statistics
Table B1. Descriptive statistics of the full sample.
Table B2. Descriptive statistics of the sub-sample of voters.
Table B3. Descriptive statistics of the sub-sample of abstainers.
Table B4. Descriptive statistics of the sub-sample of unregistered.
Appendix C – Full models
Table C1. Binomial logistic regression predicting not having voted in the 2022 Australian federal election.
Table C2. Binomial logistic regression predicting not having been registered for the 2022 Australian federal election.
Table C3. Binomial logistic regressions predicting not having voted in the 2022 Australian federal election, following the logic of the funnel of causality.
Table C4. Binomial logistic regressions predicting not having been registered for the 2022 Australian federal election, following the logic of the funnel of causality.
Appendix D – Robustness checks
Table D1. Binomial logistic regressions predicting not having voted in the 2022 Australian federal election, excluding respondents from one state at a time.
Table D2. Binomial logistic regressions predicting not having been registered for the 2022 Australian federal election, excluding respondents from one state at a time.
Table D3. Binomial logistic regressions predicting not having voted in the 2022 Australian federal election, randomly dropping observations from the sample.
Table D4. Binomial logistic regressions predicting not having been registered for the 2022 Australian federal election, randomly dropping observations from the sample.
Table D5. Ordered logistic regression predicting electoral disengagement in the 2022 Australian federal election.
Table D6. Multinomial logistic regression predicting electoral (dis)engagement in the 2022 Australian federal election.
Appendix E – Further information mentioned in the main text
Table E1. OLS regressions predicting agreement with the statement ‘Democracy is the best system of government’.
Table E2. Stratified binomial logistic regressions predicting voting, abstaining and not having registered in the 2022 Australian federal election.
Table E3. Binomial logistic regressions predicting voting, abstaining and not having been registered for the 2022 Australian federal election because of civic/political reasons.
Table E4. Proportions of Gen-Z Australian voters who would still have voted in the 2022 Australian federal election if voting had not been compulsory.
Table E5. Proportions of Gen-Z Australians who intended to vote at the next election.
Notes
Author Biographies
References
Supplementary Material
Please find the following supplemental material available below.
For Open Access articles published under a Creative Commons License, all supplemental material carries the same license as the article it is associated with.
For non-Open Access articles published, all supplemental material carries a non-exclusive license, and permission requests for re-use of supplemental material or any part of supplemental material shall be sent directly to the copyright owner as specified in the copyright notice associated with the article.