
Abstract
Voters are affected by cues from their immediate social environment. One of these cues consists of the political opinions available and accepted in people’s neighbourhoods, which are theoretically expected to affect vote choices through direct or indirect forms of communication. We test this assertion by employing a longitudinal design combining fine-grained geo-coded panel data with election results on a uniquely local level in the Netherlands. We assess the effect of the level of support for parties in a neighbourhood (consisting of just 624 households on average) on the vote choices of individuals 5 years later, while controlling for their previous vote choice. We find that the political preferences of neighbours indeed affect respondents’ subsequent vote choice, but only for those voters who feel strongly embedded in the local community. We conclude that, even in the highly fragmented Dutch context, the political choices of citizens can be influenced by neighbourhood effects.
Introduction
In this study, we assess whether electoral decisions of individual voters are affected by the political preferences of citizens in their neighbourhood. Scholars have argued for a long time that electoral decisions are influenced by the political preferences of others in voters’ social environment (e.g. Cox, 1969; Festinger, 1962). Various scholars have produced evidence of effects of the immediate social context on voting decisions. This has been shown for various contexts such as church congregations (e.g. Huckfeldt and Sprague, 1995), the workplace (e.g. Mutz and Mondak, 2006) and neighbourhoods (e.g. Johnston et al., 2004, 2005; Johnston and Pattie, 2006; MacAllister et al., 2001). However, the authors of these studies of neighbourhood effects on electoral behaviour explicitly point out that alternative explanations are feasible, in particular geographical sorting of people with like-minded electoral preferences. People may choose to move into areas with like-minded people (e.g. Bishop, 2008; Gallego et al., 2016). Another possibility is that people cluster in areas with similar socio-economic backgrounds. To the extent that these factors are related to partisan preferences, these party preferences could align, even if people do not influence each other. Recently, some studies have attempted to study the effects both ways: people moving into like-minded areas and people being influenced by others in the area where they live (Bishop, 2008; Gallego et al., 2016; Maxwell, 2019). These recent studies all conclude that the effect is mostly the result of sorting.
While we do not want to deny that geographical patterns in the popularity of parties is partially or even largely the result of geographical sorting, we argue that data limitations of previous studies made it very unlikely that they could have found neighbourhood effects if these existed. This is due, first of all, to scale. As testified by the literature on other political context effects, scale matters (Van Gent et al., 2014; Van Wijk et al., 2020). Gallego et al. (2016) estimate contextual effects at the level of electoral districts in the UK, which on average have almost 70,000 inhabitants. Similarly, Bishop’s (2008) analyses are at the level of US counties, geographical units that are probably too large for observing ‘neighbourhood effects’, as pointed out by Rohla et al. (2018). By contrast, Johnston et al. (2004, 2005) do rely on small geographical units in their study of neighbourhood effects in Britain. However, they lack information about the distribution of political preferences in these neighbourhoods, so that they have to rely on socio-demographic proxies instead. The same is true for David and Van Hamme (2011) in their study of Belgium. Furthermore, the cross-sectional design of these studies cannot fully rule out the possibility that confounding factors are shaping a correlation between the preferences of individuals and their environments. Martin and Webster (2020) provide support for the existence of neighbourhood effects by focusing on electoral change at the aggregate level (of electoral districts). Even though their results are plausible, they cannot fully rule out the possibility that changes in the composition produce the relations that they find.
So, while it seems plausible that people might be influenced by their neighbours, existing research seems to lack the kind of data needed to provide a firm test of neighbourhood effects. The main contribution that we make in our study is that we are able to demonstrate the existence of neighbourhood effects in the unlikely case of the Netherlands. We employ a unique dataset: a geo-coded panel survey, which covers two national elections. The panel data contain information about the party respondents voted for in two subsequent elections, thus reducing the range of potentially confounding factors, most notably those stemming from geographical sorting. We also have accurate information on the election results in the neighbourhood at the previous election. These neighbourhoods have 1379 inhabitants (624 households) on average, which is a sufficiently small scale to plausibly involve some degree of direct or indirect political communication between the citizens living there. These panel data enable us to assess whether people are more likely to switch to a party that is supported by many people in their neighbourhood, or are more likely to abandon a party that receives little support. Finally, in line with Johnston et al. (2005), we use respondents’ (subjective) level of attachment to the neighbourhood as a moderator. We find clear effects, but particularly among voters who say that they feel (strongly) attached to the neighbourhood. Our findings thus lend strong support to the idea that the views and preferences of voters’ social context provide a heuristic which affects their party preferences. The fact that neighbourhood attachment is such a strong moderator is clearly consistent with this idea. The heuristic works best for those who feel attached to their neighbourhood.
It is important to understand the role of neighbourhoods in shaping vote choices. First of all, regional variation in the popularity of parties has been explained mainly by a combination of socio-structural conditions and individual background characteristics. Our study demonstrates that success as well as failures of parties in specific regions can be self-reinforcing. Once a party has become popular in a neighbourhood, more people are likely to switch to that party and switch away from unpopular parties. Second, some American scholars have expressed concern about the increasing concentration of the like-minded as a factor causing polarization and harming interparty understanding (Bishop, 2008; Iyengar et al., 2019). This ultimately rests not only on selection but also the homogenizing effect neighbours allegedly have on each other.
The Netherlands is in several ways a least likely case for observing neighbourhood effects. It is a country with relatively limited regional variations in the popularity of parties and, as a result of its highly proportional system, there are hardly any neighbourhoods in which one party had an absolute majority. In a two-party system, the party that has the support of a majority of the voters is in a good position to provide hesitating voters with strong cues about the preferences of the majority of the people in the neighbourhood. In such contexts, neighbourhood effects can be expected to be stronger. So, the fact that we find clear neighbourhood effects in the Dutch context suggests to us that it will probably exist in other countries as well.
Theory
After American elections, political geographers draw up maps of the Republican versus Democratic support in different areas of the country. These maps visualize how political preferences are clustered geographically. These patterns inspired research focusing on the socio-economic characteristics of local contexts and how these affect the party political preferences of the people who live there. The electoral success of radical right populist areas in certain areas of Western European countries has inspired similar studies into the ‘geographies of discontent’ (e.g. Harteveld et al., 2022; Iglesias-Pascual et al., 2022; Rydgren and Ruth, 2013). In this study, we do not focus on specific parties, nor do we focus on the influence of the local socio-economic context. Instead, we focus on the most direct kind of neighbourhood effect on party choice: does the popularity of a party in a neighbourhood spill-over to other people living in the same neighbourhood.
The idea behind this is plain and simple. People are social animals. As a consequence, they are sensitive to be influenced by people they like and trust. This goes for all sorts of aspects of their lives, such as their taste in clothing, movies, music and books, their basic values, their religious beliefs, the football team they support – and, likely, their political party preferences. The more strongly felt some of these attitudes are, the less likely these are to change as a result of the influence of others. Some people have stable political party preferences, while others may be more likely to switch and thus to be influenced by people in their direct social environment.
It is plausible that ‘individuals are influenced by the nature of the politically relevant information circulating within their social networks, many of which are spatially constrained to their local area’ (Pattie and Johnston, 2000: 41). Apart from providing shared experiences (i.e. all residents react to building a nuclear plant in the neighbourhood) or formal institutions (local unions or newspapers), neighbourhoods can also shape political preferences through a ‘conversion by conversation’ or ‘informal interaction’ mechanism (Books and Prysby, 1999). In other words, ‘people who talk together vote together’ (Johnston and Pattie, 2018; Miller, 1977: 65).
Besides the direct effect of conversion through conversation, the social environment might influence individuals in a number of indirect ways. First, if the support for a specific party is high in a particular neighbourhood, people who live in that neighbourhood will be more likely to receive positive signals about that party. In addition to direct personal communication, there is the possible effect of visual imageries like posters, billboards and flyers. To the extent that someone is sensitive to such signals, one may acquire a more positive impression of that party and hence become more likely to support it. Second, the sheer fact that many people in a neighbourhood support a political party, might signal to other individuals that this party is attractive. So, when election results are published and people become aware that many people in their neighbourhood supported a certain party, this is a positive signal, which might drive some voters towards this party.
Third, when a party is socially stigmatized, some voters who agree with a party on substantive grounds may still not be willing to support it (e.g. Harteveld et al., 2019). Examples of parties with a social stigma are in particular some parties at the far right or far left. When many voters in your neighbourhood support such a party, this signals to people in this neighbourhood that there really is no social stigma. So, voters who would otherwise not support the party, even if they would largely agree with it, may now no longer experience any impediment against supporting it.
In sum, we have laid out four related mechanisms by which high support in a neighbourhood could make a party more attractive to other voters who live in that neighbourhood, one direct effects and three indirect effects. All mechanisms can be expected to work in the opposite direction in the case of low support for a party in that neighbourhood. Citizens who live in that neighbourhood are more likely to hear negative comments, the low support for the party sends a negative signal, and low neighbourhood support could reinforce the feeling that a party is stigmatized. So, on the basis of earlier research on neighbourhood effects (e.g. Johnston et al., 2004, 2005; Johnston and Pattie, 2006, 2018; MacAllister et al., 2001), we hypothesize the following:
H1. The larger (lower) the aggregate support for a party in a neighbourhood at t–1 the higher the likelihood of citizens who live in that neighbourhood to switch towards (away from) that party between t–1 and t.
We will refer to H1 as the ‘neighbourhood effect hypothesis’. H1 is predicted by each of the causal mechanisms discussed earlier. Yet, not all mechanisms can be expected to operate within the same geographical scope. The direct effect of ‘conversion through conversation’ requires people to discuss politics with their neighbours. We do not know whether many people do this, but even then, we would need to focus on the immediate neighbourhood in which people live to realistically expect any kind of effect. Yet, more indirect forms of communication (like billboards and posters), as well as cues that people take from election results, could also exert an effect in larger geographical areas. While we cannot establish these mechanisms with certainty, we gauge their plausibility by testing whether the neighbourhood effects are stronger when defining smaller rather than larger geographical units as the basis for estimating these effects. By gauging whether effects are strongest when predicted by political preferences in the immediate vicinity rather than in a larger area, we will be able to assess whether it is plausible that the observed effects are produced by the direct mechanism of ‘conversion through conversation’, or by more indirect forms of communication.
In addition, we will test whether any asymmetries exists in the neighbourhood effect caused by (relatively) low versus (relatively) high support for a party in a neighbourhood. Relatively low support in a neighbourhood could be an obstacle that prevents citizens from voting for a party they would otherwise support. High support in a neighbourhood could be an extra stimulus to also support that party. We will explore whether an asymmetry exists, but we have no convincing theoretical reasons to expect the positive effect of high support for a party to be stronger than the negative one of low support or vice versa.
We now turn to a possible moderator of neighbourhood effects: the ties that voters have to other people in the neighbourhood (Cox, 1969). As Johnston et al. (2005: 1444) put it: if local social interaction is the core process involved in the production of neighbourhood effects – which is assumed in many studies although demonstrated in very few [. . .] – research is needed which establishes that people who interact with their neighbours vote with them, irrespective of their individual characteristics.
They subsequently show that neighbourhood effects are indeed larger among people with more ‘neighbourhood social capital’, measured as attachment to and ties with the neighbourhood. So, following this reasoning of Johnston et al. (2005), we hypothesize the following:
H2. The neighbourhood effect (expected under H1) is strongest among those most embedded in their neighbourhood (interaction effect).
This expectation follows from both the direct and indirect mechanisms. 1 If neighbourhoods affect attitudes through direct exposure and conversation, this should be especially the case among those most strongly embedded in their neighbourhood. After all, these people are more likely to interact with their neighbours than others. Yet, even if the effect is more indirect, that is, if people are affected by other cues that they receive about the preferences of their neighbours, we also expect a stronger effect among those who are most embedded in their neighbourhood. This is because these people are more likely to be influenced by the cues about the preferences of their neighbours. So, if there really is an effect of preferences of neighbours on preferences of others living in the same neighbourhood, we expect these effects to be strongest among those who are most embedded (H2). 2
In short, we study whether the political views citizens encounter in their neighbourhood inspire them to align themselves with those (H1), especially if they feel strongly attached to their neighbourhood (H2). In addition, we are interested to know if these patterns are stronger when studied on a fine-grained local level (in which actual conversation is likely) than on a larger scale such as entire districts or municipalities (which would point to more indirect ways of conversion). Finally, we study whether there is an asymmetry in the positive effect of high support, versus the negative effect of low support in a neighbourhood.
The Netherlands: An Unlikely Case
Our study takes place in the Netherlands. Due to the availability of fine-grained macro level data, this country has frequently been the object of studies into neighbourhood effects on political outcomes, in particular when it comes to support for the populist radical right (Harteveld et al., 2022; Van Gent et al., 2014; Van Wijk et al., 2020). When it comes to observing the hypothesized neighbourhood effects of local political preferences on vote choice, we argue the Netherlands is an unlikely case. However, the Netherlands has a very proportional party system and most Dutch citizens do not have a single party that they deeply identify with. While it is quite rare for voters to switch between ideologically dissimilar parties, Van der Meer et al. (2012: 340) show on the basis of a multi-wave panel study that 52% of the Dutch voters switched their vote intention at least once over the course of a 4-year period. So, while ideological predispositions may be rather stable, Dutch voters switch often between parties, which makes them sensitive to social influences.
However, the nature of the cues about parties is very different in Dutch neighbourhoods compared to systems with two or three (dominant) parties. This is visible in Figure 1, which is based on our dataset of the 2017 national legislative election results per neighbourhood (see description below). First, the existence of a plethora of small to medium-sized parties 3 ensures that in few neighbourhoods one party clearly dominates the others. In fact, in only 1.8% of the neighbourhoods in our dataset a single party managed to obtain a majority of the votes. Support for the largest party usually hovered between 20% and 40%. Conversely, the fractured nature of the party system also means there is that most parties have at least some support almost everywhere: the eight largest parties obtained votes in all but 1.8% of the neighbourhoods. So, in contrast to voters in two-party systems, Dutch voters are hardly ever surrounded by overwhelming support for a specific party. Since most people receive ambiguous cues about the party preferences of others living in their neighbourhood, the Netherlands is an unlikely case for observing neighbourhood effects.
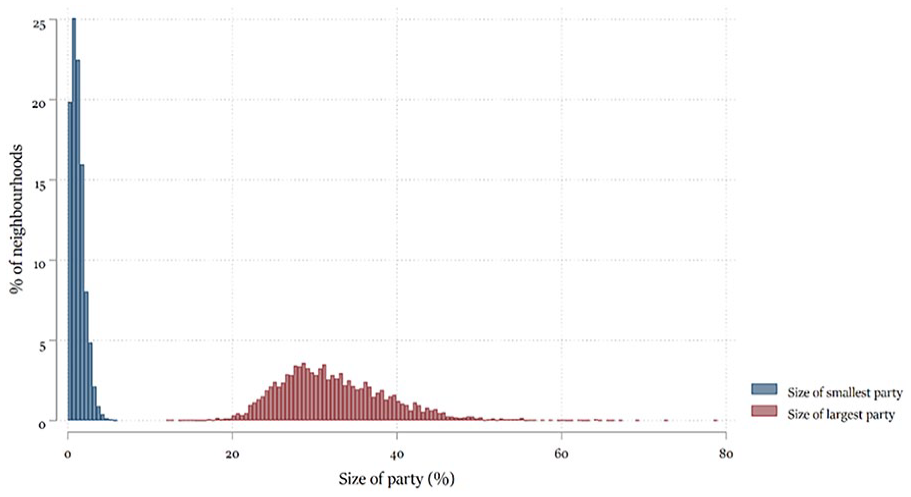
Distribution of Support for the Smallest and Largest of the Eight Nationally Most Important Parties in a Neighbourhood (2012).
Data and Methods
Data
In this study, we employ individual-level survey data, collected in April to May 2017 immediately after the national elections held on 15 March as part of the SCoRE project (see https://www.score.uni-mainz.de). The sample was drawn from a pre-existing standing panel of the company GfK, which enabled us to retrieve the vote choice of the majority of the respondents in our data in 2012. The data contain a geocode which allows us to establish in which neighbourhood the respondent lives. The neighbourhood (buurt) is the smallest of the area classification used by Statistics Netherlands, with an average population size of 1379 (on average 624 households). To assess whether patterns hold using larger areas, we replicate the analysis using districts (wijk, average population size around 6000) and municipalities (gemeenten, average population size of 43,000). The data on election results in the same area in 2012 are derived from the Dutch Electoral Council (Kiesraad). These data consist of aggregate level election results for each polling station. While Dutch citizens are allowed to vote in any polling station in their municipality, we know that they mostly do so in the polling station that is closest to their home. The electoral council’s data contain a postal code for about 2 seconds or 3 seconds of the polling stations. This allowed us to establish the support for each party in the respondent’s neighbourhood (averaged across the polling stations if there is more than one).
While the data thus rely on a subsample of the SCoRE participants of which the 2012 vote choice was available, and then again on a subsample of which the polling results of 2012 are known, the large size of the original sample ensures we still end up with a sizable number of 2178 respondents. The panel of GfK is not a random sample of the Dutch population. However, since our study does not aim to provide a descriptive account of the Dutch population, but instead aims to test effects, the representativeness of the sample is not a major concern. More crucial is whether there is sufficient variation in the variables included in our model. For this reason, GfK was asked to draw a quota sample from their larger panel that would be representative of the Dutch population on two factors crucial in the context of our specific study: geographical spread (province and urbanity) and voting behaviour in 2017.
Operationalization
The key variables on the individual levels are respondents’ vote choices in 2012 and 2017. This is based on reported vote choices at the national elections held in September 2012 and March 2017. Neighbourhood embeddedness is measured using the following question: ‘To what extent do you feel connected to your neighbourhood or village?’ with an answer scale ranging from 1 (‘not connected at all’) to 7 (‘strongly connected’).
Design
Investigating neighbourhood effects is difficult for three reasons. First, conventional models of vote choice typically rely on surveys without information on the geographical location so that vote choices are usually modelled without data on the preference distribution in the immediate environment (see Huckfeldt and Sprague, 1995 for this critique). To the extent that contextual data are available, these are usually collected for much larger regions or even at the country level, rather than at the level of neighbourhoods. Second, as discussed earlier, a mere correlation between the preferences of individuals and those of the people living in their immediate environment is not a proper test of neighbourhood effects. Such a correlation can be brought about by sorting (i.e. individuals with similar preferences ending up in the same neighbourhood), or by confounders (developments affecting the entire neighbourhood at once). Third, the mechanism is usually not investigated. As noted by Johnston et al. (2005), the crucial assumption that ‘social interaction takes place in localized social networks’ is usually not investigated.
Our study has a design that aims to alleviate these problems to a large extent. First, we are able to observe the distribution of preferences in a respondents’ immediate environment by combining geo-coded survey data with the electoral outcomes in respondents’ nearby voting booths. Second, we increase the internal validity with a longitudinal design, in which the neighbourhood preferences at t1–1 are used to predict an individual’s choice at t1, controlling for this person’s own choice at t1. In this way, we control for all sorts of individual and contextual variables, which could produce spurious relationships. In an abstract sense, one could argue that there may always be confounders. Yet, such confounders would have to affect an individual’s party political preferences in 2017, the preferences of the neighbourhood in which this person lives in 2012, but not the preferences of the same individual in 2012. We cannot think of any such confounder. Third, we have good measures of the level of embeddedness of an individual in their neighbourhood, which allows us to observe whether these indeed moderate the relationship.
To isolate the neighbourhood effects on an individuals’ subsequent vote choices as much as possible, we use the following specification. We create a stacked dataset consisting of respondent-party dyads (i.e. separate rows for each combination of respondent and party). This allows to test the effect of support for a party in the neighbourhood for all parties simultaneously in one model. We did so for the eight largest parties in the dataset which attracted the votes of at least 100 respondents in 2012: VVD (liberal-conservatives), PvdA (social-democrats), PVV (populist radical right), SP (radical left), CDA (Christian-democrats), D66 (liberal-progressives), CU (orthodox Christians) and GL (greens). We only include respondents who voted for one of these parties in 2012. Figure 2 visualizes the distribution of local support for respondents’ preferred party in our stacked dataset, our key independent variable.
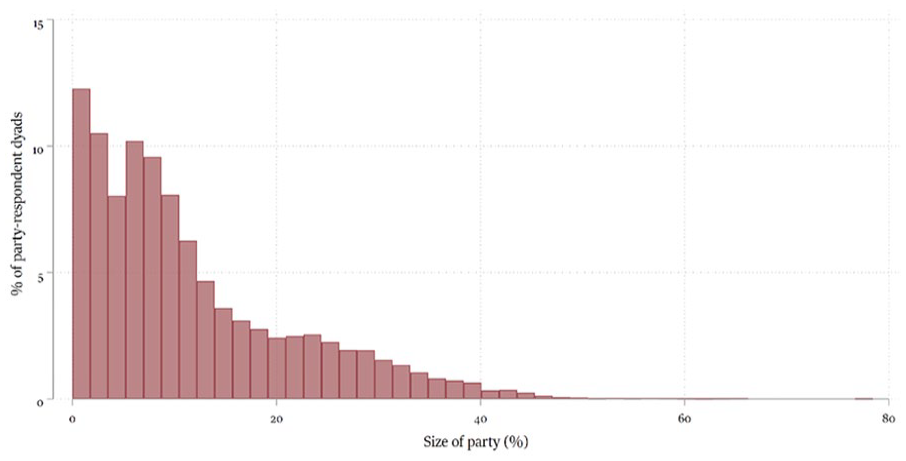
Distribution of Support for Parties in Neighbourhood.
In our main analysis, we use logistic regression to predict whether the respondent voted for the party included in the dyad. We predict this vote choice by the share of support for that party in the respondent’s neighbourhood. Importantly, we control for the respondents’ vote choice in 2012. This way, the effect of our neighbourhood support variable captures whether, net of a respondent’s vote choice in the previous election, they are more likely to switch to a party if it has considerable support in the neighbourhood. To test H2, we interact neighbourhood support with neighbourhood embeddedness.
Apart from party dummies, all models control for the following socio-demographics and attitudes: self-reported left-right position (dummies for each category of the 11-point scale), nativism (a scale of three items concerning immigration), 4 authoritarianism (a scale of two items about law and order), 5 economic attitudes (four items), 6 education (low, middle, high), age and its square term, employment status, religiosity and immigrant status. We include these controls – which will predict voting for the individual parties in contrasting ways – using a procedure proposed by Van der Eijk et al. (2006). This works as follows: we first predict each respondent’s likelihood to vote for a party in separate linear regressions for each party; we subsequently save this predicted probability, and use it (after centring) as an explanatory variable in our subsequent regression. This y-hat is a linear transformation of the original variables, which captures the variation already explained by the socio-demographic and attitudinal variables.
Given the nested structure of our stacked data, we include a random intercepts at the level of neighbourhoods (level 2). Fixed effects were included for each party, to capture the differences in aggregated support for individual parties. Although observations are also nested in individuals, it is not necessary to include fixed or random intercepts for respondents. In the dyadic data on which we based our logistic model, all respondents vote for one of the eight parties included in the dyads. There is therefore no variation between respondents in the average outcome variable (which is 1/8 = 0.125). We present two alternative specifications, which we report in Appendix A and C, respectively, and discuss in Note 7: first, we replicated the main analysis using a conditional logit model; and second, we applied geographically weighted regression (GWR).
To estimate possible asymmetries, we create a different dependent variable, which takes the values ‘switching to a party’, ‘switching away from a party’ and ‘not changing’. We estimate a multinomial logit model to assess whether these different outcomes are explained by neighbourhood support in the same way.
Results
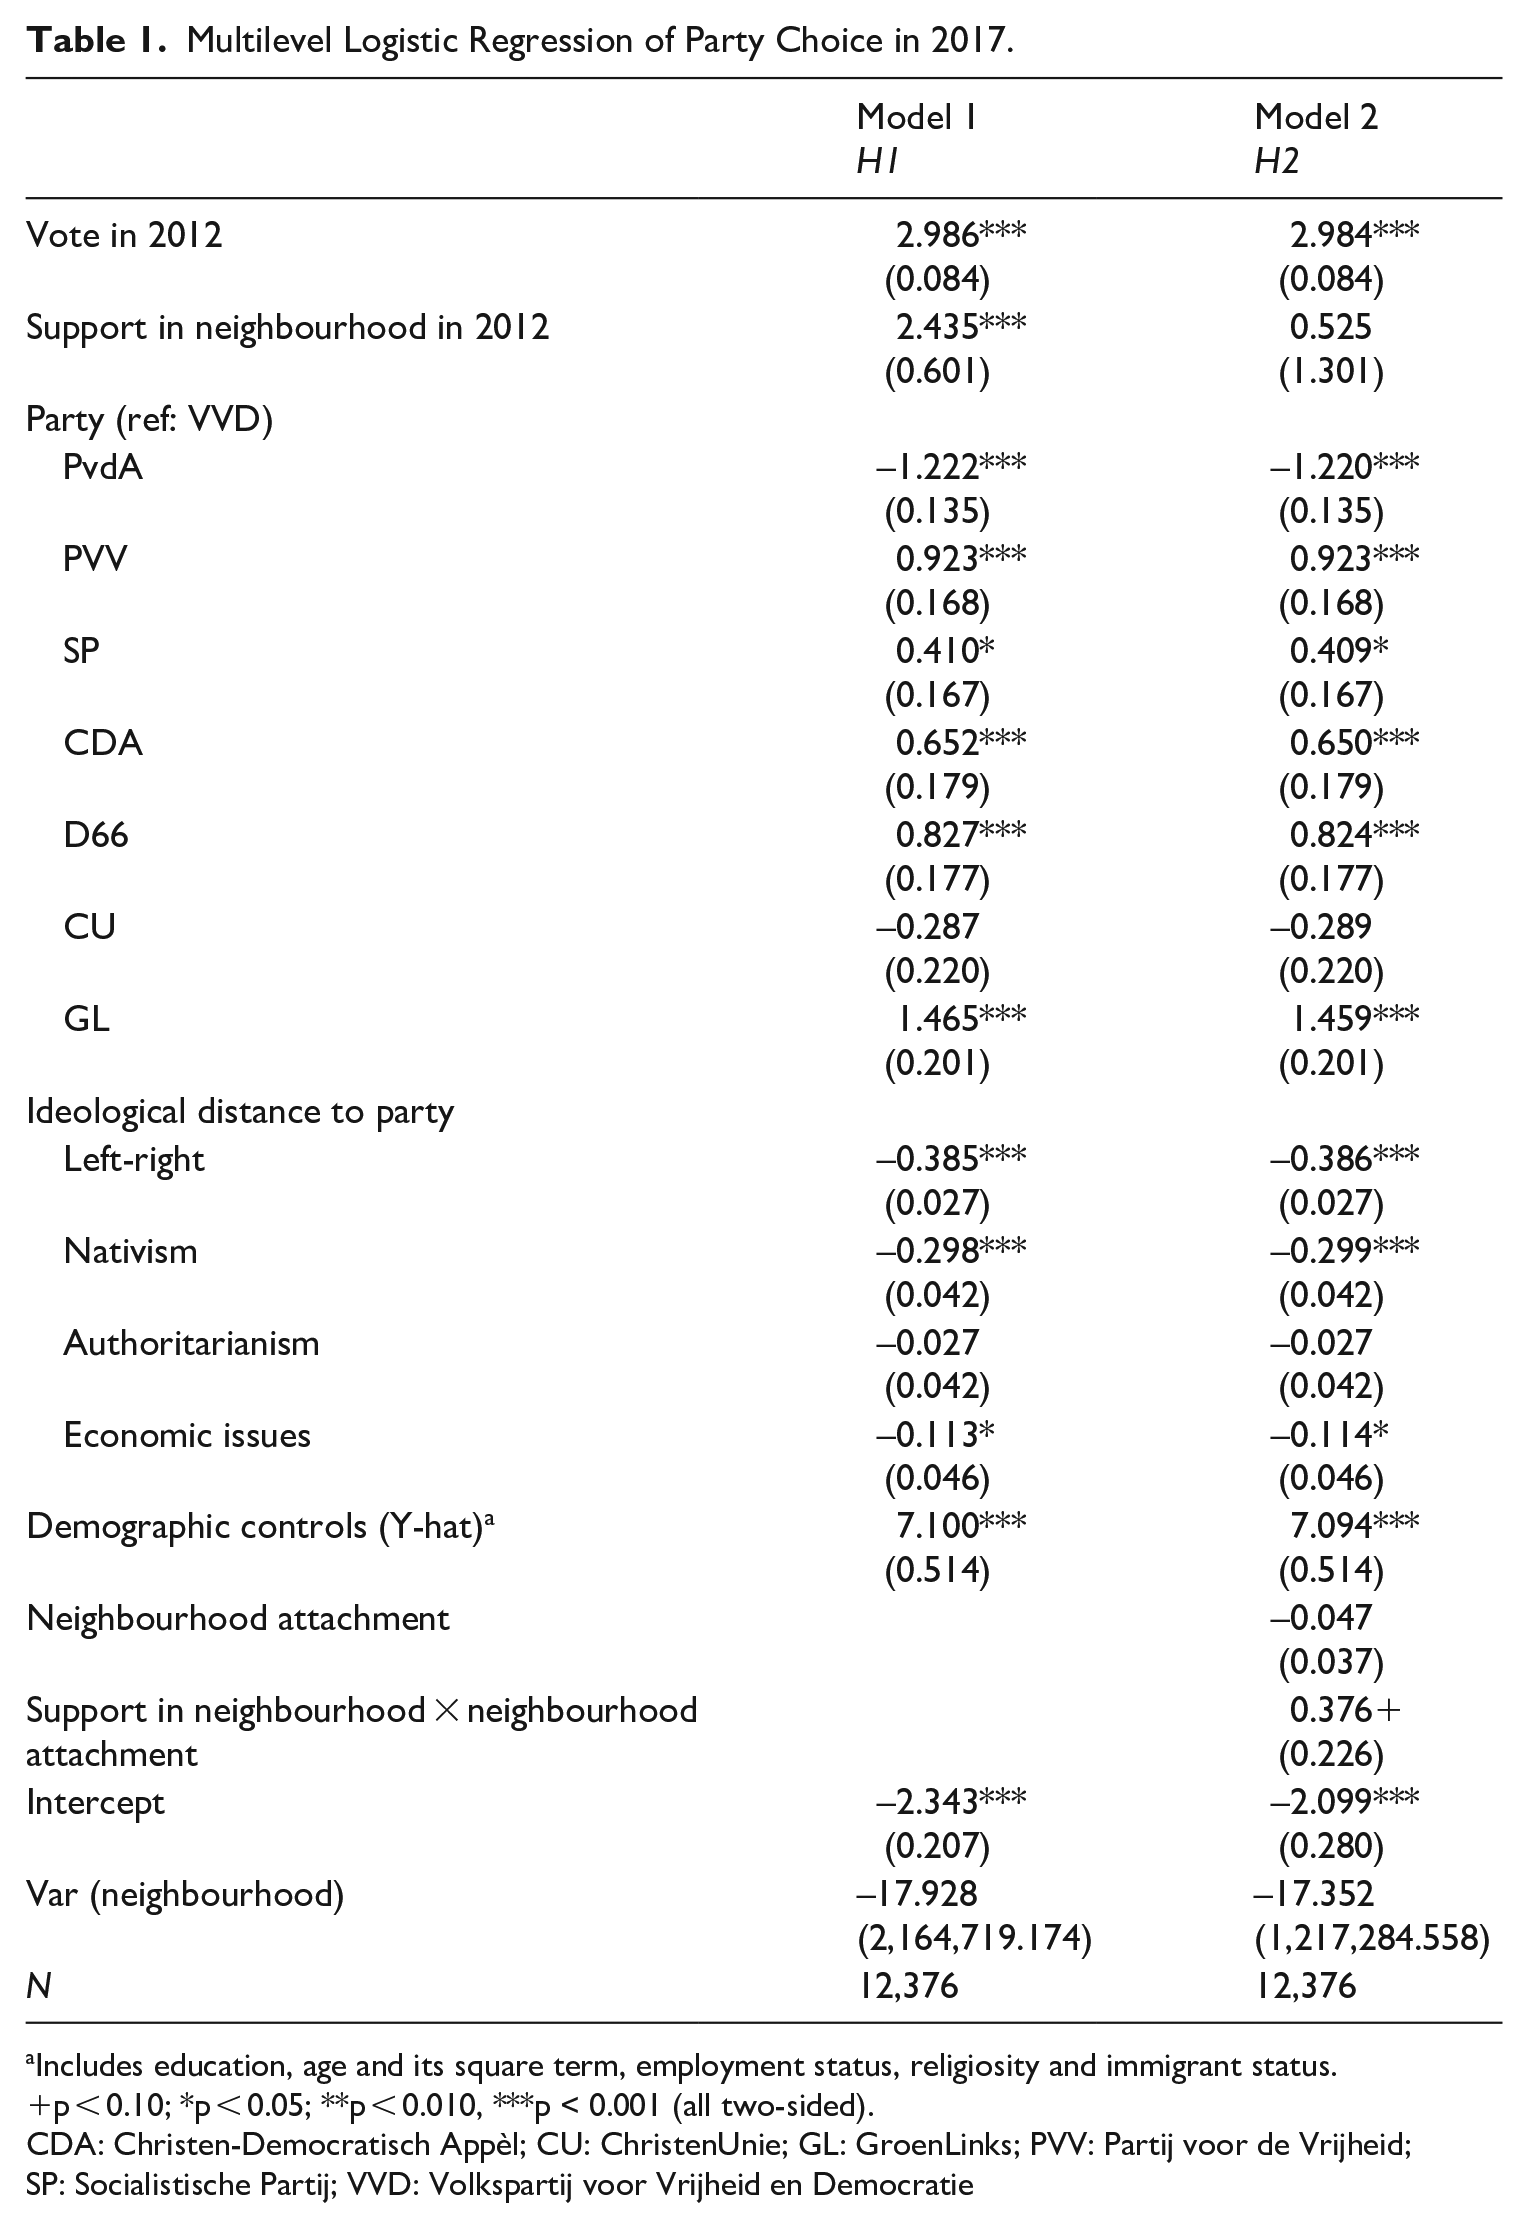
Table 1 shows the results of three multilevel logistic regressions in which the vote for a party in 2017 is predicted in our stacked dataset. We discuss the models in turn, using graphs to visualize the first- and second-order interactions of models 2 and 3.
Multilevel Logistic Regression of Party Choice in 2017.
Includes education, age and its square term, employment status, religiosity and immigrant status.
p < 0.10; *p < 0.05; **p < 0.010, ***p < 0.001 (all two-sided).
CDA: Christen-Democratisch Appèl; CU: ChristenUnie; GL: GroenLinks; PVV: Partij voor de Vrijheid; SP: Socialistische Partij; VVD: Volkspartij voor Vrijheid en Democratie
Model 1 provides the most basic test of H1: does support for a party in a neighbourhood predict an increase in the likelihood of somebody voting for that party? Indeed, the significant coefficient tells us that support for a party in the neighbourhood in 2012 significantly predicts support for this party of the respondent, even when controlling for that respondent’s preference in 2012 as well as an extensive range of socio-demographic and attitudinal controls. As we control for the voting behaviour in 2012, this means that people are more likely to switch to a party if they live in a neighbourhood where this party receives much support. At the very least, this suggests that a neighbourhood effect exists. 7
To further test the neighbourhood effect, we investigate whether this effect is, as we theoretically expect, stronger among those most attached to their neighbourhood (H2). Model 2 shows that this interaction between neighbourhood support and embeddedness is in the expected direction and significant, though only one-sided. To interpret this interaction, Figure 3 presents the conditional effect of neighbourhood support on vote choices for different values of neighbourhood embeddedness. It shows that neighbourhood support predicts vote choices from around the midpoint of the embeddedness scale (3) onwards. Among the lowest scores, the point estimate of the effect is very close to zero.
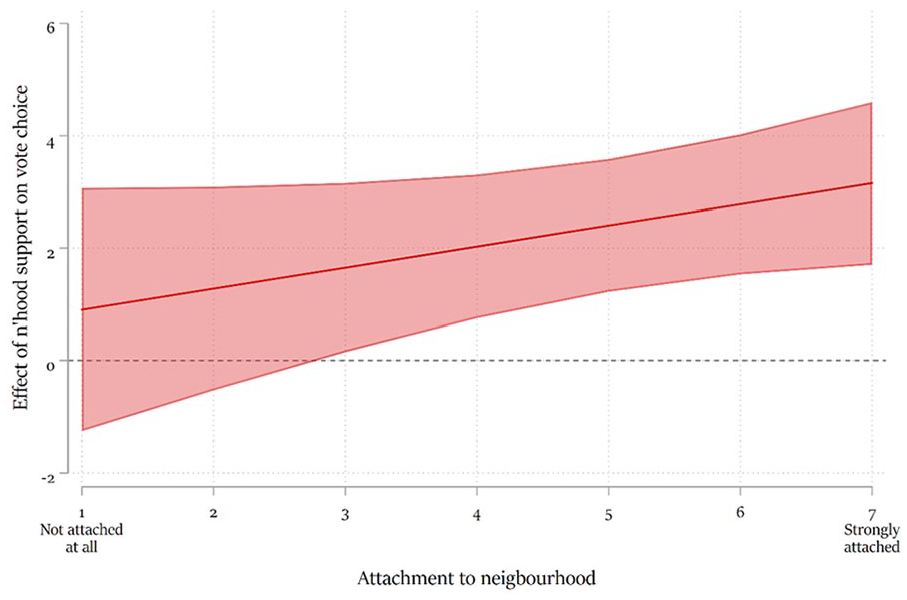
Conditional Effect of Neighbourhood Support for a Party on Probability to Vote for That Party, by Neighbourhood Embeddedness.
Still, logistic effects are difficult to interpret substantively. To get an idea of the effect size, Figure 4 presents the predicted probability to vote for a party in 2017 based on levels of neighbourhood support for that party in 2012, fitted for individuals scoring 1 (not attached at all), 4 (the first score for which the neighbourhood effect is significant) and 7 (very strongly attached). Among those who do not feel attached to their neighbourhood, the party popularity in the neighbourhood does not predict their vote choice. Among those who strongly identify with the neighbourhood, it is associated with a substantive increase in the predicted probability to vote for a party: from just over 10% in neighbourhoods with no support at all, to almost 15% in neighbourhoods in which 20% of the voters supports a party. This is in line with H2.
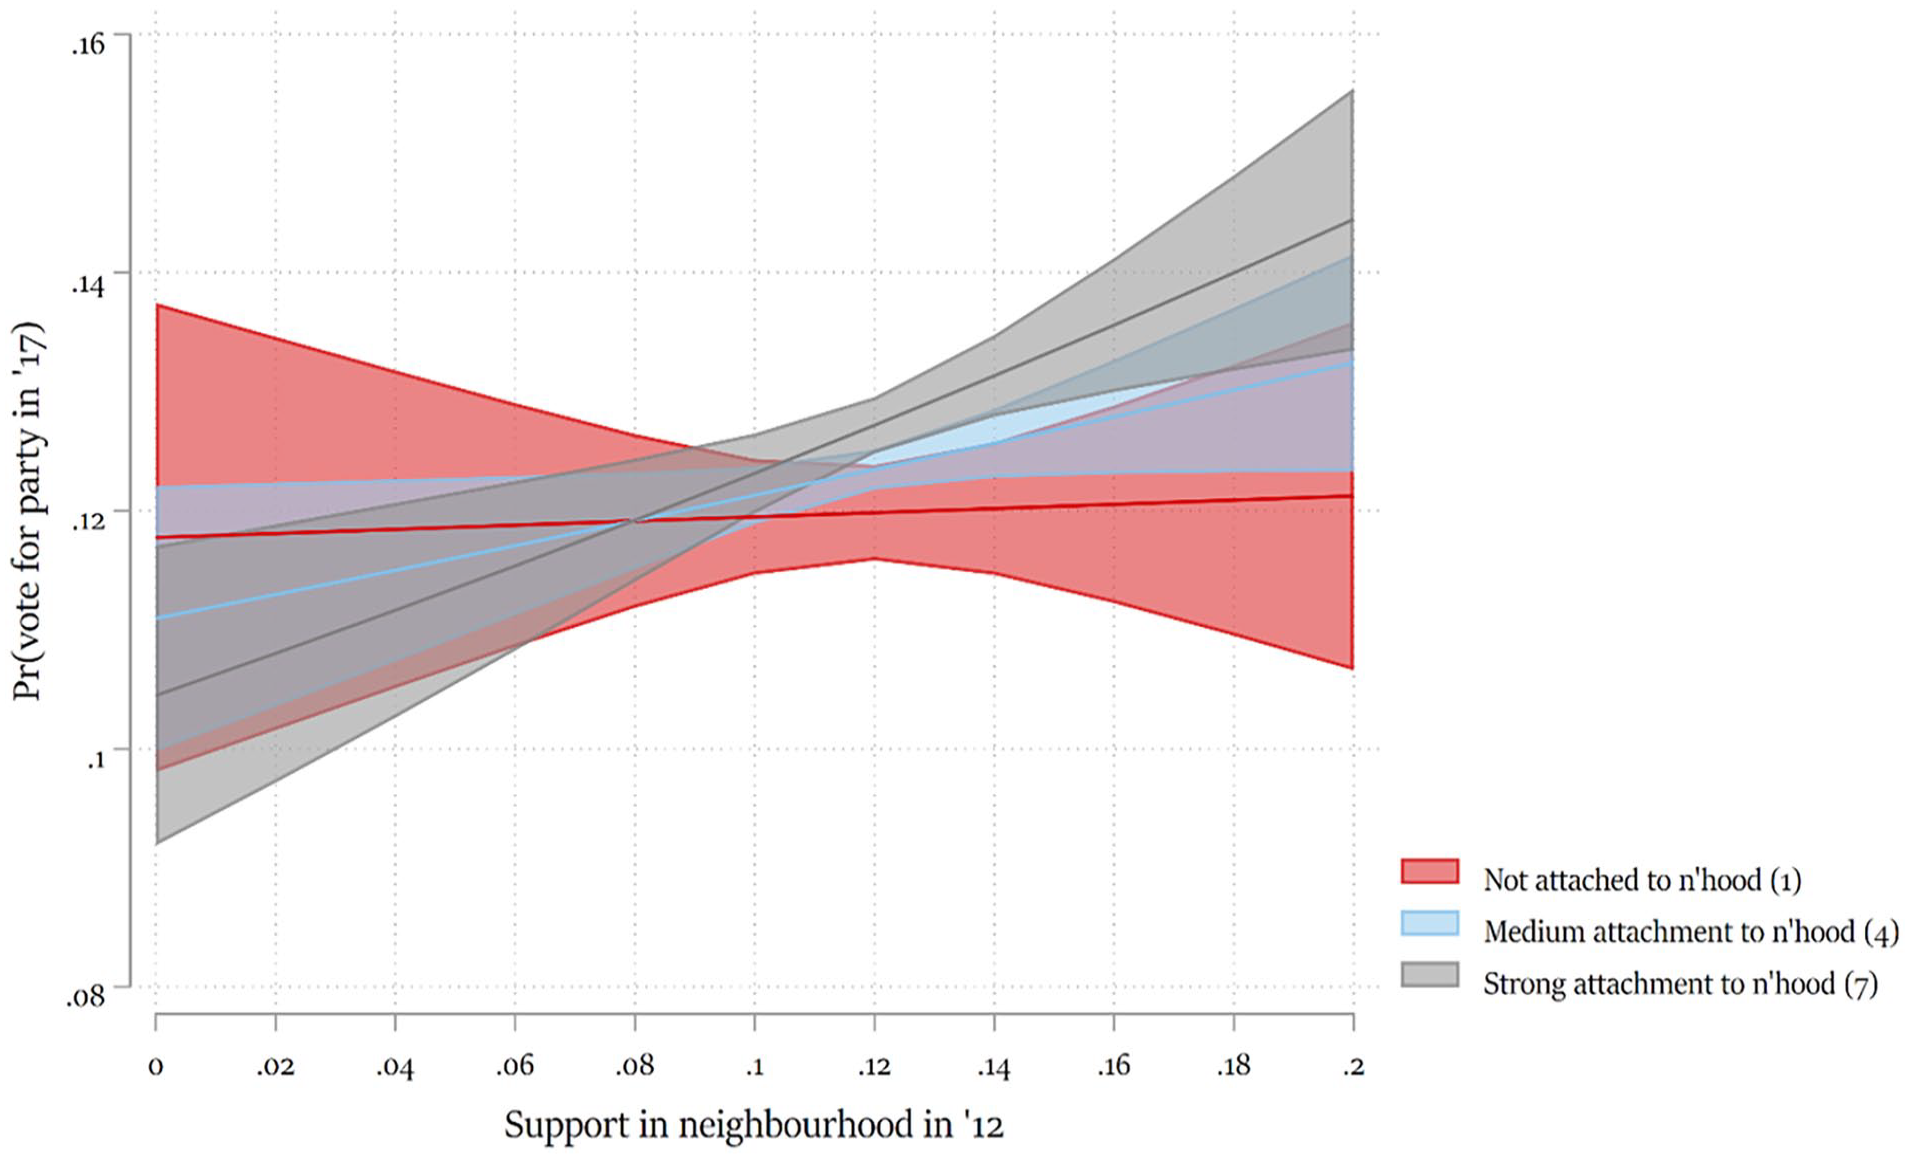
Predicted Probability to Vote for a Party, by Neighbourhood Support for that Party and Embeddedness.
Additional Analyses
We conduct three additional analyses to further probe the nature of the mechanism under investigation and present these in Supplementary Information. First, we replicated the main model using neighbourhood support on larger geographical scales. Appendix C shows that support in districts (population size of around 6000 compared to under 1400 in neighbourhoods) and municipalities (around 43,000 residents on average) produce similar patterns, albeit slightly smaller and not significant on the one-sided level. Still, the fact that similar patterns appear to emerge on larger scales suggests that conversion often takes place by indirect means, rather than through neighbour-to-neighbour conversation. This also strengthens confidence in studies using larger areas, although the classification structure in the Netherlands did allow us to replicate the analysis relying on areas as large as those employed in some other studies (for instance, Gallego et al., 2016).
Second, we investigated possible asymmetries of the effect: is the deterring effect of low neighbourhood support as large as the encouraging effect of high support? We test this by modelling changes towards a party and away from a party as separate outcomes in a multinomial logistic regression, with not changing status (i.e. either staying with or away from a party) as the third and reference category. Appendix D shows that both a switch towards and away from a party is predicted by support in the neighbourhood, the latter somewhat more than the former, but not significantly different. We therefore conclude that signals from the neighbourhood can have both a deterring and encouraging effect.
Finally, we explored further interactions with length of residence (see Note 2). On one hand, the length of residence may be another indicator of the embeddedness in a neighbourhood. Those who have lived in a neighbourhood for a long time will know more people in the area, so that they are more likely to be influenced by their neighbours. On the other hand, people who have lived there for a long time, may have been influenced already in the past, or are more likely to be local opinion leaders. This would make them less likely to adapt their party preferences in the direction of the others in their neighbourhood. Those who recently moved into a neighbourhood are probably younger, more volatile and thus more susceptible to neighbourhood effects. There is also the possibility of a higher order interaction: a particularly strong effect among people who feel strongly embedded in their neighbourhood and who only recently moved into the neighbourhood. Since they only recently moved in, the potential for neighbourhood effects could be larger, because those who live there for a long time will have been influenced already (if they are sensitive to that). Yet, whether they will be influenced is likely to depend upon their embeddedness in the neighbourhood. In Appendix F, we distinguish between those who lived in the neighbourhood for less than 5 years (i.e. since the last election) and more than 5 years. 8 The second-order interaction effect suggests that indeed the effect is stronger among recent arrivals than among those living in the area already before 2012, but this effect has little power and is not statistically significant. A graphical plot of the effects in Appendix F shows that the effects in both groups are quite similar. So, we refrain from drawing conclusions based on these analyses.
Conclusion
Our study asks the question whether there are neighbourhood effects on party choice. To be specific, we focus on the question whether the popularity of a party in a neighbourhood spills over to other people living in the same neighbourhood. We employ a unique geo-coded panel data set, which enables us to estimate the effects of electoral preferences in the neighbourhood, while at the same time controlling for each respondent’s individual vote choice in the previous election. The design is simple, but clear and the results are straightforward. There are substantial neighbourhood effects, but these effects are restricted to people who feel (strongly) attached to their neighbourhood. It is striking that a neighbourhood effect is visible in the fragmented landscape of the Netherlands, which contains hardly any neighbourhoods in which residents massively lean towards one particular party.
Some readers may not consider our findings surprising. After all, common wisdom says that people are social animals, and it has been widely attested that their preferences, attitudes, values and behaviours are influenced by their social environment. So, on this basis, we would expect electoral decisions to be shaped to some extent by the political preferences of their social networks which include friends, family, colleagues as well as neighbours. However, even though it seems plausible that neighbours would affect each other’s political preferences, research on these kinds of neighbourhood effects is scarce, probably because it is difficult to obtain the data needed to estimate such effects.
One of the main problems in studying neighbourhood effects is that there are all sorts of reasons why like-minded people could cluster together geographically. For instance, while some progressives born in conservative rural environments might choose to stay, many will prefer to move to Berlin, Amsterdam or San Francisco. This will create a correlation between vote choice and location. On the basis of panel survey data from the UK, Gallego et al. (2016) recently concluded that contextual effects on the vote are overestimated and are largely the result of such geographical sorting: people moving into neighbourhoods with like-minded people. When reviewing the recent literature, most studies tend to conclude that geographical variations in vote choice (and other relevant attitudes) are mainly the result of geographical sorting (e.g. Bishop, 2008; Gallego et al., 2016; Maxwell, 2019).
Our study certainly does not contradict the fact that geographical sorting takes place. However, the core message of our study is that, even if geographical sorting occurs, one should not dismiss the effect running the other way. An important drawback of existing studies is that election results are usually measured in areas that are too large to realistically expect ‘neighbourhood’ effects. For instance, Gallego et al. (2016) employ contextual data at the level of British constituencies, with an average size of about 70,000 citizens. The neighbourhoods in our study have an average size of 1379 inhabitants. Although we found similar patterns at higher levels of aggregation, if the causal mechanism indeed involves communication (even indirectly), the constituency level may simply be too large.
A second contribution to the literature is the inclusion of attachment to the neighbourhood as a moderating variable. Previous studies on neighbourhood effects did not include moderators of contextual effects. By including this moderator, we demonstrate that there are clear neighbourhood effects, but only for citizens who say that they feel attached to the neighbourhood. While we consider it plausible that geographical sorting takes place in the Netherlands as well, we thus conclude that geographical sorting cannot fully account for the clustering of Dutch political preferences.
Of course, our study has its limitations. We discussed several mechanisms through which neighbourhood effects might be produced and provided evidence suggestive for some of those, but follow-up research is needed to isolate the exact mechanisms involved. This would require data on the nature and extent of citizens’ interaction with neighbours, as well as the visual and other political symbols available in their smaller and wider local area. Furthermore, our study could not establish the extent to which geographical sorting is occurring or even increasing in the Netherlands, which requires data over longer periods of time. While our study convincingly shows that neighbourhood effects exist beyond sorting, such data would help to establish the relative weight of sorting and context effects, and hence to assess the future prospects of the geographical clustering of political preferences in the Netherlands and elsewhere.
Our study has important implications for our understanding of party choice, and perhaps even political behaviour in a broader sense. First, our findings show that electoral success and failure in specific areas can be self-reinforcing. Compared to other countries, geographical differences in party support are limited in the Netherlands. Yet, this might change in the longer run through a combination of sorting and context effects. This would further entrench political divisions along non-political fault lines such as region, urbanity and lifestyle, deepening the scope and ferocity of (affective) polarization (Harteveld, 2021; Iyengar et al., 2019; Mason, 2016). Second, similar to Johnston et al. (2005), we were able to observe neighbourhood effects mainly by including neighbourhood embeddedness as a moderator in our model. This shows that future research on neighbourhood effects – or any other social influence – should theorize and operationalize citizens’ attachments and identities. Third, the fact that political neighbourhood effects occur in one of the most fragmented political systems – which presents its citizens with rather weak cues – testifies that its mechanisms may be subtle and indirect. This requires rethinking the mechanisms involved beyond ‘conversion by conversation’.
Supplemental Material
sj-docx-1-psx-10.1177_00323217231204849 – Supplemental material for Keeping Up With the Joneses? Neighbourhood Effects on the Vote
Supplemental material, sj-docx-1-psx-10.1177_00323217231204849 for Keeping Up With the Joneses? Neighbourhood Effects on the Vote by Eelco Harteveld and Wouter van der Brug in Political Studies
Footnotes
Declaration of Conflicting Interests
The author(s) declared no potential conflicts of interest with respect to the research, authorship, and/or publication of this article.
Funding
The author(s) disclosed receipt of the following financial support for the research, authorship, and/or publication of this article: The project was funded by the Dutch Research Council under Grant ORA 464-15-225.
Supplementary Information
Additional Supplementary Information may be found with the online version of this article.
Appendix A: Replication of main model using conditional logit. Appendix B: Replication based on larger areas. Appendix C: Replication using geographically weighted regression. Appendix D: Additional analyses: multinomial logistic regression to assess symmetry of effects. Appendix E: Predicting neighbourhood attachment. Figure E1. Conditional effect of neighbourhood support on vote choices, by neighbourhood embeddedness and length of residence. Appendix F: Interactions with length of residence.
Notes
Author Biographies
References
Supplementary Material
Please find the following supplemental material available below.
For Open Access articles published under a Creative Commons License, all supplemental material carries the same license as the article it is associated with.
For non-Open Access articles published, all supplemental material carries a non-exclusive license, and permission requests for re-use of supplemental material or any part of supplemental material shall be sent directly to the copyright owner as specified in the copyright notice associated with the article.