
Abstract
The issue of unequal electoral turnout poses serious concerns for both the overall health of democratic politics, and the extent to which certain groups exert an unequal influence on the political process. This article explores the relationship between electoral rules such as: compulsory voting, electoral system proportionality, and voter registration with voter inequality in terms of age, income and education. This is examined using cross-national survey data and cross-level interactions between electoral institutions and socio-demographic variables. The final dataset is based on waves 2–4 of the Comparative Study of Electoral Systems, and contains information on 133,000 individuals, within 45 countries, between 2001 and 2016. The results indicate that compulsory voting is associated with a significant reduction in turnout inequalities, while the effects of proportionality and voter registration are somewhat more mixed.
Keywords
The issue of unequal electoral turnout poses serious concerns for both the legitimacy of democratic government, and the way in which states can effectively represent the views of society as a whole. Previous research has consistently demonstrated that older citizens, as well as those with more socio-economic resources are more likely to vote than their younger, or less affluent counterparts (Baston and Ritchie, 2004; Brady et al., 1995a, 1995b; Gallego, 2010; Lijphart, 1997; Smets and Van Ham, 2013). With politicians being more likely to cater to the preferences of voters than non-voters (Griffin and Newman, 2005), this can result in entire sections of society becoming wholly alienated from the political decision-making process.
Of the multitude of ways that policymakers can attempt to combat the issue of turnout inequality, previous research indicates that a top-down approach aimed at institutional-level change may be the most effective (Franklin, 2002; Franklin et al., 1996; Geys, 2006; Lijphart, 1997; Norris, 2000). Countries that have enacted such electoral reforms in the past, it should be noted, tend to do so as part of broad policy frameworks that alter multiple aspects of the political system, rather than changing one electoral law in isolation (Birch, 2009; Renwick, 2017; Singh, 2019). This emphasises the importance of examining the cumulative impact that various electoral rules can have on voting behaviour, and how these effects are distributed among different sections of the population. Even if such institutional changes boost voting rates at the national level, this may still mask persisting inequalities, or even enhance them, if they fail to incorporate the groups who are traditionally most alienated from the political process, namely, the young, the less well educated and the poorest members of society (Lijphart, 1997; Quintelier et al., 2011). Three central aspects of the electoral laws that govern our political systems are examined here: compulsory voting laws, the proportionality of electoral systems and voter registration. The inclusion of these variables makes it possible to address the key question of: are certain electoral rules associated with reduced turnout inequalities across age, income and education?
This article builds upon research in this area in several ways. First, it introduces a newly compiled original dataset on voter registration, which can be used to test the claims of previous studies that rely on national- and regional-level case studies against up to date, large-N cross national data. Second, exploring these structural features using a consistent data source and analytical framework is a unique advantage offered by this research design, allowing for direct comparisons in terms of the strength of the relationships between each institutional variable and turnout inequalities. Third, exploring three sources of turnout inequality (age, education and income) allows for a more detailed examination of whether any apparent links between electoral rules and turnout inequalities are consistent across these three characteristics, or whether certain institutional features are only linked with engagement for specific demographic groups. Fourth, the inclusion of multiple measurements for each institutional variable also allows for an evaluation of how differences in both the practical implementation, as well as empirical measurement of these features might influence their apparent relationship with turnout inequality. And finally, the scope of the analysis in terms of both its case selection and core variables, is of relevance to a wide range of scholars across the electoral institutions, political behaviour and political inequality sub-fields, as well as policymakers and researchers attempting to identify potential reforms that may be linked with increased engagement among specific marginalised groups
The main dataset used in the analysis is based on waves 2–4 of the Comparative Study of Electoral Systems (CSES), and includes information on 133,000 individuals, in 105 election studies, across 45 countries, between 2001 and 2016. To address my central research question, it is essential to begin with a discussion of the state of the current academic literature on political behaviour and electoral rules.
Theory
The Socio-Demographic Characteristics of Turnout Inequality
Before examining the core institutional factors included in the analysis, it is necessary to outline the key socio-demographic variables that are held to influence turnout at the individual level, with three of the most influential predictors being age, education and income. Studies have consistently found that older citizens are far more likely to vote than their younger counterparts (Baston and Ritchie, 2004; Lijphart, 1997; Smets and Van Ham, 2013). This effect also tends to follow a curvilinear trend, with middle aged citizens being the most likely to vote, while older age groups are slightly less likely to participate. Since young people are significantly less likely to vote, politicians may see less value in catering to their needs when campaigning or holding political office. Indeed, while not examining age directly, Griffin and Newman (2005) found that US Senators’ voting patterns represented the preferences of voters significantly more closely than those of non-voters. One positive from this pattern, however, is that if structural changes are successful in encouraging more young people to vote, this may have a knock-on effect on the supply side of the equation, giving politicians a greater incentive to promote policies and manifesto pledges that better address their concerns, effectively reversing the cycle.
A second major factor that has been found to influence voting at the individual level is education. In line with the resource model of political participation (Brady et al., 1995a, 1995b), education is one of several attributes that are held to reduce the costs of voting. The communication, critical thinking and social skills developed in the course of education helps to reduce the effort needed to become informed on political issues, and can reinforce social ties and positive orientations towards civic society (Brady et al., 1995a; Wolfinger and Rosenstone, 1980). Moreover, the empirical evidence largely supports this positive link between turnout and education (Gallego, 2010; Lijphart, 1997; Smets and Van Ham, 2013).
Another central claim of the resource model of participation is that income exerts a positive effect on voting, with wealthier citizens being more likely to take part in elections. The empirical findings generally support this notion, as while the influence of income seems to be weaker than that of age and education, it nevertheless produces a small but significant positive impact on turnout (Smets and Van Ham, 2013).
Electoral Laws
Numerous studies have found that when trying to account for variation in levels of political engagement across different societies, it is the institutional context that plays the biggest role in explaining support rather than differences at the individual level (Franklin, 2002; Franklin et al., 1996; Geys, 2006; Lijphart, 1997; Norris, 2000). A noteworthy point here is that when countries have actually enacted structural changes to their electoral systems, it tends to be as part of wider reform packages rather than simply changing one aspect of the political process (Renwick, 2017). For example, Thailand’s transition to compulsory voting in 1997 was accompanied by a new electoral system and an entirely new constitution, while in 2012 Chile decided to move from a mandatory to a voluntary voting system, while simultaneously switching from a voluntary registration process to a compulsory one (Contreras et al., 2016; Singh, 2019). In line with the real world pattern of how these rules are typically implemented, it makes sense to take a more comprehensive approach when exploring this topic, as each of these distinct aspects of the electoral process may impact political behaviour to varying degrees.
While there is significant evidence that institutional change may be a worthwhile route to improving public participation in politics, it is clearly not the only relevant factor. Public attitudes, political discourse and the salience of elections will always play a key intermediary role in electoral outcomes (Franklin, 1999; Renwick, 2017: 13). There is, however, some evidence that changes at the structural level may have positive effects beyond their direct impact on the formal electoral process. Renwick (2017), gives New Zealand as an example where the transition to a more proportional electoral system has helped strengthen multi-party competition, and promote greater gender and ethnic diversity in parliament (Renwick, 2017: 13). Nonetheless, there remains a great deal of variation in turnout rates across national contexts, even when similar electoral rules are in use. This again highlights the importance of studying a range of potential reforms across a broad set of cases.
While electoral reform may be an incomplete answer to the problem of unequal participation, it is nevertheless a relevant component, as it sets the underlying framework through which other cultural and social avenues can also be explored.
Compulsory Voting
Of all the institutional changes that can be enacted in hopes of increasing political involvement, compulsory voting laws are held to be by far the most effective (Franklin, 2002; Franklin et al., 1996; Geys, 2006; Lijphart, 1997; Norris, 2000). This policy has been adopted by various nations over the years, and is currently still in place in Australia, Belgium and much of Latin America (Baston and Ritchie, 2004: 36). It is important to note, however, that not all forms of mandatory voting are created equal, as these policies often differ drastically in terms of how they are put into practice. The most common form of punishment for non-voting is a small monetary fine, as is the case in Australia and Belgium. More extreme penalties include the denial of public services such as the ability to apply for certain public sector jobs, the reissuing of official documents such as passports, disenfranchisement from future elections or even imprisonment – although this is extremely rare (Quintelier et al., 2011). In the vast majority of countries with compulsory voting, these laws are weakly enforced, if at all.
In practice, countries that employ the strictest forms of compulsory voting, such as Australia and Belgium, regularly witness turnouts of 90% or higher. Pushing overall turnout rates so close to their maximum inevitably leads to a ceiling effect, as near universal turnout leaves little room for inequalities across different groups to emerge. Gallego (2010) finds some evidence of such a trend, as while compulsory voting displayed no direct moderating effect on educational inequalities, these laws boosted overall voting rates to such an extent that it effectively eliminated any turnout differences across educational backgrounds.
As noted previously, however, not all systems enforce these laws to the same degree. Although any form of compulsory voting generally tends to produce higher turnouts than voluntary systems (Cancela and Geys, 2016), turnout is significantly lower when these laws are weakly enforced in comparison to the strict systems discussed above. This begs the question, what effect does compulsory voting have on equality of participation when these ceiling effects are no longer at play?
One relevant consequence of compulsory voting measures is that the impact of any potential fines may be felt most acutely by those with fewer financial resources at their disposal, meaning that the pressures exerted by these laws may unduly influence voting rates for citizens in the most disadvantaged sections of the population (Gallego, 2010: 242). Jaitman (2013) found that in Argentina, where compulsory voting is relatively weakly enforced, these laws had a greater effect on unskilled workers compared with those in skilled professions. This implies that compulsory voting helps reduce socio-economic turnout disparities, even when ceiling effects are not present. Other studies have produced similar findings that compulsory voting is associated with reduced turnout inequality across education and political knowledge (Dassonneville and Hooghe, 2017), as well as income (Singh, 2015). An additional mechanism that has been suggested for how compulsory voting relates to age inequality in particular, is that these laws may appeal to voters’ sense of civic duty and social ties. With older citizens generally possessing stronger feelings of civic duty, and younger age groups being more prone to other voluntary, more expressive forms of participation such as protest (Solt, 2015), compulsory voting may actually widen existing age inequalities across turnout (Quintelier et al., 2011: 407). The evidence for this argument, however, is somewhat mixed. Quintelier et al. (2011) found that under compulsory voting older citizens were even more likely to vote than their younger counterparts in comparison to voluntary systems. The study conducted by Henn and Oldfield (2016) regarding public opinion of young people in Britain, however, found that although being forced to vote may negatively affect political attitudes, young non-voters nonetheless stated they would be more likely to participate if compulsory voting was in place. In light of the generally positive previous findings in this area, I expect that any form of compulsory voting should be associated with lower levels of turnout inequality:
While all forms of compulsory voting are expected to reduce the salience of the individual-level determinants of turnout, the level of enforcement is also of crucial importance. Even in cases where the enforcement of these laws is relatively lax, previous research suggests that these incentives may nonetheless have a greater impact on those who would be less likely to participate if voting was voluntary. Moreover, while these same mechanisms are also present when stricter penalties and enforcement are used, the additional ceiling effects should reduce inequalities even further. This assumption can be tested via the following hypothesis:
Including several indicators of compulsory voting in my final analysis makes it possible to test whether having any form of compulsory voting is linked with a reduction in turnout inequalities, or if a credible threat of legal sanction is necessary for these rules to display any substantive effects.
Electoral System Proportionality
The proportionality of electoral systems not only plays a central role in dictating how easy the electoral process is to take part in, but also impacts the probability of producing certain types of government, as well as shaping voter’s perceptions of how likely it is that their vote will have a meaningful impact on the end result. It remains to be seen whether the relative complexity of proportional systems may impede certain voters more than others, or whether a resulting increase in perceived representativeness will help engage the groups traditionally alienated from electoral politics in majoritarian systems.
One key theory regarding electoral systems and voting inequality comes from Iversen and Soskice’s (2006) research on how electoral systems shape the incentives of middle-class voters, whose support is often the deciding factor in election outcomes. In majoritarian two-party systems, these voters are more inclined to side with the rich, to prevent a left-wing dominated government pushing through economic policy that overly impacts the middle class. In multi-party systems with proportional representation, the middle class are instead incentivised to align with low-income voters, since coalition government can act as a safeguard against any party unilaterally imposing redistributive policies that unduly impact the middle class (Iversen and Soskice, 2006: 178). This implies that under proportional representation, low-income voters have more power in deciding who governs, as they are more likely to be part of winning coalitions compared with majoritarian systems. More recent studies have cast some doubts over this argument, however, finding that electoral system design does not significantly alter the inequality of political influence based on income (Guntermann, 2021).
One further point is that since less votes are wasted in proportional systems compared with instances where single-member constituencies are a forgone conclusion (Baston and Ritchie, 2004; Lijphart, 1997), the reduced need for strategic voting may make elections more approachable for younger citizens, who have less experience with the electoral process.
Another relevant factor may be that for those who abstain from voting because they do not identify with any of the major political parties, more proportional electoral systems offer an opportunity to lend their support to smaller parties that align more closely with their own viewpoints. Similarly, many of the other features associated with proportional electoral systems such as the enhanced representativeness of electoral politics, the more consensual political approach that emphasises power sharing, political compromise and decentralised political authority, may also appeal more to groups that feel alienated under majoritarian systems.
There have been some arguments against the adoption of this practice, however, most of which focus on the relative complexity of many proportional systems compared with single-member districts (Baston and Ritchie, 2004). The additional information costs associated with having to rank parties in preferential order, rather than simply voting for your preferred candidate, may unduly impact less educated citizens, or those unfamiliar with the electoral process.
In light of the somewhat mixed findings with regard to previous research in this area, this project allows us to test whether the supposed benefits associated with proportionality that may be particularly attractive to those somewhat alienated from political affairs, outweigh any additional information costs of voting, and are thus linked with reduced inequality of participation. This will be tested with the following hypothesis:
The current project will employ two measures of electoral system proportionality, namely, district magnitude and the Gallagher disproportionality index. Using these indicators allows for an examination of whether institutional design, or the proportionality of electoral outcomes plays a bigger role in influencing turnout inequality.
Voter Registration
It is argued that how voters are registered can have a significant effect not only on overall turnout levels, but also on the socio-economic make-up of the electorate itself. One of the core defining features of registration systems is who is responsible for initiating the registration process, with two of the most common forms being active and passive registration. Active voter registration refers to cases where the registration process is initiated by the voters themselves, and requires their active participation to be placed on the electoral roll. This usually involves either simply filling out an application form, or visiting a government registry office. Passive systems, however, are those where the voter registration process is fully automatic, requiring practically no additional input from citizens. These registers are created and regularly updated via either public canvassing or existing national population registers.
In terms of turnout inequality, it is argued that the additional barriers to voting imposed by active systems disproportionately affect certain groups in society, specifically first-time voters. Since the majority of this group are young people just reaching the voting age, active registration may ultimately exacerbate existing age-based turnout inequalities. In terms of the resource model, education may also equip citizens with many of the skills needed to successfully identify and interact with the relevant institutions and processes when registering.
Braconnier et al.’s (2017) study on voter registration before the 2012 French presidential election found that the extra costs associated with having to manually register did in fact prevent people from voting, and that these effects were especially pronounced for certain members of the electorate, namely, immigrants, the young and the less educated (Braconnier et al., 2017: 604). Similarly, Gallego (2010) found that the use of active voter registration – where registration was also voluntary – was linked with increased educational inequalities across turnout compared with passive systems, however, this effect was driven almost exclusively by the single US election study included in the analysis.
Nevertheless, there is some conflicting evidence with regard to the effects of voter registration practices. Erikson’s (1981) study of voting behaviour in the United States found that while states with stricter registration procedures had reduced levels of turnout compared with those with less demanding registration requirements, voters in states where registration was not required at all were actually the least likely to vote. One potential explanation for this is that those who have gone through the registration process are now more invested in the election, and thus have a ‘sunk cost’ in the electoral process (Erikson, 1981: 273–274). Failing to vote would now make their previous investment of time and energy to register all for nothing, and as such, should lead to an increased likelihood of participation. If this additional interaction with the electoral process, which only occurs in systems with active registration, does in fact help prime future participation, this could also have potential consequences for turnout inequality, as again it would be first-time voters who would be most exposed to this potential mobilising feature. Despite the findings of this study which was limited to only a sample of Northern US states, the general trend apparent in the literature is that more passive systems tend to reduce the barriers of entry for the most alienated sections of the population. As such, this leads to the following hypothesis regarding voter registration and turnout inequality:
Including this variable in my analysis, and making use of newly collected original data on voter registration, will allow me to test whether previous findings based on national- or regional-level case studies, hold up against more recent cross-national survey data and a wider range of measures of socio-demographic inequalities.
Method
The final data for the main analysis make use of three survey waves from the CSES (Modules 2, 3 and 4), leading to an overall dataset that includes over 133,000 individuals, from 105 legislative elections, in 45 countries, between 2001 and 2016 (CSES, 2017).
The main dependent variable, voter turnout, was taken from the CSES survey question that asks respondents whether or not they cast a vote in their country’s most recent legislative election. The final dummy variable is coded as either ‘did not vote’, or ‘voted’. It is important to note that the dependent variable is based upon self-reported survey measures of turnout, which have been shown to consistently overestimate actual voting behaviour. This may either be due to unintentional error on the part of the respondent, or the possibility of social-desirability bias influencing the survey process. As an additional robustness check, average self-reported turnout for each election study was compared against official turnout statistics, and the full analysis was re-run after excluding any countries where there was a consistently large discrepancy between the two sets of figures. The full list of cases included in the robustness check, and relevant descriptive statistics are listed in the online appendix. The data used in these additional models include 108,000 individuals across 89 election studies. Lacking any other verifiable voting figures at this disaggregated level of analysis, the CSES survey question remains a suitable, albeit imperfect measure for the purposes of this study.
Compulsory voting was operationalised using two different measures. The first is a dummy variable that compares systems with any form of compulsory voting against the voluntary voting reference category. The second measure is an ordinal variable that attempts to capture the degree to which compulsory voting laws were enforced in each country. The original CSES election-level data classify compulsory voting systems based on the severity of their penalties for non-compliance, and the degree to which these penalties are actually enforced. The CSES coding was cross-referenced against several other sources to check for any inconsistencies (Birch, 2009; Franklin, 2002; International Institute for Democracy and Electoral Assistance (IDEA), 2019a, 2019c; International Foundation for Electoral Systems (IFES), 2019; Massicotte et al., 2004; Singh, 2015). The categories in the final measure compare voluntary systems against those using either weakly enforced compulsory voting or strictly enforced compulsory voting.
The effect of electoral system proportionality on turnout was assessed using two measures, the first of which is the Gallagher disproportionality index, which compares the percentage of votes won by each party against the number of seats they received post-election. This provides an effective indicator of how closely the final result mirrored the wishes of the public. The score for the previous legislative election is used, as if citizens are actually influenced by the representativeness of the electoral process, their judgement about the system’s efficacy would logically be based on their past experiences with it. The variable is calculated using the least squares method outlined by Gallagher (1991), with additional data for more recent elections sourced from Carey and Hix (2011), Gandrud (2015) or calculated manually using election data (CSES, 2017). In all of the models, the variable is inverted, so as to make the interpretation of interaction effects more intuitive. A higher score on the final variable, therefore, indicates a more proportional election outcome.
To capture the institutional component of electoral system design, the district magnitude for each election is also included in the analysis. For mixed member systems that contain multiple district magnitudes, the method outlined by (Beck et al., 2001) was used, where the district magnitude is calculated for each tier separately, and then the average is taken after applying a weight factor based on the percentage of seats each tier elects to parliament. The data on district magnitude were taken from the ‘Democratic Electoral Systems Around the World’ dataset (Bormann and Golder, 2013), alongside CSES. The final variable consists of the natural log of the weighted average district magnitude for each election.
With regard to voter registration, an original dataset was created specifically for the purposes of this project. This was based predominantly on election reports from the Organisation for Security and Co-operation in Europe: Office for Democratic Institutions and Human Rights (OCSE, 2019), and was supplemented with additional information from books, journal articles and various government websites (Contreras et al., 2016; Massicotte et al., 2004; OCSE, 2019; Power, 2009; Rosenberg and Chen, 2009). The final measure takes the form of a categorical variable, with the passive registration category compared against active registration and mixed registration systems. The mixed category includes instances where states are transitioning from active to passive systems, or where registration requires some citizen involvement, but significant resources are put into contacting voters to help them register. The full range of cases included this group are outlined in the online appendix.
Individual-Level Variables
All individual-level variables included in the models: age, education and household income, were taken from the main CSES dataset. The respondent’s age, in years, is measured as an interval-level variable, alongside the squared term, to capture any curvilinear effect on turnout. Education is recorded as a dummy variable, indicating whether an individual attended university. Household income is measured in quintiles, with ‘1’ representing the poorest and ‘5’ the wealthiest.
Control Variables
Several control variables were included at the macro-level: population size, how long the country had been a democracy, level of economic development, degree of economic inequality, frequency of referendums and whether multiple elections were held on the same day.
The population variable consists of the natural log of the total population, measured in millions, for each country-year. This was taken from the World Bank World Development Indicators dataset (World Bank, 2019).
How long each country had been democratic was recorded using a dummy variable, with ‘old democracies’ compared against the ‘new democracy’ reference category. This variable was calculated based on the Polity IV measure of regime durability (Polity IV Project, 2018), with countries that had been classed by Polity IV as democratic for at least 50 years before the current election coded as ‘old’ democracies, while those below this threshold were included in the ‘new’ category.
Economic development is represented by the gross domestic product (GDP)/capita (current USD) for each country-year. The final variable uses the natural log of the GDP/capita figure for each case, and is sourced from the World Bank World Development Indicators (World Bank, 2019).
Economic inequality is measured using the Gini coefficient, which is a ratio of the wealth distribution of a given population. A score of 0 implies complete equality of incomes, while a score of 1 would mean complete inequality. This is based on combined data from various sources (IFES, 2019; Index Mundi, 2019; LIS, 2019; OECD, 2018; World Bank, 2019). In the final variable coding, a higher value, therefore, represents greater levels of economic inequality.
To control for potential ‘voter fatigue’ within countries that repeatedly make use of referendums, a simple count variable was included that lists the number of national-level referendums held since the previous election. Data on the use of referendums were taken from multiple sources, most notably the SUDD Database for Direct Democracy, the Centre for Research on Direct Democracy and the IDEA Direct Democracy Database (C2D, 2019; IDEA, 2019b; SUDD, 2019).
A dummy variable was also included to distinguish between standalone legislative elections, and cases where both legislative and presidential elections were held on the same day. Previous research suggests that holding multiple elections concurrently can have a positive impact on turnout (Cancela and Geys, 2016), as voters are more likely to take an interest in at least one of the contests.
Finally, before being included in the models, all interval-level variables were centred around the group mean, and divided by two standard deviations, following the conventions outlined by Gelman (2008) and Enders and Tofighi (2007). As such, the intercepts for each model refers to the expected value of the outcome when all interval-level independent variables are held at the mean for that election study, rather than zero; while the coefficients themselves refer to the unit change in Y for a two standard deviation increase in X. This allows for simpler interpretation of model estimates, as all interval variables follow a similar scale.
Analysis
To test whether the electoral laws outlined above display any significant relationship with the degree of equality in voting behaviour, this study employed multi-level logistic regression modelling. Since the dependent variable can only take one of two values – whether or not an individual voted – a logistic model is appropriate for this application. Moreover, a multi-level design was used to account for the nested structure of the data, since the CSES surveys target individuals clustered within different election studies. As such, the analysis was conducted using a varying intercept multi-level logistic model.
In terms of the wider cross-sectional approach taken by this study, this inevitably comes with its own limitations and advantages. One drawback is the inability to test the direction of causality in comparison to longitudinal studies, where time can be used to see a clear pattern of cause and effect. There is also the possibility of reverse causality, that populations with low turnout, or a certain socio-demographic make-up are more likely to adopt specific electoral rules.
Examining instances of electoral reform over time can come with its own methodological difficulties, however, due to the fact that when reforms do happen, multiple aspects of a political system are often changed simultaneously, making disentangling the individual causal mechanisms at play more challenging. Another issue is that due to the long-term structural nature of these laws, there may be a time-lag before the full effects of any institutional changes become apparent, as voters gradually gain firsthand experience with these new features of the political system (Gallego et al., 2012).
Despite the limitations that come with this type of cross-sectional research design, exploring the cross-level interactions between the individual- and system-level characteristics of interest can still offer useful insights. Identifying how patterns of inequality relate to particular institutional arrangements can highlight potential reforms that can be tested by alternative research designs which can appropriately isolate the specific causal mechanisms at play.
Results
The results of the regression analyses are displayed in Tables 1 and 2. These tables list the coefficients for each of the variables included in the cross-level interactions, that is, the electoral law being examined, alongside age, education and income. The full output containing all the coefficients for the other electoral rules and each control variable are included in the online appendix. The dependent variable being explored in all models is whether or not an individual reported voting in their country’s most recent legislative election, and coefficients are given in log odds.
Electoral Laws and Voter Turnout – Interaction Effects.
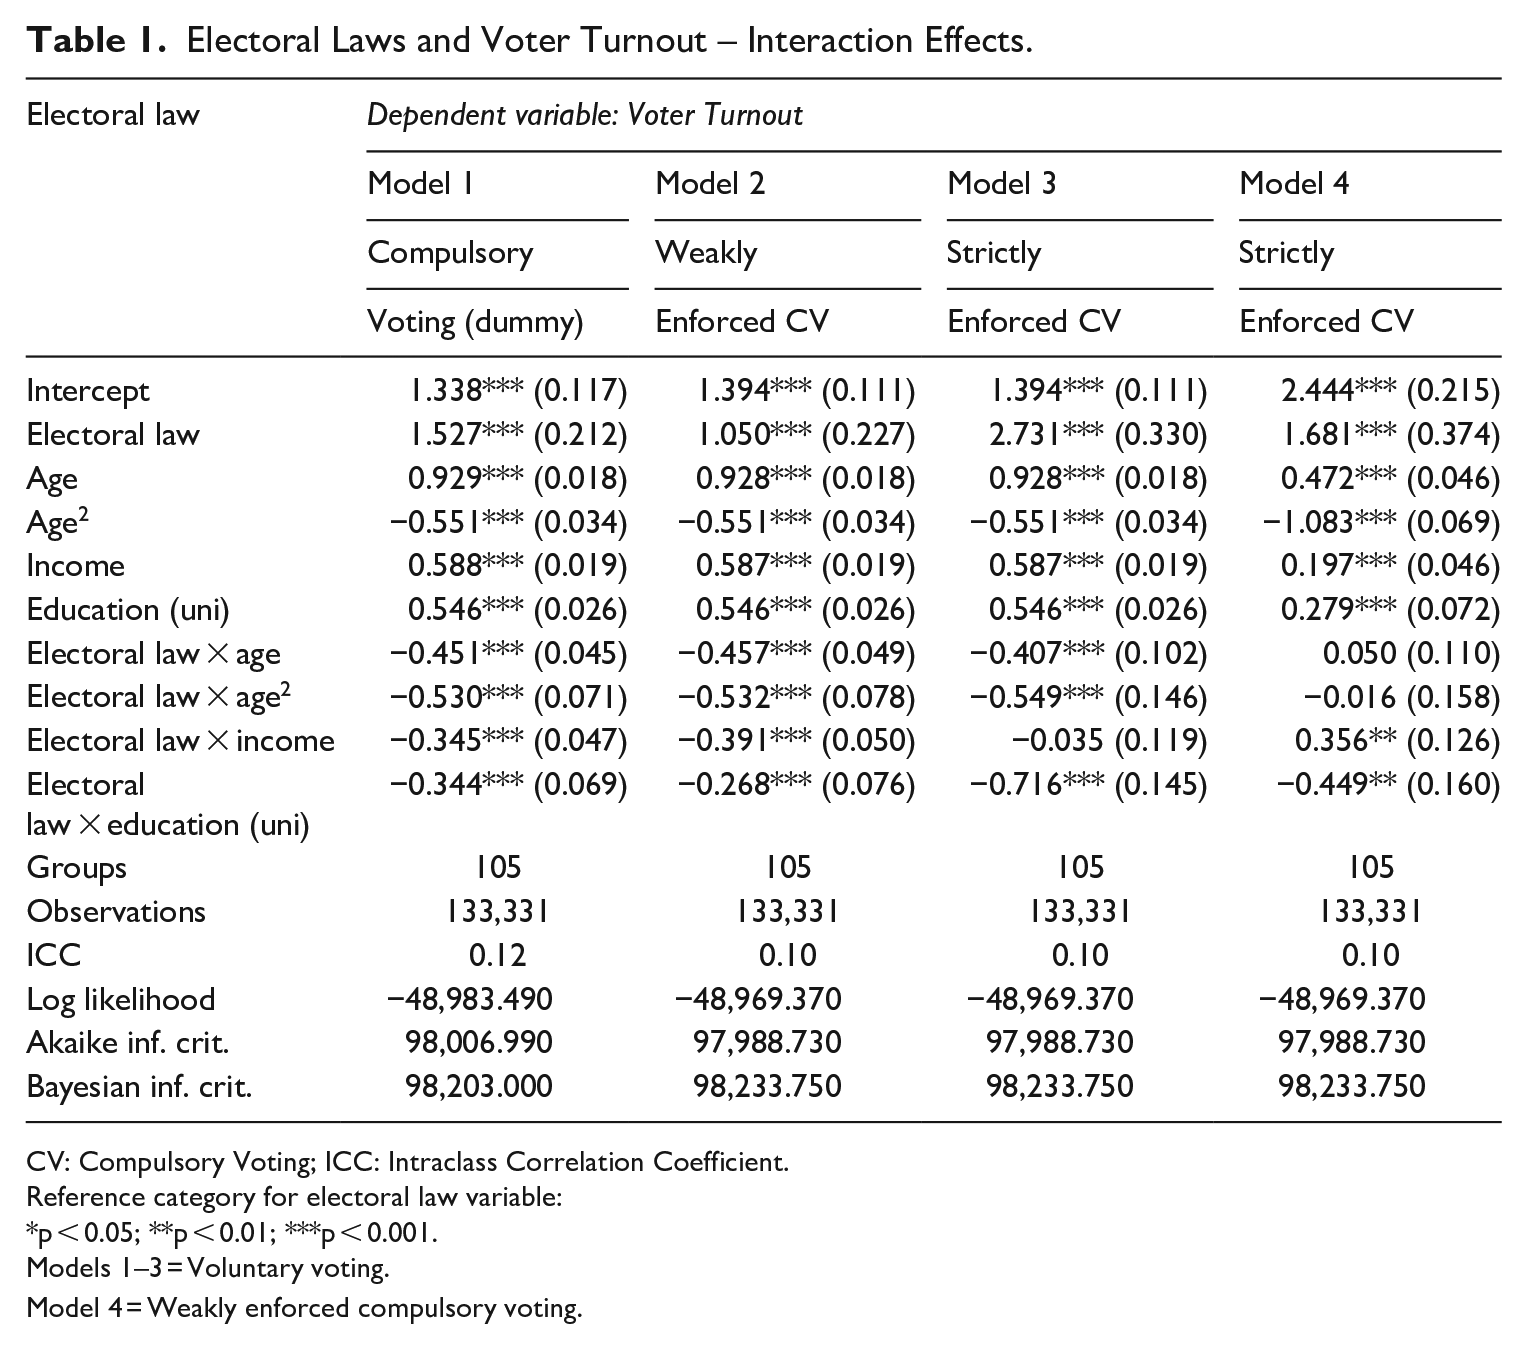
CV: Compulsory Voting; ICC: Intraclass Correlation Coefficient.
Reference category for electoral law variable: *p < 0.05; **p < 0.01; ***p < 0.001.
Models 1–3 = Voluntary voting.
Model 4 = Weakly enforced compulsory voting.
Electoral Laws and Voter Turnout – Interaction Effects (cont.).
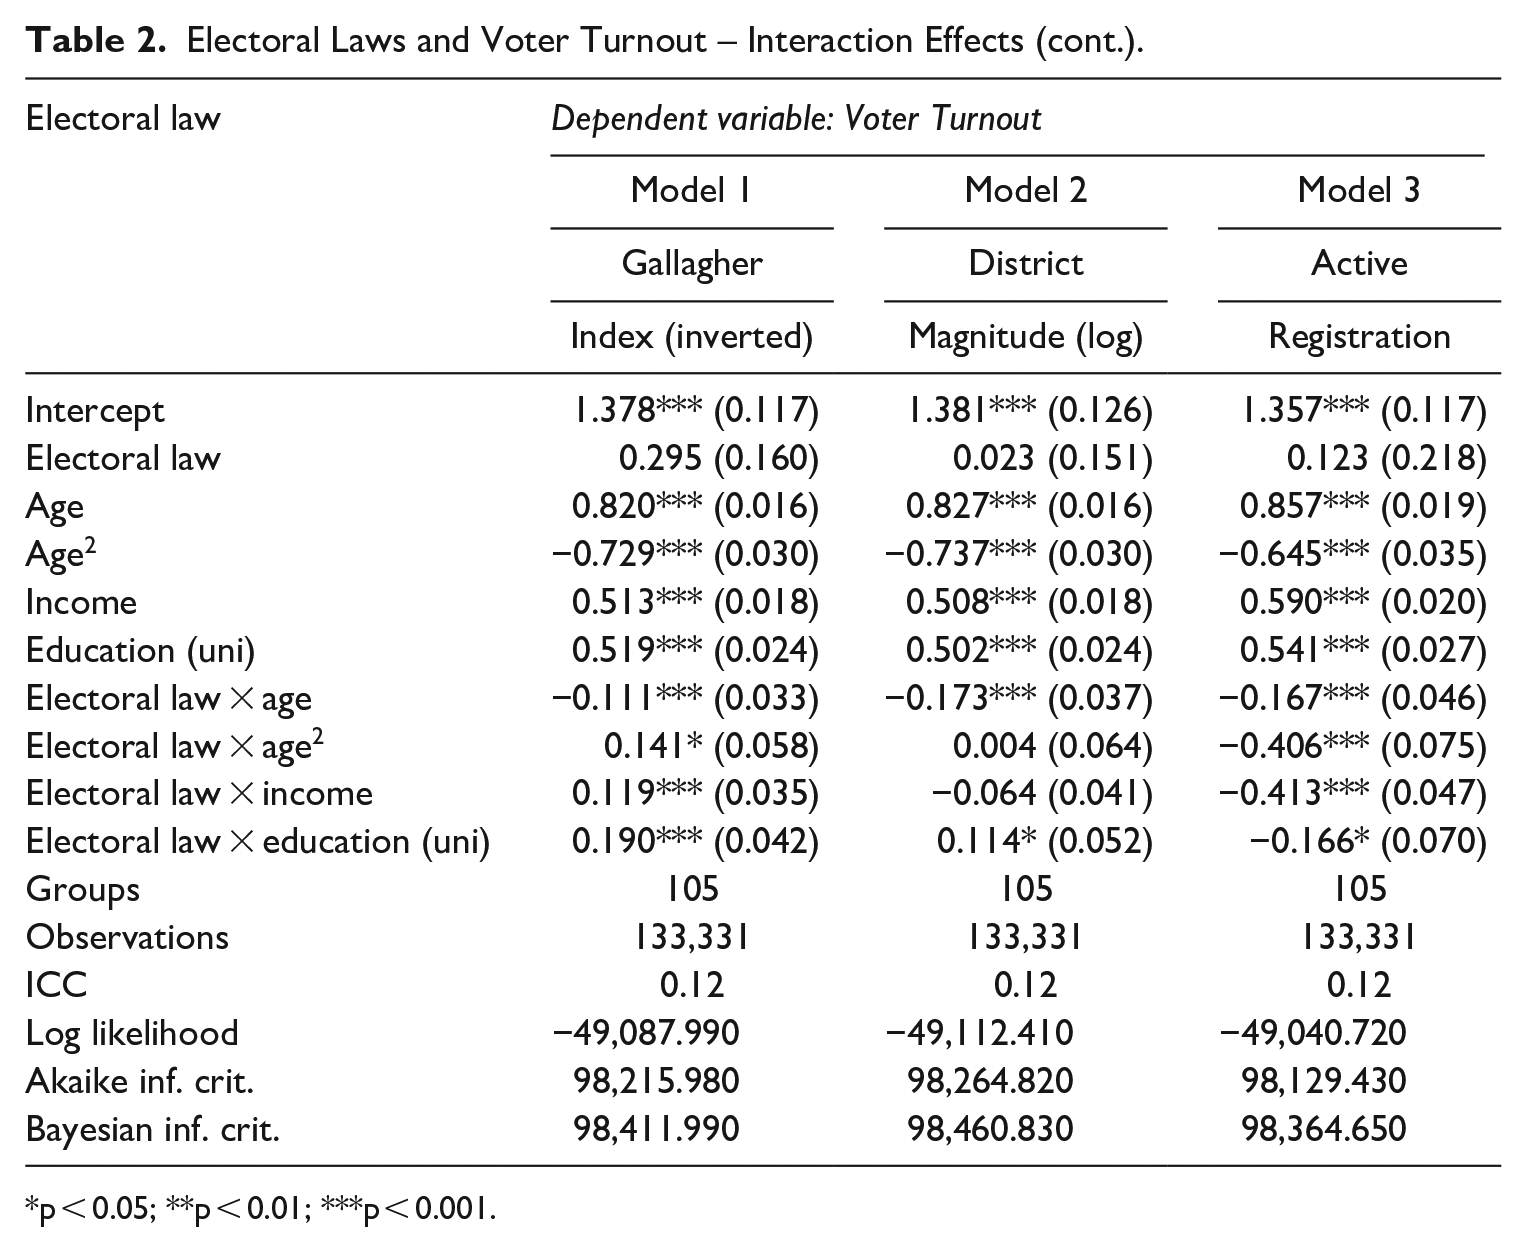
p < 0.05; **p < 0.01; ***p < 0.001.
In Tables 1 and 2, the ‘Electoral Law’ predictor in each model refers to the specific institutional variable being examined, and is listed below the model number. In Table 1, Model 1 uses the dummy compulsory voting measure, while Models 2 and 3 compare both weakly and strictly enforced compulsory voting against the voluntary reference category. Model 4 then compares strictly enforced compulsory voting against weakly enforced systems. In Table 2, Models 1 and 2 examine the impact of electoral system proportionality using the inverted Gallagher index, and district magnitude measures, respectively. Finally, Model 3 compares the impact of active registration versus the passive registration baseline category.
It is important to note that due to the cross-level interaction terms included in these models, the coefficient for each ‘Electoral Law’ variable does not represent the direct effect of that rule on turnout, but rather its effect on turnout conditional on the other individual-level variables included in the interaction. As such, additive models were also run without any interaction terms. This allows us to see the unconditional main effect of each electoral law on turnout. The full list of model outputs is displayed in the online appendix. Aside from extremely minor differences in effect sizes, the substantive interpretation of the results for the electoral rules and individual-level predictors remained the same across both model specifications.
Before examining the interaction terms, it is worth taking the time to assess the main effects for both the electoral laws and socio-demographic variables. Compulsory voting produced positive and statistically significant coefficients across all models, with stricter enforcement in particular being associated with higher turnout. Although the positive conditional main effect for the inverted Gallagher index measure failed to reach statistical significance in Model 1 of Table 2, this predictor was significant at the p < 0.05 level in all other additive and interactive model specifications. The consistency of the effect when no interaction terms are present indicates that on average, more proportional electoral outcomes are associated with higher rates of voter turnout. Finally, both the district magnitude and active registration variables produced positive coefficients, but failed to reach any degree of statistical significance. Overall, these results suggest that compulsory voting in general, and the strict enforcement of these rules in particular, as well as more proportional electoral outcomes, are associated with a significant increase in average turnout rates.
All three individual-level variables displayed a positive and statistically significant relationship with turnout. University education and higher household income were both associated with an increased likelihood of voting in an election. The coefficient for age was also positive, with a negative squared term, indicating that as age increases, so does the likelihood of voting; however, this positive effect weakens somewhat when we get to the higher age ranges. These results underline the fact that individual-level characteristics play a substantial role in influencing voting behaviour, and that a significant gap exists between those who do and do not participate, which presents itself across clear socio-demographic lines.
Moving on to the interaction terms, Model 1 in Table 1 allows us to directly address the first hypothesis, comparing any form of mandatory voting against voluntary systems. The interaction terms are all negative and statistically significant at the p < 0.05 level, allowing us to reject the null hypothesis. Overall, these results demonstrate that the influence of socio-demographic variables are all reduced under compulsory voting systems in comparison to voluntary voting, thus lending support to H1.
Models 2 and 3 in Table 1 can be used to evaluate whether the effect of these laws vary depending on the degree to which they are enforced. The interaction effects in Model 2 regarding weakly enforced compulsory voting compared with voluntary systems, are all negative and statistically significant at the p < 0.001 level. It is important to note that when the additional robustness checks were conducted, the negative interaction between weakly enforced compulsory voting and education was no longer statistically significant. This disparity may be due to the relatively low number of cases remaining in the ‘weakly enforced’ category once any turnout outliers have been removed. Nevertheless, these results indicate that the impact of both age and income on turnout are consistently reduced under compulsory voting, compared with voluntary systems, even when the enforcement of these laws is relatively lax.
Moving on to strictly enforced compulsory voting, the interaction effects listed in Model 3 are again, all negative, meaning that the impact of each factor is reduced under this electoral rule compared with voluntary voting, but only the terms for age, age squared and education reach any degree of statistical significance. To directly compare the two forms of compulsory voting, an additional model was included, with weakly enforced compulsory voting set as the baseline category (Model 4 of Table 1). The interaction terms indicate that in comparison to weakly enforced systems, under strict enforcement there is no difference in terms of the effect of age on voting. By contrast, the effect of educational inequality is reduced by strictly enforced compulsory voting, while the effect of income inequality is increased.
At first instance, these results seem to only lend limited support to the claims of H2, as stricter enforcement does not universally lead to reduced turnout inequalities. To fully explore this relationship, however, it is necessary to plot the predicted probabilities for each voting system across a range of values for each individual-level variable. Figure 1 displays the interaction effects between the ordinal measure of compulsory voting, with regard to age, income and education. In general terms, the slope of each line illustrates the degree to which the relevant individual-level variable influences voting behaviour under each type of system.
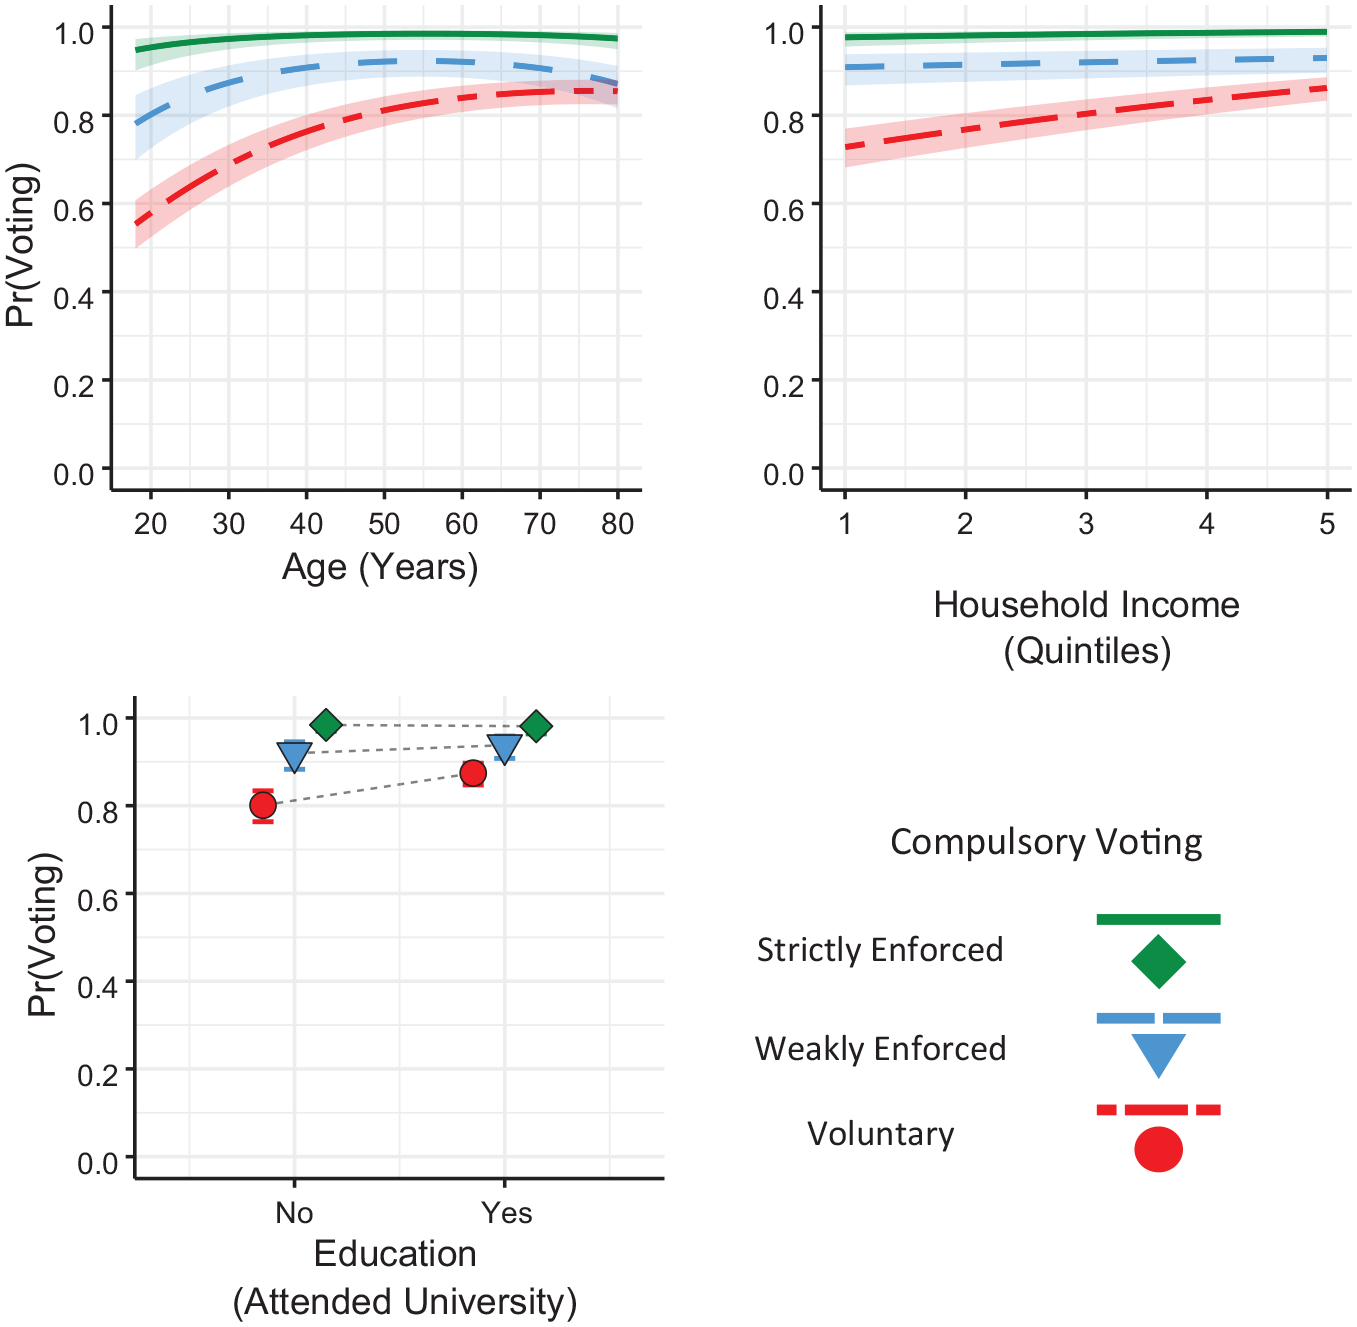
Compulsory Voting – Interaction Effects.
From the first plot in Figure 1, which looks at age, a clear trend emerges in that compulsory voting more generally, and the strict enforcement of these laws in particular, is linked with a reduction of the age-based turnout gap. Based on the model’s estimates, the average difference in predicted probability of voting between those aged 20 and 60 is 26% in voluntary elections, 11.9% under weak enforcement and just 3.1% for strict enforcement. A similar pattern can be observed in the other two plots in Figure 1, for both income and education. Again, the flattening of these lines indicates that the impact of each individual-level variable is reduced when mandatory voting is in place, and especially when these rules are strictly enforced.
Despite the fact that the interaction terms for strictly enforced compulsory voting and the socio-demographic variables did not align with the expectations of H2, this form of compulsory voting increases overall turnout to such a considerable extent, that the ceiling effect effectively suppresses inequality of participation due to these characteristics.
In Table 2, Model 1 lists the results for the inverted Gallagher index measure of electoral system proportionality. In terms of the cross-level interactions, we can see that the coefficient for age is negative, while the coefficients for age squared, income and education are all positive. All of these effects are significant at the p < 0.05 level. This indicates that while systems that produce more proportional electoral outcomes are linked with a reduction in the impact of age on turnout, proportionality is also associated with a marginal increase in the influence that income and education exert on the likelihood of voting.
In the additional robustness tests (included in the online appendix), the interaction between proportionality and the age squared term was no longer significant, however, the negative coefficient for the linear age term meant that proportionality was still associated with a statistically significant reduction in the age-based turnout gap. The predicted probabilities for each interaction, based on the output of Model 1, are shown in Figure 2.
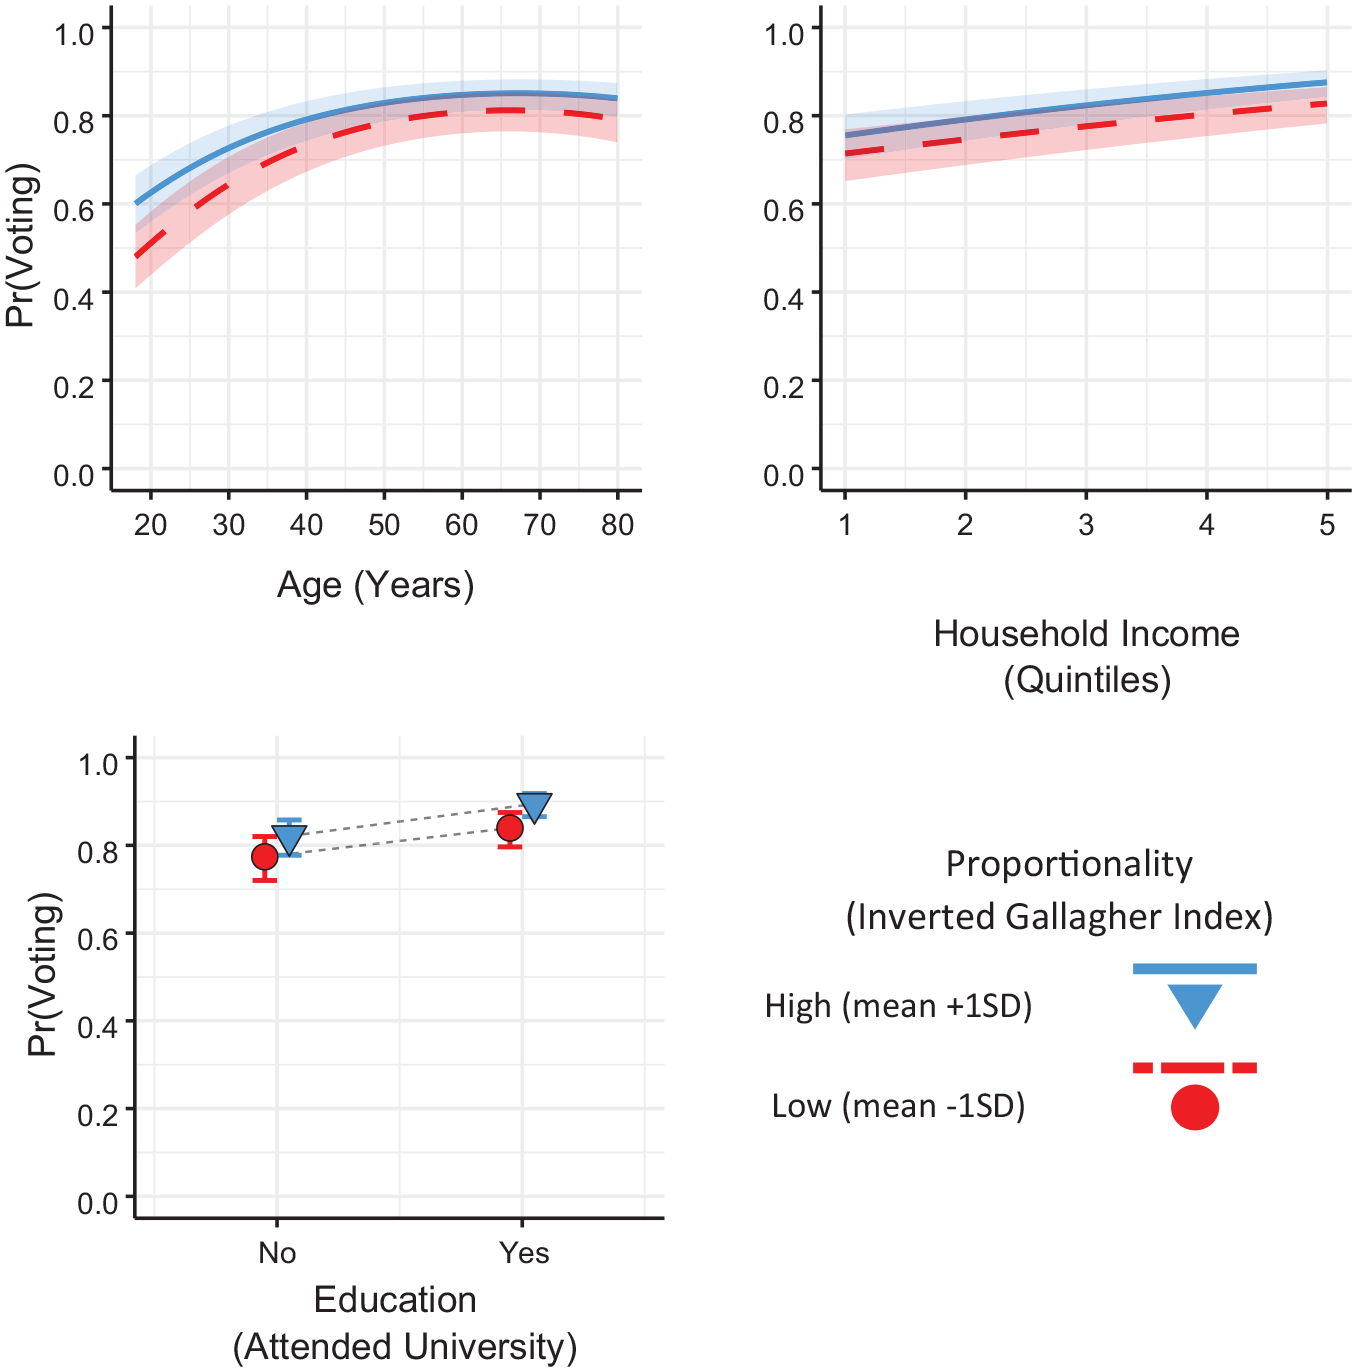
Proportionality (Inverted Gallagher Index) – Interaction Effects.
The model estimates that on average, the gap in predicted probability of voting between those aged 20 and 60 years old is 7.6 percentage points smaller when electoral outcomes are more proportional. The remaining two plots in Figure 2 illustrate the impact of proportionality on income and education. Despite the statistically significant interaction effects, in practical terms, the difference in predicted probabilities across the lowest and highest income quintiles, and between those with and without a university education were extremely small (less than 1%). As such, these findings fail to fully support the direction outlined by H3, that more proportional election outcomes are associated with reduced turnout inequality.
The second measure of electoral system proportionality, district magnitude, was examined in Model 2 of Table 2. Here the only interaction terms that reached any degree of statistical significance were age, which was negative, and education, which was positive. While this aligns with the direction of the previous findings regarding electoral outcomes, the effect sizes were even smaller here. The predicted turnout age gap between 20- and 60-year-olds was 5 percentage points smaller in higher district magnitude systems, while the education gap was again marginally widened by less than 1%. All marginal effects plots for this measure are included in the online appendix. While this again only lends partial support to the claims of H3, district magnitude appears to have an even weaker relationship with turnout inequality in comparison to the proportionality of actual electoral outcomes.
Moving on to the relationship between voter registration and turnout inequality, the relevant results are displayed in Model 3 in Table 2. The ‘Electoral Law’ variable here refers to the effect of active registration, compared with the passive registration baseline category. Mixed systems are also included in the model, with results available in the online appendix. In terms of the cross-level interactions, all coefficients are negative and statistically significant at the p < 0.05 level. Two sets of robustness checks were conducted for this variable. First, the models were re-run using a dummy variable which grouped mixed and active systems together, pitting them against the passive registration baseline category. Apart from marginal differences in effect sizes, the results were consistent in terms of both their direction and degree statistical significance. When the models were then re-run with the reduced number of election studies in the turnout robustness check, the extremely small interaction term between active systems and education failed to reach any degree of statistical significance. All additional models are included in the online appendix.
The predicted probability of voting across different values of these individual-level predictors is displayed in Figure 3. In the first of the three plots, we can see that the curvilinear relationship between age and the predicted likelihood of voting is marginally exacerbated for the active category. In practical terms, these effect sizes are almost negligible, with less than a 1 percentage point difference in the predicted age-based turnout gap between 20- and 60-year-olds in active compared with passive registration systems. As can be seen by the flattening of the slope in the second plot representing active registration and income, the average difference in predicted probability of voting between the lowest and highest income quintiles is estimated to be 9.9 points lower in active than in passive systems.
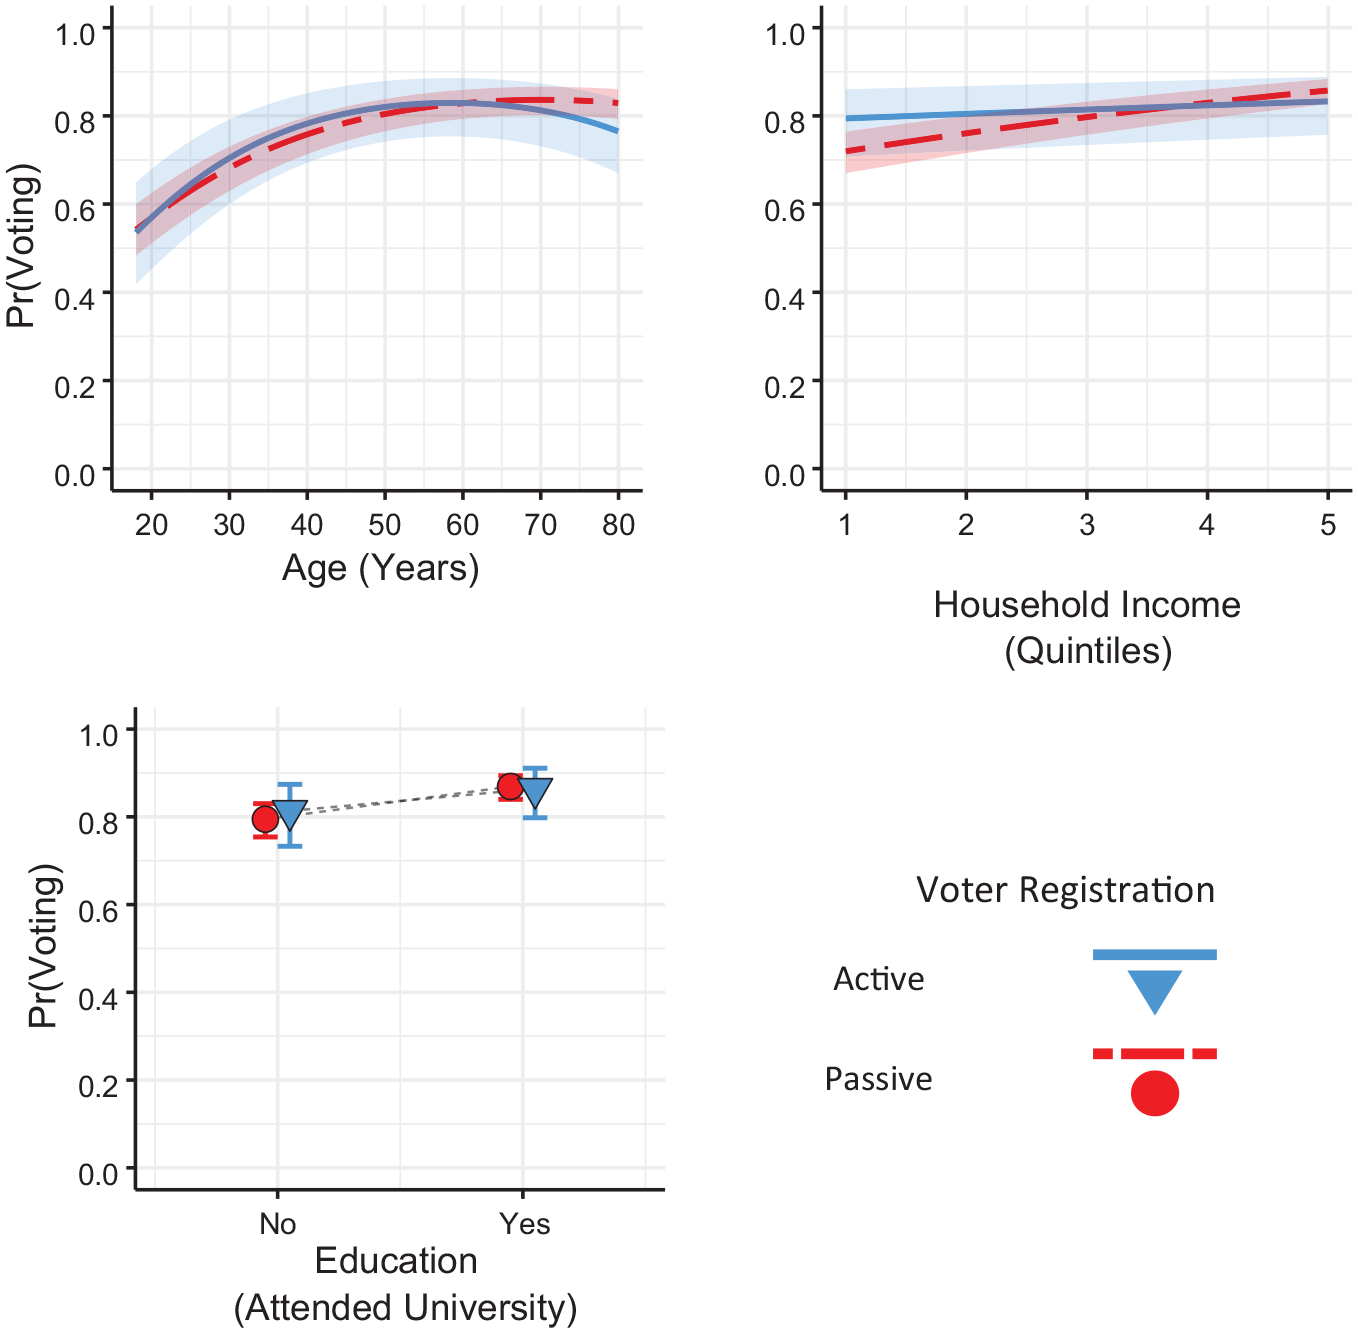
Voter Registration – Interaction Effects.
Overall then, these findings somewhat contradict the direction outlined in H4, which expected a reduction in the effects of individual-level predictors under more passive registration systems. Although this was the case for age, the effect size was extremely small here, while the effect of income on voting was actually exacerbated in comparison to active systems, and there was no consistent difference in terms of educational inequalities.
Discussion
In attempting to answer the question of whether certain electoral laws are linked with reduced socio-economic biases in democratic elections, the findings of this project suggest that compulsory voting laws, and to a far more limited extent, the proportionality of electoral systems and voter registration are directly associated with levels of turnout inequality. In terms of compulsory voting, the results lend clear support to H1, that any form of mandatory voting is linked with a substantial reduction in turnout inequality across all the socio-demographic predictors included in the analysis, namely: age, income and education. These results are also in line with the expectation of the law of dispersion (Tingsten, 1937), and recent findings that increases in overall electoral participation run in tandem with reduced socio-economic turnout inequalities (Bhatti et al., 2019; Dassonneville and Hooghe, 2017; Persson et al., 2013). While further research is evidently needed, this reinforces the notion that compulsory voting may have the potential to be one the most effective means of addressing some of the most pressing issues facing modern democracies.
In terms of how these laws are put into practice, even in cases where the penalties and enforcement of these laws are relatively lax, the results nevertheless indicate that compulsory voting is linked with a reduction in the unequal impact of age and income on voting. The only variable for which there was no significant interaction effect was education. This implies that the use of compulsory voting laws, even in cases where these rules are rarely backed up by legal sanction or consistently enforced, nevertheless have a direct link with citizens’ decision-making process when it comes to participating in elections.
In examining cases where these laws are more strictly enforced, the only area where these rules performed better than weakly enforced systems was in terms of education, where there was a significant reduction in the turnout gap. As can be seen in Figure 1, however, these interaction effects are often outweighed by the ability of strictly enforced systems to push turnout so close to its maximum that inequality of participation was nonetheless lower across different groups in society.
In terms of electoral systems, these findings align with some of the core expectations of the resource model (Brady et al., 1995a), that more proportional electoral systems are associated with, at best, no difference in the turnout gap regarding education and income, and in the worst instances, may be linked with a small increase in the salience of these resources. Proportionality does, however, seem to display a positive relationship with youth participation, and may be a promising area to explore in attempts to combat the current age-based turnout gap across many contemporary democracies. The underlying mechanism behind this specific pattern, however, is still somewhat unclear. It could be the case that one, or a combination of the features of proportional systems that are held to boost turnout have a specific appeal to younger voters, such as the perception of fairness and representativeness that proportional outcomes promote, or the political culture of compromise and political debate fostered by consensus politics. While higher district magnitudes were also associated with a reduction in the age gap, the substantive impact was weaker here in comparison to the Gallagher index measure. One explanation for this may be that voters are far more likely to be aware of the result of the previous election, as opposed to the constitutional design of their electoral system. As such, citizen’s hands-on experience of electoral politics may play a larger role in their future decision-making process (Gallego et al., 2012).
In terms of registration, the models indicated that passive systems were associated with a statistically significant, but practically negligible reduction in the impact of age on turnout. Somewhat surprisingly, passive systems were also linked with an increase in the salience of income compared with active registration, while the impact of education was somewhat inconsistent across different model specifications. As such, these results lend minimal support to the claims of H4. These findings also contradict some of the general expectations from the literature, and instead give credence to the notion that having to take active steps to register for an election may result in a ‘sunk cost’, which makes some citizens more likely to vote (Erikson, 1981). While previous research has pointed to the ability of automatic registration to foster participation in some of the most vulnerable sections of society including immigrants and ethnic minority groups (Braconnier et al., 2017), this same pattern does not seem to hold when it comes to income and educational inequalities.
When evaluating the overall findings of the project at hand, it is crucially important to reiterate the potential limitations of this research. One issue is that while the cross-sectional nature of the data can uncover whether any significant relationship exists between the independent and dependent variables, it cannot test the direction of causality between the two. It may well be the case that societies with already relatively high turnout rates are more likely to then adopt compulsory voting laws, rather than the other way around.
Furthermore, the biases arising from self-reported turnout measures strongly suggest that actual levels of turnout inequality are likely to be even greater than the already significant gaps identified here in terms of age, education and income (Dahlgaard et al., 2019; Lahtinen et al., 2019). This again highlights the importance of studying patterns of inequality, and exploring potential features that are related to reductions in these sources of unequal political participation. Additional research that makes use of validated turnout measures may be able to more accurately predict these patterns of inequality within the population. Although population registers used by several advanced democracies can provide high-quality validated turnout data, one key barrier to this type of research is that data are far more difficult to obtain in a large-N cross-national comparative context. As such, lacking any other verifiable voting figures at this disaggregated level of analysis, the CSES survey question is an appropriate, albeit imperfect data source for this project.
Despite these limitations, the ability of this methodological approach to examine a wide array of electoral rules across different political contexts, and how they relate to different sources of political inequality, remains well suited to addressing the research question at hand. Moreover, this study highlights several areas that future research can explore in terms of examining specific cases over time, and using data and methods that can directly address the issue of causality.
Conclusion
In attempting to answer the question of whether electoral laws are associated with reduced levels of turnout inequality, these results suggest that institutional features such as compulsory voting, and to a far lesser extent, electoral system proportionality and voter registration are significantly related to the equality of electoral participation.
The evidence here indicates that compulsory voting has by far the strongest association with turnout equality. In terms of how these laws are put into practice, even when weakly enforced, they are still linked with more equal electoral participation. Moreover, when these rules are backed up by more strict enforcement, turnout tends to be as such a high level that it effectively suppresses voter inequality among different demographic groups.
The results regarding electoral system proportionality are somewhat less clear-cut. While it appears that proportionality is linked with higher overall turnouts and somewhat increased youth engagement, it does not seem that this aspect of electoral reform holds much promise for addressing educational or income-based turnout divides. Future research may be able to uncover whether any specific form of proportional representation can strike the balance of retaining this positive relationship with age, while minimising the resource-based inequalities inherent in adopting more complex electoral formulas.
In terms of voter registration, the results here indicate that while automatic registration was linked with a statistically significant reduction in the turnout age gap, in practical terms the size of this effect was negligible, and passive registration also slightly exacerbated the unequal effect of income on voting. Further research into the numerous ways in which registration procedures are implemented in practice can help determine whether systems that require at least some degree of citizen involvement, but which remain as accessible and transparent as possible may help mitigate these issues.
While there are some limitations to this type of research, including the cross-sectional nature of the methodological approach, as well as the reliability issues associated with self-reported survey data, these findings nevertheless offer a unique insight into the relationship between electoral laws and voter inequality. There is also a clear gap that can be filled by future research that explores the interactions between these often complementary electoral rules. Taken as a whole, these findings suggest that while there is no single policy that can hope to solve the problem of political inequality, by re-evaluating certain aspects of the rules that govern our political systems, we can move closer towards identifying specific features that may hold the potential to help reintegrate many of those who have traditionally been excluded from electoral politics back into the political fold.
Supplemental Material
sj-pdf-1-psx-10.1177_00323217221096563 – Supplemental material for Engineering Democracy: Electoral Rules and Turnout Inequality
Supplemental material, sj-pdf-1-psx-10.1177_00323217221096563 for Engineering Democracy: Electoral Rules and Turnout Inequality by Brian Paul Boyle in Political Studies
Footnotes
Acknowledgements
I would like to thank Heinz Brandenburg, Gabriela Borz, Stefanie Reher, Will Jennings, and Ruth Dassonneville for their incredibly useful feedback on previous versions of this work. I would also like to thank the Editor and Reviewers for their time and extremely helpful comments in improving this project.
Declaration of Conflicting Interests
The author(s) declared no potential conflicts of interest with respect to the research, authorship and/or publication of this article.
Funding
The author(s) received no financial support for the research, authorship and/or publication of this article.
Supplemental Material
Additional Supplementary Information may be found with the online version of this article.
Case Selection
Measuring Turnout
Figure 1: Turnout Measure Comparison - 105 Election Studies
Figure 2: Turnout Measure Comparison - 89 Election Studies
Table 1: Electoral Laws Frequency Tables
Descriptive Statistics
Table 2: Categorical Control Variables Frequency Table
Variable Coding
Voter Registration
Table 3: Data – Type of Voter Registration System in Use
List of Models
Table 4: Additive Model – Full set of Election Studies (105 cases)
Table 5: Additive Model – Turnout Robustness Check (89 cases)
Table 6: Interaction Models – Full set of Election Studies (105 cases)
Table 7: Interaction Models – Full set of Election Studies (105 cases) cont.
Table 8: Interaction Models – Turnout Robustness Check (89 cases)
Table 9: Interaction Models – Turnout Robustness Check (89 cases) cont.
Table 10: Voter Registration Dummy Variable Robustness Check
Interaction plots
Figure 3: Compulsory Voting (dummy) Interaction Plot
Figure 4: Compulsory Voting (ordinal) Interaction Plot
Figure 5: Gallagher Index Interaction Plot
Figure 6: District Magnitude Interaction Plot
Figure 7: Voter Registration Interaction Plot (mixed control category not plotted)
References
Author Biography
References
Supplementary Material
Please find the following supplemental material available below.
For Open Access articles published under a Creative Commons License, all supplemental material carries the same license as the article it is associated with.
For non-Open Access articles published, all supplemental material carries a non-exclusive license, and permission requests for re-use of supplemental material or any part of supplemental material shall be sent directly to the copyright owner as specified in the copyright notice associated with the article.