
Abstract
There is perennial debate in comparative politics about electoral institutions, but what characterizes this debate is the lack of consideration for citizens’ perspective. In this paper, we report the results of an original survey conducted on representative samples in 15 West European countries (N = 15,414). We implemented an original instrument to elicit respondents’ views by asking them to rate “real but blind” electoral outcomes. With this survey instrument, we aimed to elicit principled rather than partisan preferences regarding the kind of electoral outcomes that citizens think is good for democracy. We find that West Europeans do not clearly endorse a majoritarian or proportional vision of democracy. They tend to focus on aspects of the government rather than parliament when they pass a judgment. They want a majority government that has few parties and enjoys wide popular support. Finally, we find only small differences between citizens of different countries.
Introduction
Since the end of the Cold War, there is a wide consensus that democracy is the best system of government (Fukuyama, 1992). Although the actual functioning of representative democracy is increasingly criticized, as illustrated by the growing distrust of politicians and parties (Dalton, 2004; Putnam, 2002), international survey data show that a vast majority of citizens worldwide think that democracy is a good system of collective governance (Anderson et al., 2020; Norris, 2011). Yet, what kind of electoral institutions do people think is good or bad for democracy? As Lijphart (2012) and Powell (2000) elegantly argue, there are two contrasting visions: majoritarian and proportional. On the one hand, the majoritarian vision values concentrated political power that facilitates the rapid implementation of coherent policies, as well as accountability and stability. On the other hand, the proportional vision values inclusive and accommodative political power that takes the concerns of as many groups as possible into account.
Whether a democracy functions in a proportional or majoritarian way depends in good part on the electoral system (Farrell, 2011; Lijphart, 2012; Norris, 2004). When the main chamber(s) use(s) proportional representation, the legislative power is often split among various parties, which forces these parties to collaborate to pass a law (either formally in a governing coalition or informally in case of minority governments). By contrast, a majoritarian electoral system gives an advantage to the largest parties, which often means that a single party holds a majority of parliamentary seats and can govern alone. This creates an inextricable trade-off: depending on their electoral system, some democracies are more of one type or the other, but they cannot be perfectly proportional and perfectly majoritarian at the same time (Carey and Hix, 2011; Shugart and Wattenberg 2001; Taagepera and Nemčok, 2021).
There is another debate in comparative politics about the place of the executive and legislative branches of the state. On the one hand, those who support proportional representation are concerned about fairness and how well the parliament reflects the distribution of votes, but at the same time argue that coalition governments foster compromise. Those who support majoritarian systems on the other hand insist on the importance of governments being able to exercise strong and steady leadership (Blais, 1991; Farrell, 2011). This raises the question of whether citizens focus on aspects of the executive or legislative branch when they evaluate the functioning of a political system. This debate also relates to the discussion about the relative importance of the two branches in the collective decision-making process and how citizens perceive this balance (Poguntke and Webb, 2005; Samuels and Shugart, 2012).
In this paper, we contribute to these two debates over electoral institutions by asking ordinary citizens to evaluate electoral outcomes. We conducted an innovative survey in 15 West European countries (N = 15,414), in which we asked representative samples to rate vignettes presenting vote shares, seat shares and the composition of government, on a scale from 0 to 10, where 0 means “very bad for democracy” and 10 means “very good.” We selected West European countries because we are interested in the views of citizens living in established democracies, who presumably have had time to form opinions on the matter.
Importantly, the electoral outcomes were “real” in the sense that they were coming from genuine electoral results in Western Europe these last 25 years, but “blind” in the sense that we did not tell respondents that they corresponded to real elections, neither did we tell them from which country these were or who the parties were. Although electoral outcomes only reflect the most immediate consequences of electoral systems (they do not reflect the long-term consequences for redistribution, see for instance Iversen and Soskice, 2006), we believe this approach allows us to effectively capture citizens’ views on the matter. It is more natural and intuitive for citizens to pass a judgment on concrete results rather than on abstract and technical rules. Furthermore, people are used to see electoral outcomes, and they update their political attitudes following the announcement of results (Anderson et al., 2005). Finally, the blind nature of the vignettes means that we can elicit principled rather than partisan preferences regarding the kind of electoral outcomes that citizens believe are most appropriate in a democracy.
We conduct two sets of analyses. In the first we identify what electoral outcomes respondents consider good for democracy and the characteristics that these outcomes have in common; in the second we explore differences between respondents over what constitutes a good outcome. Our main findings are the following. First, we find that citizens focus on aspects of the government rather than parliament when they pass a judgment. Second, the electoral outcomes that citizens find it good for democracy do not neatly conform to the proportional or majoritarian vision of democracy. On the one hand, possibly because they are concerned with accountability, they want few parties in government. On the other hand, possibly because they are also concerned with representativeness, they insist that the governing parties enjoy wide support in the population. Finally, we find that respondents provide relatively similar answers regardless of the electoral and political system in place in their country.
Our paper contributes to the literature on comparative politics in two ways. First, it enriches our understanding of citizens’ conceptualization of what electoral democracy does and does not entail. Most importantly, we find that in the eyes of ordinary citizens it is the government not parliament that matters the most for the functioning of democracy. Their evaluations are mainly influenced by the variables that relate to the composition of the executive and little affected by those that relate to the composition of the legislative. Second, in a world in which established democracies are under the threat of populist leaders with authoritarian tendencies if not blatant authoritarian ideologies (Levitsky and Ziblatt, 2018; Norris and Inglehart, 2019), our data suggest that the kind of reform that may garner strong public support is one that produces electoral outcomes in which there are few governing parties that enjoy a majority of parliamentary seats and a large combined vote share.
Studying Citizens’ Views about Electoral Institutions
The literature takes three different roads to study citizens’ views about electoral institutions. First, many studies adopt a cross-national approach by looking at satisfaction with democracy across countries in international surveys (Aarts and Thomassen, 2008; Anderson and Guillory, 1997; Bernauer and Vatter, 2012; Farrell and McAllister, 2006; Norris, 2004). The advantage of this approach is that it can cover countries throughout the world and thus ensures the strong external validity of the findings. Yet, a key issue is the absence of counterfactual for survey respondents. Respondents are simply asked whether they are satisfied under the current democratic arrangement, but we do not know whether they would be more or less satisfied under another one. What is more, cross-country studies suffer from the impossibility to control for all the cofounding effects that could possibly explain cross-country variations in the outcome variables.
Second, some studies examine people’s views during extraordinary episodes in which a proposal to change an institution is either the subject of a referendum (Banducci and Karp, 1999; Riambau et al., 2021; Vowles, 2013; Wenzel et al., 2000) or is politically salient (Aldrich et al., 2014; Vowles, 2011). The key advantage of this approach is that it directly addresses the problem of lack of counterfactuals that plagues cross-country studies. Because there is an alternative on the table, it is reasonable to assume that respondents can provide a meaningful preference between the proposed reform and the status quo. Yet, a key problem is that people’s views are strongly affected by the current political situation. Indeed, the most striking result in these studies is that citizens tend to prefer the system that would advantage their favorite party. Furthermore, such episodes are rare, and these studies are thus naturally limited in scope.
Third, a few studies are based on experiments, in which the researchers present a set of alternative political institutions to citizens before asking them which one they prefer (Bol et al., 2020; Engelman et al., 2020; Hoffmann and Renes, 2021; Plescia et al., 2020). These studies offer a solution to the problems associated with the two other types of studies presented above: (1) they propose a clear choice to respondents between alternative institutions, and (2) put them “behind a veil of ignorance” in the sense that these subjects cannot know which rule will benefit them or their favorite party. Yet for the sake of simplicity and clarity, these studies have focused on some particular elements like the translation of votes into seats without considering other aspects.
In this paper, we build on these three approaches and propose a novel one that maximizes both external and internal validity. First, we conducted our survey on representative samples from 15 countries and included vignettes presenting real electoral outcomes. Second, we asked respondents to rate different political institutions and electoral outcomes, thus providing them counterfactuals. Third, the vignettes included all main components of electoral outcomes: vote share, seat share and government composition.
The main challenge of our study is empirical. For ordinary citizens, political institutions may seem technical and complex. In asking respondents to pass a judgment on electoral outcomes rather than a technical description of the institution we aim to maximize the probability that they provide meaningful answers. As evidence of this, we find in our survey that only 13% of the respondents did not provide any answer to any of the vignettes, that is, skipped the questions entirely in refusing to answer or in responding “don’t know” (more details on this below). Moreover, only 5% of them gave the exact same rating to all vignettes, which might indicate that they did not engage seriously with the question. 1 Finally, we show below that the results of the main analysis are not moderated by respondents’ educational background, which suggests that the question was well understood by all. 2
Hypotheses
We have two goals. First, we aim at identifying what electoral outcomes citizens find good for democracy and what these outcomes have in common. Second, we wish to determine whether citizens’ views differ across groups, and especially differ depending on their country. Therefore, we have two sets of hypotheses: the six first hypotheses are about the aspects of electoral outcomes that drive respondents’ evaluations of these outcomes and the last one is about the differences between respondents.
We consider five aspects of the electoral outcome that could shape citizens’ judgments. 3 The first three come from the seminal typology of Lijphart (2012) and the study of Carey and Hix (2011), whereas the two last relate to the efficiency/legitimacy of governments. The first aspect is the number of parties in parliament. Having more parties means having more social groups and political preferences represented in the decision-making process, which leads to policies that are more consensual and accommodating for most. Along this line, several empirical studies show that the number of parties tends to be associated with high levels of satisfaction with democracy (Anderson, 1998; Ezrow and Xezonakis, 2011; Mayne and Hakhverdian, 2016) and political trust (Marien, 2011; Miller and Listhaugh, 1990). We rely on the most common indicator in the literature: the effective number of parliamentary parties (ENPP), which counts the number of parties while weighting each of them by their seat share (Laakso and Taagepera, 1979). 4 The first hypothesis is thus the following:
H1: The higher the number of parties in parliament the higher the rating of an electoral outcome. 5
The second aspect of the electoral outcome concerns the relationship between votes and seats. Here, the intuition is that citizens are concerned about a process that they consider to be fair (Esaiasson et al., 2019; Rohrschneider, 2005). Fairness is key for democracies. The good functioning of institutions relies on the willingness of citizens and politicians to accept the outcome because they believe that the process is just, even if they lost the election (Anderson et al., 2005). When it comes to the two visions of democracy, there is evidence that an election in which seats are distributed to parties as a proportion of their votes tend to be perceived as fairer (Karp and Banducci, 2008; Plescia et al., 2020). To capture the proportionality of the translation of votes into seats, we use the Gallagher index (Gallagher, 1991). 6 It measures the sum of differences between the percentage of votes and seats for each party. A purely proportional outcome, where disproportionality equals 0, is one in which the vote and seat shares are identical. The greater the difference, the more disproportional the outcome. This leads to a second hypothesis:
H2: The higher the disproportionality between vote and seat shares the lower the rating of an electoral outcome.
Whereas H1 and H2 are about parliaments, H3 has to do with governments. Although we, students of political institutions, know that the composition of parliaments and governments are related causally and conceptually (e.g. Lijphart, 2012; Powell, 2000), this might be less obvious to ordinary citizens. It is thus important to test the characteristics of the two institutions separately. The third aspect of electoral outcomes that we consider is the number of parties forming the government. The advantage of a single-party government is that it ensures clear accountability: voters can easily tell whom to reward or punish for good or bad performance (Riker, 1982). This is made more difficult under coalition governments, especially those that include many parties, because citizens cannot easily identify which party is in charge of which policy (Powell and Whitten 1993). Furthermore, coalition politics is usually assumed to be perceived negatively by citizens as it means losing control over the formation of government, which is the result of agreements between parties (Downs, 1957). Finally, coalition governments are often seen as less effective in terms of policies because the implementation of any change in the law requires a compromise between parties (Lijphart, 2012; Vowles, 2010). As a consequence, many citizens believe, ceteris paribus, that single-party governments are better than coalition governments (Christmann and Torcal, 2018; Karp and Bowler, 2001; Marien, 2011). This leads to our third hypothesis:
H3: The larger the number of parties in government the lower the rating of an electoral outcome.
The fourth hypothesis examines the possibility that people want outcomes that are neither too majoritarian nor too proportional. Following Carey and Hix (2011), we consider the possibility of an “electoral sweet spot” with modest disproportionality and party system fragmentation. If such a sweet spot is perceived by citizens, the highest ratings would be given to outcomes that are neither high nor low with regard to the three aspects of the electoral outcome presented in H1, H2, and H3. This leads to our fourth hypothesis:
H4: There is a curvilinear relationship between the number of parties, the disproportionality between vote and seat shares and the number of parties in government and the rating of electoral outcomes.
The next two aspects of electoral outcomes that we investigate are not directly linked to the electoral system: they relate to the efficiency/legitimacy of the government. The first is whether the government holds a majority of seats in parliament. At least in Europe, a substantial portion of governments are minority ones, sometimes with the support of some opposition parties (Bassi, 2017; Krauss and Thürk, 2021). Minority governments are usually seen as less desirable than majority governments for two reasons. First, they are more likely to be dismantled before term limit given that the opposition parties enjoy a majority of parliamentary seats and can always dismiss the government. This creates instability whereas citizens often want governments that are strong and steady (Gallagher et al., 2011; Warwick, 1994). Second, minority governments must negotiate with opposition parties to pass bills and adopt policies, and they are thus less likely to meet their electoral promises (Strøm and Swindle, 2002; Thomson et al., 2017). This leads to our fifth hypothesis:
H5: Electoral outcomes with minority governments have a lower rating than electoral outcomes with majority governments.
The final aspect has to do with the legitimacy of the governing parties. From that perspective what matters is how much popular support there is for the governing parties. This is indeed one of the traditional arguments against majoritarian democracy: under this system, the winner of the election manages to get a majority of the seats in parliament and to form a single-party majority government without obtaining a majority of the votes (Farrell, 2011). Worse, these systems sometimes produce “wrong winners,” that is, the party with most votes receives fewer seats than the second party, and this second party thus forms the government and leads the country. Such outcomes are not common, but they have in the past led to major electoral reforms, or at least to the creation of strong movements advocating reforms (Blais and Shugart, 2008; Renwick, 2010; Shugart and Wattenberg, 2001). Following this line of reasoning, the legitimacy of a government is ascertained on the basis of the amount of support it has received in the election. The rationale is that a good electoral outcome is one in which the government represents the views of a large portion of citizens. Our sixth indicator is therefore the share of votes obtained by the parties that form the government. The assumption is that people are more likely to characterize an outcome as “good” when that percentage is high. Thus, the sixth hypothesis is:
H6: The larger the vote share of the governing parties the higher the rating of the electoral outcome.
Finally, we have a last hypothesis about the second goal of our research: do ratings of electoral outcomes vary across groups of citizens? We focus on differences between countries, although we also check for other sources of differences between citizens below. We expect citizens to give higher ratings to electoral outcomes that are common in their country. They associate the concept of democracy to the way it is functioning in their country. Hence, they develop a taste for electoral outcomes that are similar to those they are used to in their country. This status-quo bias is well documented in studies about the parties’ and elites’ support for political institutions (Bowler et al., 2006; Pilet and Bol, 2011). We can therefore postulate that citizens are affected by the same bias. This leads to the seventh hypothesis: 7
H7: People give higher ratings to electoral outcomes that are similar to electoral outcomes in their country.
Data
To examine citizens’ views about what constitutes a good electoral outcome for democracy, we conducted a web-based survey between 2 March and 3 April 2020. We interviewed 15,414 adult citizens across 15 Western European countries: Austria, Belgium, Denmark, Finland, France, Germany, Greece, Ireland, Italy, the Netherlands, Norway, Portugal, Spain, Sweden, and the United Kingdom. 8 We recruited respondents using national gender, age, education, and region quotas matched with official statistics provided by government. Each national sample is representative of the country’s population of citizens on these covariates. For the main analysis, we weight the national samples so that the proportion of respondents in each country corresponds to the actual fraction of the total population that comes from that country in Western Europe. In doing so, we seek to explore what electoral outcomes are deemed good by the average citizen on the continent. 9
In the survey, we asked respondents to evaluate five different vignettes presenting five different electoral outcomes. These outcomes were randomly drawn from a bank of 15 electoral outcomes that we had created. This randomization is important because it ensures that (1) all 15 outcomes were as likely to be evaluated by each respondent (on average, each outcome was evaluated about 4000 times), and (2) there cannot be any ordering effect because each of the 15 outcomes was as likely to be the first, second, third … to appear on the survey. In other words, randomization cancels out any ordering effect. The unit of analysis is the respondent/vignette combination. After removing those who answered “don’t know” to this question (or refused to answer) we end up with a sample of 63,705 observations. 10
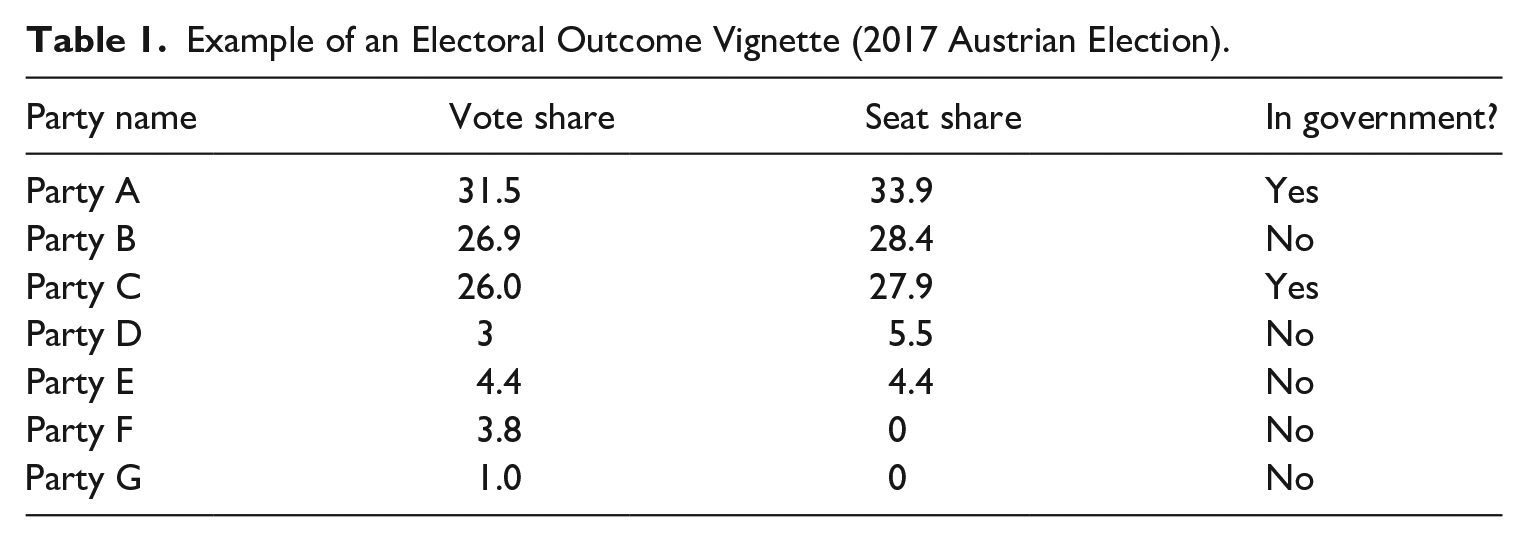
As mentioned above, a key feature of our survey instrument is that the electoral outcomes were real. There were selected from real elections in of each of the 15 countries covered in our survey (one outcome per country). To construct our bank of electoral outcomes, we looked at the five most recent national legislative elections in each of the 15 countries, and we selected the most typical election in each country, that is, the median election with respect to the effective number of electoral parties (same mathematical formula than for ENPP but with vote shares instead of seat shares). We then constructed vignettes reporting the following pieces of information: vote and seat shares of the various parties at this election, as well the list of parties that formed the government after it. We included this information for all the parties with at least 1% of the votes or at least 1% of the seats. Table 1 provides an example of the survey vignette in the way it was shown to survey respondents. This vignette is for the Austrian national election of 2017, which was won by the center-right Austrian People’s Party (ÖVP) that then formed a coalition government with the radical right Freedom Party of Austria (FPÖ). Neither the parties’ nor the country’s names were revealed to respondents. Supplemental Appendix A presents all 15 vignettes included in the survey. 11
Example of an Electoral Outcome Vignette (2017 Austrian Election).
After seeing the vignette, we asked respondents to rate the outcome on a scale from 0 to 10, where 0 means “very bad for democracy” and 10 “very good for democracy.” This rating is the dependent variable of our analysis. The mean is 5.0 and the standard deviation is 2.6. Figure 1 presents the distribution. We observe that there is heterogeneity in the way in which respondents evaluated electoral outcomes. Although many respondents chose the middle category (17% picked 5), a substantial portion chose extreme categories (12% picked 0 or 10).
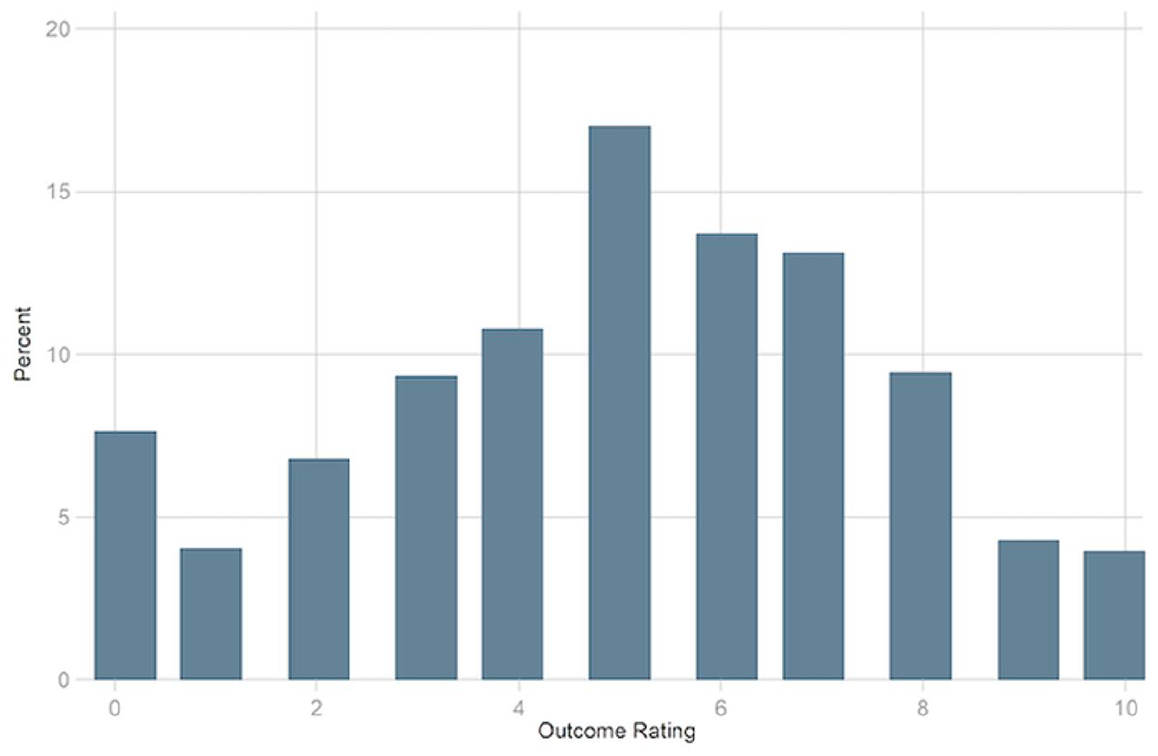
Distribution of Outcome Ratings.
Findings
In this section, we first present the mean score of each electoral outcome among the entire sample of West Europeans. Then, we test our six first hypotheses about what affects ratings. Finally, we test our seventh hypothesis about the heterogeneity of evaluations between countries.
Which Outcome is Perceived Good for Democracy?
Before testing the hypotheses, we first look at what country’s electoral outcomes are considered good for democracy by respondents. Figure 2 reports the average rating of each electoral outcome. It reveals that the most positively rated outcome is that of the 2013 German federal election with an average of 5.78 (standard deviation = 2.49). The most negatively rated is that of the 2016 Spanish election, with an average of 4.64 (standard deviation = 2.89). It is interesting to note that the outcomes that are most negatively rated are those of countries that are known to subscribe the least to the proportional vision of democracy, either because they use a plurality/majority electoral system (France and United Kingdom) or because average district magnitude is small, which facilitates the formation of single-party governments (Spain). By contrast, among the most positively rated outcomes we find countries with a very proportional (Netherlands) or compensatory mixed system (Germany).
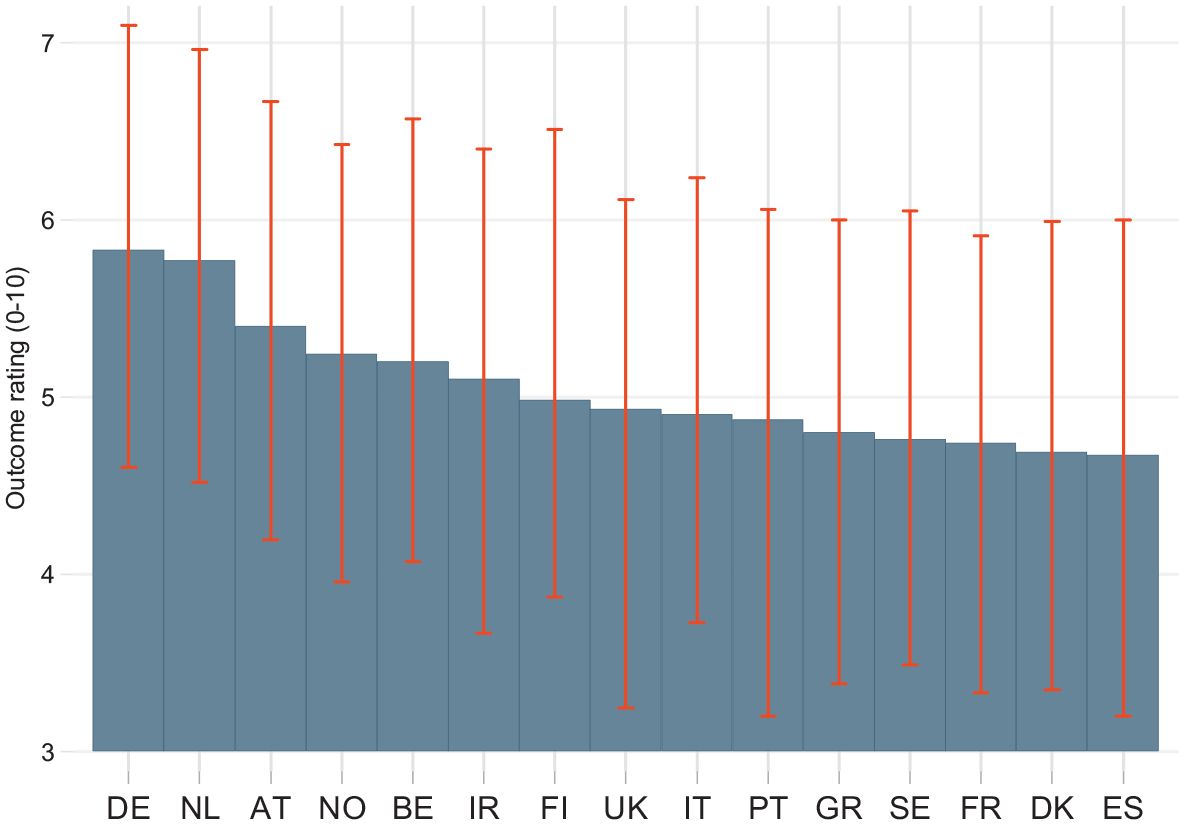
Average Ratings of Electoral Outcomes.
What Affects Citizens’ Evaluations?
To test our first six hypotheses about which features the electoral outcomes make them good or bad in citizens’ eyes, we estimate a series of OLS regressions predicting the 0-to-10 evaluation of each outcome. The independent variables are the ENPP (the effective number of parties in parliament), the Gallagher index (the degree of disproportionality), the number of parties in government, whether the government is a majority (vs minority) government, and the combined vote share of all parties in government. Supplemental Appendix D reports the distribution of these five variables across all 15 electoral outcomes. We cluster standard errors by electoral outcome (15 clusters) to correct for the inter-dependence of observations at the level at which independent variables are located. We do not include any individual-level control variables. Given that the goal is to explain which electoral outcomes are judged to be good or bad among West Europeans and that the samples are representative of the population, such controls would only bias the estimates of interest.
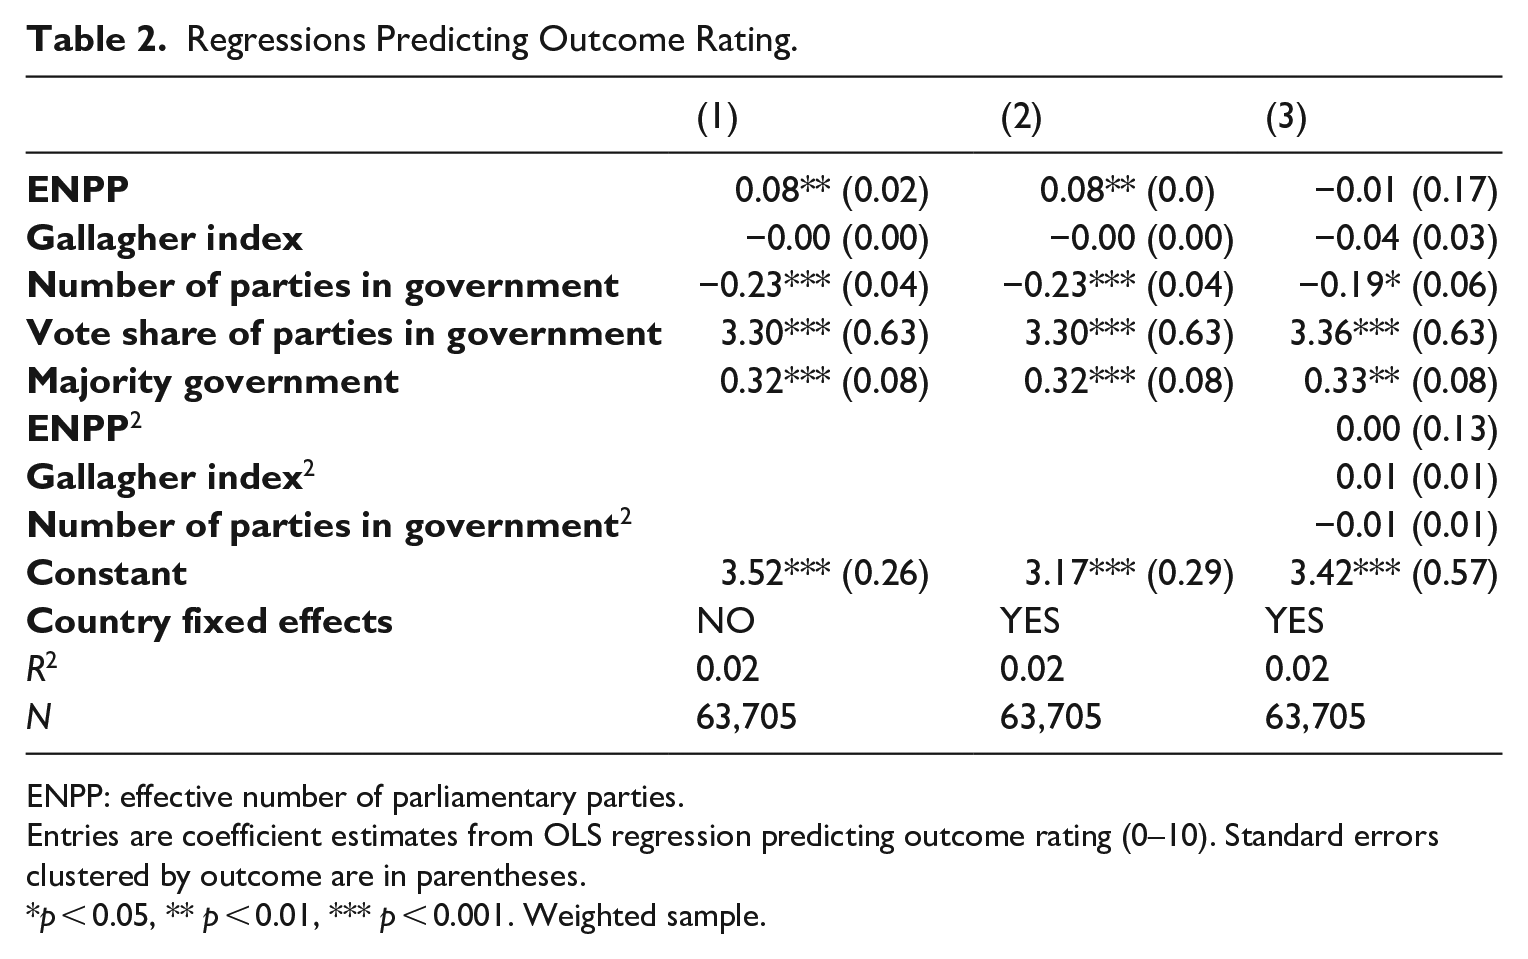
The first column of Table 2 reports this regression. In the second column, we add country fixed effects. The rationale is to capture the potential differences in the way the questions were translated into national languages or the way the questions were understood in the national context. Finally, in the fourth column, we add a second-order polynomial to the first three independent variables (ENPP, Gallagher index, and number of parties in government) capturing the majoritarian-proportional aspect of the outcome. The goal is to test the existence of curvilinear relationships and thus explore the existence of a sweet spot (Carey and Hix, 2011). To facilitate interpretation of the results, especially the magnitude of the effects, we plot the predicted values as the independent variables vary (based on the second column of Table 2). These are in Figure 3. Each time, we report the predicted value going from the empirical minimum to the empirical maximum. We only consider those variables that are statistically significant at a level of at least p < 0.01. 12
Regressions Predicting Outcome Rating.
ENPP: effective number of parliamentary parties.
Entries are coefficient estimates from OLS regression predicting outcome rating (0–10). Standard errors clustered by outcome are in parentheses.
p < 0.05, ** p < 0.01, *** p < 0.001. Weighted sample.
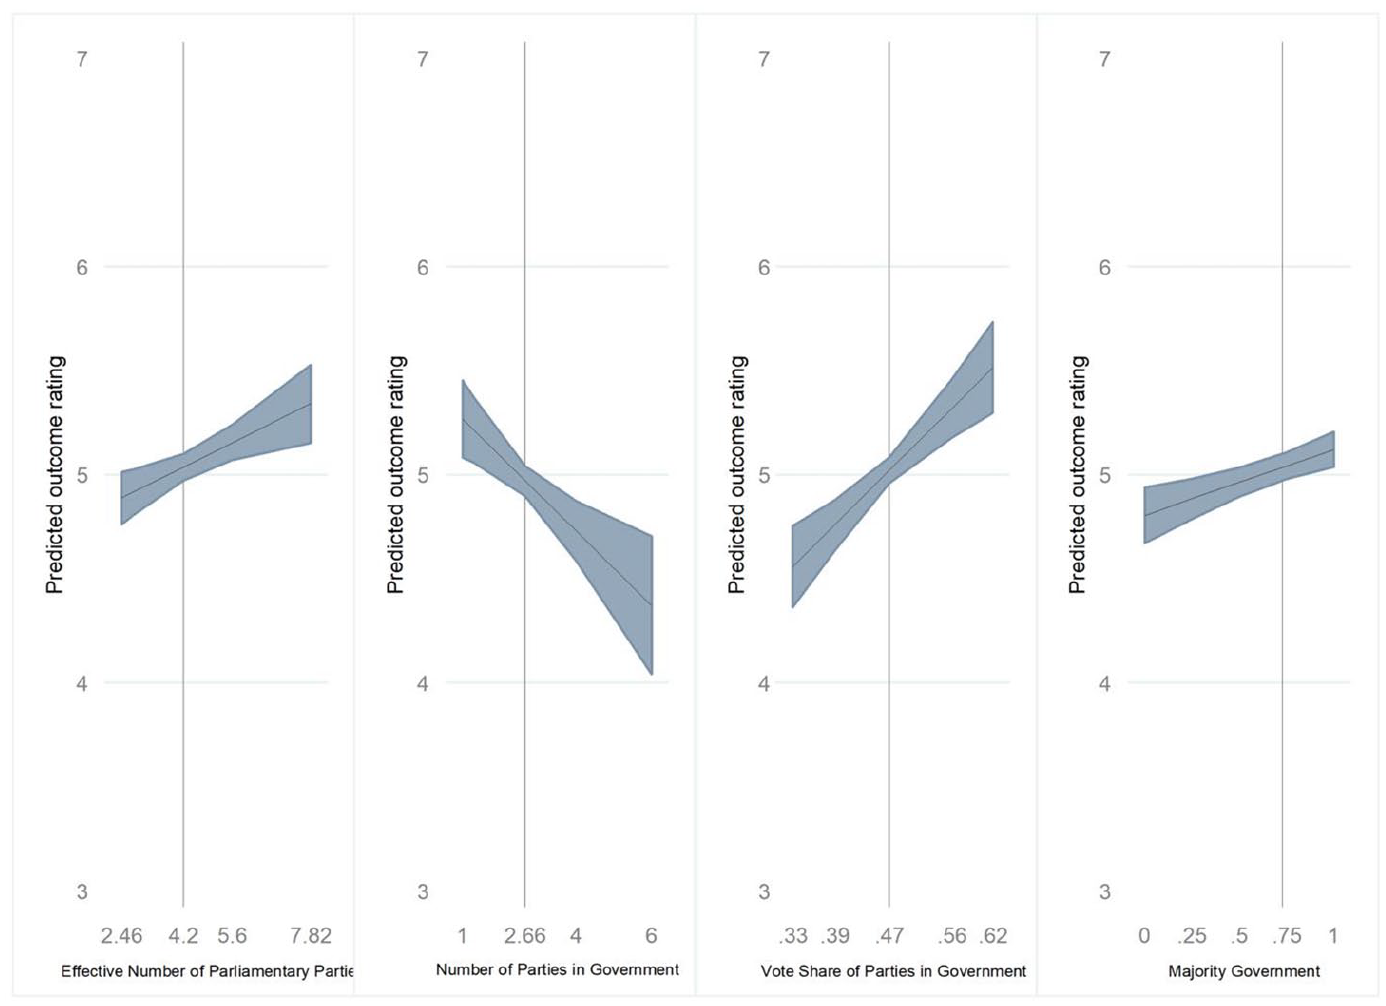
Predicted Ratings and Characteristics of Outcomes.
Columns 1 and 2 in Table 2 show that H1 and H3 are confirmed. ENPP has a positive effect on average ratings and the number of parties in government has a negative impact. Both are statistically significant (p < 0.01). When ENPP increases by one unit, the average rating increases by 0.08. In other words, respondents rate systematically higher the electoral outcomes in which they see that multiple parties obtain seats in parliament. The opposite is true for the number of parties in government. An extra party in government decreases the average rating by 0.23.
Figure 3 gives a more precise understanding of the magnitude of these effects. It reveals that going from the empirical minimum (2.46, vignette corresponding to the United Kingdom in 2005) to the empirical maximum in ENPP (7.82, Belgium in 2014) corresponds to an increase of 0.43 in average ratings. Figure 3 also shows that going from the empirical minimum (e.g. one, United Kingdom in 2005) to the empirical maximum in the number of parties in government (six, Finland in 2011) is associated with a decrease of 1.15 in evaluations. This is clear evidence that people think that there should be multiple parties in parliament but few in government. Yet, it is also clear that the effect of the number of parties in government is of greater magnitude than that of the number of parties in parliament.
Table 2 shows that the coefficient estimate associated with the Gallagher index is almost nil and not statistically significant. H2 is thus not confirmed. It seems that West Europeans do not care much about the level of disproportionality between votes and seats. Column 3 in Table 2 reveals the absence of any curvilinear effect. The polynomial terms are almost nil and not statistically significant. This suggests that citizens do not perceive the existence of sweet spot outcomes that are in the middle of the majoritarian and proportional visions of democracy. 13 H4 is thus not confirmed either.
From Table 2, we also find evidence for H5 and H6. Respondents give higher ratings to electoral outcomes in which the government holds a majority of seats in parliament (+ 0.32, p < 0.001). We also see that the coefficient associated with the combined vote share of the parties forming the government is strongly positive (statistically significant at p < 0.001). Figure 3 shows that an increase of 10 percentage point in vote share increases average ratings by 0.33. When vote share goes from the empirical minimum (0.33, Spain in 2016) to the empirical maximum (0.63, Finland in 2011), the rating increases by 0.99.
We conducted a series of supplementary tests to evaluate the robustness of these findings. The results are in Supplemental Appendix E. First, we re-estimate the regression of Column 2 in Table 2 with the unweighted sample. Second, we replace ENPP by a simple count of the number of parties in parliament. Third, we remove the vignettes that contain small rounding errors (see footnote 10). Fourth, we replace the variable “Number of parties in government” by a dummy variable “Single-party vs coalition government.” Fifth, we remove the respondents who gave the same rating to all five vignettes. Sixth, we test the effect of other independent variables (combined vote share of parties in parliament, whether the largest party is in the government, and whether the governing parties have a manufactured majority in the sense that they do not have a majority of votes). These tests show that the effects of the number of parties in government, the majority status of the government, and the vote share of these parties are robust. The coefficients associated with these variables are stable across specifications. 14 By contrast, the effect of the number of parties in parliament is less stable. It is close to 0 and not statistically significant in some specifications. Other independent variables do not appear to be related to respondents’ ratings.
What is striking from this series of analyses is that West Europeans care more about the composition and legitimacy of the government than of the parliament. The variables “Number of parties in government,” “Majority government,” and “Vote share of parties in government” are the main drivers of respondents’ evaluations of the electoral outcomes. These three variables are obviously linked: the more parties there are in government the larger their combined vote shares and the more likely there is a majority government. To better visualize the substituting effect and tradeoff between the three variables, we use the results of the regression in Column 2 of Table 2 to simulate what would be the rating of outcomes with various levels in these variables (see Figure 4). According to this simulation, an outcome with one party in a majority government that is supported by 33% of the votes (i.e. that corresponds to the vignette of the United Kingdom in 2005) has a predicted rating of 4.9. For an electoral outcome in which a single party forms a minority government to reach this rating, the vote share must reach around 45%, whereas it must reach around 50% for majority governments composed of a coalition of four parties.
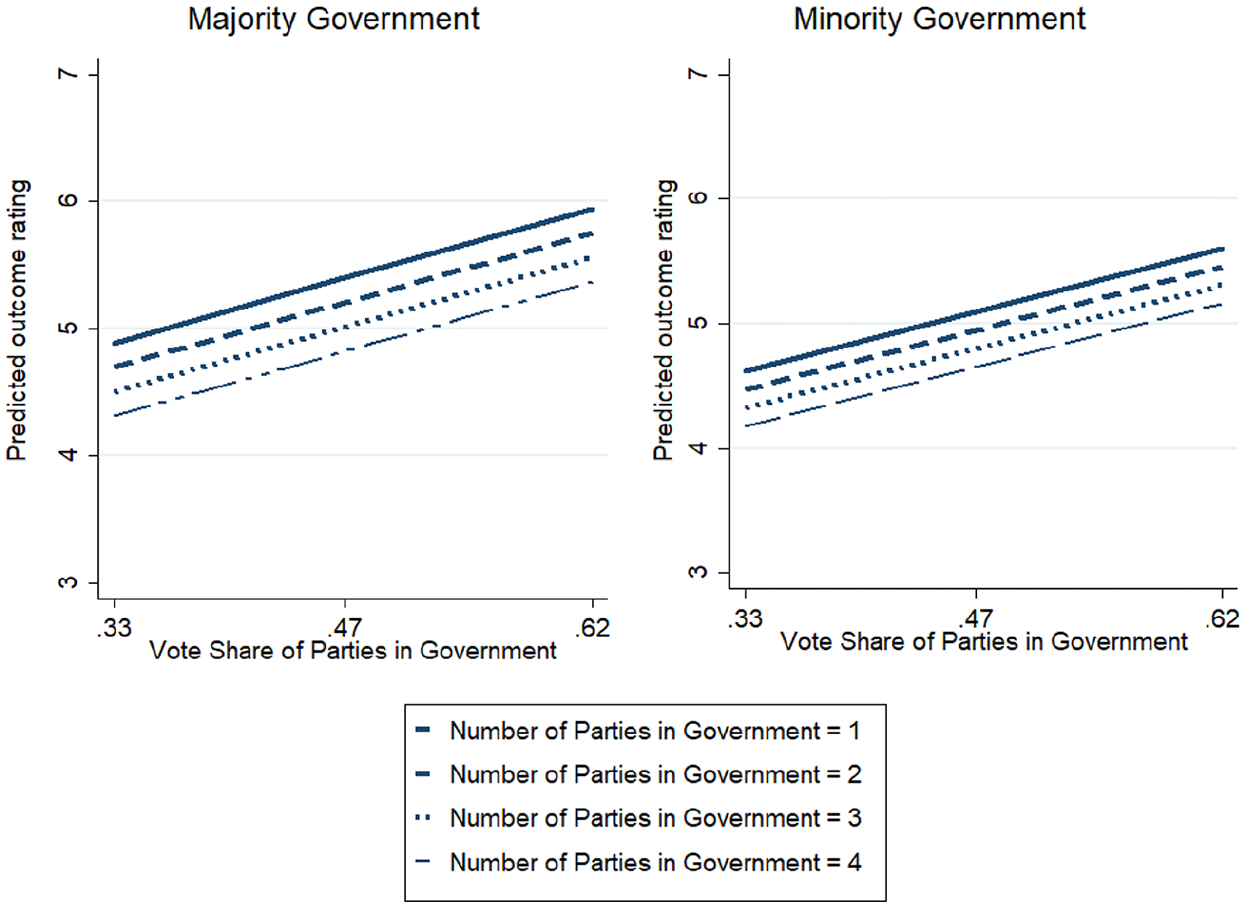
Simulation of Predicted Outcome Rating as Government Variables Vary.
Do Evaluations Vary across Countries?
Not everybody necessarily cares about the same aspects of electoral outcomes. This is the intuition behind the last hypothesis. We test whether respondents from different countries have different ratings and especially whether they rate higher the electoral outcomes that are similar to the outcomes they are used to see in their own country. Before testing this hypothesis, we explore the role of other potential sources of differences between respondents. We test whether three variables moderate the main effects reported in Table 2. We reproduce the regression in Column 2 in adding an interaction between each of the five independent variable and a series of potential moderating variable: (1) education level (from 0 no secondary degree to 1 post-graduate degree), (2) left-right self-placed ideology (from 0 extreme left to 1 extreme right), and (3) size of the party that the respondent supports (= vote share of party for which the respondent voted at last national election). Given that these moderating variables are at the level of the respondent, we also add some control variables (age, gender, education, income, and urbanization) and standard errors clustered at both the outcome and respondent level. Supplemental Appendix F shows that none of the interaction terms are large enough to reach conventional levels of statistically significance. This means that citizens are influenced by the same aspects of the electoral outcome, regardless of their education level, left-right ideology, and size of supported party. This last finding is important because it confirms that the survey elicited principled rather than partisan preferences. In this sense, it constitutes a placebo test. Supporters of large parties do not rate electoral outcomes in which larger parties are advantaged (for example because of high degree of disproportionality).
We then perform a series of tests to examine H7. First, we report the correlations in mean ratings between pairs of countries. In doing so, we evaluate whether the outcomes that are highly rated in one country are also highly rated in another country. Supplemental Appendix G shows the correlations between the 105 country pairs. We can see that all but three are positive. Furthermore, for around two thirds of them, r > 0.6, and for around a fourth, r > 0.8. This suggests that, regardless of their country, respondents evaluate the electoral outcomes the same way. Yet, it is also true that some correlations are weaker, especially those in which the United Kingdom is involved. UK respondents do evaluate electoral outcomes somewhat (but not strikingly) differently.
Second, we re-estimate the regression of Column 1 in Table 2 separately in each of the 15 countries of the sample. Table 3 presents the results. We can see that the patterns are remarkably consistent across countries. In each of the 15 countries, there is a positive and statistically significant effect of the vote share of the governing parties (p < 0.05), and mostly positive and statistically significant effect of the majority status of the government (p < 0.05 in 10 out of 15 countries). We can thus conclude that when it comes to these two aspects, citizens’ views about what constitutes a good electoral outcome for democracy do not vary substantially across countries. The two other aspects that influence citizens’ ratings, ENPP and number of parties in government, are less stable. The effect mostly goes in the same direction (positive for ENPP, and negative for parties in government), but is only statistically significant at a level of p < 0.1 sometimes. Importantly, we do not find that citizens from some countries are affected by ENPP and those from other countries by the number of parties in government.
Regressions Predicting Outcome Rating, by Country.
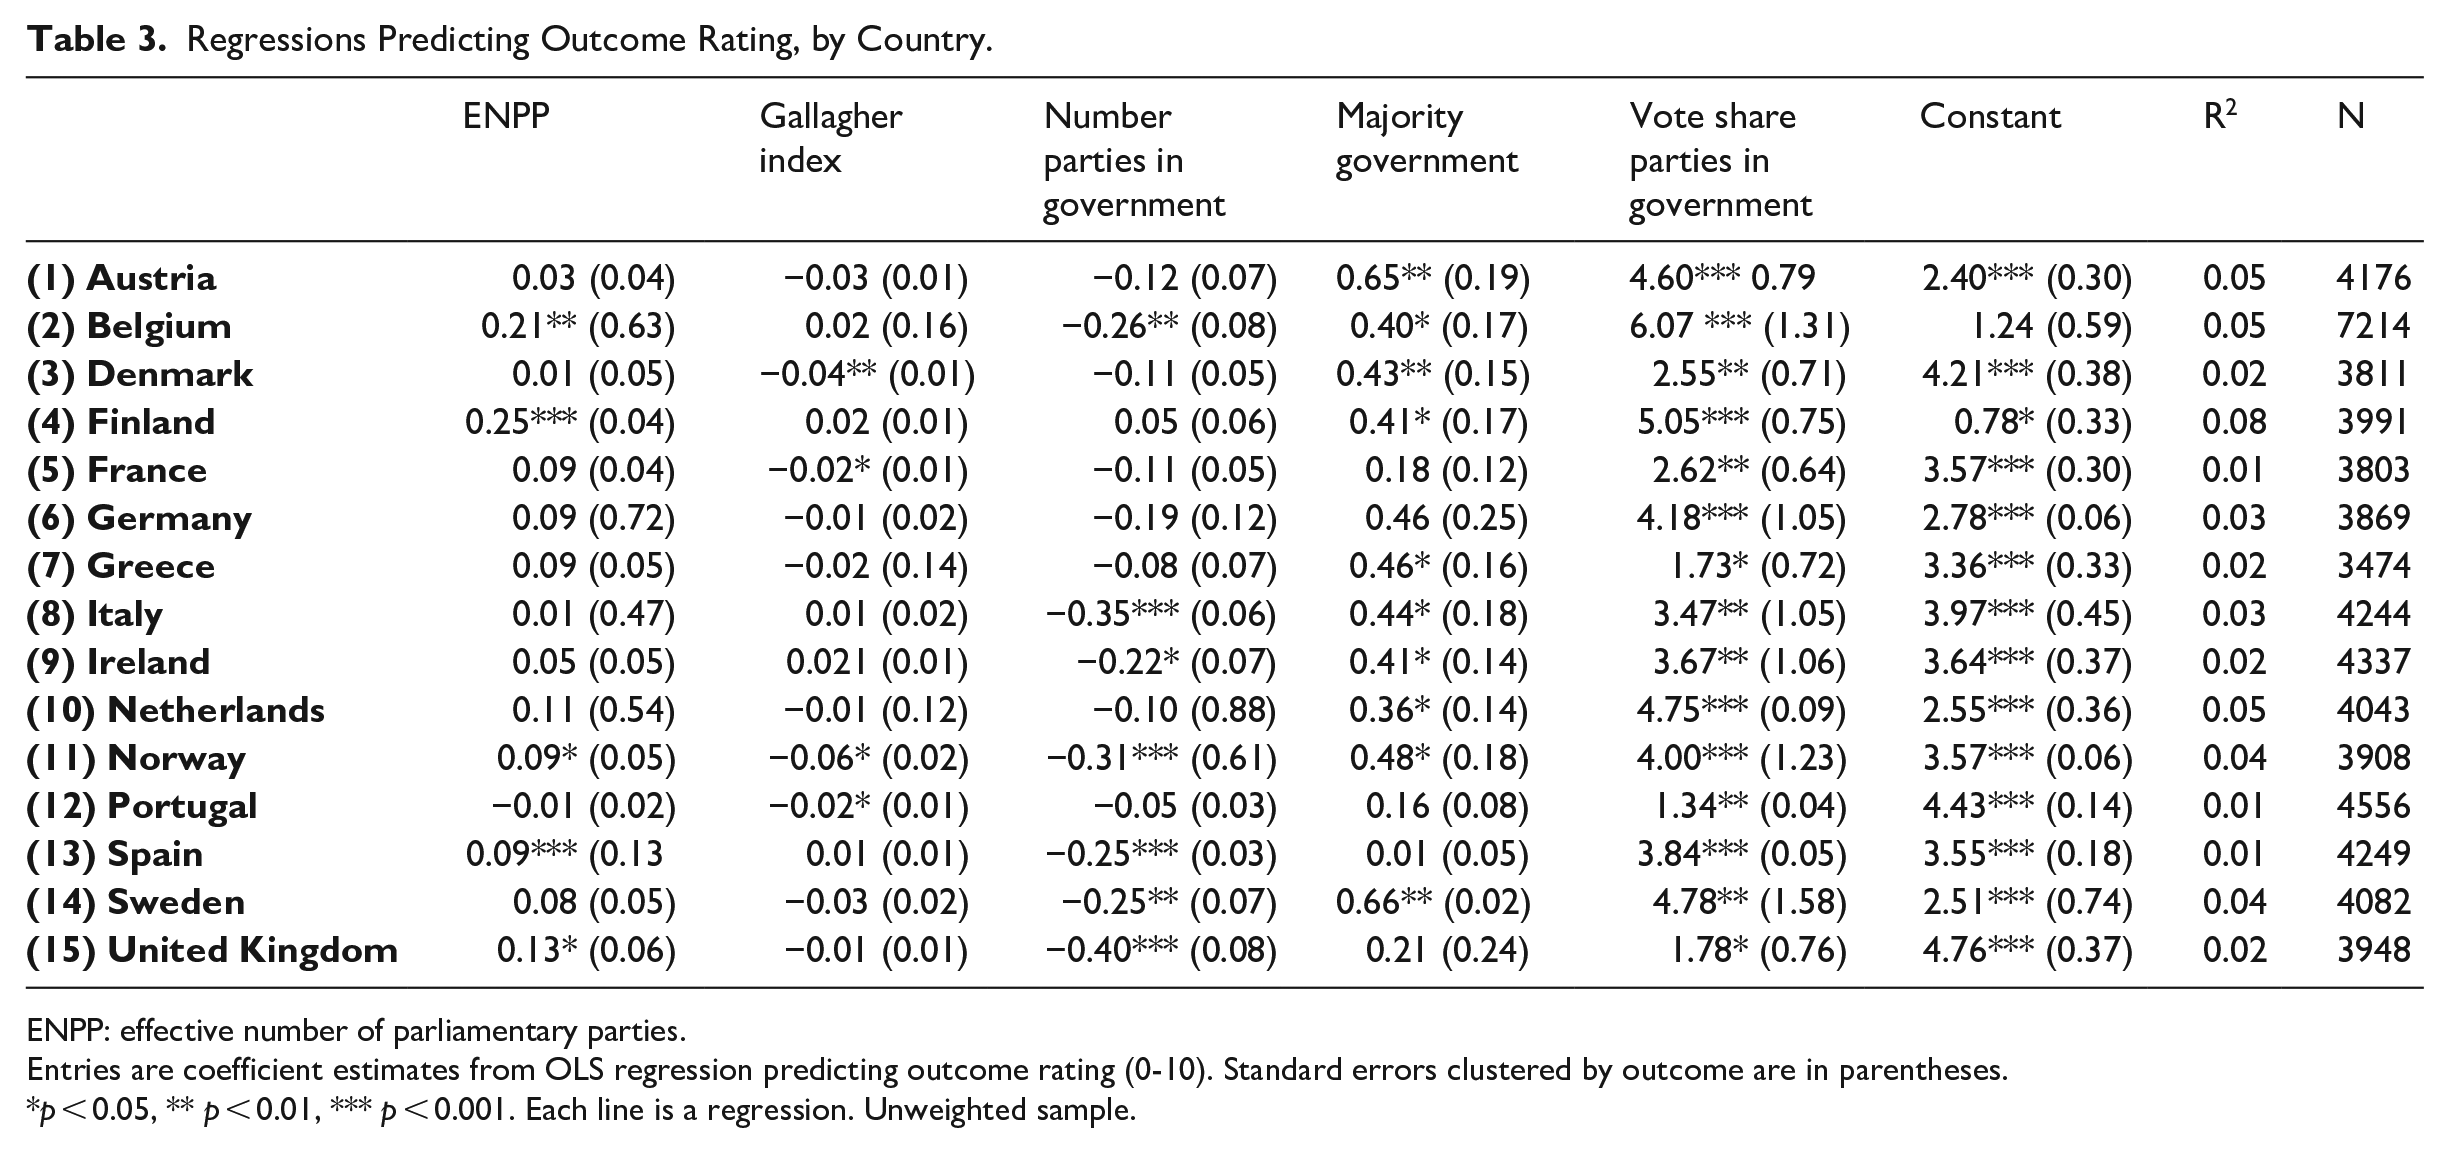
ENPP: effective number of parliamentary parties.
Entries are coefficient estimates from OLS regression predicting outcome rating (0-10). Standard errors clustered by outcome are in parentheses.
p < 0.05, ** p < 0.01, *** p < 0.001. Each line is a regression. Unweighted sample.
Third, we examine whether citizens’ evaluations depend on what electoral outcomes they are used to in their country. To do so, we construct five new variables that correspond to the average of the independent variables used in Table 2 in the respondent’s country. We calculate the average number of parties (ENPP) over the last five elections, the average disproportionality (Gallagher index), the average number of parties in government, the proportion of majority governments, and the average vote share of parties in government. We then reproduce the regression of Column 2 in Table 2 in adding an interaction between these averages and the five original independent variables (one after the other). Given that the moderating variables are at the level of the country, we cannot use country fixed effect. Instead, we use standard errors clustered at both the outcome and country level.
We observe in Table 4 that the interaction terms are very small and fail to reach conventional levels of statistically significance. This confirms the finding above: although there are some differences between countries, these differences are not systematic. Most importantly, people do not systematically believe that the electoral outcomes to which they are used in their country are good for democracy.
The Moderating Effect of the Respondents’ Country.
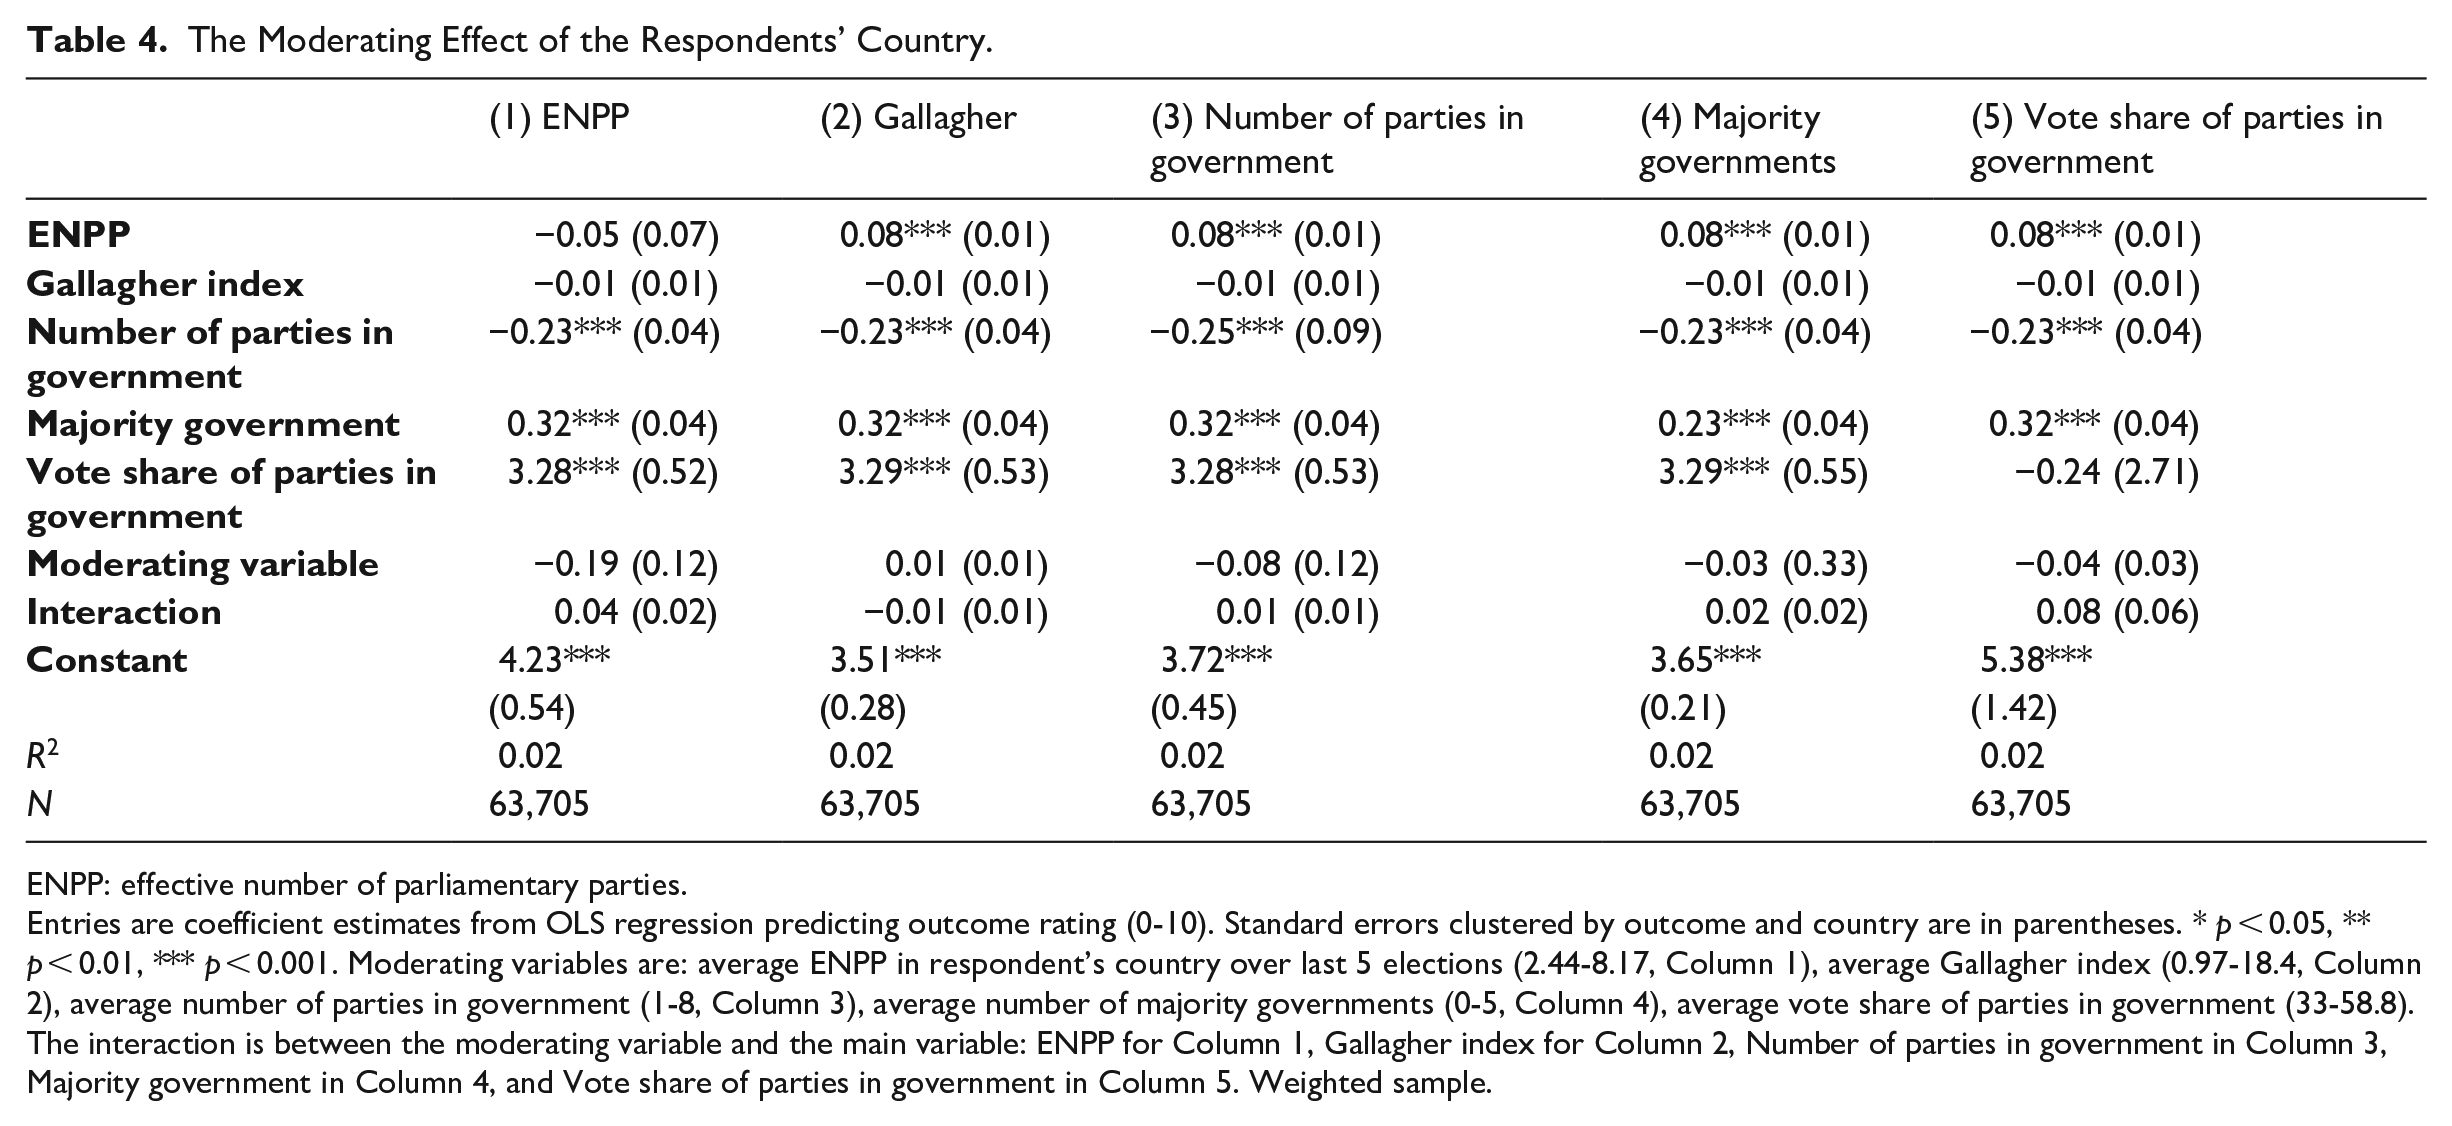
ENPP: effective number of parliamentary parties.
Entries are coefficient estimates from OLS regression predicting outcome rating (0-10). Standard errors clustered by outcome and country are in parentheses. * p < 0.05, ** p < 0.01, *** p < 0.001. Moderating variables are: average ENPP in respondent’s country over last 5 elections (2.44-8.17, Column 1), average Gallagher index (0.97-18.4, Column 2), average number of parties in government (1-8, Column 3), average number of majority governments (0-5, Column 4), average vote share of parties in government (33-58.8). The interaction is between the moderating variable and the main variable: ENPP for Column 1, Gallagher index for Column 2, Number of parties in government in Column 3, Majority government in Column 4, and Vote share of parties in government in Column 5. Weighted sample.
Finally, we conduct two extra tests to assess the robustness of this last result. In Supplemental Appendix H we replicate Table 4 in estimating multi-level regression with random intercept (first level: country, second level: electoral outcome). Second, we reduce the sample to respondents who declared being satisfied with the way democracy works in their country (6 or more on a scale from 0 to 10 where 0 means not satisfied at all to 10 very satisfied). Indeed, they should be those most likely to associate the electoral outcomes of their country as good for democracy. Yet, in both instances, we find remarkably similar results, which reinforce our confidence in the finding that citizens’ views are not driven by what they are used to in their country.
Conclusion
Our study address a simple yet fundamental question in comparative politics: What electoral outcome do people consider good for democracy? We contribute to two debates over political institutions that has been agitating the field for years: the one about the role of the executive and legislative branches of the state in the collective decision-making process, and the one about the merits and limits of majoritarian and proportional electoral systems (Poguntke and Webb, 2005; Powell, 2000). To give new insights to this topic, we tapped ordinary citizens’ views with a novel survey instrument. We asked 15,414 respondents from representative samples in 15 Western Europeans countries to rate electoral outcomes (vote shares of the main parties, their seat shares, and whether they form the government or not) on a scale from 0 “very bad for democracy” to 10 “very good for democracy.” This question allowed them to pass a judgment on concrete electoral outcomes compared to technical electoral institutions. To maximize realism, we picked real recent outcomes from the 15 countries covered in the study. Yet, we did not tell respondents from which country they were nor provide the names of the various parties. In using such a blind design, we sought to remove partisan considerations and elicit citizens’ principled preferences.
We find that West Europeans think that a good outcome for democracy is one with few governing parties that enjoy a majority of parliamentary seats and a large vote share. In many ways they are not convinced by either the proportional or the majoritarian vision. They reject the basic argument of the proportional school according to which parties’ seat share in parliament should correspond to their overall vote share; the more disproportional outcomes were not more negatively rated by our respondents. Nevertheless, respondents also reject the standard majoritarian belief according to which all that matters is to let the party with most votes govern; they want the governing party(-ies) to have strong support. Therefore, the three outcomes that are deemed to be the most democratic are those that involve a two-party coalition and the combined vote for the two governing parties is over 50%. People are concerned with both accountability and representation; they believe that a good outcome is a majority government that receives wide support from voters.
These results show that the characteristics that drive citizens’ evaluations are associated with aspects of the government that is formed after the election, and not aspects of the parliament. Political scientists often focus on the importance of having a fair representation of all social groups in the legislature (Lijphart, 2012). What we find is that citizens care first and foremost about the composition of the government. They understand that the executive branch of the state has become the central institution in modern democracies (Poguntke and Webb, 2005; Powell, 2000; Samuels and Shugart, 2012), and they consequently judge electoral outcomes based on the government that is formed thereafter.
We also find that citizens’ judgments vary little by country. Citizens from Spain and France react similarly to various electoral outcomes to those from Sweden and Austria. We do not find much evidence that the outcomes that they evaluate positively are those they are used to, or in other words, we do not find much evidence of a “home-field” advantage.
Results indicate that a way to please a maximum of citizens is to have majority government with strong electoral support but not too many parties. It should be stressed that such an outcome is unlikely to be achieved in a majoritarian system in which the typical outcome is a single-party government where the governing party has about 35%–40% of the vote. How exactly such an outcome can be achieved is not obvious and depends on the economic and social characteristics of the country. Yet, this outcome is more likely to be achieved in a proportional or mixed system, and in a system that makes it hard for very small parties to gain representation in parliament, for instance with a substantial vote threshold. 15 This is among others the case for Germany, which happens to obtain, and although the vignettes are blind, the highest rating in our study.
Supplemental Material
sj-docx-1-psx-10.1177_00323217211055560 – Supplemental material for What Kind of Electoral Outcome do People Think is Good for Democracy?
Supplemental material, sj-docx-1-psx-10.1177_00323217211055560 for What Kind of Electoral Outcome do People Think is Good for Democracy? by André Blais, Damien Bol, Shaun Bowler, David M Farrell, Annika Fredén, Martial Foucault, Emmanuel Heisbourg, Romain Lachat, Ignacio Lago, Peter John Loewen, Miroslav Nemčok, Jean-Benoit Pilet and Carolina Plescia in Political Studies
Footnotes
Acknowledgements
We would like to thank Anthony Senior, the Business Manager of the Department of Political Economy for coordinating the budget of this study.
Declaration of Conflicting Interests
The author(s) declared no potential conflicts of interest with respect to the research, authorship, and/or publication of this article.
Funding
The author(s) disclosed receipt of the following financial support for the research, authorship, and/or publication of this article: The project was led by André Blais and Damien Bol, helped by Emmanuel Heisbourg for data analysis. All authors provided key inputs in the various phases of the project. The funding was provided by all authors equally. Annika Fredén acknowledges support from Vetenskapsrådet (Swedish Research Council, Grant Number 2017-02941). Ignacio Lago acknowledges support from ICREA under the ICREA Academia program. Peter John Loewen acknowledges support from the Schwartz Reisman Institute at the Univeristy of Toronto. Miroslav Nemčok acknowledges support from the Strategic Research Council at the Academy of Finland (Grant Number 312710). Carolina Plescia acknowledges support from Austrian Science Fund (FWF, Grant Number T997-G27).
Supplementary Information
Additional Supplementary Information may be found with the online version of this article.
Context
Online Appendix Appendix A. The data for the 15 Vignettes Appendix B. Percentages of “don’t know” and “refusal” by vignette Appendix C. Balance test of “skippers” Appendix D. Descriptive statistics of independent variables Appendix E. Robustness tests Appendix F. Moderating effect of socio-demographic and attitudinal variables Appendix G. Correlations in mean ratings between country pairs. Appendix H. Multi-level regression. Appendix I. Moderating effect of respondents’ country (satisfied respondents only)
Notes
Author Biographies
References
Supplementary Material
Please find the following supplemental material available below.
For Open Access articles published under a Creative Commons License, all supplemental material carries the same license as the article it is associated with.
For non-Open Access articles published, all supplemental material carries a non-exclusive license, and permission requests for re-use of supplemental material or any part of supplemental material shall be sent directly to the copyright owner as specified in the copyright notice associated with the article.