
Abstract
Campaigning at the district level can deliver electoral payoffs in a range of countries despite variations in electoral systems. However, effects may not be consistent. Campaigns do not occur in a vacuum, and contextual factors, exogenous to the campaign activity itself, may have a significant effect on the level of their electoral impact. The 2015 General Election in Britain is a particularly interesting case as there was a key contextual factor which could impact significantly on the effectiveness of the parties’ campaigns; the electoral unpopularity of the Liberal Democrats. Using a unique new dataset, this article assesses the contextual impact of party equilibrium at both national and district levels on campaign effectiveness. It represents the first attempt on a large scale to systematically assess the impact of party popularity on campaign effectiveness and demonstrates at both national and district levels the importance of contextual effects on election campaigns.
Introduction
A significant academic literature has demonstrated that if effectively deployed, more intense campaigning at the district or constituency level can deliver electoral payoffs. Both single country and comparative studies tend to show similar patterns despite variations in electoral systems (see, for example, Denver and Hands, 1997; Fisher et al., 2011; Gschwend and Zittel, 2015; Karp et al., 2007; Sudulich et al., 2013). 1 However, the campaign effects may not necessarily be consistent in respect of electoral payoffs. Campaigns do not occur in a vacuum, and contextual factors, exogenous to the campaign activity itself, may have a significant effect on the level of their electoral impact (Fisher et al., 2011). The 2015 General Election in Britain is a particularly interesting case, as compared with previous elections, there was a key contextual factor which could impact significantly on the effectiveness of the parties’ campaigns; the electoral popularity of the Liberal Democrats, which had plummeted since 2010. By way of contrast, the relative popularity of the Conservatives and Labour between the two elections of 2010 and 2015 remained largely unchanged. This provides the environment whereby we can compare the effects of both similar and changed levels of party popularity on campaign effectiveness. We do this by assessing the contextual impact of the popularity equilibrium (Fisher et al., 2011) at both national and district levels. In essence, we posit that the Liberal Democrats’ dramatic decline in popularity was highly likely to limit the party’s campaign effectiveness. We, therefore, seek to answer three questions:
Did the electoral effectiveness of parties’ campaigns reflect national levels of party popularity?
Did the electoral effectiveness of parties’ campaigns vary by party opponent?
Did the electoral effectiveness of parties’ campaigns vary depending on levels of popularity at the constituency level?
This represents the first attempt on a large scale – either in the British context or elsewhere – to systematically assess the impact of party popularity on campaign effectiveness. This makes the article significant for three principal reasons. First, it demonstrates both conceptually and empirically how campaign effectiveness varies according to (a) national popularity, (b) party competition and (c) local popularity. Second, it shows how levels of electoral popularity – both low and high – impact upon the electoral effectiveness of campaigns. Third, it demonstrates how parties seek to mitigate the effects of electoral context and with what degree of success. In sum, the article shows both whether campaigns are electorally effective and why this is the case.
The Popularity Equilibrium
The popularity equilibrium captures the idea that both absolute and relative levels of party popularity will affect the electoral impact of party campaigns. In general, campaigning will tend to be more electorally effective when elections are more marginal. But these effects are moderated by party popularity. Campaigns will tend to deliver more electoral benefits where parties are not unusually popular or unpopular: there is popularity equilibrium within the parties’ usual range of support. In other words, parties should be neither extremely popular nor extremely unpopular – there is, in effect, a normal state of affairs in terms of the relative popularity of the parties (Fisher et al., 2011: 818). This idea is informed by the work of Arceneaux and Nickerson (2009), who argue that in terms of persuading people to vote, the principal effects of mobilisation will be on those people who on the cusp of deciding to cast their ballot. In their example (Arceneaux and Nickerson, 2009: 5), they suggest that if mobilisation on average increases the probability of voting by 0.07 (seven percentage points), the campaign effort will have little effect on voters whose probability of voting is more than 0.57 or less than 0.43.
The same logic may also apply in terms of vote choice. If parties are unusually unpopular, the impact of their campaigns is less likely to be decisive (since voters will be less receptive) and equally, for more popular parties, the campaign is less likely to impact on voters’ decisions since they will already have decided to vote for them. Supporting this idea, research using experimental methods has shown that campaign interventions are affected by the level of popularity of the party (Arceneaux and Nickerson, 2009; Hillygus, 2005; Niven, 2001). Even in situations of popularity equilibrium, all parties are not equally popular in all seats, so local campaign efficacy will tend to be greatest in seats where individual parties are in a competitive situation (Fieldhouse et al., 2014). Therefore, the relationship between popularity and campaign efficacy will also depend on the geographical distribution of support. However, because local popularity is highly dependent on national popularity (as indicated by the empirical power of uniform swing), the central point remains valid: unpopular parties are unlikely to be able to persuade electors who are opposed to them, and in such situations, the positive effects of more popular parties are likely to be more limited, since their supporters are more likely to already be ‘converted to the cause’. Levels of popularity can therefore be assessed both in terms of the national standing of the parties and also their standing in individual districts.
Assessing Party Popularity
The electoral popularity of parties between general elections can be assessed in three ways. First, the parties’ performance in second-order elections provides indicators of popularity even if voters’ motivations may vary at different levels of government. The Liberal Democrats experienced repeatedly poor results in elections at second-order elections levels after 2010. In 2010, Liberal Democrats represented around 19% of elected councillors in Britain; by 2015, that figure had fallen to 9%. And, the European Elections of 2014 saw the party secure just 6.9% of the vote and only one seat, compared with 13.8% and 11 seats in 2009. Second, parties’ standing can be assessed by regular national opinion polls. Of course, one feature of the 2015 election was the failure of the final opinion polls to predict the result – they under-estimated the extent of the Conservative lead prior to the 2015 election. But, they correctly predicted the level of support for the Liberal Democrats (and indeed the Scottish National Party (SNP)) (Cowley and Kavanagh, 2016). At the national level, there was popularity equilibrium for the Conservative and Labour parties – neither was especially unpopular (nor indeed, especially popular) – suggesting conditions for both parties to have effective campaigns. For the Liberal Democrats, however, the story of much of the 2010–2015 electoral cycle was one of significant unpopularity at national level. From soon after the 2010 election, Liberal Democrat poll ratings fell dramatically and never recovered, falling behind UKIP after early 2013 (Figure 1). Under these conditions – with the party performing poorly in opinion polls and second-order elections – we would expect the effectiveness of Liberal Democrat campaigning in general to be diminished. In effect, the Liberal Democrats’ sudden fall in popularity (to levels not seen since 1970) would make voters significantly less receptive to the party’s campaign efforts.
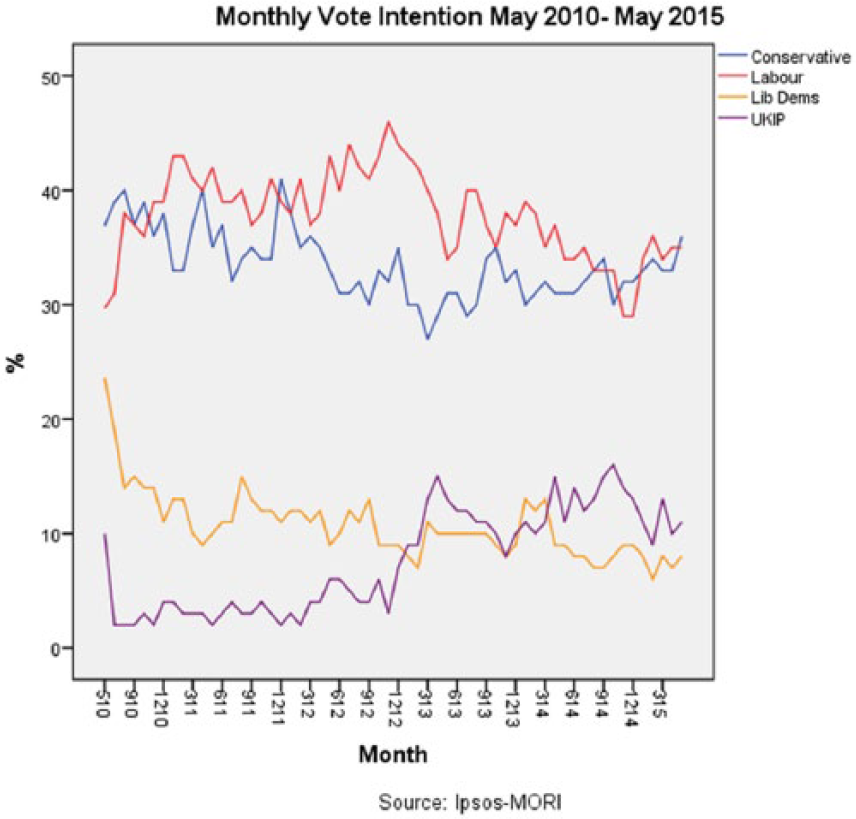
Monthly Vote Intention, May 2010–May2015.
A third key way by which parties’ electoral standing can be captured is through voters’ perceptions of which party is likely to be victorious in a district or constituency. This approach has the advantage of translating macro (national) levels of party popularity into micro (district) level assessments and is operationalised through large scale individual level surveys. Normally, such an exercise would be extremely difficult to operationalise. However, in this case, the British Election Survey panel (Fieldhouse et al., 2015) with over 30,000 cases allows for an estimate of the likelihood of winning the constituency (on a scale of 0–100) by taking a mean from the estimates of all respondents in the constituency. Given the size of the panel, this is based on around 50 respondents in each constituency and is subject to quite large margins of error. 2 We illustrate the distribution of mean constituency scores in Figures 2–4. As is evident, voter perceptions of Liberal Democrat victory were very different from those of the other two parties. In only around 5% of seats were the Liberal Democrats on average given a 51% or higher chance of victory. This equated to 31 seats – more than the party actually won, but substantially lower than the 57 seats won in 2010. By way of contrast, in some 56% of seats the Conservatives were given an average chance of victory of 51% or higher, while the same was true in 58% of seats for Labour.
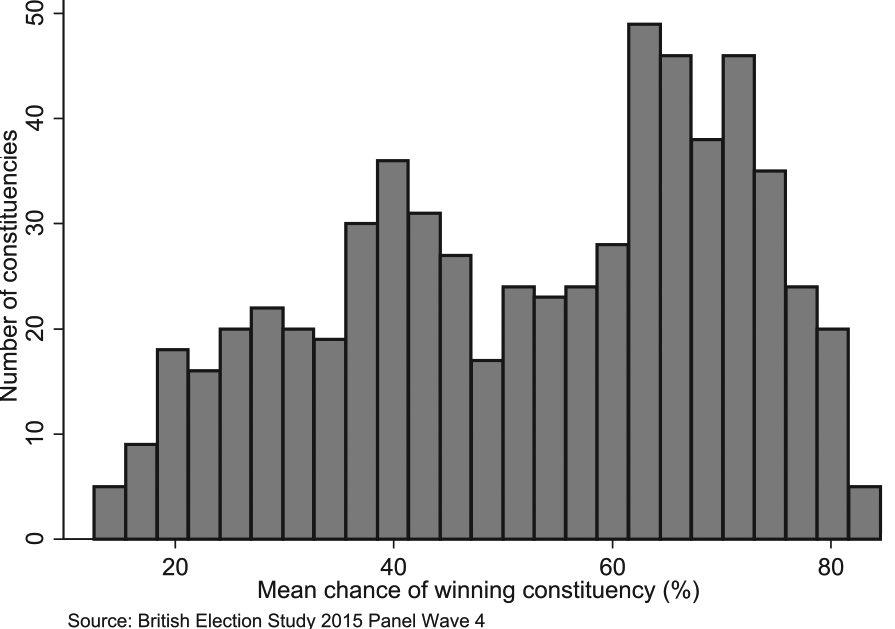
Conservative Chance of Winning Constituency.
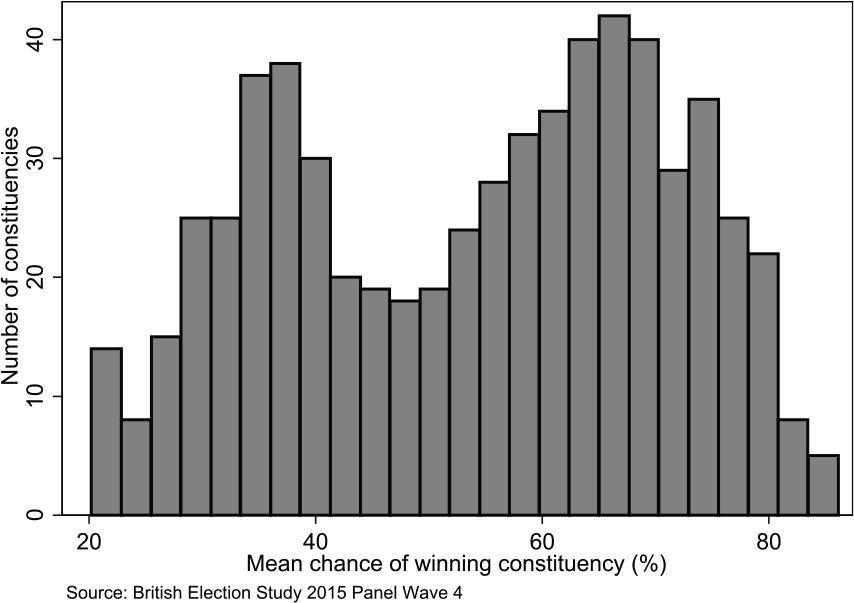
Labour Chance of Winning Constituency.
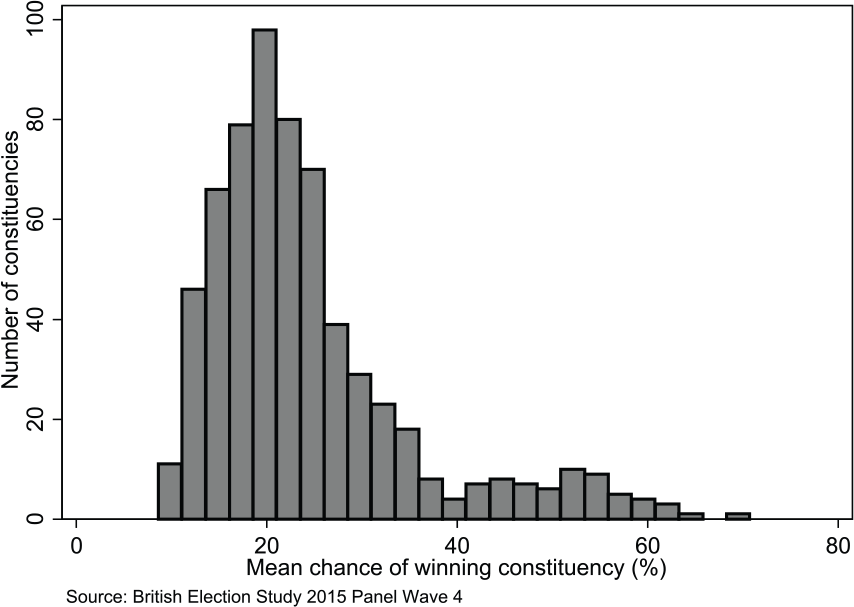
Liberal Democrats Chance of Winning Constituency.
Data and Measurement
The first step in evaluating the parties’ success in respect of their district-level campaigns is to create a measurable index of campaign intensity. To achieve this, data are derived from a survey of the election agents of Conservative, Labour and Liberal Democrat candidates who stood for 629 of the 632 constituencies in Great Britain – a total of 1887. 3 The data reported are based on 912 valid responses, comprising 244 Conservative, 336 Labour and 332 Liberal Democrat agents. The responses were representative of the total population of these agents, based on the electoral status of their seats (see Appendix 1). 4
Responses from the survey are used to created additive scales for the core components of a district campaign for all of the surveyed parties: preparation, organisation, manpower, use of computers, use of telephones, polling day activity, use of direct mail, level of doorstep canvassing, leafleting and electronic campaigning (Denver and Hands, 1997; Fisher et al., 2011). We enhance the scales used in previous studies by adding variables reflecting developments in preparation and e-campaigning. These scales are entered into a Principal Components Analysis (PCA) to create an index of campaign intensity. Using conventional cut-off criteria, the PCA suggests one factor is sufficient to represent the variance in the original variables in the index (see Appendix 1). The PCA produces factor scores which are then standardised around a mean of 100, which allows easy comparisons between parties. 5
Table 1 illustrates the mean level of campaign intensity for the three parties together with the maximum and minimum levels. The Conservatives and Labour ran stronger campaigns overall, while the Liberal Democrats ran, on average, less intensive campaigns. In order to corroborate these findings, we also examine individual level data from Wave 6 of the British Election Study (Fieldhouse et al., 2015). Table 2 summarises whether the parties contacted an individual elector over the last 4 weeks of the campaign and in how many ways (telephone, letter/leaflet, home visit, contact in the street, email, text message and other modes). Of course, some of these contacts could include central party campaigning efforts, but the rank order in terms of campaign intensity illustrated in Table 2 is replicated in terms of both the proportions contacted and the number of different contacts. Labour contacted 43% of electors, the Conservatives 38% and the Liberal Democrats 25%. The average number of different contacts similarly shows the same rank order. As a further test, we use data from the face-to-face post-election survey (Fieldhouse et al., 2016). These capture direct personal contacts (on the doorstep or in the street) and so are only local campaign efforts. Once again, the rank order between parties is replicated.
Overall Campaign Intensity Scores.
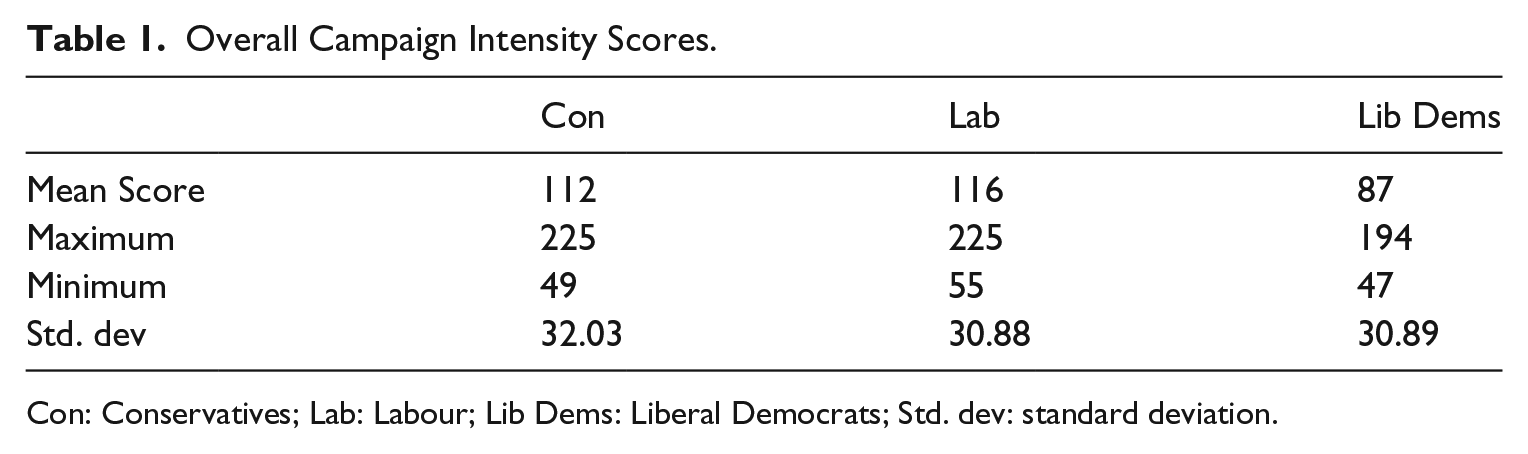
Con: Conservatives; Lab: Labour; Lib Dems: Liberal Democrats; Std. dev: standard deviation.
Individual Level Contacts over Last 4 Weeks of Campaign.
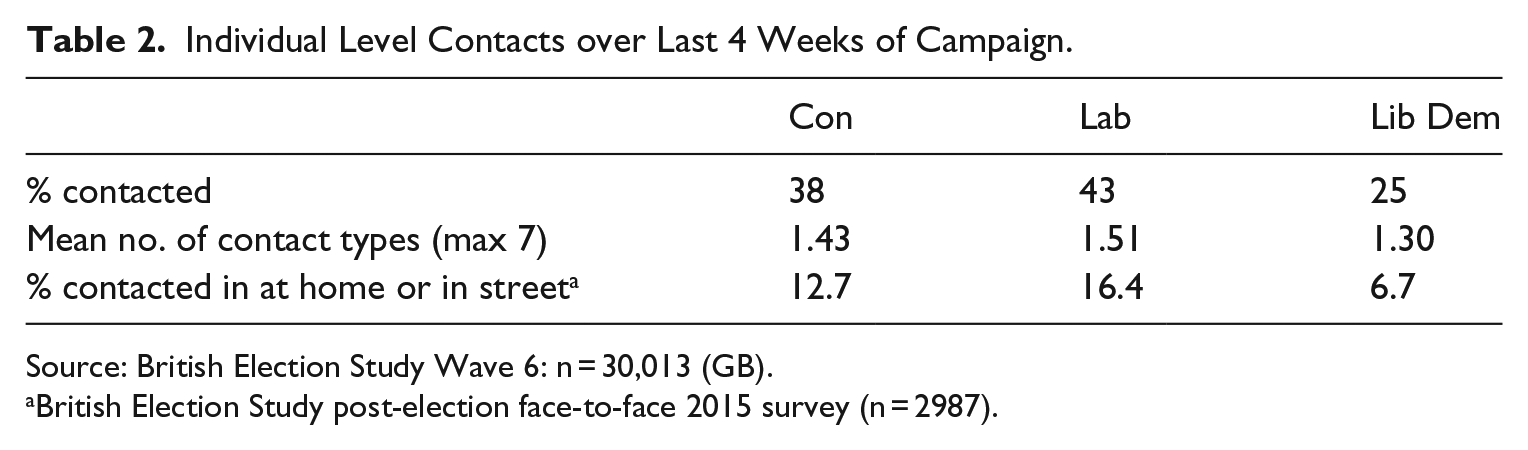
Source: British Election Study Wave 6: n = 30,013 (GB).
British Election Study post-election face-to-face 2015 survey (n = 2987).
These measures of campaign intensity, however, are unlikely to be equally distributed across all constituencies. We would expect a party to run its most intense campaigns in the most marginal seats it was seeking to gain or hold, and its next most intense campaigns in the seats that it held, but where there was much less chance of losing the seat – so-called ‘safe seats’ – as local organisation and resources in such seats tend to be greater, both in terms of membership and often wealth (Fisher, 2000; Fisher et al., 2006). All parties may seek to divert resources to the most key battleground seats, but resources such as human capital are often less mobile (Fisher and Denver, 2009). Finally, we would expect parties to run their least intense campaigns in those seats where it has little chance of winning, since as Karp et al. (2007: 92) suggest, ‘parties will expend greater effort on mobilising voters when the expected benefits of turning out voters are greatest, relative to cost’. Such a pattern is likely to be more pronounced in a majoritarian system where there are fewer gains to be made in terms of seats from campaigning in ‘hopeless’ seats, although there is evidence that such patterns can also be observed in multi-member systems (Viñuela et al., 2015).
The targeting of resources will reflect both the level of central management by national party headquarters, seeking to distribute effort in the constituencies effectively (the central input) and the ability of constituency-level parties to build on that targeted support (the local output). The success of targeting will also be a function of whether the central party has clear objectives in respect of the desired electoral outcomes. This captures the ambitions and strategy of a party and the extent to which they are achievable given the electoral context. Thus, the benefits of targeting may be conditional upon whether parties have clear objectives (such as winning a small majority or denying another party a majority rather than just trying to win as many seats as possible).
Table 3 illustrates the central input into targeting. It shows the level of central management of district campaigns by national parties, disaggregated by the electoral status of the seat for the particular party. There are four categories of seat: ultra marginal, where the winning margin after the 2010 General Election was less than 5%; marginal, where the winning margin was between 5% and 10%; held, where a party held the seats with a winning margin of more than 10% – so-called ‘safe seats’; and not held, where a party did not hold a seat and is more than 10% behind the winning party – so-called ‘hopeless’ seats. The index of centralisation is calculated using a PCA from responses to questions related to central management of campaigns (see Appendix 1), and factor scores are standardised around a mean of 100, allowing comparisons between parties and the electoral status of seats. The level of central management for both Conservatives and Labour was closely related to the marginality of the seat as we would expect. In the case of the Liberal Democrats, the pattern was slightly different, with the most central management activity taking place in the party’s safe seats. Under conditions of national popularity equilibrium, this would be a curious finding. But, of course, these conditions did not apply to the Liberal Democrats in 2015. As an unpopular party, a rational strategy would be a defensive one, effectively focusing resources on the those seats it had most chance of retaining – its ‘safe seats’ – and effectively ‘sacrificing’ those seats where the party was likely to lose by re-directing resource. In effect, this is what we observe.
Distribution of Party Centralisation by Electoral Status.
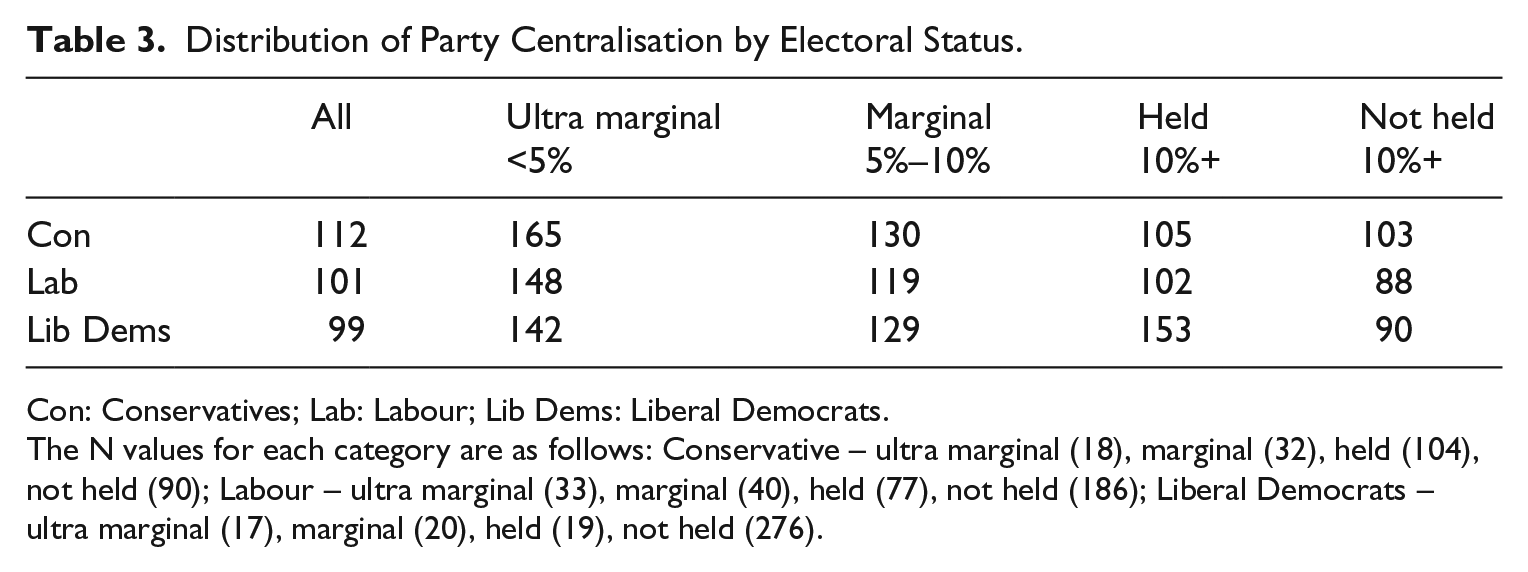
Con: Conservatives; Lab: Labour; Lib Dems: Liberal Democrats.
The N values for each category are as follows: Conservative – ultra marginal (18), marginal (32), held (104), not held (90); Labour – ultra marginal (33), marginal (40), held (77), not held (186); Liberal Democrats – ultra marginal (17), marginal (20), held (19), not held (276).
We assess the local output of targeting in Table 4, which disaggregates the mean campaign intensity of the three parties by the electoral status of the seat relative to that party. For the Conservatives and Labour, the distribution is exactly as predicted – the most intense campaigns took place in the most marginal seats, and campaigns in ‘safe’ seats were much more intense than in ‘hopeless’ ones. Not only that, Conservative and Labour campaigning were pretty evenly matched in ultra marginal and safe seats, while that of Labour was more intense in marginal seats (5%–10% winning margin). More noteworthy is the distribution of Liberal Democrat campaign effort. As predicted, campaigns in ultra marginal seats were more intense than in marginal seats and least intense than in hopeless seats. However, the Liberal Democrats’ strongest campaigns were, on average, in the party’s safe seats, reflecting the central input, and nearly matching the intensity of Conservative and Labour seats in their ultra marginal seats. The impact of the Liberal Democrats’ dramatic decline in popularity is therefore clear – the party effectively retreated into its safest seats.
Distribution of Campaign Intensity by Electoral Status.
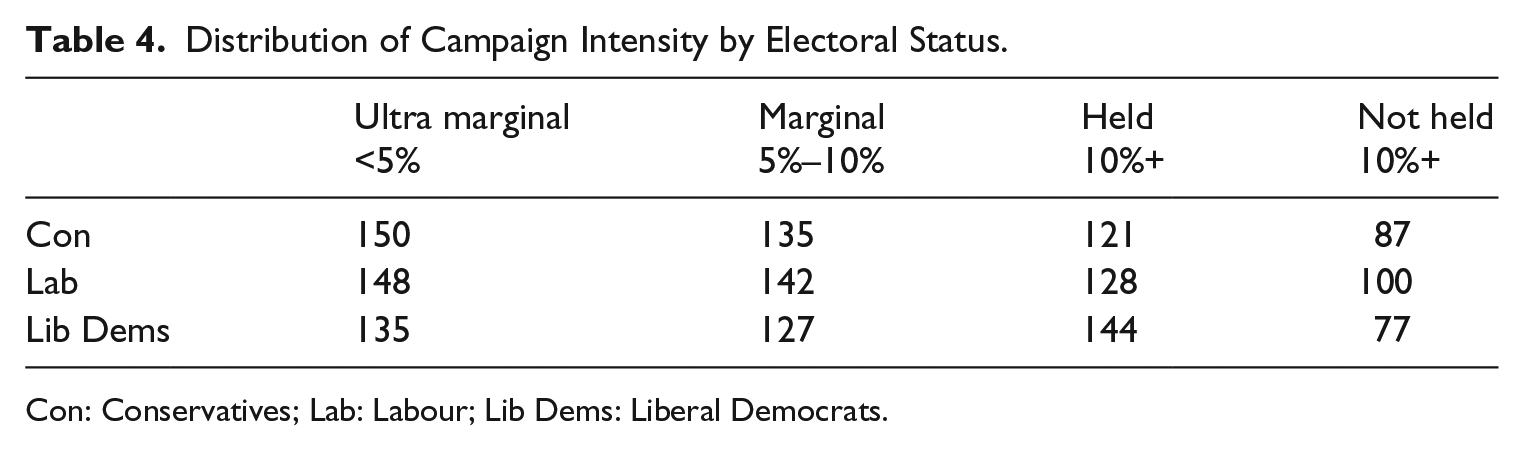
Con: Conservatives; Lab: Labour; Lib Dems: Liberal Democrats.
The Electoral Impact
Given the national levels of party popularity, we expect the following:
Hypothesis 1: Liberal Democrat campaigns were less electorally effective than Labour or Conservative campaigns.
This is estimated using ordinary least squares regression (OLS), with share of the electorate in 2015 as the dependent variable. Share of the electorate is a better indicator of campaign effects than share of the vote since it captures both vote share and capacity to mobilise the electorate to turn out. The model we employ in our first analyses is as follows. Each party’s share of the electorate in 2015 is regressed on the campaign intensity index, controlling for the share of the electorate in 2010, personal incumbency and country (Table 5). Personal incumbency is often a strong predictor of electoral success and can be enhanced through personalised campaigns – a trend observable across a number of different countries (De Winter and Baudewyns, 2015; Eder et al., 2015; Gschwend and Zittel, 2015; Zittel, 2015). We also add country as a control since a particular characteristic of the 2015 election was the performance of the SNP in Scotland, where the party won 56 of the 59 seats and 50% of the Scottish vote, having won only six seats and 20% of the vote in 2010.
The Electoral Impact of Constituency Campaigning by the Principal GB Parties.
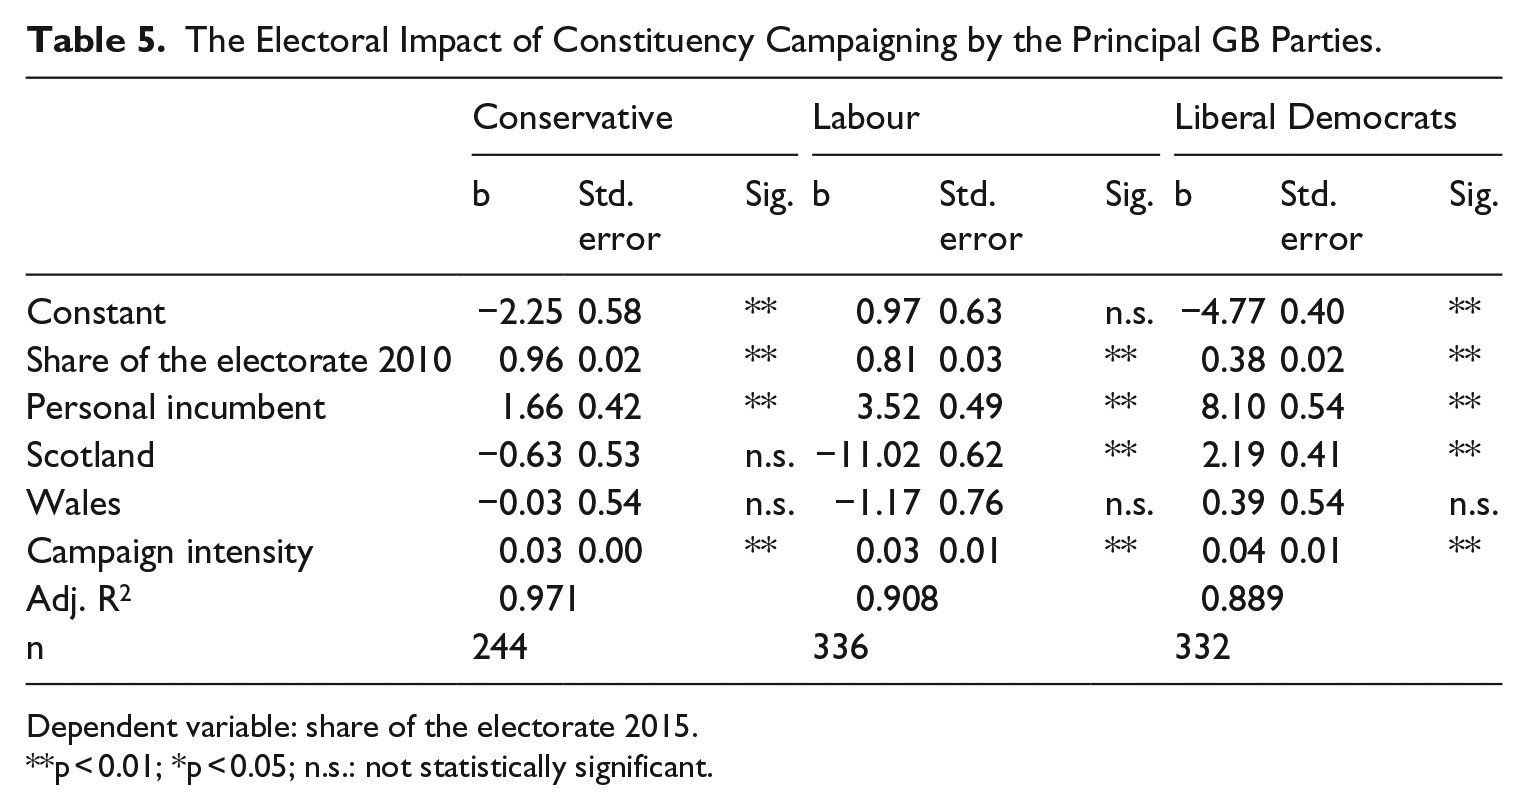
Dependent variable: share of the electorate 2015.
p < 0.01; *p < 0.05; n.s.: not statistically significant.
The use of the share of the electorate in 2010 as a control makes the model a dynamic test and also ensures that other variables that are correlated with previous vote, such as demographics, are effectively controlled. In addition, previous electorate share will also capture previous campaign efforts. Thus, insofar as campaign efforts are correlated over time, the true extent of campaign effects may actually be under-estimated. The test is a stiff one – not surprisingly, previous share of the electorate captures a great deal of the variance, so the model provides a robust test of whether or not constituency campaigning made a positive and significant contribution to electoral performance. The results are clear: for all three principal GB parties, more intensive district campaigning yielded greater electoral payoffs. 6
To illustrate the practical significance and substantive impact of these findings, we can examine the predictive margins of campaign intensity. 7 The model suggests that a Conservative candidate whose campaign reached the average intensity of a Conservative marginal seat (140) 8 could expect to win 26.3% of the electorate compared to a similar candidate with a campaign intensity of a hopeless seat (87) who would win 24.7% of the electorate. The difference of around 1.6 percentage points suggests a fairly solid increase in support for Conservative candidates where they ran an intensive local campaign. Indeed, all other things being equal, the loss of this share of the electorate would have cost at least an estimated nine seats – enough to deny the Conservatives a majority. The corresponding figures for Labour are 20.4% (campaign intensity 145) and 19.0% (campaign intensity 100) which is a difference of 1.4 percentage points (leading to the avoidance of an estimated loss of at least 12 seats). In the case of the Liberal Democrats, a better comparison is that between the highest campaign intensity scores which occurred in safe seats compared with the party’s hopeless seats. These results suggest a difference of 1.8 percentage points of the electorate where a candidate reached an average campaign intensity of a Liberal Democrat held seat (149) compared to a similar candidate where the average campaign intensity mirrored that found in hopeless seats (77). The results suggest that local campaign intensity did provide a boost in support – but not enough to save the majority of Liberal Democrat seats. However, contrary to Hypothesis 1, Liberal Democrat campaigns were not less electorally effective than those of the Conservatives or Labour in terms of average marginal gain in share of the electorate by seat.
The Impact of Rival Parties
To assess the second research question, the next step is to examine the effects of contests with different rival parties. We do this by assessing whether there is evidence of differential campaign effects, by comparing the effects of each party’s campaigns against different opponents using interaction terms between campaign intensity and the incumbent party. This allows us to assess variation in campaign effectiveness depending upon which party held the seat following the 2010 election. Given the effects of the SNP’s very strong performance, which effectively rendered prior standing in the constituencies to be meaningless, we confine our analysis to England and Wales. 9 Given the unpopularity of the Liberal Democrats at the national level and the distribution of the party’s campaign resources, we hypothesise the following:
Hypothesis 2: Conservative campaigns were more effective in Liberal Democrat seats than in Labour ones.
Hypothesis 3: Labour campaigns were more effective in Liberal Democrat seats than in Conservative ones
Hypothesis 4: Liberal Democrat campaigns were most effective in the party’s own seats.
Our model uses dummy variables to denote the opposing incumbent party (Conservative, Labour or Liberal Democrat) and then the interaction terms for campaigning in those seats, with Conservative seats as the reference category. These results are shown graphically in Figures 5–7, which compare the predictive margins for the three parties comparing campaigns in the range from the lowest campaign intensity for that party to the highest, holding the other variables constant. The full results from the modelling are shown in the Appendix 1 (Table A1).
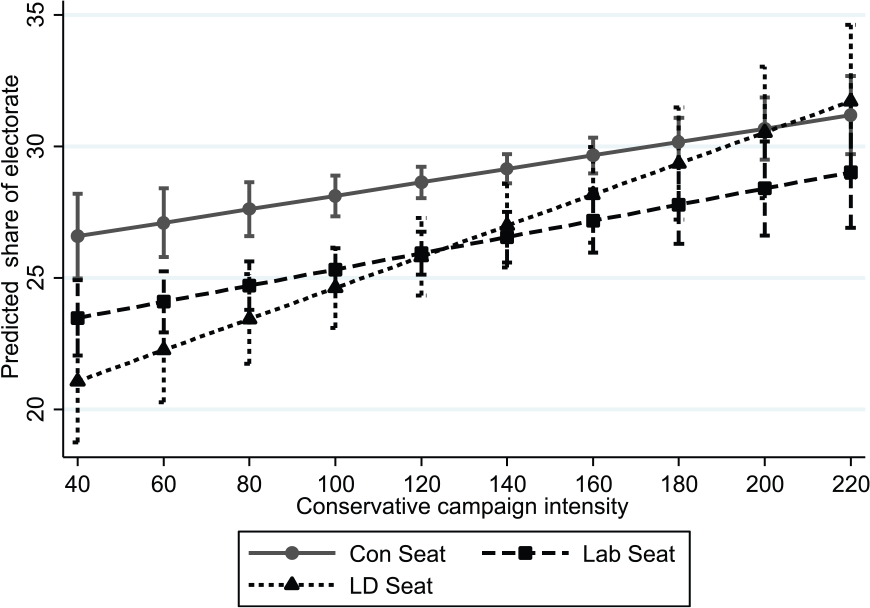
Predictive Margins of Conservative Campaigns by Seat Type (England and Wales Only).
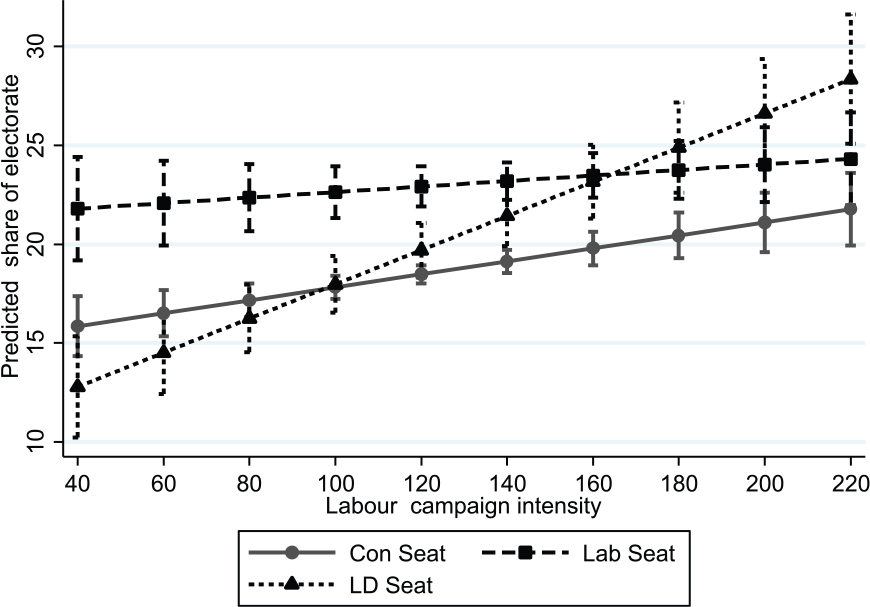
Predictive Margins of Labour Campaigns by Seat Type (England and Wales Only).
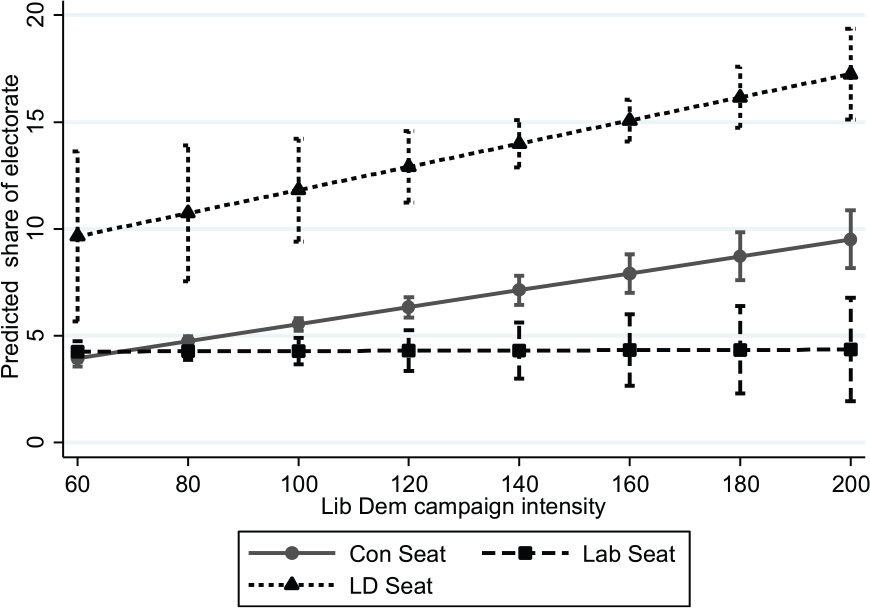
Predictive Margins of Liberal Democrat Campaigns by Seat Type (England and Wales Only).
What emerges from these analyses are some clear patterns. First, in terms of offensive campaigns, both the Conservative and Labour campaigns were more effective in Liberal Democrat–held seats as their campaign intensity increased – particularly so for Labour. Against each other, the effects of increased campaigning were more limited, confirming Hypotheses 2 and 3. In the case of the Liberal Democrats, increasing campaign intensity paid off far more in Conservative seats than in Labour ones but was most effective in seats the party already held, confirming Hypothesis 4 and suggesting that without intense campaigning in the party’s nominally ‘safe’ seats, the outcome could have been far worse.
The Popularity Equilibrium at District Level
So far, we have suggested that we would expect parties’ pre-election popularity at national level to impact upon the degree to which campaigns delivered electoral payoffs. Thus, where parties were at a level of popularity within a normal range (as was the case with the Conservatives and Labour), campaigns would deliver electoral benefits, whereas where a party’s popularity changes significantly (as in the case of the Liberal Democrats), campaigns would be less likely to deliver payoffs. An analysis of a single election, however, has limited power to identify how national level popularity influences campaign effectiveness. Certainly, we observe electoral payoffs for the Conservatives and Labour and also stronger performances against the Liberal Democrats. However, we also detect Liberal Democrat campaigns delivering payoffs. In order to test whether effectiveness varies systematically by the level of popularity of a party, we can examine the relationship at the district or constituency level.
We hypothesise that campaigns will vary in their electoral effectiveness depending upon the popularity of the party in an individual district. Parties, as we have seen, anticipate this up to a point by targeting resources in seats where the electoral contest is likely to be closest. Accordingly, campaigns are generally weaker where parties are already popular (safe seats) or where they are unpopular (hopeless seats). Yet, such calculations provide only a partial picture since they can only take into account limited evidence of shifts in popularity between elections and are based primarily on the degree of electoral competition rather than their own level of popularity in the district (although the two are interlinked). We anticipate that the effectiveness of campaigns will vary depending on the popularity of the party in each district in a curvilinear way. Under conditions of popularity equilibrium, this would produce an n-shaped curve. Parties’ campaigns would become more electorally effective as they became more popular but would reach a point of peak popularity, beyond which the impact of campaigns would start to decline.
Thus,
Hypothesis 5. The electoral effectiveness of parties’ district-level campaigns will be a quadratic function of their level of popularity in each district or constituency.
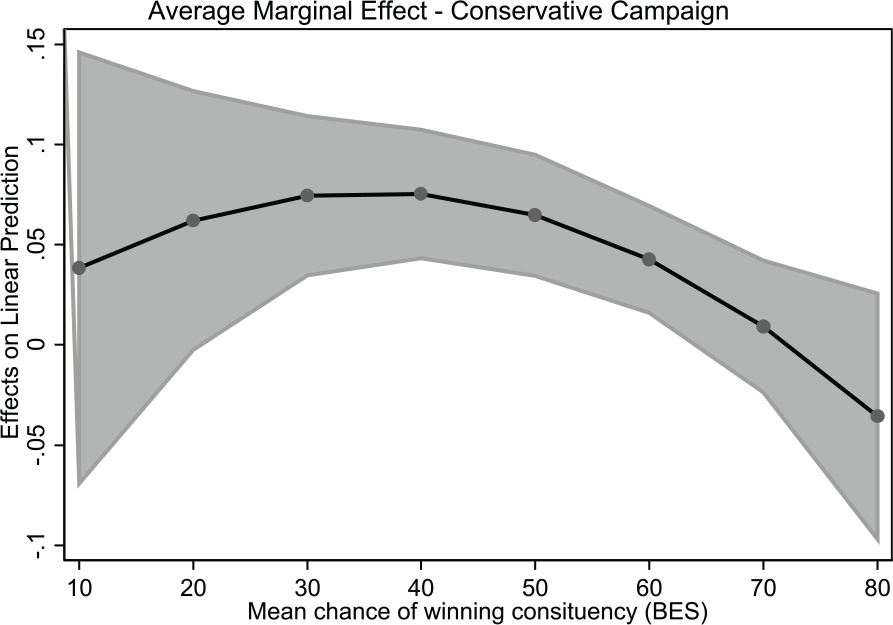
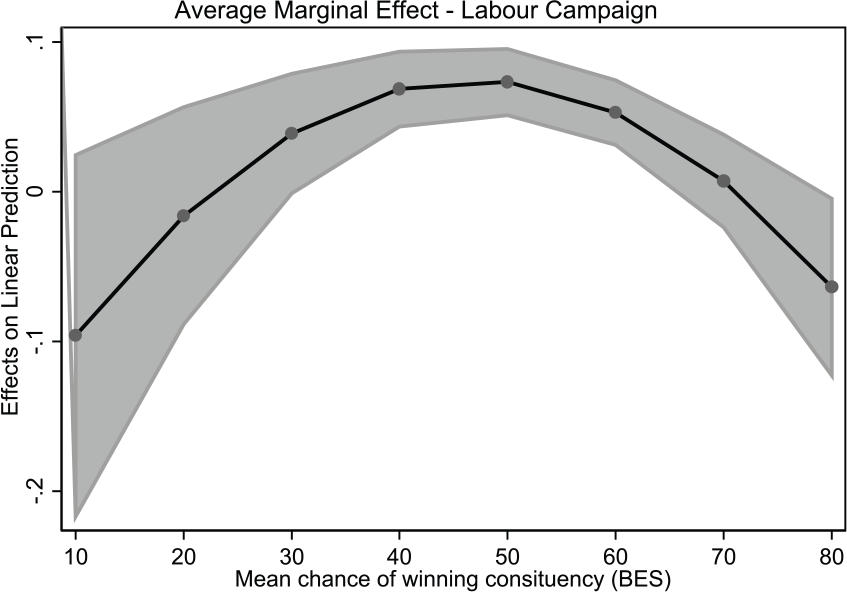
We assess this by integrating the district level scores of likelihood of winning from the British Election Study into the model of campaign effectiveness shown in Table 5. To capture the curvilinear nature of the relationship, we use both the measure of likelihood of winning and its squared term in the model. Both are then interacted with the measure of campaign intensity. As above, we control for the country in which the district is situated. Thus (where a is the party concerned),
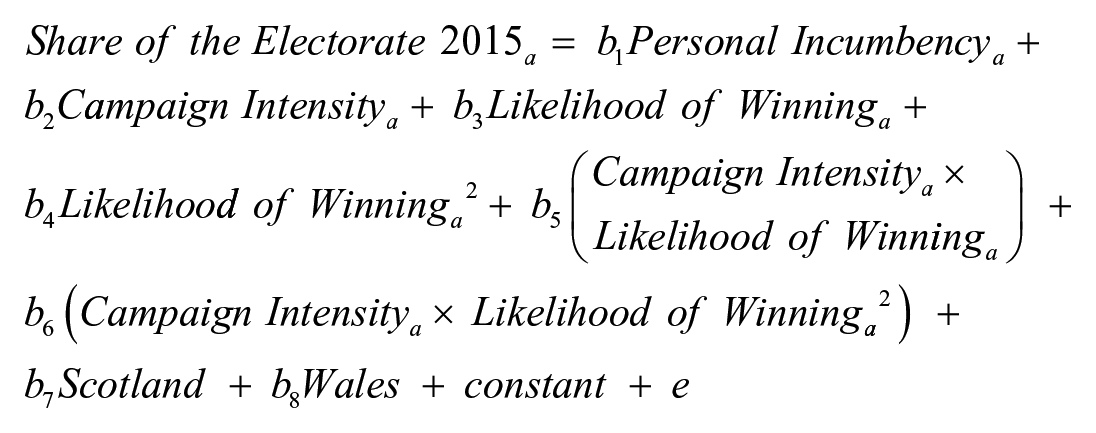
The full results are shown in Table A2 in the Appendix 1, with the graphical representations shown in Figures 8–10. We are seeking to establish whether the electoral effects of campaign intensity are conditioned by the popularity of a party (as measured by electors’ perception of the chance of that party winning in their constituency). The figures suggest that this is indeed the case. Thus, in the case of Labour (Figure 9), campaigns were most effective where, on average, voters estimated that there was a 50% chance of victory. Where the chance was estimated to be below 50%, the electoral effects were progressively lower as the estimated chance of victory declined. Equally, as the estimated chances of success exceeded 50%, the electoral impact of campaigns progressively decreased. In the case of the Liberal Democrats (Figure 10), the findings are somewhat different. Here, there is much more shallow increase between 10% and 40% chance of victory. After that, the marginal effects delivered by constituency campaigns decline as the party’s estimated chances of success increased in a manner similar to Labour.
Average Marginal Effect – Conservative Campaign.
Average Marginal Effect – Labour Campaign.
Average Marginal Effect – Liberal Democrat Campaign.
The model for the Conservatives (Figure 8) suggests that the party’s campaigns were most effective at around a 30% chance of victory. In this case, although the form of the curve is exactly as predicted, the three-way interaction between campaign intensity, the chances of victory and its squared term just fails to reach the conventional level of statistical significance. To test the robustness of this finding, therefore, we re-ran the model using share of the electorate in 2010 as the popularity predictor, given that Conservative popularity did not change markedly between the two elections. 10 Once again, the form of curve was as predicted and identifies an optimal point of campaign effectiveness where the party had won 30% of the electorate in 2010. The three-way interaction, in this case, was statistically significant.
Overall, Hypothesis 5 is largely supported, although with weaker evidence for the Conservatives. The popularity equilibrium at district level influences the degree to which campaigns deliver electoral payoffs – for all three parties, the electoral effectiveness of campaigns is conditioned by the perceived chances of victory. If voters perceive a party to have little chance of victory or perceive that their success is more likely, the electoral effectiveness of campaigns is diminished.
Conclusion
District-level campaigns are of key importance to parties’ overall campaign strategies, and more intense district-level or constituency-level campaigning tends to deliver electoral payoffs. But campaigns are not equally effective all of the time. Comparative evidence shows that the electoral context can condition the effectiveness of campaigns – if a party is particularly unpopular, its campaigns are less likely to be effective. These were certainly the conditions in which the Liberal Democrats found themselves in the 2015 election. Yet despite the party losing a significant share of the vote (15%) as well as 49 seats, our analyses suggest that its constituency-level campaigns were, up to a point, still electorally effective in terms of improving share of the electorate. The explanation for this lies in the party’s response to its unpopularity. Faced with national level unpopularity, the party ran a very defensive campaign, with most activity taking place in the party’s hitherto safe seats. Effective targeting of resources clearly matters. For example, what is also notable about the 2015 election compared with previous ones in Britain is that the Conservatives’ campaigns were electorally effective. Hitherto, the electoral impact of Conservative campaigning has varied because the party struggled to target resources effectively (Denver and Hands, 1997; Fisher et al., 2011). The evidence from 2015 is that that lesson had been learned – 2015 was the election when the Conservatives appeared to have cracked the effective management and operation of district-level campaigning.
However, what these analyses also show is that party popularity is a key influence on the electoral impact of campaigns. We observe this at both national and district levels, where four of our five hypotheses are confirmed. Our first hypothesis (Hypothesis1) was rejected. However, in respect of the comparative electoral effectiveness of Liberal Democrat and other parties’ campaigns, we do show that both Conservative and Labour campaigns were more effective in Liberal Democrat held seats than in those held by either the Conservatives or Labour (Hypothesis 2 and Hypothesis 3). Equally, we show that the Liberal Democrats’ campaigns were more effective in seats the party already held (Hypothesis 4) – although not sufficiently effective to prevent the loss of most of them. Finally, we show at the district level that party popularity also conditions the campaign effectiveness of all parties (Hypothesis 5). In effect, the popularity equilibrium, measured at district level, is a key determinant of the electoral effectiveness of campaigns. These findings are highly significant since they demonstrate at both national and district levels the importance of contextual effects on election campaigns.
Of course, parties are not blind to their own levels of popularity and seek to compensate these effects if they can. The principal way in which parties can try and offset the impact of a change in equilibrium (when they become significantly less popular) is through the effective distribution of campaign resources. As we observe, the Liberal Democrats were able to do this to an extent but not enough to prevent party losing most of its seats. The case of 2015, therefore, provides some important insight into the effects of exogenous factors on in the impact of campaigning and by doing so, we can show both whether campaigns were successful in electoral terms and throw some light on explaining why they were successful. Overall, 2015 was the election when Conservative constituency campaigns ‘clicked’. But, Labour and Liberal Democrat campaigns also delivered positive electoral gains, suggesting, if nothing else, that the results could have been even worse for those two parties had their campaign efforts not been so targeted. All of which neatly illustrates that while campaign effects are important, their impact may be contingent on the electoral context and parties’ response to it.
Footnotes
Appendix 1
Funding
The author(s) disclosed receipt of the following financial support for the research, authorship and/or publication of this article: This research was funded by the Economic and Social Research Council (Grant No. ES/M007251/1).