
Abstract
Police data is an important source of information for researchers about investigations, suspects, and victims. However, crime records can be problematic to work with. Here we outline three key issues along with our approach. We discuss data quality, which reflects missing and misclassified values; inconsistency, which refers to the vague and at times different definitions provided; and granularity, which reflects the lack of detailed information included in the datasets. We recommend developing a robust strategy for working with missing data, triangulating across different sources, creating higher-order categories where necessary, and creating a detailed data governance plan before analysis begins.
Introduction
Many academic studies rely on police data to capture information about crimes, offenders, and victims, as well as prevalence and outcomes (e.g., Bailey et al., 2020; Moulds et al., 2019; Weare, 2020). Additionally, government bodies such as the Office for National Statistics release official figures relating to police performance and crime trends based on data provided by England and Wales police forces (Office for National Statistics, 2022, 2023). These figures may support policies or action plans, or impact on how resources are allocated within and by government bodies, which have real-life societal impacts (e.g., McKeown, 2018). This is compounded by stretched resources which underpin an increasing move towards data driven policing (Ferguson, 2017), which in turn means researchers and analysts have greater opportunities to work with police data. Nevertheless, to do this effectively much more needs to be understood about the complexity of police data.
Even defining ‘police data’ can be difficult as different researchers use various definitions including case files (Miles and Condry, 2016), records in police databases (Bland and Ariel, 2015; Brimicombe, 2016), police recorded crimes (Aebi, 2008), or databases of police, court, and other investigative files (Chopin and Caneppele, 2019); most often, only the general term ‘police data’ is used with no clear explanation of what that means (e.g., Moulds et al., 2019; Shannon, 2008). Here, we define police data as details extracted from crime records input and stored on police record management systems (RMS). Additionally, what is often not discussed is the multitude of complexities hidden within police data that both police analysts and researchers must grapple with and make decisions about before presenting their results. The decisions made when cleaning police data, the analytical choices, and the impacts of these choices on the findings are usually not discussed or acknowledged.
The Home Office Crime Recording Standards set out different reasons for recording crime: to provide a high-quality service to victims, promote effective and ethical investigations, inform the public about the risk of crime, and to support police management and national policy development (Home Office, 2018). Thus, crime records are partly intended to provide information around resource allocation, as well as track investigative progress (McFadzien and Phillips, 2019), and as such their intended purposes are different from academic research. Additionally, police data is recorded in different formats, in different RMS and held in different systems within these various RMS according to the specific focus of the data (e.g., child protection vs sex offender register), as well as its specific purpose (e.g., crime recording vs case and custody) (College of Policing, 2019) and these systems may not necessarily link up. Furthermore, frontline officers perceive little benefit to accurate data collection and entry (Lum et al., 2017; Sanders and Henderson, 2013) and have substantial levels of discretion as to which reported crimes are recorded as crimes and what details to include (O’Connor et al., 2021; Varano et al., 2009). Indeed, a quality data audit by Her Majesty’s Inspectorate of Constabulary (2014) found police-recording of crime was poor, and especially concerning for sexual offences. The low priority given to data recording coupled with the different foci of its collection and storage can pose challenges for academic researchers and police analysts who are reliant on high data quality.
Operation Soteria Bluestone (OSB) was launched by the Home Office to improve the police response to rape and serious sexual offences (Stanko, 2022). The authors of this paper were part of the academic team forming Pillars 1 (suspect focused investigations) and 2 (targeting repeat suspects) and were involved with the project from 2021 to 2023. Our remit was to use the data gathered to explore patterns of repeat offending behaviour in suspects accused of rape and serious sexual assault in England and Wales. There was both a focus on their sexual offending and their criminal history more generally.
In year one of the project, all police records of rape and serious sexual offences reported between 1st January 2018 and December 2020 taken from five pathfinder police forces in England and Wales were received. In year two, three of the police forces provided further data which were combined to cover all sexual offences reported in those three jurisdictions between 1st January 2019 and 31st December 2021. The data obtained was at person level, meaning the data extracted by the police was for every individual in each crime recording system who was associated with a sex offence; the criminal histories of the identified sex offence suspects were also provided.
In year one, the result of these data requests were five datasets detailing between 15,775 and 163,972 crimes, between 4,182 and 28,280 suspects, and between 5,318 and 67,624 victims. The datasets included details of the crimes, including crime type and outcome, and demographic details of suspects and victims, including sex, age, ethnicity and relationship. In year two, three datasets were obtained and combined into one dataset consisting of 168,056 crimes, 28,543 suspects and 95,604 victims. This dataset was truncated to cover the same time-period and include the same crime, suspect and victim details provided by all three forces. It should be noted, the initial datasets included crimes recorded as ‘non-crimes’ or ‘no crime’. These were excluded because they were outside the remit of the intended research and are not included in the above figures. According to personal communications with the police analysts from one force, for rape offences, a ‘non-crime’ (Home Office code N100) relates to any reported rape or attempted rape, regardless of who makes the report, that has not been immediately recorded in the system as a confirmed rape. A case remains a ‘non-crime’ when the offence was committed within the jurisdiction of another police force or happened outside of England and Wales, when enough and appropriate evidence that contradicts a sexual offence occurred exists (within 24 hours), or when the victim cannot be confirmed or traced. However, this definition is likely to differ for different forces. Indeed, the code seems to be applied differently by different forces. For example, one force in England uses the N100 code in their rape and serious sexual offences (RASSO) procedure when the victim does not seek a police investigation, the victim wants to maintain their anonymity, and when the victim does not want to pursue a case but has undergone a forensic examination at a Sexual Assault Referral Centre (North Yorkshire Police, Fire and Crime Commissioner, n.d.). A ‘no crime’, on the other hand, also known as a ‘cancelled crime’, refers to those sex offending cases where a crime has taken place but is not recorded due to additional evidence or other issues, such as the crime having been committed outside the police force’s jurisdiction, it duplicates an already recorded crime, the case was crimed in error, or no notifiable crime has been committed.
Whilst it is unlikely that many scholars assume that police data is complete, accurate and needs no further manipulating before analyses, there is a dearth of research that explores the accuracy of police recorded data and helps to document the extent of the problem as well as strategies researchers can put in place. Below are three of the key methodological challenges that arose, namely data quality, inconsistencies, and granularity, when using England and Wales police sexual offence report data for research, alongside an account of how the research team dealt with these issues.
Data quality
Examples of missing data in the year 2 combined dataset of all reported sex offences 1 .
Note: These figures are for named suspects and victims only.
The issue of missingness can be particularly problematic for behavioural aspects of the crime; for example, in our data ‘weapon description’ was missing 93.5% of the time 2 (‘no weapon used’ accounted for 5.0%, so missing cannot be taken as a proxy for a lack of weapon). Indeed, a study by Davies et al. (2021) found the percentage of missing data increased as the complexity and subjectivity of the information being recorded increased. This limits the conclusions that can be made from a research perspective, especially if data is missing not at random (MNAR), that is, in a systematic or biased way where certain groups are more or less likely to have missing data (Groenwold and Dekkers, 2020). Missing data can lead to a reduction in power, making it more difficult to detect differences, and can lead to causal effects being over or under-estimated (Streiner, 2002).
Missing data analysis
There are a number of ways researchers can approach missing data. A complete case analysis (CCA) approach involves excluding cases where the variable(s) of interest are missing for each separate analysis. However, this means conclusions are limited to suspects where information is available and, as it is unlikely the data are missing completely at random (MCAR), it is possible that bias exists, and the findings may not represent most sex offence crimes. This issue is likely exacerbated where there are high amounts of missing data. Where data is MCAR, missingness does not introduce bias into the results (Little and Rubin, 2002). However, in police data, variables such as ethnicity are unlikely to be MCAR (Lines et al., 2022; Varano et al., 2009) and given the complexity of factors driving not only data entry accuracy but case outcomes (e.g., the amount of physical violence used in the offence (Murphy et al., 2021) and police response to victims (Maddox et al., 2011)), it is unlikely the data provided will adequately reflect the mechanisms behind the MNAR. In these cases, CCA can be preferable because it does not rely on assumptions about mechanisms driving the missingness (Hughes et al., 2019). Data may also be missing at random (MAR), where missingness is related to the observed data but the actual values that are missing are random (Little and Rubin, 2002). A missingness analysis can enable researchers to understand the patterns and mechanisms of missing data that is, is data MCAR, MAR or MNAR? And therefore, what data strategies are appropriate. Sensitivity analyses exploring how different assumptions about the nature of missing data (e.g., MCAR vs MAR) and how different methods for handling this (e.g., multiple imputation vs maximum likelihood estimation) impact the results can be conducted to enable the robustness of the findings to be tested (Pina-Sánchez et al., 2023; Thabane et al., 2013).
Recording errors
Additionally, recording errors are common in police data. Ages may range from minus numbers to beyond the typical lifespan (e.g., over 150 years old). Whilst minus ages are obviously mistakes, victims and suspects above the age of 100 are possible, and it can be difficult to discern where the threshold between accurate and inaccurate should be. For suspects at least, 10 is the age of criminal responsibility, which provides a rationale for a lower cut off. However, if the suspect truly is under 10 these crimes should not be recorded in the first instance. In these cases, researchers must decide whether to keep the crime and remove the age or remove the crime entirely. Either way, this must be done consistently and documented with the rationale. Other sources of information within the dataset may be able to inform specific decisions, for instance does the victim’s age or sex match the crime description for example, ‘Rape of a female child under 13 by a male’ is associated with victims that are age 13 or under, of if the suspect is very elderly does the victim-suspect relationship include grandparent or did the offence happen in a hospice/hospital. Equally, age zero may denote missing information. A frequency analysis can determine whether its occurrence is an outlier when compared to other ages and a missingness analysis can show if it is associated with suspects and victims that have no other demographic information available.
Inconsistencies
More generally, inconsistencies both within and across police forces can be problematic. Some inter-force consistency issues may reflect biases in the way data is recorded on their particular RMS. For example, forces have keywords and flags associated with each crime which can be poorly completed, and where they are completed keywords and flags do not always match. For instance, one force 3 provided a flag demarcating 10.0% of sex offences as involving domestic abuse, whereas the keywords suggested 16.4% of sex offences involved domestic abuse. This discrepancy raises questions as to which is more accurate. It is possible the flags and keywords are based on different sources of information or have different internal thresholds for example, keywords may be based on ‘suspected’ domestic abuse whereas the flag is based on proven cases. Alternatively, inconsistencies may arise when police officers need to input the same information in different ways. Inconsistencies should be checked, for categorical variables this can be done through comparing frequencies or using contingency table analysis. Where inconsistencies are found, sources of information can be merged, or a choice needs to be made and documented as to what information is given precedence over the other. Additionally, not all forces clearly demarcate if flags and keywords are at suspect, victim or crime level, which to some extent renders them useless for determining different behavioural aspects. For example, a keyword suggesting mental health is a factor has different implications depending on if it refers to the suspect, victim or both. Therefore, potential research questions have to be adapted to ensure they do not go beyond what the behavioural indicators can actually evidence.
Conducting time-based analyses
In addition, if the exact time or date of a crime is unknown, ‘placeholders’, such as the first of the year, can be used. Frequency analyses can illustrate whether some dates/times are over-represented in the data. Similar to other inconsistencies, placeholders could be a limitation of police RMS. Officers are forced to record incorrect dates and times because there is no option to provide a ‘rough time period’. This is a particular problem with historic reports of sex offences, where the exact date is often unknown, or a series of incidents are truncated into one, therefore underestimating the true number of offences and making the dates unreliable. Furthermore, if additional historic victims are added, the crimes reported as occurring against them can be recorded as occurring at the same time as the initial reports. This can make it appear as though suspects engaged in simultaneous offending against multiple victims. This can mean that for any analyses that concerns time of offence, a significant amount of data, for example crimes recorded as occurring on the first of the year, the first of the month or at midnight, have to be excluded due to concerns over accuracy unless other sources of data can be found which confirm the true time and date of offence.
Conducting longitudinal analyses
Additionally, it is also not always possible to directly compare data from the same force across time. Forces change their recording systems meaning not all features match: some features cease to be recorded, whilst others are only recorded more recently or slightly different information is recorded making longitudinal analysis more difficult. For example, one force had changed recording systems and could not provide outcomes for older cases that had not been charged. Moreover, attention needs to be paid when recoding historic sex offences dating to before the current Sexual Offences Act (2023); SOA, 2023), as some prior offences are no longer notifiable, or nomenclature and categorisations have changed. Similarly, new offences are constantly added or reworked, such as the 2015 addition of “controlling or coercive behaviour in an intimate or family relationship” under the Violence Against the Person offence class (Serious Crime Act 2015, S. 76). Another example is the use of the Domestic Abuse Stalking and Harassment and Honour-based Violence (DASH) Risk Checklist (Richards, 2009), which has become common practice from 2009 onwards only, so analyses based on this variable may be more limited. These details need to be dealt with and accounted for in the context of the research, either through accepting that these changes over time mean longitudinal analyses may not be fully possible, or that information needs to be inferred from other sections or other types of data (e.g., reports) in order to ‘match’ variables across time.
Implement standardisation
There are also issues with consistency and police officers and analysts may not always be sure about exact definitions for the data provided either, making it more difficult to ensure consistency of meaning across datasets. Indeed, the initial request to all police forces for RASSO provided slightly different offences from each, with one force giving all sex offences committed because they did not delineate between RASSO and sex offences more generally. Others included different types and amounts of offences in the category. This suggests there is no standardised definition of RASSO being used by police despite this term being commonly used in government and operational policy (College of Policing, 2023; Crime Prosecution Service, 2020; West Mercia Police, 2022). To some extent, other features that also come with the assumption of standardisation, such as case outcomes or crime types, can be different across forces. For example, some but not all forces separate charge and caution outcomes for the offence and alternative offence (e.g., OC1 and OC1a; OC2 and OC2a). Two forces provided us with outdated or unique outcome codes (e.g., N1003, ‘P’, 66). Efforts can be made to obtain clear descriptions from police analysts, but ultimately consistency needs to be obtained through gathering more information or grouping data into the smallest standardised units possible. For example, the research team had to re-request all sex offences committed in each police jurisdiction to ensure the forces were providing comparative data. We also grouped the outcomes into larger categories based on the general meaning that is, OC1 and OC1a were grouped into ‘charged and/or summonsed’. However, this approach does mean that more refined analysis based on smaller categories could not be conducted.
Recode features
Examples of coding decisions.
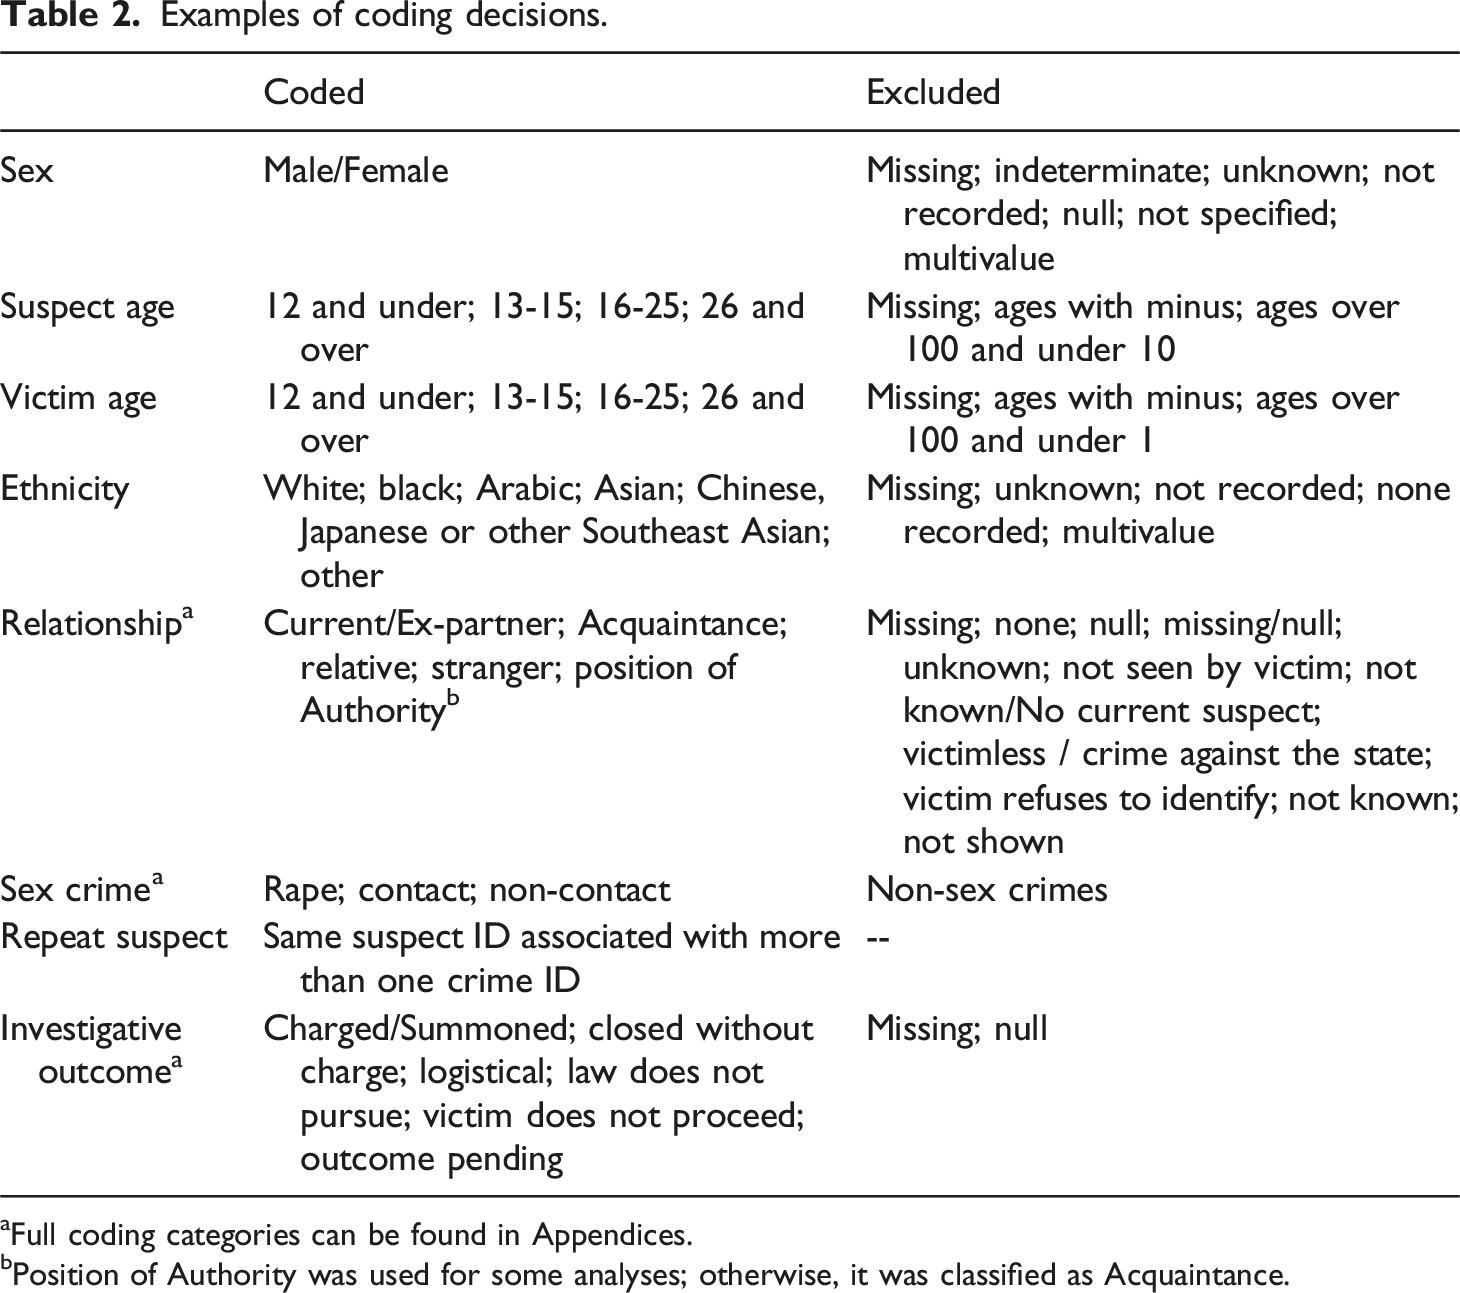
aFull coding categories can be found in Appendices.
bPosition of Authority was used for some analyses; otherwise, it was classified as Acquaintance.
Additionally, police given ethnicities (i.e., the Identity Codes (IC) categories), which are a 6 + 1 categorical system based solely on visual appearance (Bowsher, 2007), do not always match the self-defined ethnicity of the suspect or victim, or an IC ethnicity was not recorded despite self-defined ethnicities being available. Police- and self-defined ethnicities, can be combined to reduce missingness in the data. However, where they disagree, researchers need to decide and document which source of information to prioritise. Each may have limitations, individuals may not report their ethnicity correctly for personal reasons, but there is also some evidence to suggest potential biases in police databases (Moretti and Buil-Gil, 2021) and that police practices are based on outward appearance (Borooah, 2011).
Other cross-force comparisons can be more complex. Forces do not provide definitional categories for sex offences. We grouped sex offences into Rape, Contact, and Non-Contact offences as they are often discussed this way in the literature (e.g., Almond et al., 2021; Gallo, 2020; Soldino et al., 2024). Rape was based on Home Office defined rape offences (Code 19, e.g., Code 19/08: Rape of a female aged 16 or over; Code 19/13: Attempted rape of a male aged under 16). Contact offences were those where physical contact between the victim and suspect was assumed to have taken place (e.g., Code 17/13: Sexual assault on a male aged 13 or over - penetration; Code 21/25: Causing or inciting a child under 13 to engage in sexual activity by an offender under 18 years of age), or the offence would facilitate physical sexual contact between the victim and someone else (e.g., Code 71/10: Arranging or facilitating the sexual exploitation of a child - Child 13 – 17; Code 71/12: Controlling a child subject to sexual exploitation - Child under 13). Non-contact offences were those where no physical contact was assumed to have taken place (e.g., Code 21/10: Engaging in sexual activity in the presence of a child under 13 by an offender aged 18 or over; Code 72/02: Intentionally arrange / facilitate entry into UK / another country of a person with a view to their sexual exploitation).
Police may use numerous different suspect-victim relationships, these may be recorded differently across forces and formal definitions for certain relationship types may be lacking. For example, one force used the relationship ‘In Dispute With’ but was unable to give a detailed description of when this might be used. Researchers may want to introduce categories that reduce the number of relationships, but in a way that maintains meaning. For example, where step versus biological relatives are not routinely included in the data, an over-arching category of ‘relative’ can be adopted, although this means the relationship categories lack nuances which are potentially important for future research.
Impact of exclusions
Excluding data further increases the amount missingness, which as previously discussed, introduces sources of bias. For example, we removed unidentified suspects because they could not be linked across crimes and our research focused on repeat suspects. However, these suspects may also be systematically different from those who are identified for example, possibly more likely to be strangers (Vic et al., 2020). These decisions, where data is excluded based upon a particular criterion, ensures the data is not MCAR and increases the importance of missingness and sensitivity analyses. Exclusions also limit the reliability and generalisability of the research by excluding subsets of data that may represent different populations (e.g., stranger offences) and reduce the sample’s representativeness limiting the potential conclusions that can be made about sex offences. Furthermore, both the creation of higher-order categories and the exclusions reduces the number of research questions that can be asked of the data; for example, we could not be certain which zeros represented true victim age and which were missing values. Therefore, victims aged 0 were excluded despite the likelihood that this is representative of some victims and given their vulnerability exploring this is an important topic of investigation.
Granularity
A lack of detail can mean it is difficult to relate different variables to each other, or that cruder measurements must be used, both result in less nuanced analyses. For example, investigative outcomes (e.g., charged/summonsed) can be recorded by crime, rather than for each individual suspect and victim. Therefore, in cases where there are more than one suspect and/or victim the outcome for each person is unknown (i.e., were all suspects charged?). Similarly, innocent or eliminated suspects are not uniformly flagged as such across all forces. Depending on what the research questions and aims are, details such as these can have important consequences in terms of future research, the accumulation of academic knowledge and policy implications. For example, although likely only affecting a small minority of cases, sex offence reports with multiple suspects may not actually have multiple suspects; it may be some suspects were subsequently eliminated from the investigation, but not flagged as such, potentially leading to overestimating offences committed by groups of people.
Additionally, third party reports, which are made by someone other than the victim, may not necessarily reflect a crime having taken place, for example, a mistaken witness report. Researchers should also be aware of the way in which their data was extracted by the police analysts, as there are different data matching techniques; some use suspect IDs or victim IDs (depending on the type of information required) or the crime ID, or a combination of these. These different methods will give different results, especially when considering missing data, inaccurate (e.g., misspelled, misclassified) data, and common names. Lastly, due to crime counting rules sometimes the data only contained the ‘worst’ crime committed during an incident, thus losing details about possible other crimes which take place at the same time, for example if a crime involves a rape and a sexual assault, the sexual assault might not be recorded. However, this may not be consistently applied, some forces record crimes occurring within an incident separately, while others do not, or some recorded multiple crimes occurring in a short (arbitrarily chosen) timeframe by the same suspect against the same victim as one incident, whereas others do not. This can lead to ‘lesser’ crimes being underrepresented and it can limit analyses on patterns and trajectories of offending and may prevent or limit certain analyses (e.g., investigating crimes that co-occur together).
Determine limitations
To some degree, these issues raise questions regarding the precise inferences that can be drawn from police crime data. Each report may not necessarily correspond to a singular crime; conversely, it could signify the occurrence of multiple crimes; it may also be that some suspects are innocent or eliminated, and some crimes are reported as happening at the wrong date and/or time. Therefore, if possible these types of limitations should be ascertained by the researchers and discussed. Ironing out details about the data with the police can be an arduous, time-consuming task, so researchers should allow for enough time within their project’s timeframe to really understand the data they are given, its caveats and how it can be used best.
Indeed, gaining as much information about the data as possible from the police analysts is vital for contextualising research findings and presenting them in a way in which the caveats and limitations are clearly defined. We suggest researchers gain a clear picture of data recording practices within the police force providing them with data. Researchers should be aware of these caveats, which although in the minority, do need to be reflected in the language used and conclusions drawn. For example, we consistently used the terminology ‘report’ rather than crime and ‘suspect’ rather than ‘offender’ given the data does not represent the number of crimes committed, nor does it represent the number of convicted offenders.
Discussion
Police data is not recorded with academic analyses in mind and police do not prioritise the accuracy and completeness of their data (Lovett et al., 2022). This article outlined three of the main challenges when using summary sex offence data extracted from police RMS for academic or analytical purposes. Data can present as inconsistent, inaccurate, contradictory, and lacking in detail. Furthermore, there can be high levels of missing data, especially for more complex behavioural features. In addition, the systems police use to enter data are not built for research but to supplement investigative case files meaning that context is lost when relying purely on information entered into their data systems. Overall, these issues pose challenges for those wishing to use it to answer detailed research questions or compare features of offences across forces.
Analysing data with missing values requires making assumptions about why the data is missing and the analysis choice should reflect the amount, patterns and reasons for the missing data (Hughes et al., 2019). In general, our approach was to exclude cases where data was missing, invalid, or questionable (e.g., suspect ages below 10 years old). This approach maintained consistency but reduced the generalisability and power of analyses. Other researchers may want to use techniques such as multiple imputation, which allow cases with missing values to be used in the analysis and can reduce bias (Pina-Sánchez et al., 2023; Sterne et al., 2009), especially when the data is MAR, the missingness mechanism is known or can be modelled or the researchers have smaller sample sizes.
Making higher-order categories that capture broader meanings within the data can make police datasets comparable. However, this can prevent certain analyses or lead to results which are cruder in terms of the categories used and inferences that can be made. Where possible, researchers could draw on other sources of data that may provide some of the missing data or provide more clarity; for example, casefiles, despite having limitations of their own (Güss et al., 2020; Honig and Lewinski, 2008; McClure et al., 2020), may provide information about weapon use, behavioural aspects, and vulnerabilities, or specific relationship involved such as biological or step- relative. Equally, triangulating across sources of information within the dataset can help ascertain if details are misclassified, although does not negate the need for researchers to decide and document which information they think is more likely to be accurately coded.
Police crime data has also been critiqued as being biased, particularly racially, with some types of information being more often recorded than others, such as the data on ethnic minorities (Varano et al., 2009). It has been suggested this can lead to overrepresentation of certain populations or locations, or underrepresentation of certain crimes, particularly gendered violence (Buil-Gil et al., 2021a; 2021b). Researchers need to pay attention to such inconsistencies, including their effect on missing or unrecorded data, and the impacts these have for analyses. The limitations of the analyses need to be clearly stated.
Working collaboratively with the police, where possible, has numerous advantages (Marks et al., 2010). In the event researchers can ask police analysts for clarifications, it may be useful to prioritise which further information they need and which would be desirable; it may be decisions have to be made about which variables are more essential for their research. Here, we strongly suggest working directly with police analysis extracting and managing the data, to streamline the process and support the delivery of reliable outputs. Lastly, we found it helpful to keep a rigorous data governance plan, which included, for example, a variable dictionary with their explanations and use, a list of all coding and recoding done – and why, if needed – or even notes about when the analysts where contacted and minutes of these meetings in case something was unclear later in the process. We found keeping a record of decisions and reasons for those decisions was vital for managing the project and transparently justifying our approach to the data. Moreover, we developed spreadsheets outlining how each variable across each police force had been recorded for example, all the different sex offence home office codes provided by each force, this enabled us to uncover discrepancies between the forces, as well as formulate an approach to coding consistently across the dataset before any actual analysis took place.
Overall, this article underscores some of the challenges associated with utilising police sex offence data, as well as the importance of recognising caveats and limitations. The solutions put forward was effective in the context of our own research and may be a potential roadmap for others grappling with similar issues. However, we suggest decisions surrounding data analysis and results should be made in the setting of specific research objectives, data sources, and constraints. As we move towards more data-informed policing and police research, adaptability and a nuanced understanding of the data must be employed to maximise the utility and reliability of police data to make informed assumptions and practical recommendations.
Supplemental Material
Supplemental Material - Issues with using police data to investigate offending: A research perspective
Supplemental Material for Issues with using police data to investigate offending: A research perspective by R Spence and IM Crivatu in The Police Journal
Footnotes
Declaration of conflicting interests
The author(s) declared no potential conflicts of interest with respect to the research, authorship, and/or publication of this article.
Funding
The author(s) disclosed receipt of the following financial support for the research, authorship, and/or publication of this article: This work was supported by the Home Office Science, Technology, Analysis, and Research fund and by the Mayor’s Office for Policing and Crime.
Supplemental Material
Supplemental material for this article is available online.
Notes
References
Supplementary Material
Please find the following supplemental material available below.
For Open Access articles published under a Creative Commons License, all supplemental material carries the same license as the article it is associated with.
For non-Open Access articles published, all supplemental material carries a non-exclusive license, and permission requests for re-use of supplemental material or any part of supplemental material shall be sent directly to the copyright owner as specified in the copyright notice associated with the article.