
Abstract
The current study was designed to assess whether cognitive risk factors (i.e. anxiety sensitivity (AS), intolerance of uncertainty (IU)) explained variance in mental disorder symptoms in Canadian police officers beyond variance explained by demographic variables (i.e. sex, marital status, education, years of service). Police participants (708 men; 271 women) completed measures assessing posttraumatic stress disorder, panic disorder, social anxiety disorder, major depressive disorder, generalized anxiety disorder, IU and AS. Multivariate analysis of variance demonstrated that only main effects of sex were significant for all symptom variables, except SAD. Hierarchical multiple regressions demonstrated that AS and IU accounted for greater variance than sex on all mental disorder symptom measures, which suggests that cognitive risk factors explain more variance in mental disorder symptoms than sex. Efforts to reduce AS and IU may be beneficial for improving police mental health.
Keywords
Introduction
Police officers are recognized as having an extremely stressful occupation that includes frequent exposures to a subset of potentially psychologically traumatic events (Carleton et al., 2019a) sometimes referred to as critical incidents (e.g. violent death of a partner, taking a life in the line of duty; Carleton et al., 2019b; Weiss et al., 2010), public stigmatization and criticism, and enduring standard ongoing work-related stressors (e.g. irregular work hours, exposure to violence; Adams and Buck, 2010; Ménard and Arter, 2014; Swanson et al., 2012).
The current investigation was designed to explore mental disorder symptoms and relevant risk factors among police. Police experience high levels of exposure to critical incidents and other potentially traumatic events (Carleton et al., 2019a); however, even within policing, different operational roles may result in variation in mental disorder symptoms and types of exposure to potentially traumatic events. For example, homicide investigators working with child homicide cases report more acute emotional stress when compared to investigations of adult homicide (Roach et al., 2017). Similarly, police who work in the area of child exploitation or online child pornography are exposed to unique stressors (e.g. repeated exposure to obscene content) that are often ranked among the top four police stressors and can lead to various distressing symptoms (i.e. anxiety, helplessness, sadness, guilt), vicarious trauma, burnout and compassion fatigue (Figley, 1999; Krause, 2009; Marshall, 2006; Van Patten and Burke, 2001; Violanti and Aron, 1995; Violanti and Gehrke, 2004). There are differences in exposures to various categories of potentially traumatic events within policing; nevertheless, the present investigation focused on mental disorder symptoms and risk factors more broadly among police.
Operational stress injuries (OSIs) experienced in various policing roles can lead to problematic coping strategies (i.e. avoidance) and possibly negative mental health outcomes (Hakan Can and Hendy, 2014; Marmar et al. 2006; Pasillas et al., 2006; Wang et al., 2010; Weiss et al., 2010). For example, the global rate of depression among police appears nearly double when compared to the general population (Hartley et al., 2011), with over one-third of police meeting criteria for depression (Lawson et al., 2012). In addition, comorbidity of mental disorders (i.e. meeting symptom criteria for more than one mental disorder) is common among police globally and across Canada (Bowler et al., 2010; Carleton et al., 2018a). As part of Canada’s public safety personnel (PSP), police officers self-report high rates of symptoms consistent with a range of mental disorders, including post-traumatic stress disorder (PTSD), panic disorder (PD), social anxiety disorder (SAD), major depressive disorder (MDD) and generalized anxiety disorder (GAD; Carleton et al., 2018a). The high rates of symptom reporting suggest that poor mental health is a significant issue among Canadian police officers and supports the call for a National Action Plan to improve the long-term care of Canada’s PSP (Oliphant, 2016).
Several different programmes have been engaged as a possible way to improve police officer mental health directly (e.g. skills training for symptom management) or indirectly (e.g. using education to reduce stigma, early identification of symptoms, clarifying access to professional resources). Compared to interventions implemented after the development of a mental disorder, proactive strategies might have clear individual and societal benefits, including reduced length and severity of individual suffering, as well as lower financial costs for both the individual and society (Rutz et al., 1992). Identifying risk factors for mental disorders in police and developing protocols to address mental disorder risk remains an important endeavour and has the potential to reduce the economic costs of mental health care.
Demographic risk factors for mental disorders may be one avenue of focus for protocols designed to mitigate OSIs. Recent research suggests that demographic factors may contribute to PSP risk for developing a mental disorder. Indeed, Carleton et al. (2018a) found that PSP who were unmarried, lived in Western Canada, had less than a full university degree, and had more years of service had greater odds of screening positive for a mental disorder. Furthermore, females reported statistically significantly higher rates of mental disorder symptoms compared to males, but only among firefighters and municipal and provincial police officers. Females in the federal police (i.e. the Royal Canadian Mounted Police (RCMP)) were not significantly more likely to screen positive than males, but the confidence interval statistics were very nearly statistically significant (Carleton et al., 2018a). Female police officers may report higher rates of mental disorder symptoms than males for several reasons, including, but not limited to: minority group status in a typically male-dominated profession, sex/gender differences in stigma of reporting mental disorder symptoms or systemic vulnerability among police officers (Franklin, 2007; Ménard and Arter, 2014; O’Connor Shelley et al., 2011; Romans et al., 2011). Gender differences in mental disorder prevalence are also evident in the general population. Women appear to have higher prevalence rates of anxiety-related disorders than men (Breslau, 2002; McLean et al., 2011; Salk et al., 2017); therefore, higher prevalence among women police officers may reflect more broad risk factors among women in general. For example, women in the general population are at heightened risk of exposure to childhood trauma and sexual assault, leading to increased risk of mental disorder symptom development (e.g. Tolin and Foa, 2006).
Understanding demographic risk for mental disorder symptoms in PSP may be helpful in efforts to mitigate OSIs. For example, if female police officers are at higher risk for mental disorders than male police officers, proactive mental health programmes could be tailored to address aforementioned mental disorder risk factors that may be specific to female police (e.g. systemic vulnerability, minority group status); however, identifying risk for developing a mental disorder based on demographic characteristics may be a spurious strategy and risks further stigmatizing minority groups like female police officers (Ménard and Arter, 2014). Modifiable, contextual and personal factors (e.g. work environment and coping strategies) may better explain police officers’ occupational stress and mental health status than static demographic factors (e.g. sex or gender; He et al., 2005) and may be more feasible as targets for proactive mental health programmes.
Anxiety sensitivity (AS) and intolerance of uncertainty (IU) are two fairly stable, yet modifiable cognitive risk factors for mental disorders evidenced in the general population. AS is the fear of anxiety symptoms (e.g. racing heart) due to the belief that symptoms are dangerous and harmful (e.g. feeling fearful of changes in heart rate because it may mean you are having a heart attack; Reiss and McNally, 1985). IU is the inability to tolerate the experience of uncertainty and can be expressed as worry about uncertain future events, as well as behavioural responses to uncertainty (i.e. avoidance; Carleton, 2016; Mahoney and McEvoy, 2012). AS and IU both appear to be specific risk factors associated with anxiety and mood symptoms for different mental disorders, including PTSD, MDD, PD, SAD and GAD (e.g. Boelen et al., 2016; Carleton et al., 2012; Hong and Cheung, 2015; Maller and Reiss, 1992; Schmidt et al., 2006; Taylor et al., 1992). In addition, AS and IU can both be reduced through cognitive and behavioural interventions that focus on addressing thoughts and behaviours related to uncertainty and overestimation of the dangerousness of physical anxiety symptoms (e.g. Dugas and Robichaud, 2007; Smits et al., 2008; Van Der Heiden et al., 2012), as well as targeted exercise strategies (e.g. LeBouthillier and Asmundson, 2017); accordingly, AS and IU are potentially viable targets for proactive mental health programmes designed for police officers.
The current study was designed to assess the contribution of self-reported cognitive risk factors to self-reported symptoms of anxiety-related disorders (e.g. PTSD, MDD, PD, SAD, GAD) in a sample of police officers, while controlling for known demographic risk factors. Understanding the relative contribution of demographic (i.e. sex, marital status, education, years of service) and cognitive risk factors (i.e. IU and AS) for anxiety-related disorders has the potential to guide the development of proactive mental health programmes designed for policing populations. Demographic differences in self-reported symptoms of PTSD, PD, SAD, MDD, GAD, AS and IU were examined, and the contribution of demographic and cognitive risk factors (IU and AS) to anxiety-related disorders were compared. We hypothesized that AS and IU would explain more variance in police officers’ self-reported mental disorder symptoms than demographic risk factors.
Method
Participants and procedure
Data for the current study were collected as part of a large-scale study of Canadian PSP including, but not limited to, communications officials (e.g. 911 operators, dispactchers), firefighters, paramedics, and police officers. Participants completed an online survey in English or French between 1 September 2016 and 31 January 2017. Recruitment of Canadian PSP included email invitations from advocacy organizations, provincial and municipal public safety organizations and the Public Safety Steering Committee (PSSC) of the Canadian Institute for Public Safety Research and Treatment (CIPSRT). Further information on participant recruitment and data collection methods is available elsewhere (Carleton et al., 2018a). Participants indicated their consent to participate electronically by checking an informed consent box before beginning the online survey. The study was approved by the Institutional Research Ethics Board at the University of Regina.
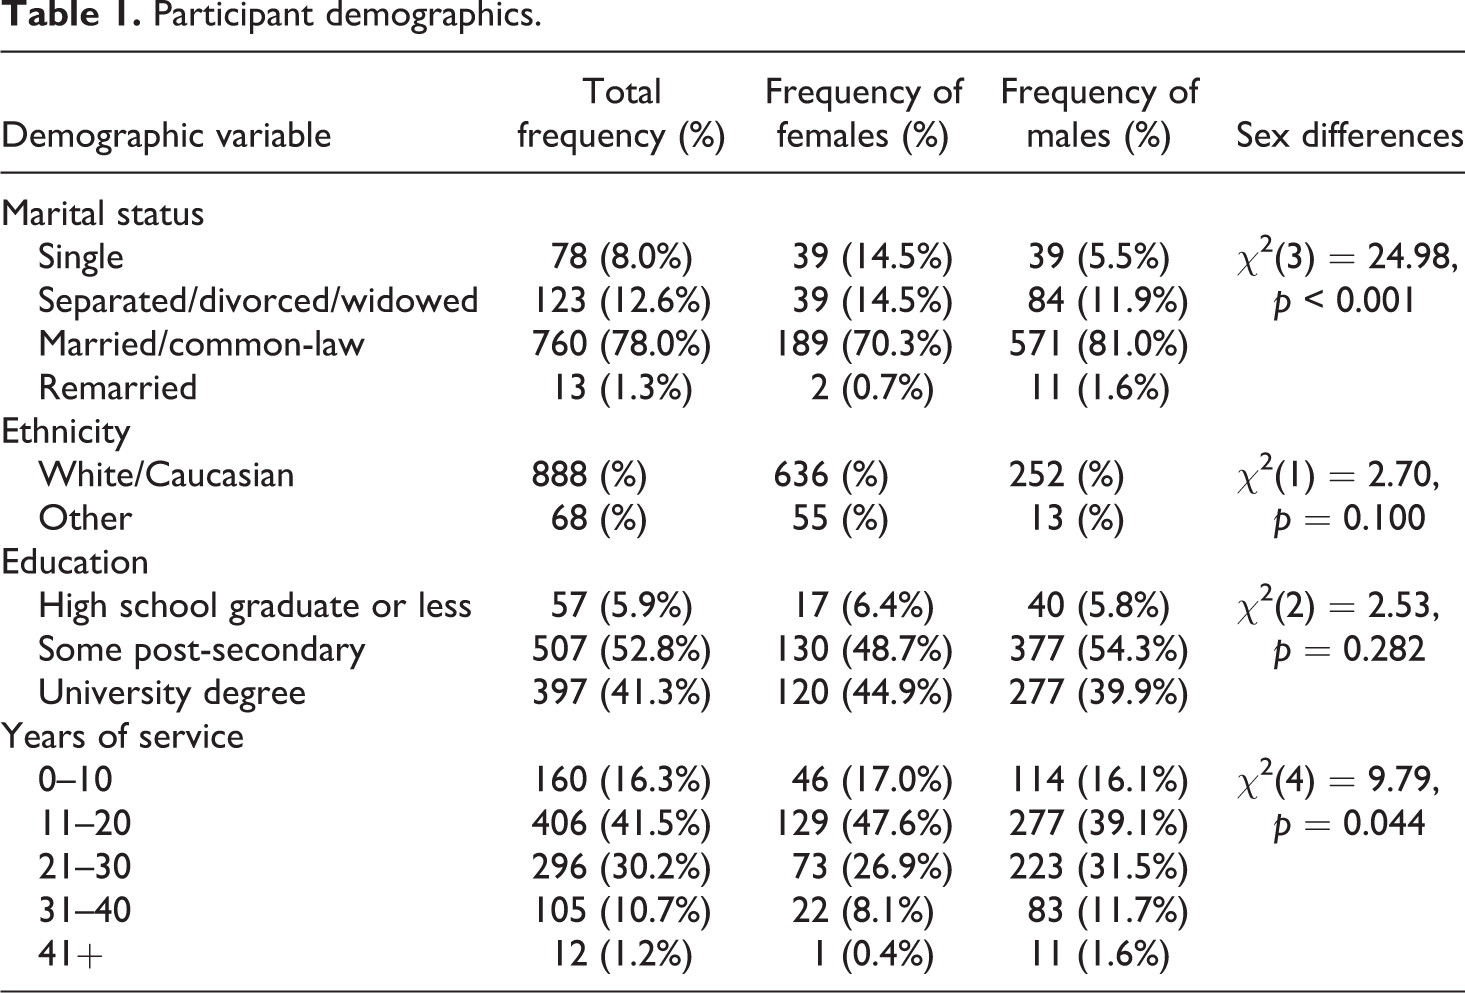
In total, 1882 individuals (1379 males; 503 females) began the survey, answered at least the first question, and identified themselves as municipal or provincial police officers. Participants were excluded from the current analyses if they did not answer all the relevant sections (see ‘Measures’ section). As a result, the final sample for the current analyses was 979 individuals (708 males; 271 females). Participants reported a mean age of 32.59 (SD = 7.95) and a mean of 19.64 (SD = 8.87) years of PSP service. Most participants reported their ethnicity as ‘White’ (92.6%), being married or in a common-law relationship (78%), working for 11 to 20 years (41.5%) and completing some post-secondary level education (52.8%; Table 1). Due to small sample sizes in some ethnicity groups, results were grouped and reported as ‘Other’ (see Table 1) to protect participant confidentiality and anonymity in smaller sample size groups.
Participant demographics.
Measures
Anxiety Sensitivity Index-3
The Anxiety Sensitivity Index-3 (ASI-3; Taylor et al., 2007) assesses fear of anxiety symptoms based on the belief that these symptoms may have harmful consequences (e.g. ‘When my stomach is upset, I worry that I might be seriously ill’). Participants rate 18 items on a 5-point Likert-type scale ranging from 0 (agree very little) to 4 (agree very much). Factor analyses have supported a three-factor structure for the ASI-3 (i.e. somatic, cognitive and social fears), but only the total score was used in the current study. Research supports and recommends the use of the ASI-3 total score when researching AS as a broad construct (Broman-Fulks et al., 2008; Taylor et al., 2007). Scores can range from 0 to 72, with higher scores indicating higher levels of AS. The ASI-3 has demonstrated good criterion, convergent and divergent validity (Taylor et al., 2007). Internal consistency of the ASI-3 for the current study was α = 0.92.
Intolerance of Uncertainty Scale–12 Item Version
The Intolerance of Uncertainty Scale–12 Item Version (IUS-12; Carleton et al., 2007) is a 12-item self-report measure of responses to uncertainty, ambiguous situations and the future (e.g. ‘I can’t stand being taken by surprise’). Items are rated on a 5-point Likert-type scale ranging from 1 (not at all characteristic of me) to 5 (entirely characteristic of me). Factor analyses indicate that the measure assesses two dimensions of IU and can provide subscale scores, but only the total score was used in the current study. Total scores can range from 12 to 60, with higher scores indicating higher levels of IU. The IUS-12 has demonstrated good convergent and discriminant validity, as well as internal consistency (α = 0.85; Carleton et al., 2007). Internal consistency of the IUS-12 for the current study was α = 0.92.
Generalized Anxiety Disorder Scale–7 Item Version
The Generalized Anxiety Disorder Scale–7 Item Version (GAD-7; Spitzer et al., 2006) is a brief 7-item self-report measure of anxiety and worry (e.g. ‘Feeling nervous, anxious or on edge’). Using a Likert-type scale from 0 (not at all) to 3 (nearly every day), participants rate how often they were bothered by different anxiety symptoms in the past 2 weeks. Total scores can range from 0 to 21, with scores of 0–4 indicating minimal anxiety, 5–9 indicating mild anxiety, 10–14 indicating moderate anxiety and 15–21 indicating representing severe anxiety. The GAD-7 has demonstrated good criterion validity and reliability (Spitzer et al., 2006). Internal consistency of the GAD-7 for the current study was α = 0.93.
Patient Health Questionnaire–9 Item Version
The Patient Health Questionnaire–9 Item Version (PHQ-9; Kroenke et al., 2001) is a 9-item self-report measure of depressive symptoms in the past two weeks (e.g. ‘Feeling down, depressed, or hopeless’). Participants use a Likert-type scale from 0 (not at all) to 3 (nearly every day) to rate how often they were bothered by different depressive symptoms. Total scores can range from 0 to 27, with scores of 10–14 indicating moderate depressive symptoms, 15–19 indicating moderately severe symptoms and 20–27 indicating severe symptoms of depression. The PHQ-9 has strong criterion validity and test–retest reliability (Kroenke et al., 2010). Internal consistency of the PHQ-9 for the current study was α = 0.91.
Panic Disorder Severity Scale
The Panic Disorder Severity Scale (PDSS; Shear et al., 1997) is a brief 7-item measure of PD symptoms (e.g. ‘During the past week, were there any activities that you avoided or felt afraid of, because they caused physical sensations like those you feel during panic attacks?’). Participants rate each item on a Likert-type scale from 0 (none) to 4 (extreme). Total scores can range from 0 to 28, with scores higher than 14 often indicating marked distress as a result of panic symptoms. The self-report version of the PDSS employed in the current study has good convergent validity and test–retest reliability (Houck et al., 2002). Internal consistency of the PDSS for the current study was α = 0.93.
PTSD Checklist for DSM-5
The PTSD Checklist for DSM-5 (PCL-5; Weathers et al., 2013) is a 20-item self-report measure of past-month PTSD symptoms. Participants rate how much they were bothered by different symptoms of PTSD on a Likert-type scale from 0 (not at all) to 4 (extremely). Scores can range from 0 to 80, with scores of 33–36 often used as cut-off scores indicating symptoms consistent with a diagnosis of PTSD. Psychometric evaluations of the PCL-5 suggest it is a valid and reliable measure of PTSD symptoms in both English and French (Ashbaugh et al., 2016; Blevins et al., 2015). The PCL-5 has high internal consistency (α = 0.94) and good test retest reliability (r = 0.82; Blevins et al., 2015). Internal consistency of the PCL-5 for the current study was α = 0.96.
Social Interaction Phobia Scale
The Social Interaction Phobia Scale (SIPS; Carleton et al., 2009) is a 14-item self-report measure of social anxiety symptoms (e.g. ‘When mixing socially I am uncomfortable’). Participants are instructed to rate each item on a 5-point Likert-type scale from 0 (not at all characteristic of me) to 4 (extremely characteristic of me). The SIPS can be used to obtain three subscale scores indicative of different social anxiety symptom dimensions; but, only the total score was evaluated in the current study. Total scores can range from 0 to 56, with a score of 21 often used to identify those with clinically significant levels of social distress. Evaluations of the psychometric properties of English and French versions of the SIPS support its convergent and divergent validity (Duranceau et al., 2014; Reilly et al., 2012). Internal consistency of the SIPS for the current study was α = 0.94.
Demographic variables
Participants were asked to identify the PSP category they felt best described their current occupation. Only those who identified as municipal or provincial police were included in the current analyses, as some demographic risk factors (i.e. sex) explored in the current study were only previously evidenced in the same data set as statistically significant among municipal and provincial police officers, but not among RCMP (Carleton et al., 2018a). Participants were asked to provide details about their demographics including sex, education level, marital status and years of service. Demographic variables were grouped based on previous research using the same data set to provide consistency and allow for general comparisons to research looking at more broad participant groups (i.e. all PSP; Carleton et al., 2018a). Table 1 displays the frequencies and percentages of participant demographics, as well as χ 2 test results of comparisons between males and females.
Statistical analyses
Multivariate analysis of variance (MANOVA) was used to assess for group differences in mental disorder symptom scores (i.e. total scores for the GAD-7, PHQ-9, PDSS, PCL-5, SIPS) and cognitive risk factor scores (i.e. total scores for the IUS-12 and ASI-3) based on demographic variables (i.e. sex, education, marital status and years of service). The MANOVA used a 2 (Sex: 1 = male; 2 = female) × 3 (Education: 1 = high school graduate or less; 2 = some post-secondary; 3 = university degree) × 4 (Marital Status: 1 = single; 2 = separated/divorced/widowed; 3 = married/common-law; 4 = remarried) × 5 (Years of Service: 1 = 0–10 years; 2 = 11–20 years; 3 = 21–30 years; 4 = 31–40 years; 5 = 40+ years) model to assess for group differences. Demographic variables with significant main effects and/or interactions for mental disorder symptom scores were controlled for in the hierarchical multiple regression analyses. Hierarchical multiple regressions were used to assess the relationships between IUS-12 total scores, ASI-3 total scores and mental disorder symptom scores (i.e. total scores for the GAD-7, PHQ-9, PDSS, PCL-5, SIPS), after accounting for variance due to relevant demographic variables (i.e. variables with significant main effects and/or interactions in the MANOVA). Demographic variables were entered into step 1 of the regression models, and IUS-12 and ASI-3 total scores were entered into step 2 of the models. Unstandardized beta-weights were reported for the results section and corresponding tables. Analyses were bootstrapped using 1000 samples to provide robust probability estimates.
Results
Multivariate analysis of variance
Descriptive statistics for mental disorder symptoms and cognitive risk factors are presented in Table 2. MANOVA was used to assess for main effects of demographic variables (i.e. sex, education, marital status and years of service) on mental disorder symptom scores (i.e. total scores for the PCL-5, PDSS, SIPS, PHQ-9 and GAD-7) and cognitive risk factor scores (i.e. IUS-12 and ASI-3 total scores). Box’s test of equality of covariance matrices was significant, as well as Levene’s test of equality of error variances for all dependent variables. Homogeneity tests of variance are sensitive to large data files, as is the case with the present analysis, but a corrected model of between-subject effects was used to address these violations.
Mental disorder symptom descriptive statistics by demographic grouping.
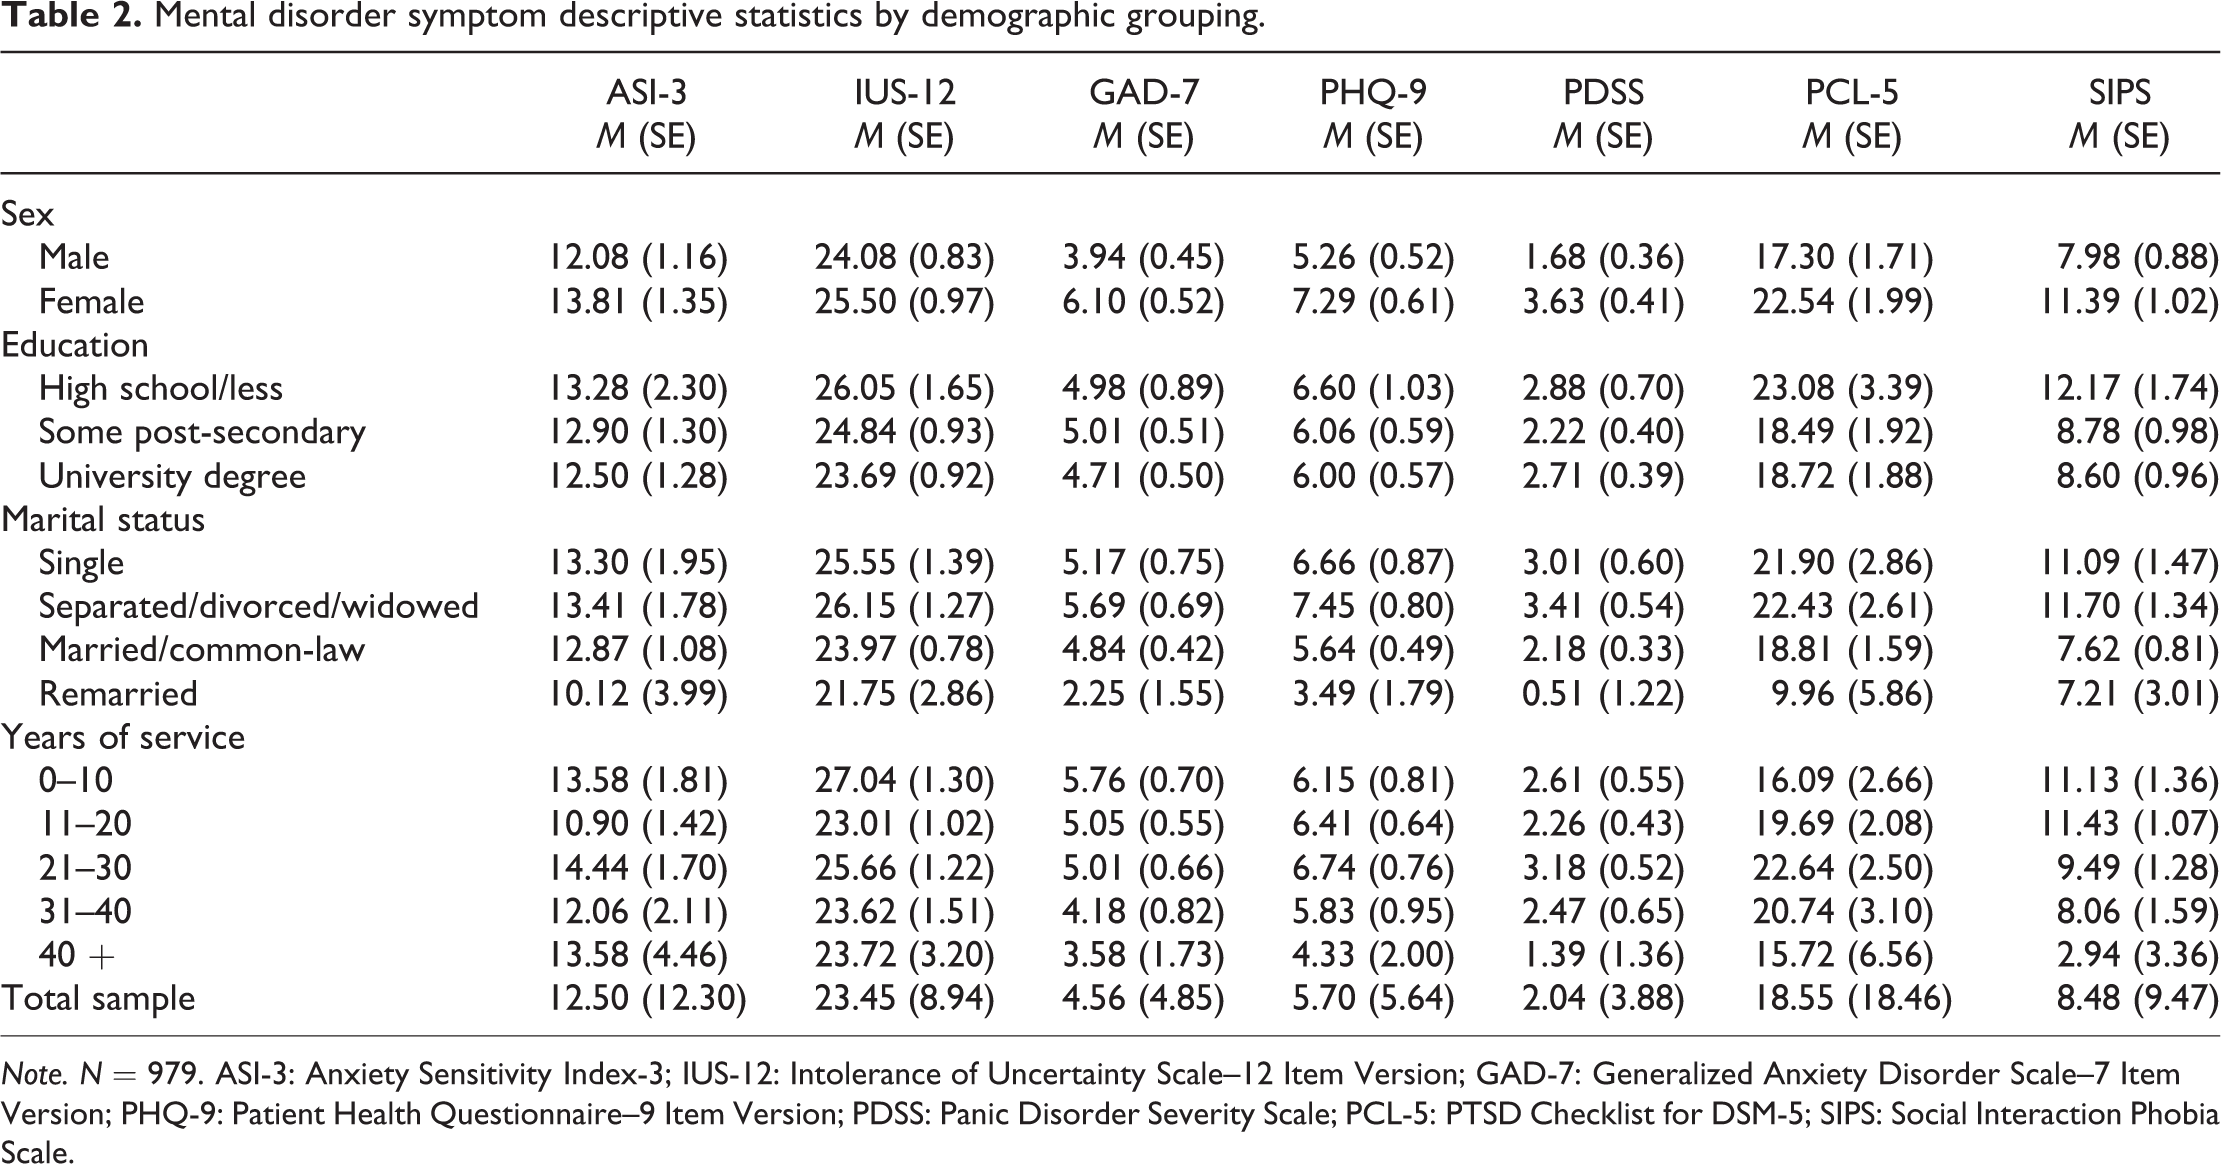
Note. N = 979. ASI-3: Anxiety Sensitivity Index-3; IUS-12: Intolerance of Uncertainty Scale–12 Item Version; GAD-7: Generalized Anxiety Disorder Scale–7 Item Version; PHQ-9: Patient Health Questionnaire–9 Item Version; PDSS: Panic Disorder Severity Scale; PCL-5: PTSD Checklist for DSM-5; SIPS: Social Interaction Phobia Scale.
There were no statistically significant main effects of sex for SIPS nor ASI-3 total scores (all ps ≥ 0.053). There were significant main effects of sex for PCL-5, GAD-7, PDSS, PHQ-9 and IUS-12 total scores (see Table 3). Females scored statistically significantly higher than males on the PCL-5 (M
diff = 5.24), GAD-7 (M
diff = 2.16), PDSS (M
diff = 1.94), PHQ-9 (M
diff = 2.03) and IUS-12 (M
diff = 1.42); however, the effect sizes were relatively small (
Multivariate analysis of variance results.
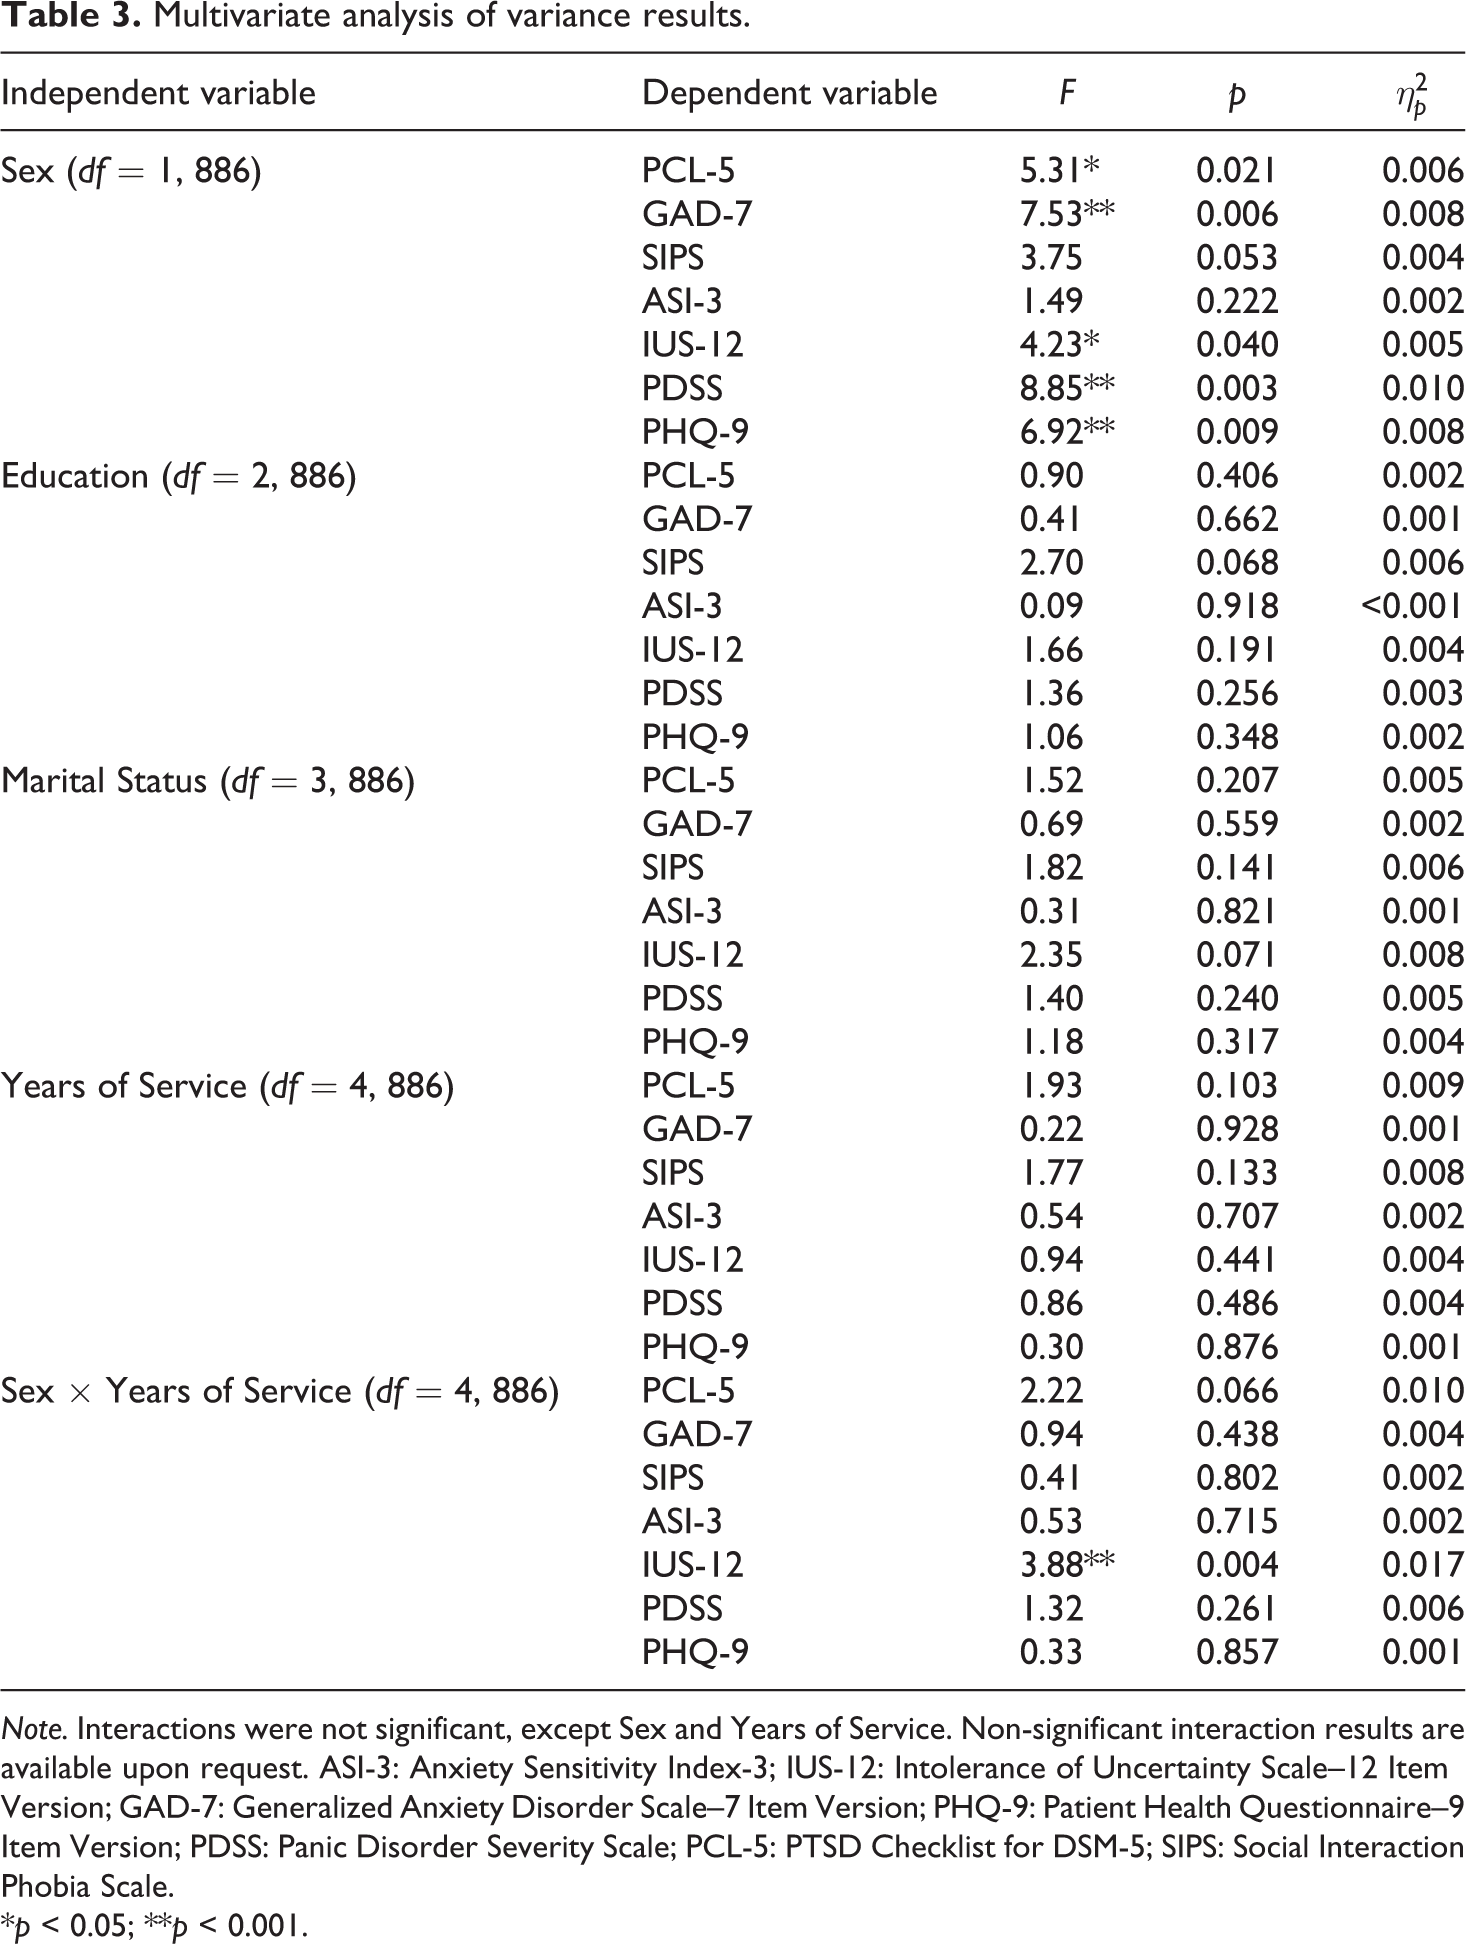
Note. Interactions were not significant, except Sex and Years of Service. Non-significant interaction results are available upon request. ASI-3: Anxiety Sensitivity Index-3; IUS-12: Intolerance of Uncertainty Scale–12 Item Version; GAD-7: Generalized Anxiety Disorder Scale–7 Item Version; PHQ-9: Patient Health Questionnaire–9 Item Version; PDSS: Panic Disorder Severity Scale; PCL-5: PTSD Checklist for DSM-5; SIPS: Social Interaction Phobia Scale.
*p < 0.05; **p < 0.001.
There were no statistically significant main effects of education, marital status, nor years of service for PCL-5, GAD-7, SIPS, PDSS, PHQ-9, ASI-3 and IUS-12 total scores (all ps ≥ 0.068). Furthermore, there were no significant interactions between demographic variables for mental disorder symptom scores nor ASI-3 scores (all ps ≥ 0.05), except for a statistically significant interaction of sex and years of service for IUS-12 total scores, F(4, 886) = 3.88, p = 0.004,
Hierarchical regression analyses
Hierarchical multiple regressions were used to assess the relationships between total scores for the IUS-12 and ASI-3, and mental disorder symptom scores (i.e. total scores for the GAD-7, PHQ-9, PDSS, PCL-5 and SIPS), after accounting for variance due to sex. Years of education, marital status and years of service were excluded from the hierarchical regression analyses due to absent significant main effects or interactions with mental disorder symptom scores. Sex accounted for a small proportion of variance in total scores for the GAD-7, PHQ-9, PDSS, PCL-5, and SIPS when entered into the first step of the hierarchical regression analyses (see Table 4). Total scores for the ASI-3 and IUS-12 accounted for a substantially greater proportion of variance in total scores for the GAD-7, PHQ-9, PDSS, PCL-5 and SIPS when entered in the second step in each analysis. Sex continued to account for a small proportion of variance in all final models predicting the mental disorders symptom scores, except PCL-5 and SIPS total scores.
Hierarchical regression models for mental disorder symptoms.
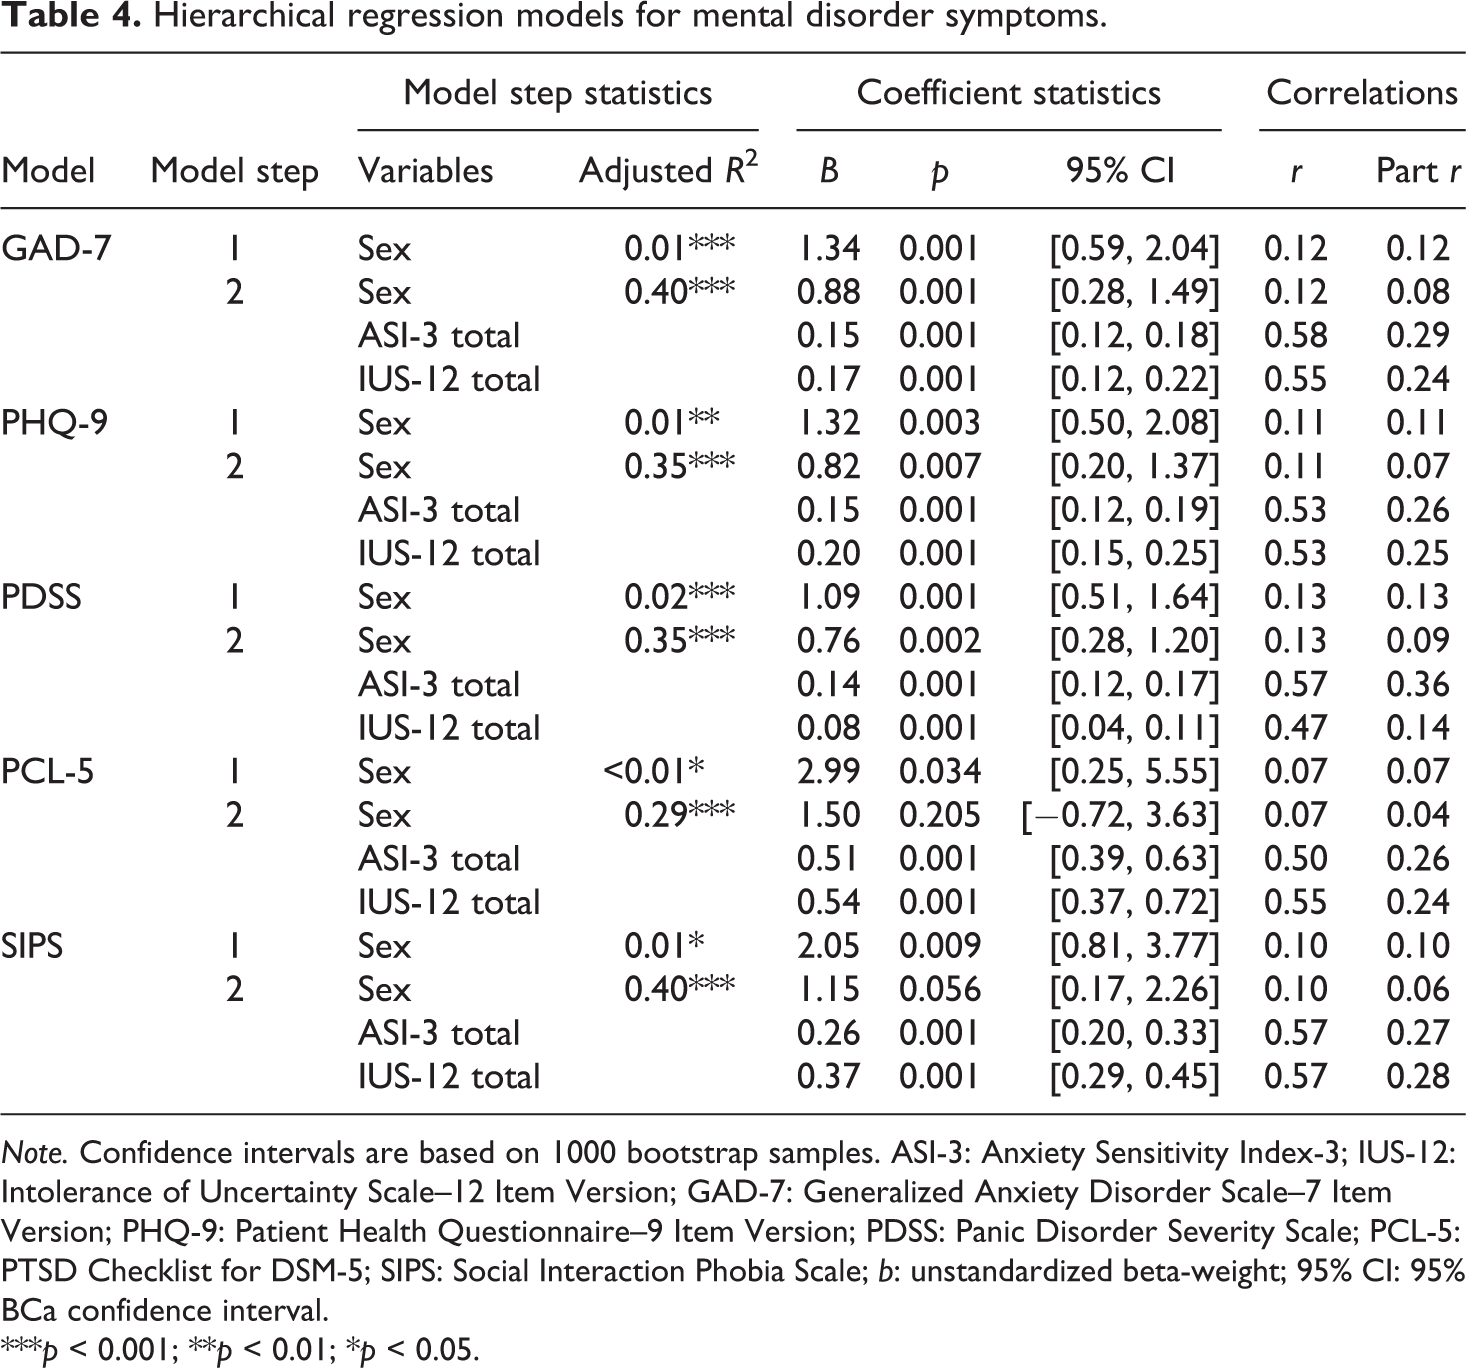
Note. Confidence intervals are based on 1000 bootstrap samples. ASI-3: Anxiety Sensitivity Index-3; IUS-12: Intolerance of Uncertainty Scale–12 Item Version; GAD-7: Generalized Anxiety Disorder Scale–7 Item Version; PHQ-9: Patient Health Questionnaire–9 Item Version; PDSS: Panic Disorder Severity Scale; PCL-5: PTSD Checklist for DSM-5; SIPS: Social Interaction Phobia Scale; b: unstandardized beta-weight; 95% CI: 95% BCa confidence interval.
***p < 0.001; **p < 0.01; *p < 0.05.
Discussion
The current study compared the relative contribution of cognitive risk factors (i.e. AS and IU) and demographic risk factors (i.e. sex, education, marital status, years of service; Carleton et al., 2018a) to Canadian police officers’ self-reported symptoms of PTSD, PD, SAD, MDD, and GAD. AS and IU were hypothesized to explain more variance in police officers’ reported symptoms than demographic risk factors. Initial analyses were conducted to test for significant effects of demographic risk factors on mental disorder symptoms. Carleton et al. (2018a) identified significant demographic risk factors across all PSP groups, wherein PSP who were female, unmarried, had less than a full university degree, and had more years of service had greater odds of screening positive for a mental disorder. Contrary to previous research (Carleton et al., 2018a), there were no statistically significant main effects of education, marital status, or number of years of service on police officers’ self-reported mental disorder symptoms. The inconsistency of demographic risk with previous research might be explained by potential differences in police officers’ occupational experiences compared to other PSP groups. In addition, the previously cited research examining demographic risk did not follow up demographic risk differences between PSP groups, aside from sex differences (Carleton et al., 2018a); therefore, the significant differences of marital status, education or number of years of service present across PSP groups may not be present within all PSP groups, such as the policing group. Future research should explore the possibility of different demographic risk based on specific PSP group and their respective occupational experiences by first examining main effects for demographic risk in different PSP groups, and then subsequently investigating various external factors related to work environment and occupational tasks for each PSP group. The absence of robust demographic differences among police may also be due to relatively smaller sample sizes in some of the aforementioned categories of demographic risk (i.e. unmarried PSP; PSP with less than a full university degree; and PSP with more years of service). Most police in the current sample were married or in a common-law relationship (78.0%), had some post-secondary education (52.8%) or a university degree (41.3%) and had fewer years of service (i.e. 41.5% had 11–20 years of service; 30.2% had 21–30 years of service); therefore, some categories may not appear to be significant demographic risk factors for police only because in the current sample there were fewer police in those demographic groups.
Carleton et al. (2018a) also found that female police officers screened positive across all mental disorders significantly more often than male police officers. Initial analyses using the same data set found significant sex differences in symptoms of PTSD, PD, MDD, and GAD, with female police officers scoring higher on these symptom measures. Since sex was the only statistically significant demographic risk factor identified for police, primary analyses were conducted to determine the relative contribution of sex and cognitive risk factors (i.e. AS and IU) to police mental disorder symptoms. In support of our hypothesis, AS and IU appeared to account for greater variance in all self-reported mental disorder symptoms than the variance accounted for by sex. The current results suggest that cognitive risk factors (i.e. AS and IU) for mental disorders evidenced in the general population (e.g. Carleton et al., 2012; Hong and Cheung, 2015; Schmidt et al., 2006) are also relevant for municipal and provincial police officers, are more likely to be associated with mental disorder symptoms than demographic risk factors such as sex, and might be viable targets for mental health programmes, pending prospective longitudinal research.
Important progress has been made regarding mental health training programmes, with new evidence providing initial cross-sectional support for potential benefits (Carleton et al., 2019b). For example, the R2MR programme may reduce mental disorder stigma by providing psychoeducation on mental health and stress, as well as stress-reduction skills (i.e. goal setting, mental rehearsal/visualization, arousal management; Carleton et al., 2018b, 2019b; National Defence and the Canadian Armed Forces, 2017). Mental health training programmes may be beneficial for improving mental health among police and other PSP by reducing stigma, promoting mental health resiliency and providing support to those in crisis (Carleton et al., 2018b). Recent research demonstrated that mental health training programmes were associated with small increases in willingness to access mental health support and modestly increased perceptions of access to support, as well as decreased odds of screening positive for PTSD, MDD, GAD and SAD (Carleton et al., 2019b). The current results suggest additional training protocol components, or supplementary mental health training programmes designed to reduce cognitive risk factors (e.g. AS and IU), may add value for sustaining and improving police mental health. For example, researchers can assess whether skills training protocols that focus on addressing IU and AS by challenging thoughts related to uncertainty and fears of anxiety, as well as changing behavioural patterns of avoiding uncertainty and anxiety sensations, can also reduce AS and IU (e.g. Dugas and Robichaud, 2007; Smits et al., 2008; Van Der Heiden et al., 2012), and therein symptoms for police. Future prospective longitudinal research might help to identify whether variables such as IU and/or AS might become effective early screening tools to help identify police recruits who might benefit from additional training; however, at present, such uses would be highly speculative.
Addressing mental health concerns with a proactive approach rather than with an intervention programme after a disorder is developed is a cost-efficient solution for mental disorder risk that can be utilized for those most at risk of developing mental disorder symptoms (Rutz et al., 1992). Female police officers scored higher on all mental disorder symptoms analysed in the current study, as well as IU. The apparent sex differences may be due to several factors. For example, there may be a reporting bias in the general population or among police that differentially impacts the current results, as implied by recent publications discussing stigma among PSP (Oliphant, 2016; Ricciardelli et al., 2018). In addition, in the general population, females appear to have higher prevalence rates of anxiety-related disorders compared to males (Breslau, 2002; McLean et al., 2011; Salk et al., 2017), so a higher prevalence rate among female police officers may reflect postulated mental disorder risk factors among females in the general population, such as: heightened exposure to sexual assault and childhood trauma, increased self-blame following a traumatic event, as well as pressures and expectations of gendered social and cultural norms in Western culture (McLean and Anderson, 2009; Piccinelli and Wilkinson, 2000; Tolin and Foa, 2006). In any case, additional research would be necessary to understand why female police officers appear to report higher rates and how to best mitigate mental disorder risk based on sex. Alternatively, efforts to address cognitive risk (i.e. AS and IU) may be effective and applicable to all trainees and officers, irrespective of sex, especially since cognitive risk appeared to contribute more overall to mental disorder symptoms than demographic factors (i.e. sex) in the current results.
Limitations
The current results contribute to the literature on cognitive risk factors for mental disorder symptoms among police officers using a large and diverse sample; however, there were limitations of the present study that provide directions for future research. First, participants were not required to meet diagnostic criteria for mental disorder symptoms, and the data were provided via voluntary self-report measures of symptoms; therefore, the results may not generalize to a clinical population or may be biased because of underreporting symptoms due to self-stigma of mental health concerns (e.g. Berger et al., 2012; Karaffa and Koch, 2016). Second, the current study was limited to a sample of Canadian police; however, the results may still be informative to international policing populations where mental disorder symptoms rates also appear higher when compared to the general population (Hartley et al., 2011; Lawson et al., 2012). In addition, research on the importance of AS and IU as mental disorder risk factors are not limited to Canadian samples (e.g. Boelen et al., 2016; Hong and Cheung, 2015; Maller and Reiss, 1992; Schmidt et al., 2006; Taylor et al., 1992). Third, the current study used a cross-sectional design (i.e. data collected at one time-point rather than over time), which limits interpretation of the results regarding the potential causal relationship between AS and IU and mental disorder symptoms. To address these limitations, future studies should use a longitudinal design and investigate symptoms in clinical and international policing populations. Finally, the current study specifically focused on internal cognitive risk factors among police officers even though other vulnerability factors likely contribute to mental disorder symptoms for this group. Future research should investigate external risk factors, such as health behaviours, sleep, perceived support and perceived stress, that may also contribute to mental disorder symptoms amongst police officers.
Conclusions
Results from the current study supported the hypothesis that cognitive risk factors, such as AS and IU, explain more variance in reported mental disorder symptoms than variance due to potentially relevant demographic risk factors (i.e. sex). Sex differences accounted for statistically significant variance in symptoms of PD, MDD, and GAD, but, overall, AS and IU accounted for more variance in all self-reported symptoms of mental disorder (i.e. PD, MDD, GAD, PTSD, SAD). The current results highlight the importance of cognitive risk factors in mental disorder symptoms among police officers, which can guide proactive efforts for anxiety and related disorders. Future researchers may build off of the current results by investigating cognitive risk factors longitudinally in clinical and international samples, by comparing demographic risk factors of police and other PSP groups, and by incorporating measures of external risk factors (i.e. health behaviours, sleep, perceived support and perceived stress) to further inform proactive mental health initiatives.
Footnotes
Acknowledgments
The authors thank for recruitment support provided by (alphabetically): Badge of Life Canada, Behind the Red Serge, Canadian Association for Police Governance (CAPG), Canadian Association of Chiefs of Police (CACP), Canadian Association of Fire Chiefs (CAFC), Canadian Institute for Military and Veteran Health Research (CIMVHR), Canadian Ministry of Public Safety and Emergency Preparedness, Canadian Police Association (CPA), Community Safety Knowledge Alliance, Correctional Service of Canada (CSC), Families of the RCMP for PTSD Awareness, First Responder Mental Health Network Collaboration, International Association of Firefighters (IAFF), Justice Institute of British Columbia, Mood Disorders Society of Canada, Nova Scotia Operational Stress Injury Clinic – Capital Health, Paramedic Association of Canada (PAC), Paramedic Chiefs of Canada (PCC), Royal Canadian Mounted Police (RCMP), Tema Conter Trust, Union of Safety and Justice Employees (USJE), Union of Canadian Correctional Officers Syndicat des Agents Correctionnels du Canada Confédération des Syndicats Nationaux, and Wounded Warriors Canada.
Declaration of conflicting interests
The author(s) declared no potential conflicts of interest with respect to the research, authorship, and/or publication of this article.
Funding
The author(s) disclosed receipt of the following financial support for the research, authorship, and/or publication of this article: R Nicholas Carleton’s research is supported by the Canadian Institutes of Health Research (CIHR) through a New Investigator Award (FRN: 285489) and a Catalyst Grant (FRN: 162545). This research was also funded in part by the Ministry of Public Safety and Emergency Preparedness through the Policy Development Contribution Program.