
Abstract
Keywords
Introduction
Motor Quality in Williams Syndrome
Williams syndrome (WS) is a rare neurodevelopmental condition caused by the deletion of approximately 26–28 genes on chromosome 7q11.23 (Kozel et al., 2021). It is characterised by a unique cognitive profile and significant motor impairments, which have been linked to genetic and neurobiological differences (e.g., Osorio et al., 2014; Reiss et al., 2000). Recent research consistently demonstrates that individuals with WS face difficulties in both gross and fine motor skills (e.g., Tsai et al., 2008), including delayed motor milestones (e.g., Carrasco et al., 2005; Farran et al., 2019; Mayall et al., 2021), poor balance (Mayall et al., 2021), coordination difficulties (Hocking et al., 2011; Udwin et al., 1988), impaired motor planning (Elliott et al., 2006; Hocking et al., 2008), and gait abnormalities (Hocking et al., 2009). These differences in motor development are suggested to be related to structural and functional abnormalities in brain regions including the cerebellum, basal ganglia, and parietal region, all of which are crucial for motor control and coordination (e.g., Atkinson et al., 1997; D’Souza et al., 2017; D’Souza et al., 2020; Eckert et al., 2005; Hoshi et al., 2005; Reiss et al., 2003). These motor difficulties persist throughout the lives of people with WS and can negatively impact their daily functioning and quality of life (e.g., Mayall et al., 2023; Nordstrom et al., 2013).
Locomotion, the ability to move the body forward while maintaining balance (Winter, 1991), is an area of potential motor difficulty in WS (e.g., Hocking et al., 2010). Despite the importance of independent locomotion for efficient daily life functioning, this area of motor development is less researched in infants and toddlers with WS. Factors such as poor posture, muscle hypotonia (low muscle tone), and limited joint movement, which are common features of WS (Barozzi et al., 2013; Carrasco et al., 2005; Hocking et al., 2010; Morris et al., 1990), could contribute to a less efficient walking pattern in these children. Studies that have investigated the specifics of walking abilities in older children and adults with WS suggest the presence of atypical motor features such as reduced stride length, slower walking speed, reduced stability, and an increased base of support, characterised by a stride with wider distance between the feet (Cowie et al., 2012; Hocking et al., 2009, 2010; Ito et al., 2020). These gait patterns are suggested to reflect compensatory strategies that individuals with WS use to maintain balance in an upright posture (Hocking et al., 2008). In addition, postural balance and control in WS are often compromised (e.g., Barozzi et al., 2013; Mayall et al., 2021), potentially leading to an increased risk of falls (Bigelow, 2008) and further hindering locomotion.
Taking a broader view of neurodevelopmental conditions, emerging research suggests that a better understanding of motor impairment in the early stages of development has the potential to help us understand not only how motor skills unfold, but also the downstream impact of poor motor abilities on other areas of development (e.g., Bruyneel et al., 2019; Campos et al., 2000; Iverson & Goldin-Meadow, 2005). Motor difficulties are commonly observed as secondary features across a range of neurodevelopmental conditions, including autism (Gowen & Hamilton, 2013), attention-deficit/hyperactivity disorder (Sugden et al., 2008), and developmental coordination disorder (Zwicker et al., 2012). Notably, motor difficulties often manifest earlier than cognitive or behavioural characteristics, positioning the motor domain as a source of potential early indicators of neural vulnerability and atypical development (Levit-Binnun et al., 2013). Therefore, investigating early motor patterns and atypicalities may be critical for understanding and predicting developmental trajectories more broadly. This, in turn, can contribute to designing and introducing targeted and timely interventions that could potentially improve outcomes in the motor domain and other related areas.
Gait Characteristics in Typical Development
The ability to walk from one place to another is a fundamental skill required in daily life (Pratt, 1994). It relies on the complex interaction between the central nervous system and the body’s muscles, the outcome of which is stable, organised and balanced movement (Joffe, 1992). Studying the patterns of human walking (also referred to as gait patterns), and particularly the exploration of symmetry and asymmetry of movement, is important for advancing our understanding of human locomotion. By analysing gait patterns, researchers can gain insights into the biomechanics of walking, the efficiency of movement, and the underlying neural control mechanisms (e.g., Giladi et al., 2013). This understanding is important for enhancing our knowledge of what constitutes typical locomotion and identifying and treating atypical gait patterns.
Patterns of gait symmetry and asymmetry have been a subject of interest in locomotion research, with both forms shown to offer distinct functional advantages under different circumstances. Gait symmetry—typically defined as the absence of significant bilateral differences in variables such as arm or leg positioning during walking (e.g., Gundersen et al., 1989; Sadeghi et al., 2000)—has traditionally been associated with efficient locomotion. Symmetrical movement is thought to contribute to stability, rhythmic consistency, and optimal energy use, facilitating smoother and more sustainable walking patterns (Chou et al., 1995; DeVita et al., 1991; Donelan et al., 2001; Roemmich et al., 2019). By distributing mechanical forces evenly across the body, symmetrical gait may reduce the burden on muscles and joints (e.g., Roemmich et al., 2019; Zarrugh et al., 1974), enhance postural stability (Gottschall & Kram, 2005; Long & Srinivasan, 2013; Selinger et al., 2015), and minimise the need for corrective movements as well as the risk of falls. Consistent bilateral actions also support a regular cadence, which can further promote energy efficiency and coordination (e.g., Chruscik et al., 2021).
However, perfect symmetry in gait is rare and not necessarily indicative of optimal function. A growing body of evidence suggests that asymmetries in gait are common even in neurotypical individuals and may reflect adaptive strategies rather than dysfunction (e.g., Ankarali et al., 2015; Sadeghi et al., 2000). Variability in gait symmetry can arise from a range of factors, including limb dominance, anatomical differences, and environmental influences such as uneven surfaces (e.g., Boonstra et al., 2014; Lauzière et al., 2014; Sadeghi et al., 1997). Additionally, functional asymmetries may emerge as each limb assumes specialised roles during walking—one contributing more to propulsion, while the other prioritises support or balance (e.g., Sadeghi et al., 2001). In some contexts, asymmetrical gait can be advantageous, for example, when it serves to reduce energy costs (Roemmich et al., 2019).
Consequently, the historical view of asymmetry as inherently pathological is shifting. It is increasingly recognised that gait asymmetry can be part of the normal variation in motor behaviour (e.g., Cioni et al., 1993; Goble et al., 2003; Roemmich et al., 2019). Nonetheless, in individuals with neurological or musculoskeletal conditions, asymmetries may become more pronounced, leading to inefficiencies, heightened injury risk, and reduced mobility (e.g., Ankarali et al., 2015; Emck et al., 2009; Maki, 1997; Menz et al., 2003; Zwicker et al., 2012). Understanding the interplay between symmetry and asymmetry in walking, particularly in neurodevelopmental conditions with motor difficulties such as WS, is therefore essential. Such insights can inform the design of targeted interventions and support strategies for populations at increased risk for lifelong motor difficulties.
Gait Asymmetry in Neurodevelopmental Conditions
There is currently limited research examining gait symmetry in individuals with neurodevelopmental conditions. Studies of motor difficulties in conditions such as Autism, Developmental Coordination Disorder (DCD), Down syndrome (DS), cerebral palsy, and other neurodevelopmental conditions consistently report motor deficits including atypical gait patterns, as well as impairments in balance and coordination (Block, 1991; Cowie et al., 2012; Latash & Anson, 1996; Patterson et al., 2022; Rivlis et al., 2011; Sumner et al., 2016). For instance, autistic children may exhibit gait asymmetry, along with slower walking speeds, shorter step lengths, and unusual postures of the legs and arms during movement (Esposito et al., 2011; Esposito & Venuti, 2008; Jansiewicz et al., 2006; Minshew et al., 2004; Ozonoff et al., 2008; Patterson et al., 2022). Research suggests that these motor challenges may be linked to neurological differences, such as atypical cerebellar development (Hallett et al., 1993), and disrupted brain connectivity (Hadders-Algra, 2000; Marrus et al., 2018).
Early studies, like those by Teitelbaum et al. (1998; 2004), proposed that motor disturbances, including gait asymmetry, could be present from birth in children later diagnosed with autism. To investigate these early motor abnormalities, Teitelbaum et al. (2004) developed the Eshkol–Wachman Movement Notation (EWMN), a system based on the assumption of a general structural model applicable across all body types. Within this framework, each limb is represented as a straight, fixed-length line—an “axis”—serving as a simplified depiction of the skeletal structure. Building on this framework, Esposito et al. (2011) developed the Positional Pattern for Symmetry during Walking (PPSW), which takes into account the natural degrees of freedom in arm movement while walking, and estimates the proportion of arm symmetry. To study gait differences in early development, Esposito and Venuti (2008) also developed the Walking Observation Scale (WOS), an 11-item scale designed to assess gait across three dimensions: foot movements (F), arm movements (A), and overall body movements (M) (see Table 2). The purpose of the scale is to provide a tool that allows the early assessment of movement atypicalities, which could be crucial for early identification and diagnosis of autism and potentially other movement disturbances (Esposito & Venuti, 2008). To our knowledge, this is the only available scale that allows the remote and retrospective study of children’s early walking patterns from home-recorded videos. Considering the rarity of WS and the use of an international sample, the WOS was adopted in the current study as the most appropriate tool available for studying gait characteristics in this population.
Although efforts to replicate Teitelbaum’s findings have yielded mixed results (Esposito & Venuti, 2008, 2009, 2011; Ozonoff et al., 2008; Patterson et al., 2022), gait asymmetry remains a potential early marker of motor variability that could help distinguish typical from atypical gait patterns. For example, using the PPSW and WOS, Esposito and colleagues (2008; 2009; 2011) found that asymmetrical supine movements in infants and uneven gait in early walking stages might serve as early indicators of autism. Therefore, examining the symmetry and other atypicalities of movement, including walking, could be a key factor in identifying and characterising atypical developmental pathways during early childhood.
The Current Study
Currently, there is a lack of research exploring whether atypical gait patterns are present in toddlers and younger children with WS. The current study addressed this question by analysing early unsupported walking of children with and without Williams Syndrome from home videos taken within a month of walking onset, focusing on the symmetry of movement in children’s walking and potential gait disturbances.
Similar to other neurodevelopmental conditions such as autism, it was hypothesised that the first unsupported walking (measured within a month of walking onset) of children with WS would be characterised by significantly different motor quality, as measured by gait characteristics (Walking Observation Scale, WOS, Esposito & Venuti, 2008)
Method
Participants
Participants were part of a larger longitudinal study exploring early motor development and the onset of motor milestones in children with Williams Syndrome (WS) and neurotypical (NT) children. Parents and caregivers of children with WS aged 0 to 84 months were recruited from the Williams Syndrome Foundation (UK), Williams Syndrome Association (USA), Williams Syndrome Australia, the Canadian Association for Williams Syndrome, the European Federation of Williams Syndrome and on social media pages dedicated to WS. Video data were collected from 21 families whose children with WS started walking before or during the longitudinal study. To compare WS with neurotypical development, a control group of NT children who started walking during the longitudinal study were recruited through social media and snowball sampling. A total of 24 participants provided video data of their NT children’s first independent walking. Power estimations for the planned analyses were conducted using G*Power 3.1 (Faul et al., 2007) with power = 0.80 and alpha = 0.05. Based on these calculations, it was determined that each group (WS and NT children) required a minimum of 51 participants. However, due to the rarity of WS, despite 19 months of recruitment via international channels, the achieved sample size did not reach this number. Despite being underpowered, relative to other projects on early development in WS, this is one of the larger studies conducted with infants and toddlers with WS. Considering the small sample size, a sensitivity power analysis was conducted in G*Power 3.1 (Faul et al., 2007) with power = 0.80 and alpha = 0.05 to identify the smallest effect size that can be detected as significant (Lakens, 2022). Results indicated that for H1, the minimum detectible effect size is d = 0.26 (a small to medium effect; Cohen, 1988) and for H2, the minimum detectible effect size is d = 0.77 (a medium to large effect; Cohen, 1988).
After screening the video data for eligibility (see preregistered inclusion/exclusion criteria at https://osf.io/tehar/overview?view_only=6308977b5318480094c270cee24fd6d3), three videos of children with WS and one video of a NT child were excluded from the analysis of gait characteristics (H1), leaving a sample size of 23 NT children and 18 WS children. For the analysis of gait symmetry (H2), one participant was excluded from the WS group, leaving a sample size of 24 NT videos and 20 WS videos eligible for analysis. For each of the hypotheses, the exclusion of videos was based on poor or no visibility of the arms and/or feet for H1, and arms for H2.
Demographic Information and Vineland-3 Standard Scores for Williams Syndrome (WS) and Neurotypical (NT) Children
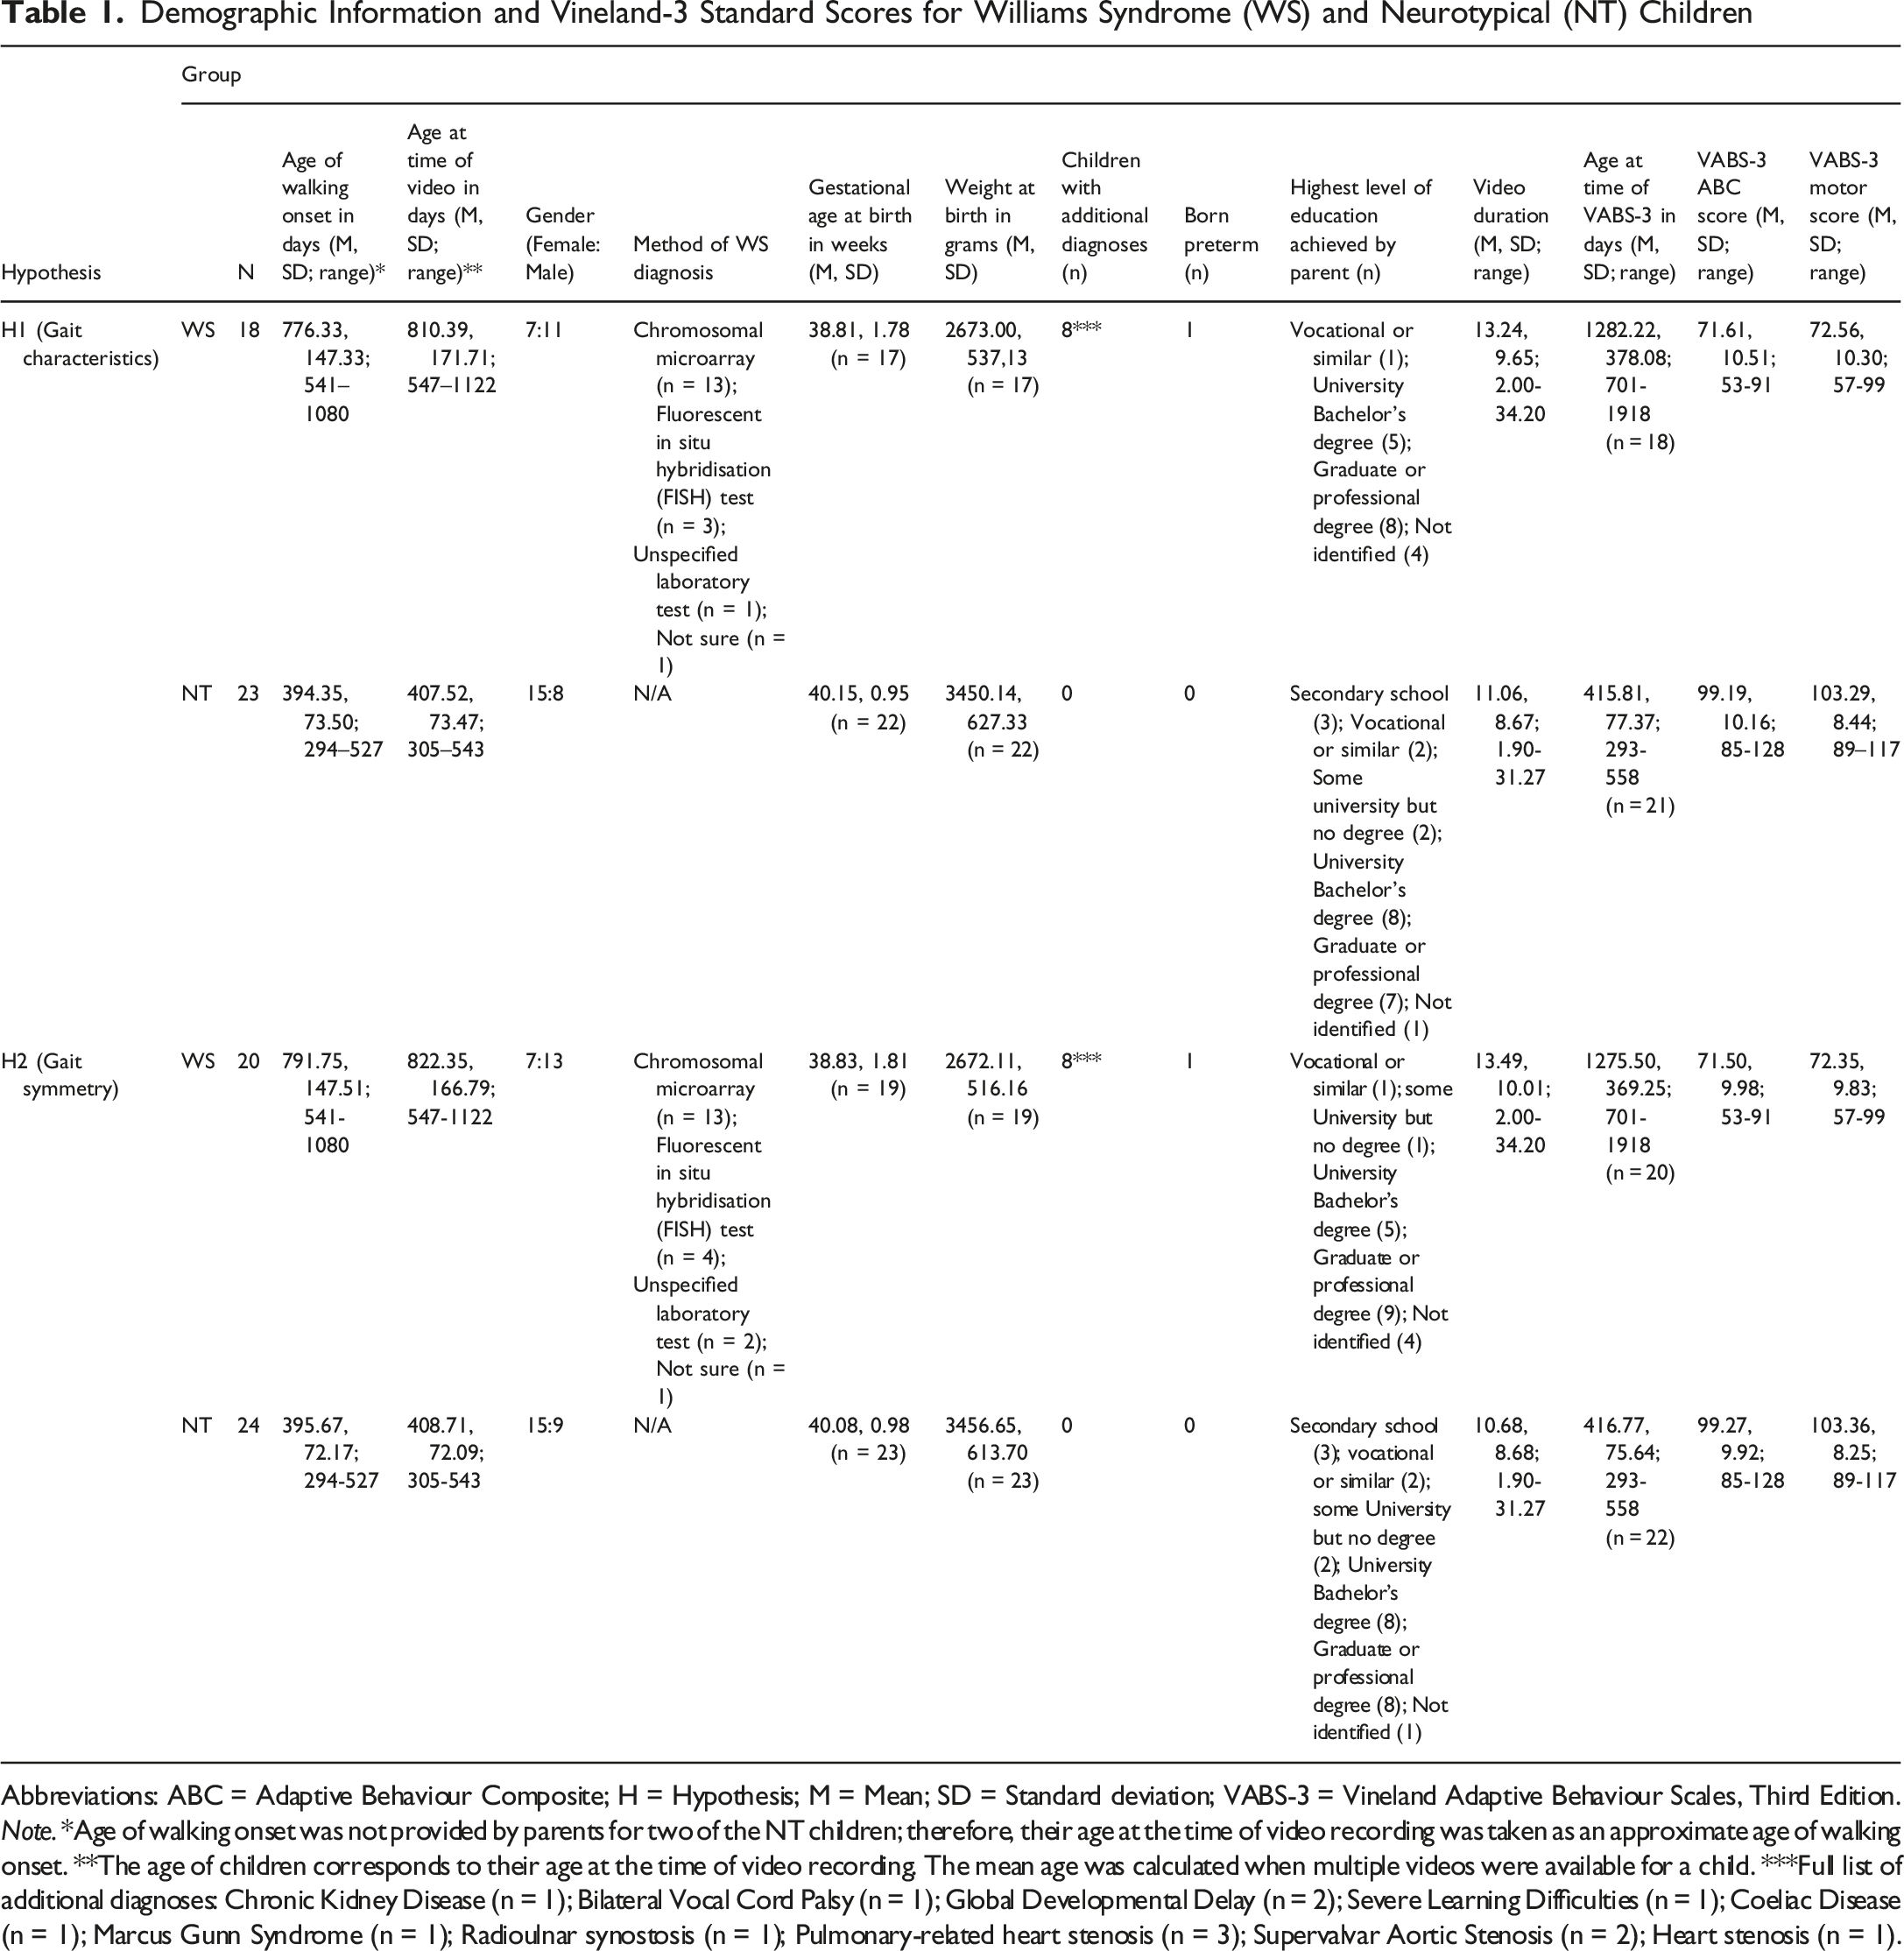
Abbreviations: ABC = Adaptive Behaviour Composite; H = Hypothesis; M = Mean; SD = Standard deviation; VABS-3 = Vineland Adaptive Behaviour Scales, Third Edition.
Note. *Age of walking onset was not provided by parents for two of the NT children; therefore, their age at the time of video recording was taken as an approximate age of walking onset. **The age of children corresponds to their age at the time of video recording. The mean age was calculated when multiple videos were available for a child. ***Full list of additional diagnoses: Chronic Kidney Disease (n = 1); Bilateral Vocal Cord Palsy (n = 1); Global Developmental Delay (n = 2); Severe Learning Difficulties (n = 1); Coeliac Disease (n = 1); Marcus Gunn Syndrome (n = 1); Radioulnar synostosis (n = 1); Pulmonary-related heart stenosis (n = 3); Supervalvar Aortic Stenosis (n = 2); Heart stenosis (n = 1).
Design and Procedure
Videos of First Independent Walking
Parents and carers provided home-recorded videos of children walking independently (defined as: taking steps without holding onto objects or other people for support; Wijnhoven et al., for the WHO Multicentre Growth Reference Study Group, 2004). To standardise the videos, participants were provided with a list of instructions on how to record their child’s walking (see pre-registered project materials at https://osf.io/tehar/overview?view_only=6308977b5318480094c270cee24fd6d3. Parents were instructed to use a smartphone or a digital camera to record their child walking indoors. Parents/carers were required to stand in front of the child so the whole body of the child was visible in the video. Parents were also asked to record children walking with their hands free, rather than holding or carrying objects, which could potentially impact their balance (e.g., Adolph & Avolio, 2000). Participants were instructed to send at least 30 seconds of video footage, and they had the opportunity to do this by uploading one long video or multiple shorter videos. There was no upper limit on how long the video material could be. In reality, many videos were shorter than 30 seconds but were still of sufficient quality for inclusion in analyses as they met all other eligibility characteristics listed in the inclusion criteria.
Sixteen children with WS had already started walking at the time of their enrolment in the longitudinal study. Their parents were invited to share retrospective videos recorded within a month of their child’s walking onset. They were provided with the same instructions on how to record a video and were asked to provide video data that matched the requirements as closely as possible. As a result, sixteen retrospective videos were provided, one of which was excluded from analyses due to not meeting the requirements and the child’s arms and feet not being visible throughout the recording.
Five children with WS began walking while data collection was ongoing, adding to a total of 20 videos of children with WS, 18 of which met the inclusion criteria for analyses of gait characteristics (two were excluded due to children’s arms and feet not being fully visible during the video), and 20 videos were eligible for inclusion for analyses of gait symmetry.
In the control group of neurotypical children, once children began walking on their own, parents/carers were asked to provide a video recording taken within a month of their child’s first unassisted steps. Twenty-five videos of NT children were collected, one of which was excluded due to not meeting the requirements, and the child’s arms and feet not being visible throughout the recording. The final total of videos of NT children was 24.
Analyses
This study was pre-registered: https://doi.org/10.17605/OSF.IO/GWHD8.
The data generated and analysed in this study are publicly available at: https://osf.io/tehar/overview?view_only=6308977b5318480094c270cee24fd6d3.
Data Pre-processing
Prior to data analysis, each video was inspected in slow motion, and the parts of the recordings which did not meet the inclusion criteria (e.g., the whole child was not visible, or children were using surrounding objects to support themselves while walking) were cut from the video and deleted. For participants who had provided more than one video, segments of the separate recordings which were eligible for data analysis were combined into a single final video for further coding and analysis.
Gait Analysis During Walking
The Walking Observation Scale (WOS) Three Axes of Gait Analysis: Foot Movement, Arm Movement, and General Movement (Esposito & Venuti, 2008)
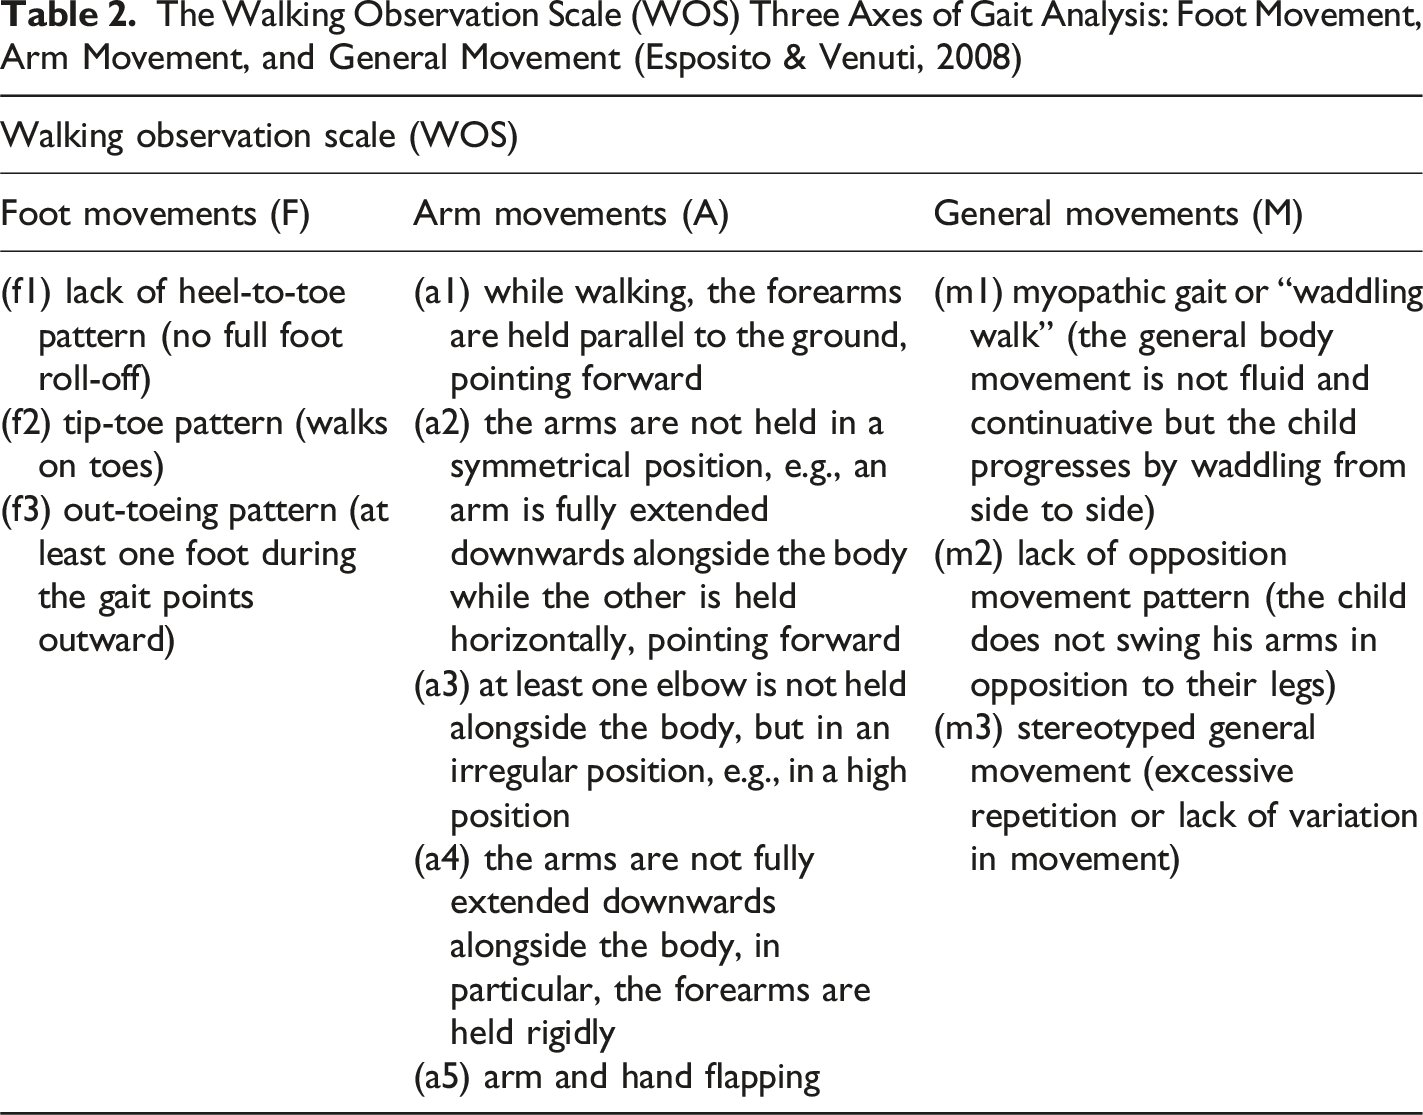
For the foot axis, three items characterising atypical movements were coded for; for the arm axis, there were five items and three items on the general movement axis were coded for. Therefore, for each frame of the videos, there was a code describing the pattern of foot movement, arm movement and general movement. Where none of the atypical movement patterns from the WOS were observed within a frame, there was no code assigned to it, which, within the context of the WOS, would indicate a typical pattern of movement.
Walking Observation Scale–Item and Axes Mean Proportions, for Williams Syndrome (WS) and Neurotypical (NT) Children
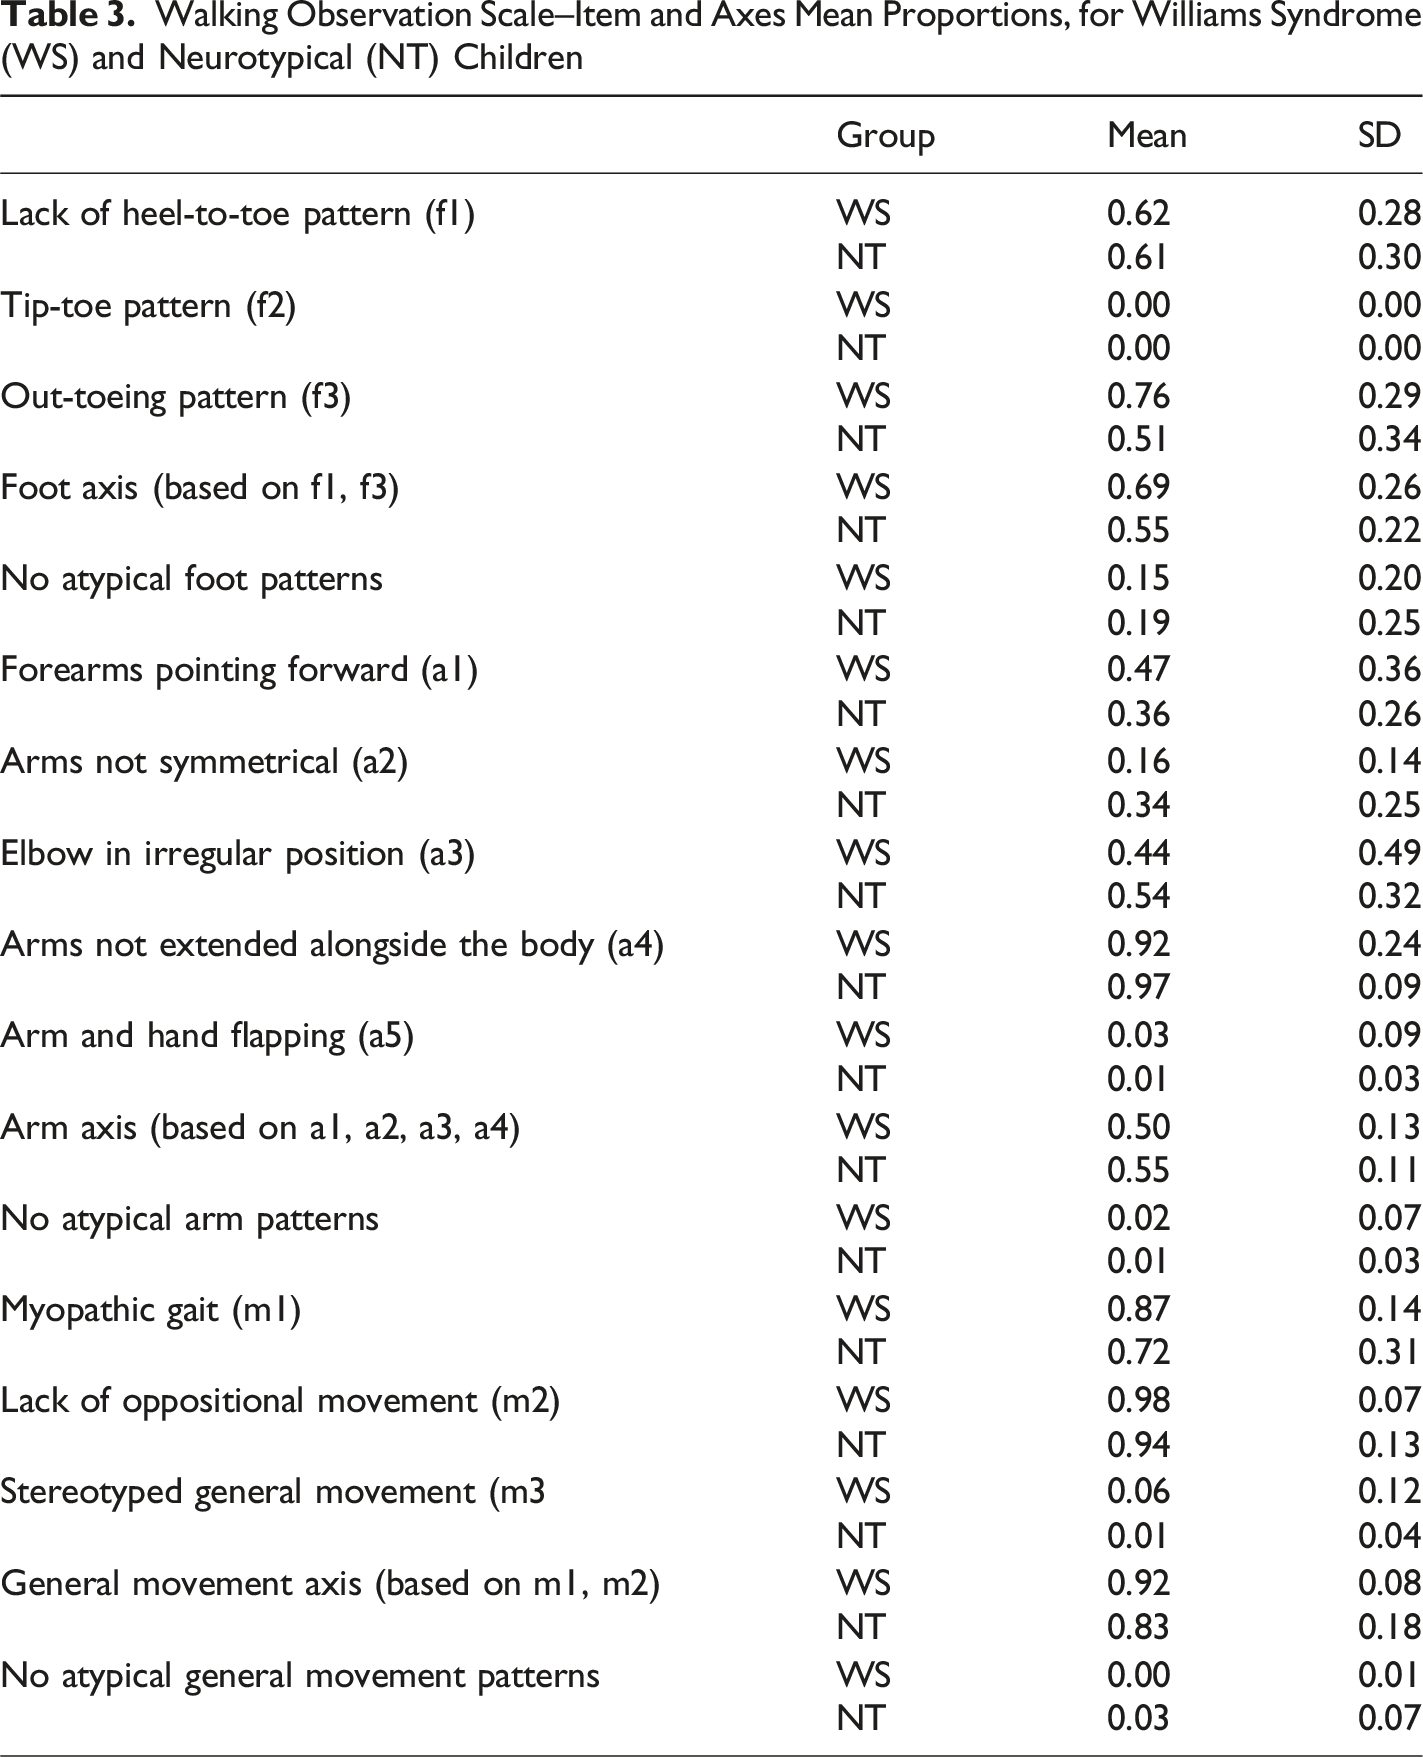
Due to a lack of variability, three items were excluded from further analyses. These included item F2 (tip-toe pattern), where none of the children in the WS or NT group performed this gait pattern; item A5 (arm and hand flapping), which was observed in only one NT child and two WS children; and item M3 (stereotyped general movement), which was observed in only one child with NT development and two children with WS. It is possible that these items were not common in the samples studied in this research, as they are more characteristic of movement patterns associated with autism (Esposito & Venuti, 2008).
To ensure consistency in the implementation of the coding scheme, a second researcher independently coded 20% of the data included in the analysis for each hypothesis. The Interclass Correlation Coefficient (ICC) was used to estimate the absolute agreement between the primary and secondary raters (Koo & Li, 2016). For the WOS, the ICC was calculated for each of the 11 items on the scale. The achieved inter-rater agreement was excellent, with ICC ranging from 0.97 to 0.99 (range of 95% CI from 0.87 to 0.99) across the items of the WOS.
Symmetry During Walking
The coding protocol was adapted from the Positional Pattern for Symmetry during Walking (PPSW, Esposito et al., 2011). The framework for the PPSW is the Eshkol–Wachman Movement Notation (EWMN, Teitelbaum et al., 2004), which conceptualises the human body by reducing each limb to a line of a fixed length, representing the main skeletal segments in a 2D image. When the corresponding limbs (e.g., both arms) are positioned similarly within 45° accuracy, the posture of the body is considered to be symmetrical (Esposito et al., 2011).
All videos were coded frame by frame (30 frames per second) against the 45-degree criteria for symmetry, where any frames with similar positioning of the arms (less than 45° difference) were coded as symmetrical, and frames where the arms were positioned with more than 45° difference were coded as asymmetrical. Using the Mangold INTERACT software, a total duration of symmetrical and non-symmetrical postures was estimated. These duration times were then used to calculate the proportion of time evidencing symmetry and non-symmetry out of the total time of coded video material for each child.
To ensure consistency in the implementation of the PPSW, 20% of the data were independently coded by a second researcher, and ICC was used to estimate the absolute agreement between raters. For the PPSW, the achieved ICC was 0.98, 95% CI [0.89, 0.99], indicating excellent inter-rater consistency (Koo & Li, 2016).
Data Analysis
The following analyses were conducted in line with the pre-registered hypotheses, variables and analysis plan for this research (https://doi.org/10.17605/OSF.IO/GWHD8).
Main Analyses
Data were largely not normally distributed for the WOS variables (p < .05) and there were some violations to the assumption of sphericity (p < .05) as well as violations to the assumption of homogeneity of variance (p < .05). Based on this, ANOVA and ANCOVA parametric analyses were still carried out due to their robustness to moderate violations of these assumptions (Field, 2016). Huynh-Feldt sphericity correction was used for the reporting of results where assumptions of sphericity were not met.
For the PPSW proportion of symmetry variable data were normally distributed (p > .05). The assumption of homogeneity of variance was violated (p < .001). Therefore, Welch’s t-test was selected as a more appropriate test, which does not assume equal variance between groups (Field, 2016). ANCOVA was carried out for exploratory analyses for the reasons stated above.
WOS
After the exclusion of the items F2, A5 and M3, the mean scores for each of the axes were calculated (see Table 3) with the remaining items and used for the following hypothesis testing. To determine relative performance within and between groups, across the axes comprising gait pattern - foot, arm, and general movement (measured by WOS) - 2 x 3 mixed ANOVA with a group (WS x NT) as a between factor and axis gait measures (Foot x Arm x General movement) as a within factor and axis mean proportion score as the dependent variable was carried out.
As part of an exploratory analysis, a mixed ANCOVA was carried out where children’s age at the time of video recording was entered as a covariate in the pre-planned 2x3 mixed ANOVA outlined above.
Finally, three exploratory ANOVAs were carried out to explore axis-specific differences across the groups. An ANOVA with foot axis item (F1 x F3) entered as the within-subject variable and group (NT x WS) as the between-subject variable was carried out to explore the proportion of atypical movement on these items across children.
A second exploratory ANOVA with arm axis items (A1 x A2 x A3 x A4) entered as the within-subject variable and group (NT x WS) as the between-subject variable was carried out.
Finally, an ANOVA with general movement axis item (M1 x M2) entered as the within-subject variable and group (NT x WS) as the between-subject variable was carried out.
PPSW
To estimate whether children with WS and NT toddlers differ significantly in the proportion of symmetry (i.e., the proportion of time symmetry was observed out of the total video duration) of the arms during walking (H2), an independent samples t-test was conducted.
As part of an exploratory analysis, an ANCOVA with group (NT x WS) entered as a fixed factor and children’s age in days at the time of video recording entered as a covariate was carried out to investigate whether age can account for differences in symmetry proportion (dependent variable) across children.
Deviations From the Preregistered Analysis Plan
Several deviations from the preregistered protocol were implemented and are documented in an updated preregistration record. First, although the preregistration specified the calculation of both static and dynamic symmetry from the PPSW, only static symmetry was derived. This change resulted from an update to the coding procedure, whereby videos were coded at 30 frames per second rather than the originally specified 4 or 8 frames per second (Esposito et al., 2011). While this higher precision allowed for more fine-grained and robust movement coding, it precluded application of the original procedure for estimating dynamic symmetry; consequently, the proportion of static symmetry was estimated using the 30-frames-per-second coding.
Second, upper-limb symmetry was operationalised using a 45-degree difference rule between the arms, rather than the predefined coding map of 20 symmetrical positions specified in the PPSW (Esposito et al., 2011). This modification was introduced to increase precision and to better capture the variability of naturalistic arm postures during early walking that may not be fully represented in the original coding map.
Exploratory Analyses
Exploratory analyses not specified in the original preregistered plan were conducted. First, the main group analyses of WOS and PPSW data were re-run as ANCOVAs with age as a covariate. Second, three ANOVAs were carried out to investigate each axis with within-axis items as a within-participant factor and group as the between-participant factor.
Results
Preliminary Analysis
Prior to data analysis, the average duration of videos in both groups (WS (n = 20) and NT (n = 24)) were compared to ensure that these did not differ significantly, and therefore neither of the groups was disadvantaged due to the length of video material available for analysis. One outlier was identified in the NT group whose video length exceeded the range of the remaining data. The duration for this video was reduced to match the longest available video in the WS group by cutting out a section from the start of the video where the child was the furthest away from the camera. As the duration of videos (measured in seconds and milliseconds) across the groups was not normally distributed (Shapiro-Wilk: W = 0.89, p = .001), a two-tailed Mann-Whitney U test was carried out. This indicated no significant difference in the duration of videos measured in seconds (U = 182.00, p = .52) between the groups (NT: Mdn = 8.40s, IQR = 11.66s; WS: Mdn = 11.52s, IQR = 14.02s).
The difference in the number of days between walking onset and the time of video recording was compared across the groups. As the data were not normally distributed (W = 0.78, p < .001), and the assumption of homogeneity of variance was violated (F (1, 42) = 10.19, p = .003), a Mann-Whitney U test was carried out. The results indicated no significant difference (U = 208.00, p = .46) in the number of days passed between walking onset and video recording between the groups (NT: Mdn = 10.50, IQR = 21.25; WS: Mdn = 22.00, IQR = 48.00).
WOS
A 2 x 3 mixed ANOVA with group (WS, NT) as the between factor and axis gait measure (Foot, Arm, General movement) as the within factor indicated no significant main effect of group on the proportion of atypical movements, F (1, 39) = 2.84, p = .10, η
p
2
= 0.07. There was a significant main effect of axis gait measure on children’s observed proportion of time of atypical movement, F (1.77, 69.21) = 48.01, p < .001, η
p
2
= 0.55. This is best explored within the context of the significant interaction between axis gait measure and group, F (1.77, 69.21) = 3.82, p = .031, η
p
2
= 0.09 (See Figure 1(A)). Mean and standard error of gait measure proportion scores per group. Note. The error bars represent standard error. (A) Significant interaction effect (p = =.031) between Group (WS x NT) and Gait measure (Foot x Arm x General movement); (B) Significant interaction effect (p = =.045) between Group (WS x NT) and Foot axis (F1 x F3); (C) Non-significant interaction effect (p = =.177) between Group (WS x NT) and Arm axis (A1 x A2 x A3 x A4); (D) Non-significant interaction effect (p = =.168) between Group (WS x NT) and General movement axis (M1 x M2). Abbreviations. A = Arm axis item; F = Foot axis item; M = General Movement axis item; NT = Neurotypical; WS = Williams Syndrome.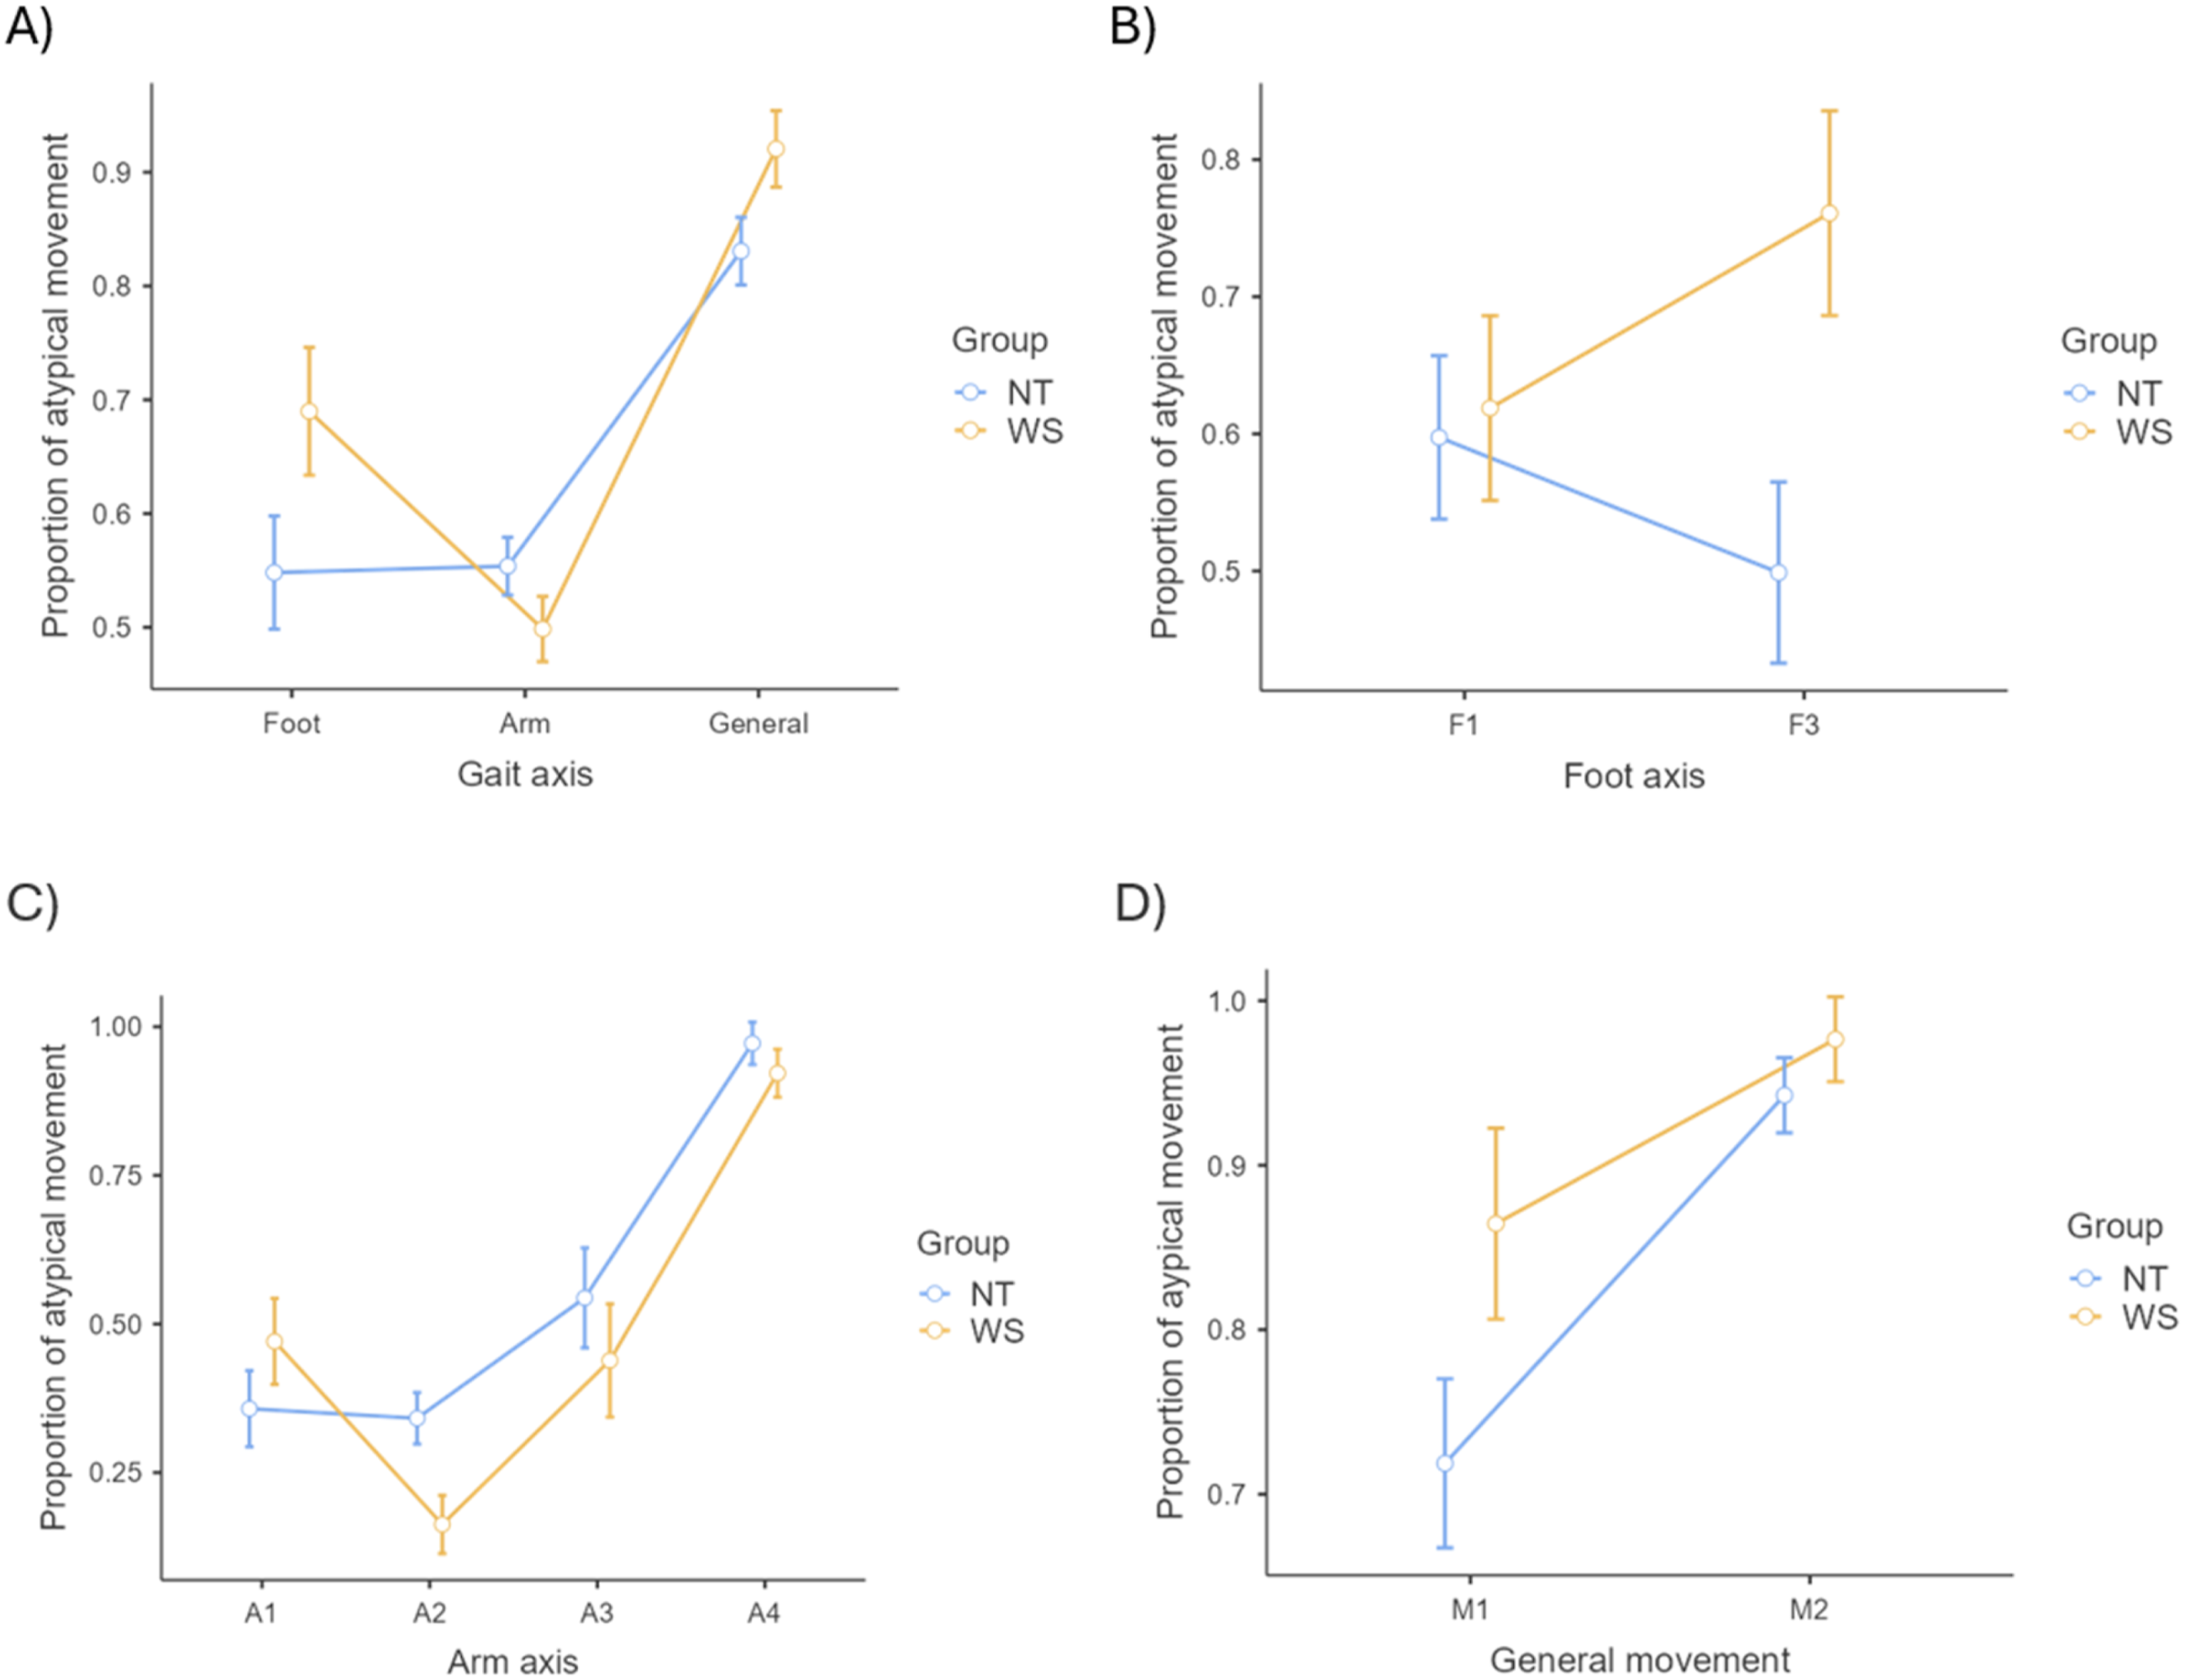
While the two groups did not perform significantly differently from each other on any of the gait measures (p > .05), one-way ANOVAs per group indicated that the source of the interaction was related to different profiles of gait disturbance for each group (WS: F (2, 34) = 21.94, p < .001, η p 2 = 0.56; NT: F (2, 44) = 29.20, p < .001, η p 2 = 0.57) (see Figure 1(A)). Tukey’s post-hoc tests suggested that in the NT group, there was a significantly lower proportion of atypical foot movement (M = 0.55, SE = 0.205) and arm movement (M = 0.55, SE = 002.) compared to atypical general movement (M = 0.83, SE = 0.04) (foot vs. general: t (22) = −7.53, p < .001; arm vs. general: t (22) = −6.40, p < .001) and no difference between atypical foot and arm movements (t (22) = −0.12, p = .99). A different profile of movement atypicalities across the axes was observed in the WS group. As in the NT group, atypical foot (M = 0.69, SE = 0.06) and atypical arm movements (M = 0.50, SE = 0.03) in the WS were significantly lower than atypical general movements (M = 0.92, SD = 0.02) (foot vs. general: t (17) = −3.27, p = .012; arm vs. general: t (17) = −11.84, p < .001). However, the WS group also evidenced a marginally lower proportion of atypical arm than atypical foot movements (t (17) = 2.48, p = .06).
In a follow-up exploratory analysis, children’s age (measured in days at the time of recording the videos) was entered as a covariate in a mixed ANCOVA. Although children with WS were on average older (M days = 810.39, SD = 171.72) than children in the NT group (M days = 407.522, SD = 73.47), age was not significantly associated with performance (F (1,38) = 0.06, p = .81, η p 2 = 0.002). The main effect of axis gait measure remained significant (F (1.73, 65.65) = 6.85, p = .003, η p 2 = 0.15) as did the interaction between axis gait measure and group (F (1.73, 65.65) = 5.01, p = .013, η p 2 = 0.12). As in the analysis above, this was due to different profiles of gait disturbance for each group. Tukey’s post-hoc test showed that the interaction effect was accounted for by a significant difference between atypical arm and foot movement in the WS group (t (38) = 3.08, p = .042) (foot>arm), but not in the NT group (t (38) = −1.16, p = .853). Therefore, the significant differences across the three gait axes observed within the groups and the different patterns of atypical movement across the groups could not be explained by children’s age differences.
Follow-up exploratory ANOVA with foot axis item (F1, F3) entered as the within-subject variable and group (WS, NT) as the between-subject variable, indicated no significant main effect of Foot axis item (F (1, 39) = 0.14, p = .71, η p 2 = 0.004), and no significant main effect of group (F (1, 39) = 3.57, p = .066, η p 2 = 0.08) on proportion of atypical foot movement. There was, however, a significant foot axis item by group interaction (F (1,39) = 4.28, p = .045, η p 2 = 0.11, see Figure 1(B)). Tukey post-hoc tests indicated that there was a marginally significant group difference on item F3 (out-toeing pattern) (t (39) = −2.63, p = .057), with children with WS performing on average more out-toeing while walking (M = 0.76, SD = 0.29) compared to NT children (M = 0.50, SD = 0.34). There was no significant difference on item F1 (lack of heel-to-toe pattern) between children with WS (M = 0.62, SD = 0.28) and the NT group (M = 0.60, SD = 0.29) (t (39) = −0.237, p = .995).
A further exploratory ANOVA analysis was carried out with arm axis item (A1, A2, A3, A4) entered as the within-subject variable and group (WS, NT) as the between-subject variable. There was a significant main effect of arm axis item on the proportion of atypical movement (F (2.44, 95.13) = 39.75, p < .001, η p 2 = 0.51). However, there was no significant main effect of group (F (1,39) = 2.08, p = .157, η p 2 = 0.05), and no significant group by arm axis item interaction (F (2.44, 95.13) = 1.72, p = .177, η p 2 = 0.04, see Figure 1(C)). Tukey post-hoc tests indicated that there was overall a significantly lower proportion of item A1 (forearms pointing forward while walking; M = 0.41, SE = 0.05) compared to item A4 (arms not fully extended downwards alongside the body, M = 0.95, SE = 0.03), (t (39) = −9.329, p < .001); significantly lower proportion on item A2 (arms not held in a symmetrical position, M = 0.25, SE = 0.03) compared to A4 (t (39) = −16.58, p < .001); and significantly lower proportion of item A3 (at least one elbow not held alongside the body, M = 0.49, SE = 0.06) compared to item A4 (t (39) = −5.66, p < .001). No other significant pairwise differences were observed (p > .05 for all).
A final exploratory ANOVA was carried out with the general movement axis item (M1, M2) entered as the within-subject variable and group (WS, NT) as the between-subject variable. The results indicated a significant main effect of general movement item (F (1,39) = 17.84, p < .001, η p 2 = 0.31; M1: M = 0.79, SE = 0.04 < M2: M = 0.96, SE = 0.02) and a marginally significant main effect of group (F (1,39) = 4.011, p = .052, η p 2 = 0.09) on proportions of atypical general movement. However, the interaction between general movement and group was not significant (F (1, 39) = 1.97, p = .168, η p 2 = 0.05, see Figure 1(D)).
PPSW
Welch’s t-test was carried out to estimate whether children with WS and NT toddlers differ significantly in the proportion of symmetry of the arms during walking (H2). The results showed that the difference in symmetry of the arms during walking between the groups was significant, t (33.09) = −2.94, p = .006, d = 0.86 (see Figure 2(A)), with the WS group having a significantly higher proportion of symmetry (M = 0.86, SD = 0.12) compared to NT children (M = 0.68, SD = 0.26). Mean and standard error of symmetry proportion of the arms per group before (A) and after; (B) controlling for age at the time of the video recording. Note. (A) A significant difference (p = =.006) in symmetry of the arms during walking between WS and NT children. (B) Non-significant main effect (p = =.059) of group (WS, NT) on symmetry proportion after children’s age in days at the time of the video recording was entered as a covariate.. Abbreviations. NT = =Neurotypical; WS = =Williams Syndrme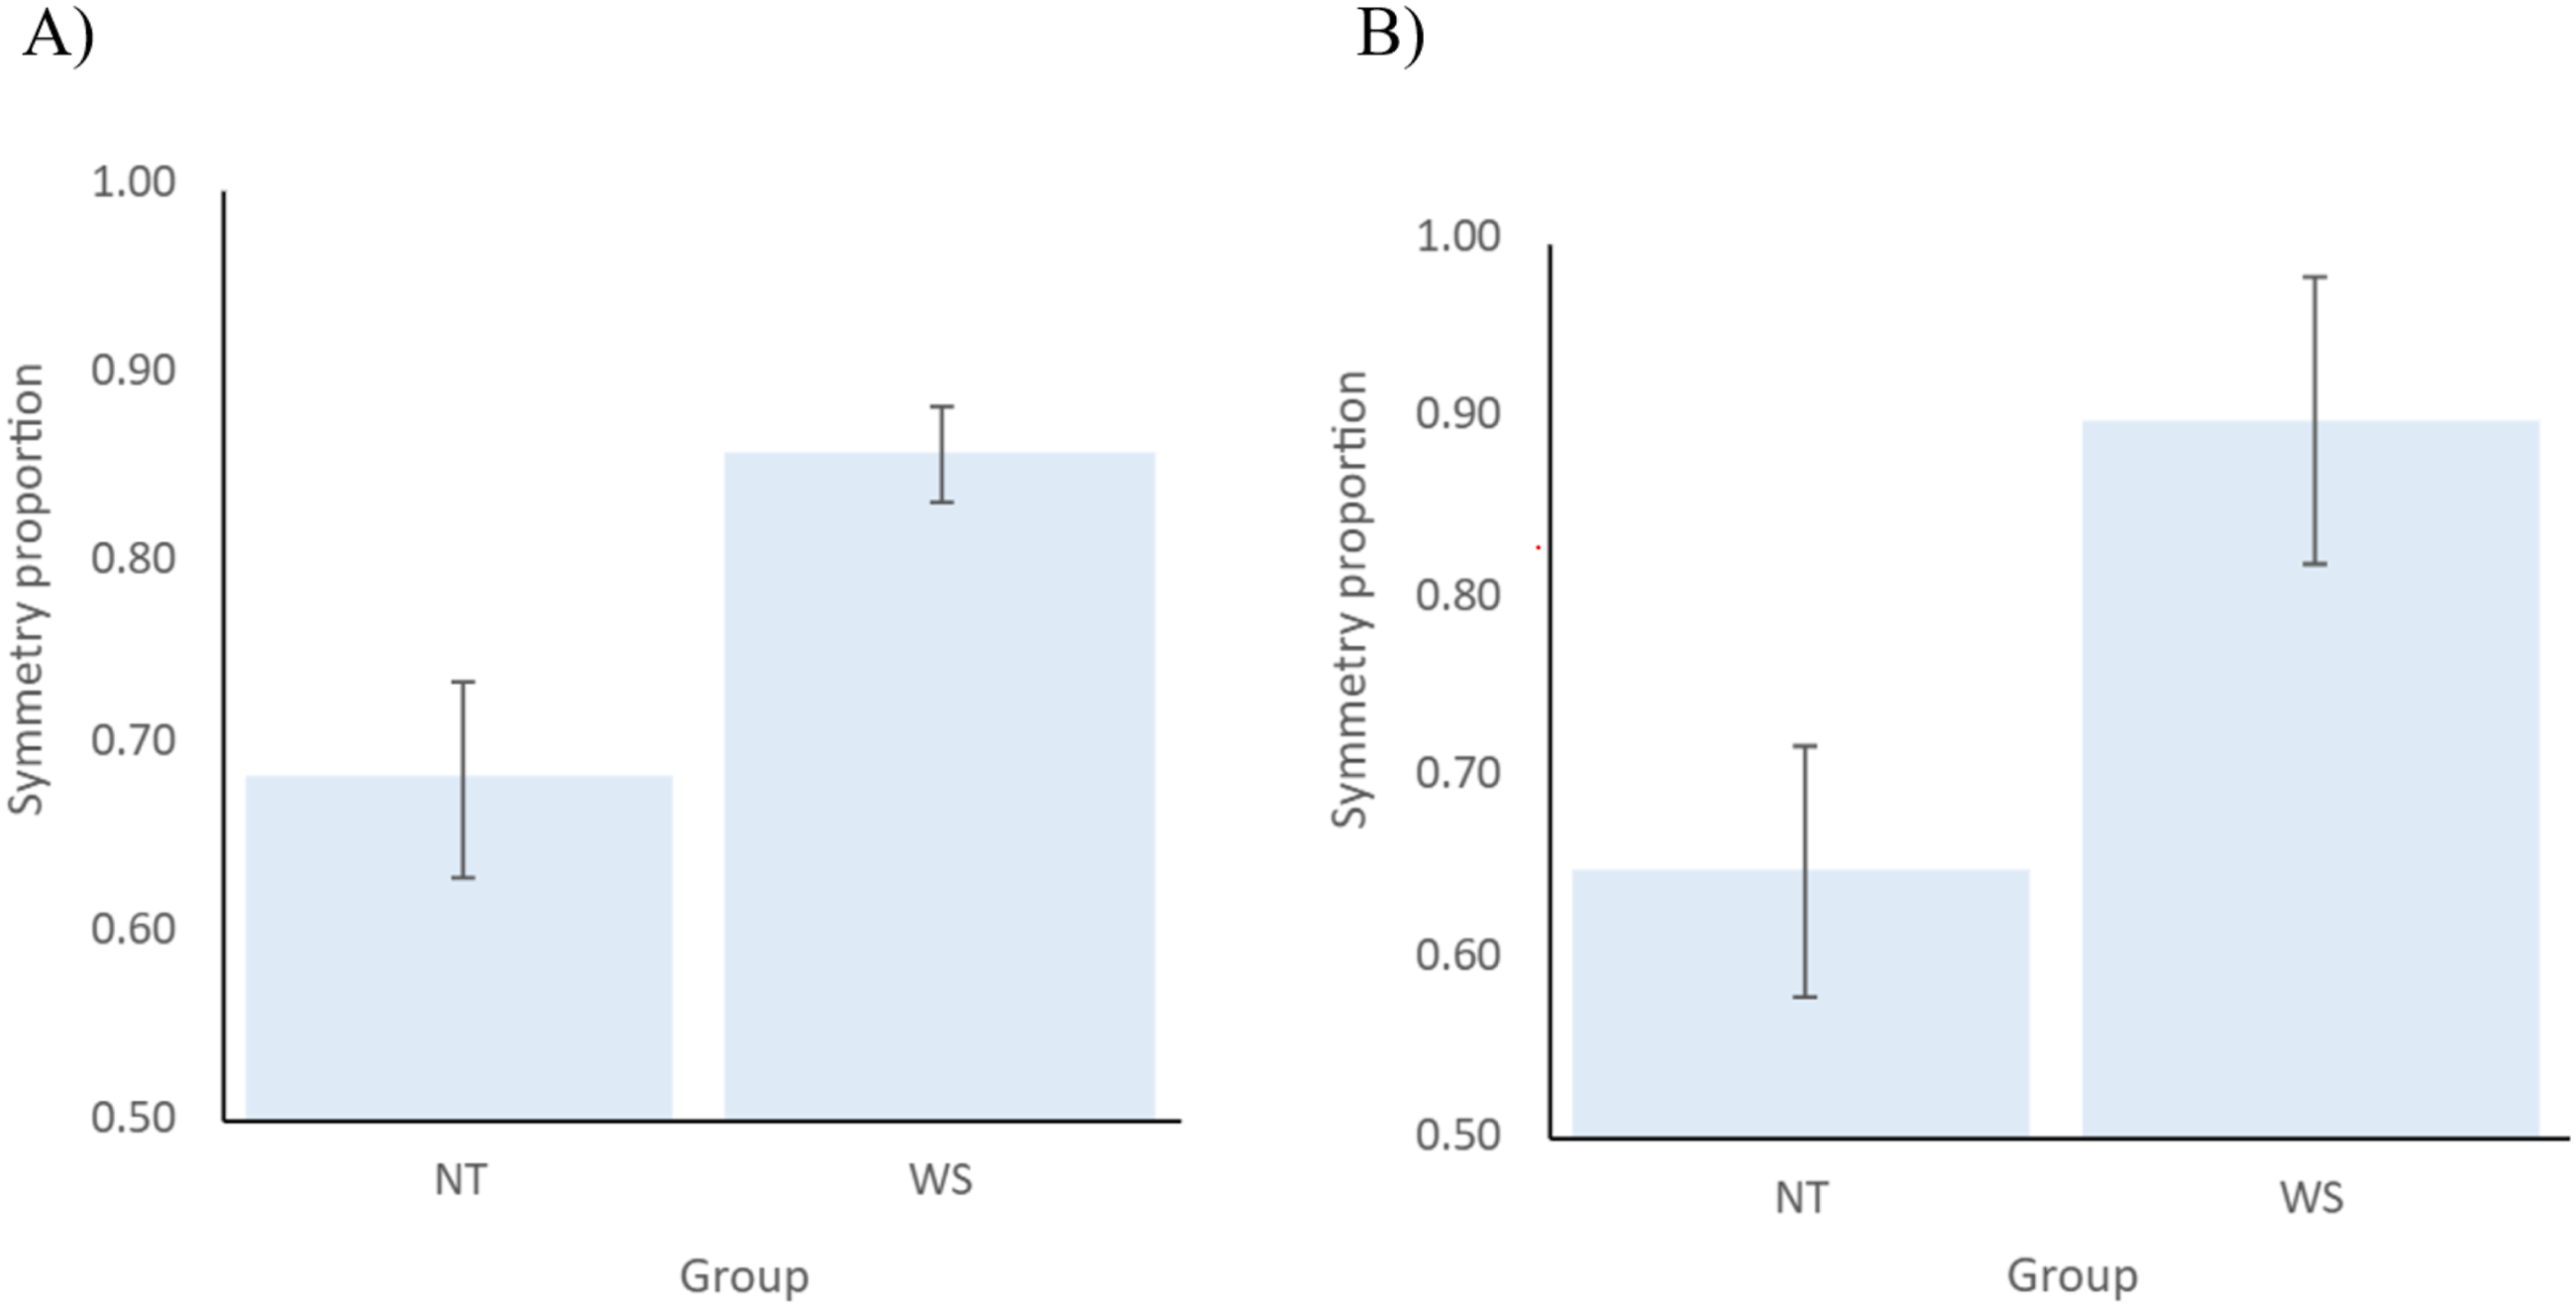
In a follow-up exploratory analysis of covariance (ANCOVA), age measured in days at the time of the video recording was entered as a covariate, with group (NT x WS) entered as a fixed factor and symmetry proportion as a dependent variable. The purpose of this analysis was to explore whether the older age of children with WS (M days = 810.39, SD = 171.72) compared to NT toddlers (M days = 407.522, SD = 73.47) could account for the differences in symmetry proportion between them. The results indicated that although age was not a significant covariate (F (1,41) = 0.40, p = .530, η p 2 = 0.01), once it was entered into the analysis, the main effect of group was no longer significant (F (1,41) = 3.76, p = .059, η p 2 = 0.08, see Figure 2(B)).
Discussion
This study investigated the motor quality and symmetry of early walking in children with Williams Syndrome (WS) compared to neurotypical (NT) children during the first month of independent walking.
Early Gait Characteristics
Contrary to the expectation that the first unsupported walking of children with WS would be characterised by significantly different quality in comparison to NT children (H1), no significant group differences were observed in overall proportions of atypical movement as measured by the Walking Observation Scale (WOS; Esposito & Venuti, 2008). However, a significant interaction between gait axis (foot, arm, and general movement) and group revealed important nuances: both groups exhibited higher proportions of atypical general movements relative to atypical foot or arm movements. Although WS and NT children did not differ significantly on any of the three gait axes, the findings revealed subtly different profiles of atypical movement across the two groups. For the NT group, the mean proportions of atypical movement observed on the foot and arm axes were equal and lower than the average atypical general movement. However, for children with WS, the lowest proportion of atypical movement was observed on the arm axis, which was marginally significantly lower than the foot axis and significantly lower than the general movement axes. This variation in axis-specific atypicalities may point to group-level differences in motor development that are not evident in aggregated scores. Importantly, these differences were not accounted for by chronological age differences between the groups.
Exploratory analyses also revealed significantly different profiles of atypical foot patterns, which were accounted for by a marginally higher incidence of out-toeing (WOS item F3) in children with WS compared to their NT peers. These findings align with previous research suggesting limitations in ankle and knee joints in individuals with WS (e.g., Morris et al., 1990), where positioning the toes outward during walking may serve to reduce the weight load on the knee joints (e.g., Khan et al., 2019). In NT children, the out-toeing pattern is suggested to decrease during the first years of walking (Rerucha et al., 2017); however, longitudinal research is needed to explore whether this stepping pattern improves or remains in individuals with WS.
In terms of atypical arm movements, exploratory analysis revealed no significant group differences on any individual WOS items. Both groups showed a tendency to hold their arms extended forward while walking (e.g., high or middle guard). This aligns with research demonstrating that during the initial weeks following walking onset, typically developing toddlers often adopt a high or middle guard arm posture, which has been associated with a wider step base, both considered to be strategies for enhancing postural stability (Kubo & Ulrich, 2006; Ledebt, 2000). In Ledebt’s (2000) longitudinal study, improvements in balance and postural control across the first six months of walking were paralleled by a gradual lowering of the arms, from high guard (observed up to approximately six weeks post-walking onset) to middle guard (observed up to ten weeks after walking onset), and ultimately developing into more flexible and reciprocal swing movements facilitating more mature and efficient gait patterns. Given that the current study was limited to observations within the first month of independent walking, the prevalence of high or extended arm positions observed in both WS and NT children is likely reflective of this early transitional phase. Future longitudinal investigations should examine whether children with WS exhibit an extended use of high or middle guard positions over time, as this may signal persistent challenges with postural control that impact gait efficiency.
Finally, in examining atypical general movements, no significant differences were observed across children with WS and NT development in the use of myopathic gait and lack of oppositional movement between the arms and legs during walking. While at this early stage of independent walking, individuals with WS did not present with significantly different general movement qualities, prior research indicates that later gait patterns in this population may be influenced by factors such as hypotonia and limited joint movements (Hocking et al., 2010; Morris et al., 1988; Udwin et al., 1988), which in turn could impair gait speed, efficiency and balance (Barozzi et al., 2013; Mayall et al., 2021). This highlights the need for longitudinal research and a better understanding of the progression of locomotor development in WS. Notably, the lack of oppositional movement between the limbs, a key indicator of rhythmic and coordinated gait (Chruscik et al., 2021), was observed in both groups, suggesting that this may be a normative feature of the earliest stages of independent walking, often marked by unstable motor strategies (Adolph & Avolio, 2000). These results highlight the importance of investigating axis-specific features and individual gait components, as broader summary metrics (e.g., looking at overall motor skills or broad gait measures) may obscure meaningful group-level trends.
Gait Symmetry
In relation to the second hypothesis (H2), initial results suggested that children with WS demonstrated significantly greater arm symmetry during walking compared to NT children. This finding contrasts with the expectation that neurodevelopmental conditions such as WS would be associated with increased asymmetry, as has been observed in other conditions like autism (Esposito et al., 2011; Teitelbaum et al., 1998). However, this effect was no longer evident once age was controlled for, suggesting that the initially observed effect can be explained by developmental differences associated with age. However, we cannot rule out that the loss of statistical significance may also be explained by the small effect size (d = 1.16), indicating that differences in arm symmetry may not have been possible to determine due to the low power brought about by the small sample size.
One possible interpretation is that greater arm symmetry in WS at walking onset (which occurred on average twice as late as in NT children) may reflect developmental delays in other factors that influence motor patterns. In this context, increased symmetry may represent a more constrained motor strategy aimed at enhancing balance through reduced degrees of freedom in limb movement. This interpretation is consistent with theories proposing that symmetry can function as a compensatory mechanism in populations with reduced postural stability and poor coordination, such as in WS (Hocking et al., 2009; Mayall et al., 2021). Conversely, it is also possible that increased age at walking onset presents with developmental advantages, such as improved muscular strength or postural control, which facilitate more symmetrical gait patterns. Thus, the finding may reflect developmental advantage rather than motor rigidity.
These interpretations contribute to ongoing discussions about the functional significance of motor symmetry. While asymmetry is often treated as an indicator of atypicality (Esposito et al., 2011; Patterson et al., 2022), recent frameworks have emphasised that both excessive symmetry and asymmetry may be maladaptive depending on context (Latash & Anson, 1996; Selinger et al., 2015). Therefore, symmetry in gait is not inherently indicative of typical or atypical development (Latash & Anson, 1996; Roemmich et al., 2019). Rather, motor symmetry and asymmetry likely reflect a dynamic interplay between neurological development, biomechanical efficiency, and experience-dependent adaptation (Roemmich et al., 2019). In WS, where cerebellar and parietal abnormalities are well documented (e.g., Osorio et al., 2014; Reiss et al., 2000), constrained motor patterns may reflect neural differences or adaptive strategies. Longitudinal designs are needed to determine whether elevated proportions of symmetry persist, diminish, or transform with motor experience.
Taken together, these findings suggest that while WS may not be associated with overtly different gait quality compared to NT children in the earliest stages of walking, meaningful differences can be observed across specific gait axes and movement features. Subtle but systematic variations, such as the observed preference for symmetrical arm positioning and marginal increases in out-toeing, point to possible neurodevelopmental constraints in motor balance and coordination in WS, and highlight the need to move towards more fine-grained analyses of specific gait features.
The current findings contribute to a growing body of research suggesting that motor development in WS is marked by subtle, qualitative differences rather than gross motor deficits alone (Hocking et al., 2010; Morton & Bastian, 2004; Van der Geest et al., 2005). Prior studies have documented persistent impairments in balance, coordination, and gait characteristics in older children and adults with WS (e.g., Hocking et al., 2010; Mayall et al., 2021), and this study extends those observations to the early stages of independent walking. The absence of group differences in total WOS scores may seem at odds with these prior findings. However, previous studies have highlighted considerable variability in motor performance within the WS population (e.g., in relation to motor milestone achievements; e.g., Carrasco et al., 2005; Mayall et al., 2023), which may obscure group-level effects in small samples. The observed variability within WS participants supports the need for more fine-grained, individual-level analyses.
Finally, the elevated proportions of atypical general movement across both groups may reflect early inefficiencies in whole-body control during the transitional phase of walking. Given that this pattern was evident in NT toddlers as well, it may represent a normative feature of early walking, which is only exaggerated in populations with motor vulnerabilities. These results support previous findings that early locomotion is highly variable and often marked by instability and compensatory patterns, even in typically developing children (Adolph & Avolio, 2000; Chruscik et al., 2021). Alongside existing literature on persisting motor difficulties in older individuals with WS (e.g., Mayall et al., 2021), these findings suggest that atypical gait patterns commonly observed in infancy may tend to dissipate in NT children, but could persist in people with WS. This may suggest a slower or atypical rate of development of locomotor skills in this population, where gait qualities are at a typical level initially, but with a widening gap between WS and NT individuals in the course of motor development.
Limitations and Directions for Future Research
Several limitations of the current study should be noted. First, the relatively small sample sizes, especially in the WS group, limit the statistical power and the ability to detect small to moderate effects. Although this study includes one of the larger WS samples to date, power analyses indicated that many of the observed effects in H1 fell below the minimum detectable threshold. In addition, the relatively large number of statistical tests conducted in relation to the sample size increases the risk of Type I error, particularly for exploratory analyses, which should therefore be interpreted with caution.
A second limitation of the present study is the lack of height and body weight measurements, which could impact gait characteristics, such as walking speed and stride length (e.g., Samson et al., 2001). Due to the majority of WS data being retrospective, standardised anthropometric measurements were not collected at the time of the original data acquisition. Furthermore, motor quality was assessed using video data collected online, which did not permit the reliable and consistent measurements of these variables using a standardised procedure for the remainder of the prospectively collected data. A systematic review of anthropometric comparisons between individuals with WS and NT peers shows a global developmental delay in this population, characterised by low birth weight, difficulties gaining weight in the early years, and lower height throughout development (de Sousa Lima Strafacci et al., 2020). Therefore, future studies should consider collecting anthropometric data.
Third, gender-related differences in gait and lower-limb anatomy have been documented in both children (Unger & Rosenbaum, 2004) and adults (e.g., Samson et al., 2001; Suner-Keklik et al., 2023), and may emerge early in development (Unger & Rosenbaum, 2004; Zakaria et al., 2015), raising the possibility that the gender imbalance across the samples in the present study represents a potential confounding factor. However, the primary outcomes of interest focused on qualitative aspects of early motor performance rather than spatiotemporal gait parameters, such as stride length, cadence or walking speed, which are more consistently shown to differ by gender in children (Zakaria et al., 2015). As such, the influence of gender-related gait differences on the measures examined may be limited. Nonetheless, future research employing prospective designs with more gender-balanced samples will be essential for disentangling the effects of gender from syndrome-specific influences on early walking development.
Fourth, although efforts were made to standardise the video recordings, variability in video quality, camera angles, and lighting may have affected the accuracy of video coding. This may be especially relevant to the WS sample, where the majority of the provided videos were retrospective, thus limiting our ability to control the quality or consistency of video data. While the achieved inter-rater reliability was excellent across both coding schemes (WOS and PPSW), the inherent challenges of analysing naturalistic video data from home environments should be taken into consideration.
Finally, the WOS and PPSW frameworks, while well-established, offer limited resolution in capturing fine-grained kinematic features such as stride length, step width, and arm swing amplitude. Future research incorporating motion capture or wearable sensor technology could offer more precise measurements of gait features (e.g., Clark et al., 2019). In addition, advancements in machine learning and algorithms such as OpenPose and DeepLabCut are becoming increasingly more utilised in the study of early motor development (Gama et al., 2024). While a challenge associated with these technologies is that they require strictly controlled settings to perform efficiently (e.g., Sotoodeh et al., 2026), which may not be possible in the context of home-recorded and naturalistic video data, they could potentially advance the ability to accurately estimate, code and analyse fine-grained motor characteristics.
In terms of future directions, longitudinal studies following children from pre-walking stages through later motor development would also help elucidate whether the patterns observed here, such as increased symmetry, persist or change with experience and development. Such studies would be beneficial for a greater understanding of the rate of development of motor skills in WS over time relative to their NT peers. Integrating biomechanical assessments with observational tools like the WOS and PPSW could improve measurement precision and deepen our understanding of the neural and musculoskeletal mechanisms underlying gait patterns in WS.
Furthermore, examining how early motor behaviours in WS relate to broader developmental domains such as cognition, language, and social interaction may clarify the cascading effects of motor atypicalities. This approach aligns with recent developmental theories that conceptualise motor function as a foundational domain with broad implications for learning and adaptation in other areas (Campos et al., 2000; Iverson & Goldin-Meadow, 2005). Investigating the effects of targeted motor interventions, particularly those aimed at improving dynamic balance and arm-leg coordination, may contribute to insights for early therapy in WS and related neurodevelopmental conditions. Early identification of atypical gait patterns could support such interventions. The efficacy of current therapeutic interventions, such as dance/movement therapy and motor skill training, remains inconsistent across individuals with WS (e.g., Liu et al., 2013; Takahashi et al., 2020), highlighting the need for more refined, deficit-specific approaches.
Conclusion
This study is the first to examine the motor quality and symmetry of early walking in toddlers with WS using naturalistic video data within a month of walking onset. Overall gait quality did not differ significantly between groups. While both WS and NT children demonstrated elevated levels of atypical general movement, the WS group showed an unusual pattern of foot atypicalities with slightly increased use of out-toeing during walking. Importantly, children with WS demonstrated increased symmetry in arm movement relative to NT children, but this was accounted for by differences in age. While at an early age there are only subtle differences between WS and NT peers, this contrasts with evidence from older children and adults. This suggests that the rate of development of motor skills in WS may follow a different (e.g., slower or atypical) pattern, which eventually leads to significantly different motor profiles in individuals with WS. These findings underscore the importance of examining nuanced aspects of gait and movement in neurodevelopmental conditions and highlight the potential of early motor markers to inform both theoretical understanding and clinical intervention. Future research using longitudinal and biomechanical methods is needed to determine the developmental trajectory and functional implications of these early gait patterns in WS.
Footnotes
Acknowledgements
The authors would like to sincerely thank the families who generously contributed their time and home video footage to support this research. Their participation made this study possible. Special thanks are also extended to Jenny Tan for her valuable work as a second rater in the video coding process - her contributions were instrumental in ensuring the reliability and rigour of the observational data.
Ethical Considerations
This study was reviewed and received a favourable ethics opinion by the University of Surrey Ethics Committee (ref: FHMS 22-23 196 EGA).
Consent to Participate
Participants consented to the study using an online consent form.
Consent for Publication
No personal data of the participants in this research has been included in this manuscript for publication.
Authors’ Contributions
All authors were involved in the design of the study, data analysis and interpretation of findings. GY collected and coded the data and wrote the initial manuscript. All authors contributed to reviewing and editing the manuscript, and all have read and approved the final manuscript.
Funding
This research was funded by a PhD studentship to Gloria Yoshkova from the Engineering and Physical Sciences Research Council (EPSRC), and the Williams Syndrome Foundation, UK.
Declaration of Conflicting Interests
The authors declared no potential conflicts of interest with respect to the research, authorship, and/or publication of this article.
Data Availability Statement
The datasets generated and/or analysed during the current study are publicly available at: https://doi.org/10.17605/OSF.IO/TEHAR. ![]()