
Abstract
Active movement extent discrimination assessment (AMEDA) is a psychophysical task that evaluates proprioception and tactile acuity of the lower limbs, and it is a method of determining sensorimotor ability. Sensorimotor ability is the ability to judge small differences in movement tasks through the process of receiving sensory messages (sensory input) and producing a response (motor output). Participant attention lapses in prior psychophysical studies have been implicated as a cause for increased measurement variance thresholds in these types of assessments. Since minimizing the time needed for the AMEDA may help to reduce attention lapses, we compared the reliability of the 50-repetition AMEDA protocol (Group 1) with that of a 25-repetition protocol (Group 2). We assessed the split half reliability of these two approaches, using the Spearman-Brown Adjusted Pearson correlation (r). For each method, we calculated Bland-Altman Plots and Intra Class Correlation Coefficients to compare the reliability of the two data sets and determine the 95% confidence intervals. Split-half test re-test Spearman-Brown Adjusted Pearson r (rfull) was Group 1 r full = 0.83 and Group 2 r full = 0.85. The Bland-Altman Plots indicated only a small degree of bias from the zero-difference line, with 95% of the difference points lying within the limits of agreement. For Group 1, the intraclass correlation coefficient (ICC) two-way, agreement was 0.83 (95% CI 0.54–0.93) and for Group 2, the ICC, two-way, agreement, was 0.85 (95% CI 0.66–0.93). The MDC90 for Group 1 was 0.082 AUC units and for Group 2, it was 0.086 AUC units. The combined data for Group 1 plus Group 2 Bland-Altman Plot indicated only a small degree of bias from the zero-difference line, with 95% of the difference points lying within the limits of agreement. The MDC90 for the combined groups was 0.08 AUC units. The multiple methods from previous research assessing test re-test reliability that we applied to our two data sets indicate that the 25-response AMEDA was a reliable system for evaluating sensorimotor function in the lower limbs and may be an alternative for the more traditional 50-response protocol in which lapses in participant attention from fatigue or other biases may be a concern. There are also practical advantages in time restricted athletic screenings to a shorter administration of this assessment.
Introduction
Sensorimotor ability is the ability to judge small differences in movement tasks through the process of receiving sensory messages (sensory input) and producing a response (motor output). Active movement extent discrimination assessment (AMEDA) is a psychophysical task that evaluates proprioception and tactile acuity of the lower limbs, and it is a method of determining sensorimotor ability. The AMEDA device is used for assessing sensorimotor sensitivity to degrees of ankle inversion in the lower limbs (Han et al., 2016). This tool provides ecologically valid measures of lower limb sensorimotor ability, and its outputs have been sensitive to measures of athletic talent in cross sectional studies (Han et al., 2015a, 2015b). Lower AMEDA scores have been associated with increased probability of a future injury in many populations (Antcliff et al., 2023; Steinberg et al., 2019; Svorai Band et al., 2021). The ankle AMEDA has been shown to have good test-retest and intra-rater reliability in healthy adults (ICC: 0.80) (Witchalls et al., 2014). However, reliability can be impacted by such factors as ankle dysfunction; for example chronic ankle instability reduced the reliability to a moderate (ICC: 0.60) (Shi et al., 2023).”
In psychophysical research participant attention lapses have been implicated as a cause for increased measurement variance thresholds (Waskom et al., 2019; Witton et al., 2017). A lapse in attention, or disengagement from the task, may mean that the participant failed to register the extent of stimulus movement and made a random guess that does not reflect their subjective judgement. In these assessments, it is necessary to ensure that a stimulus sequence is sufficiently long to obtain useful data but not so long as to encourage disengagement or inattention (Waskom et al., 2019; Witton et al., 2017). Morgan et al. (2000) indicated that 10–20 trials were sufficient to enable participants to achieve a reliable estimate of an implicit standard in a psychophysical judgement task. The AMEDA test is a psychophysical cognitive-motor assessment that satisfies Pronk et al.’s (2022) review criteria for determination of split-half reliability using the Spearman-Brown Adjusted Pearson rfull (Borg et al., 2022). The AMEDA test requires participants to make judgements about five discrete ankle movement extents presented 10 times each (i.e., 50 responses). Thus, the AMEDA test results can be split to compare two sets of 25 responses each, (i.e., half of the original 50 response test) but even 25 trials are a greater number of trials than the 20 trials suggested by Morgan et al. (2000).
The split-half reliability method measures the internal consistency of a test when the two halves of the test can be assumed to measure the same thing (Pronk 2022). Since both halves of the test should measure the same construct at a similar level of precision and difficulty, scores on one half should correlate significantly with scores on the other half. The required sample size for adequate power in the two groups has been as described by Borg et al. (2022), and previous investigators have demonstrated intraclass correlation coefficients (ICC) for the complete AMEDA to be between 0.8 and 0.89 (Waddington et al., 2004; Witchalls et al., 2014). In the current study we anticipated similar ICC values on test-retest when using each of the two sets of 25 positions in the full test of 50 positions. Using G*Power 3.1 software (RRID:SCR_013726), we calculated an a priori power analysis, assuming the null (0.85), versus the anticipated (0.70), effect sizevalues from Borg et al.’s (2022) study, 80% statistical power, and .05 statistical significance. We obtained an estimated required sample of 38 participants.
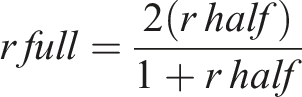
We calculated the Spearman-Brown Adjusted Pearson rfull, from the Pearson r derived from each half of the original data sets using the following equation.
The MDC90, indicating the change in scores needed for 90% confidence that the change in the measurement was not the result of inter-trial variability or measurement error as described by Steffen and Seney (2008), was calculated as follows.


SEM; standard error of the measurement, and sd; standard deviation of the first measurement. (Steffen & Seney, 2008).
Method
Participants and Ethical Considerations
In this study, we applied test re-test reliability analyses to two different de-identified AMEDA data sets previously collected from participants in another validation study for which participant inclusion had undergone separate ethics approval review (UCHREC Project Number 17–211) as de-identified data. We included no individually identifiable data from these prior research participants and all participants were over the age of 18 and had previously provided informed consent for the subsequent use of their data. One of these data sets included 19 female professional football (soccer) athletes (Group 1) and the other included 26 male basketball players (Group 2) competing on a national level development squad. All athletes were participating in high performance sport at the time of the original collection of the data used for this research.
Procedure
All participants in the earlier research underwent an AMEDA assessment that required them to stand on the device, with the non-tested foot on a fixed plate and the tested foot placed on a movable plate. The participant was asked to make an active movement into mid-range ankle inversion, which rotated the plate and the lateral side of the foot down until the plate movement was arrested at an adjustable metal stop. The device provided five movement stop positions which were numbered from 1 to 5, assigning each movement displacement in the order from the shallow rotation position (position 1) to the deepest angle position (position 5). Each participant underwent three familiarization trials, repeating all five available movement extents in the sequence. During testing the participant moved the plate as described above, following which the participant returned the plate to the horizontal position and decided the extent of the inversion rotation (i.e., number 1,2,3,4 or 5). The test consisted of a total of 50 ankle movements, with all the five movement degrees presented to the participant in a randomized sequence (i.e., five positions presented 10 times in a random order) (Han et al., 2016). The AMEDA was scored by casting the participant’s responses into a five by five response matrix and determining an Area Under the Curve (AUC) in which a 0.5 movement was equivalent to a chance response and 1.0 was a perfect score.
Statistical Analyses
For this study, we calculated split half test-retest reliablities on the first and second halves of the 50 stimuli test, essentially dividing test scores into scores on the first 25 stimuli and the last 25 stimuli for both participant groups. Histograms were plotted from the data to visually determine the normality of the distributions. To determine any differences in performance on the tests between the first and second half test scores for each group (i.e., learning effects), we computed an analysis of variance (ANOVA). We also assessed split half reliability using the Spearman-Brown Adjusted Pearson r full (Pronk et al., 2022). We used Bland-Altman Plots to determine relative agreement between each of the two data sets (Giavarina, 2015). The Bland Altman plot enables evaluation of any bias between the mean differences of two quantitative methods of measurement and provides an estimate of an agreement interval, within which 95% of the differences of the second method, compared to the first one, occur (Giavarina, 2015).
Bland-Altman plots for the split half model provide more information on the differences between the measures, allowing a visual examination of the data and enabling an evaluation of the global agreement between the two measurements. We used an additional check of reliability, intraclass correlation coefficients two way, agreement (ICCs) to assess the reliabilities of the two data sets and determine the 95% confidence intervals of the reliability measure (Koo & Li, 2016). The ICC is sensitive to the extent to which participants keep their ranking order in repeated measurements and may indicate the degree of systematic difference between participants (Liljequist et al., 2019). The ICC is a reliability measure that reflects both the degree of correlation between two measures and the degree of agreement between measurements. Portney (2020) suggested that “Values less than 0.5 are indicative of poor reliability, values between 0.5 and 0.75 indicate moderate reliability, values between 0.75 and 0.9 indicate good reliability, and values greater than 0.90 indicate excellent reliability.” We also determined the Minimal Detectable Change 90 (MDC90) to provide a measure of the degree of change in the AMEDA measure needed to ensure, with 90% certainty, that the change in the AMEDA measurement was greater than the result of inter-trial variability or measurement error (Haley & Fragala-Pinkham, 2006).
Results
Participants’ Demographic Descriptors and AMEDA Scores.
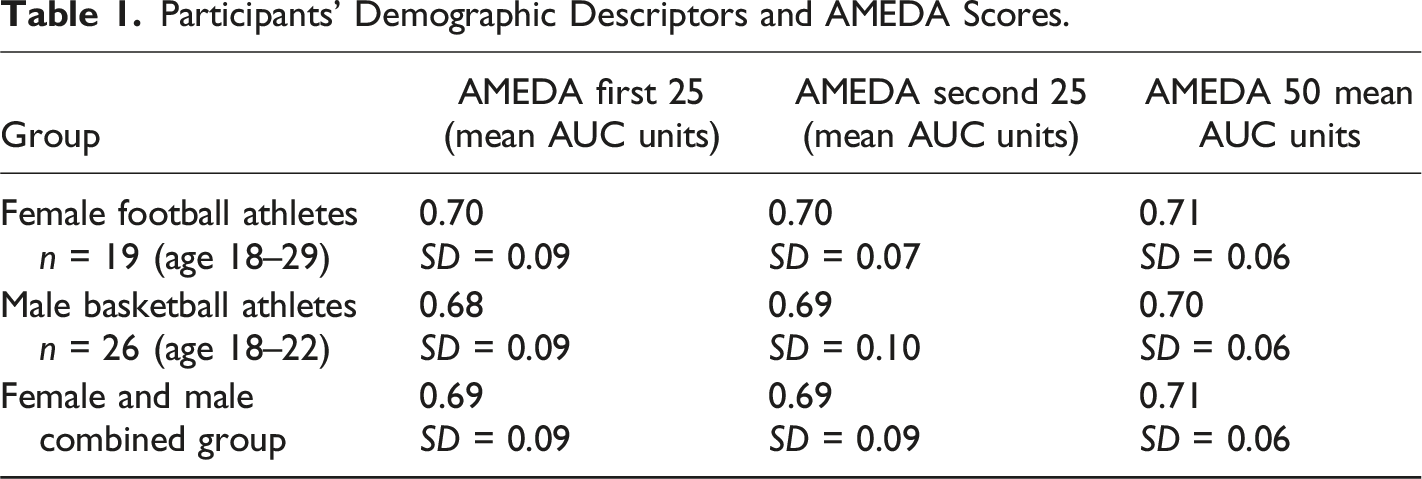
Using Student’s t-tests the means of the 25 stimulus protocol for Group 1, (n = 19) and Group 2, (n = 26) were compared with the mean of the 50-stimulus combined group (n = 45) and found to be not significantly different (t(18) = 0.77, p = .87 and t(25) = 0.61, p = .53 respectively). There was no statistically significant differences between the mean AMEDA scores of the male and female athletes, Groups 1 and 2 (Kruskal-Wallis One Way ANOVA p = .686) and the data sets were combined for further analysis. The combined groups r full was 0.84, with scores above 0.5 indicating a high degree of test re-test reliability (Cohen, 1992).
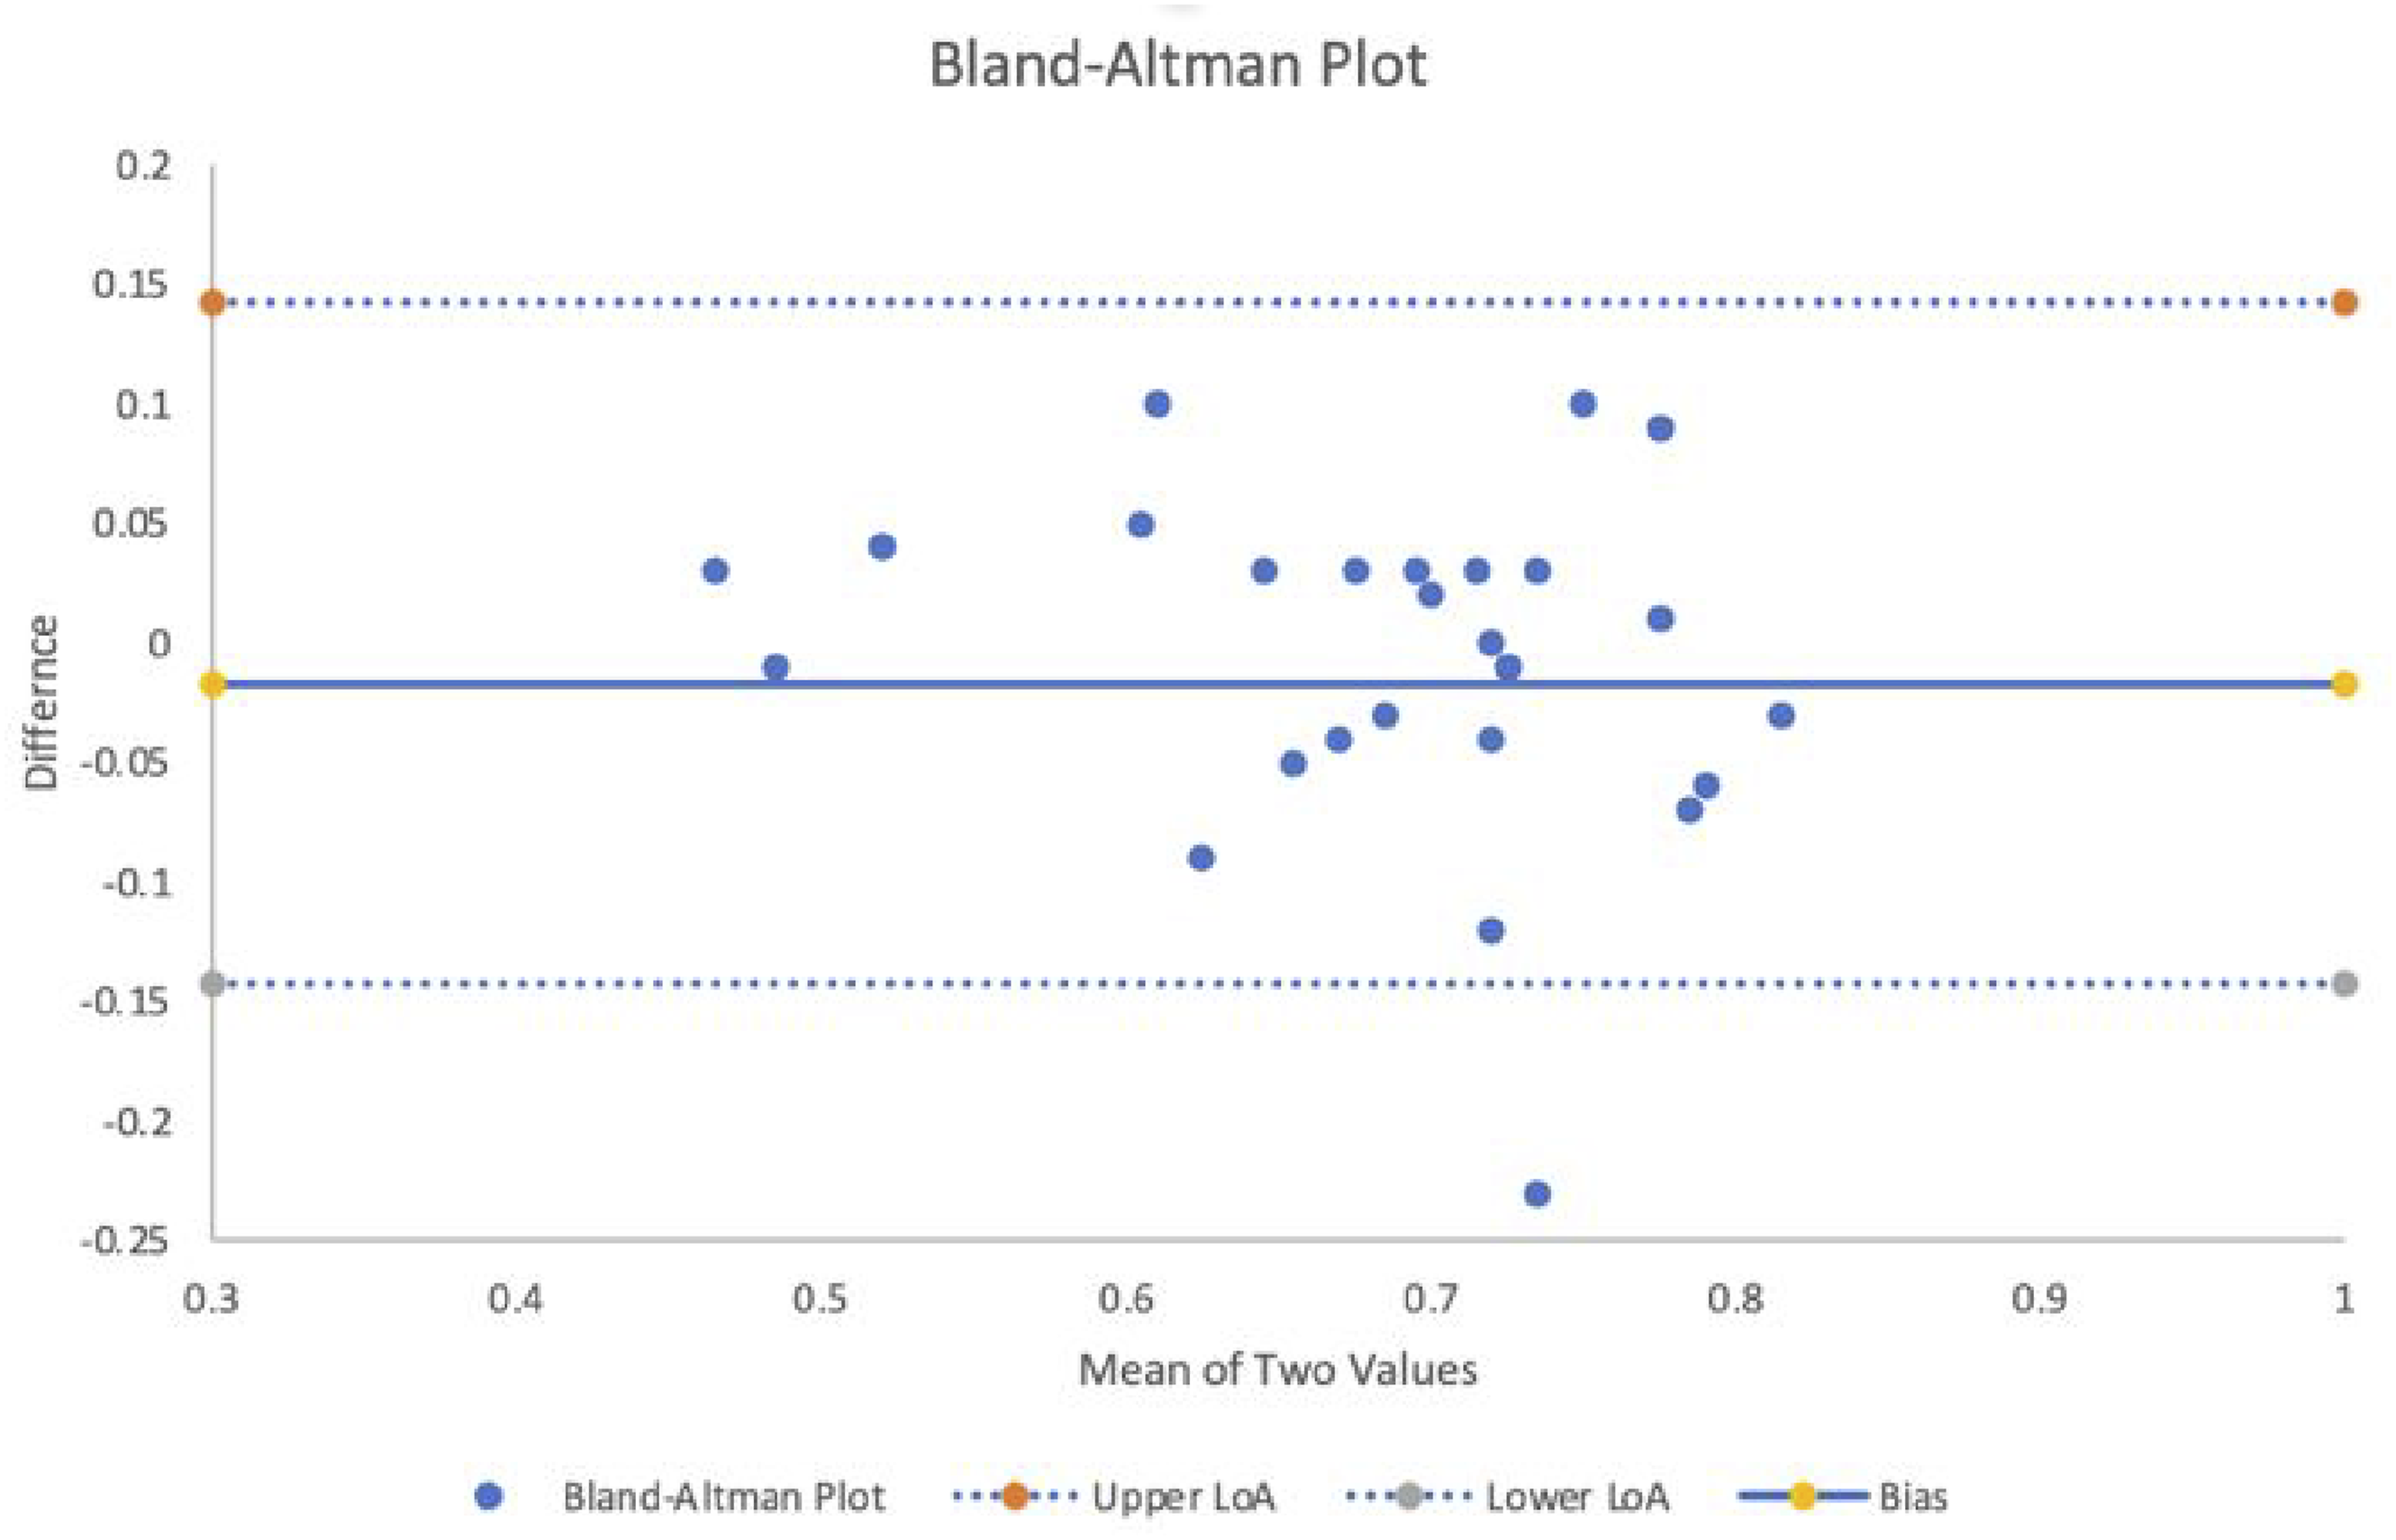
The Bland-Altman plots for the split half model are illustrated in Figures 1–3. The plots for Groups 1 and 2 (Figures 1 and 2) indicate only a small degree of bias from the zero-difference line, with 95% of the difference points lying within the limits of agreement. Combining the two groups, the Bland-Altman Plot (Figure 3) indicated only a small degree of bias from the zero-difference line, with 95% of the difference points lying within the limits of agreement. Group 1 Bland-Altman Plot. Group 2 Bland-Altman Plot. Combined groups Bland-Altman Plot.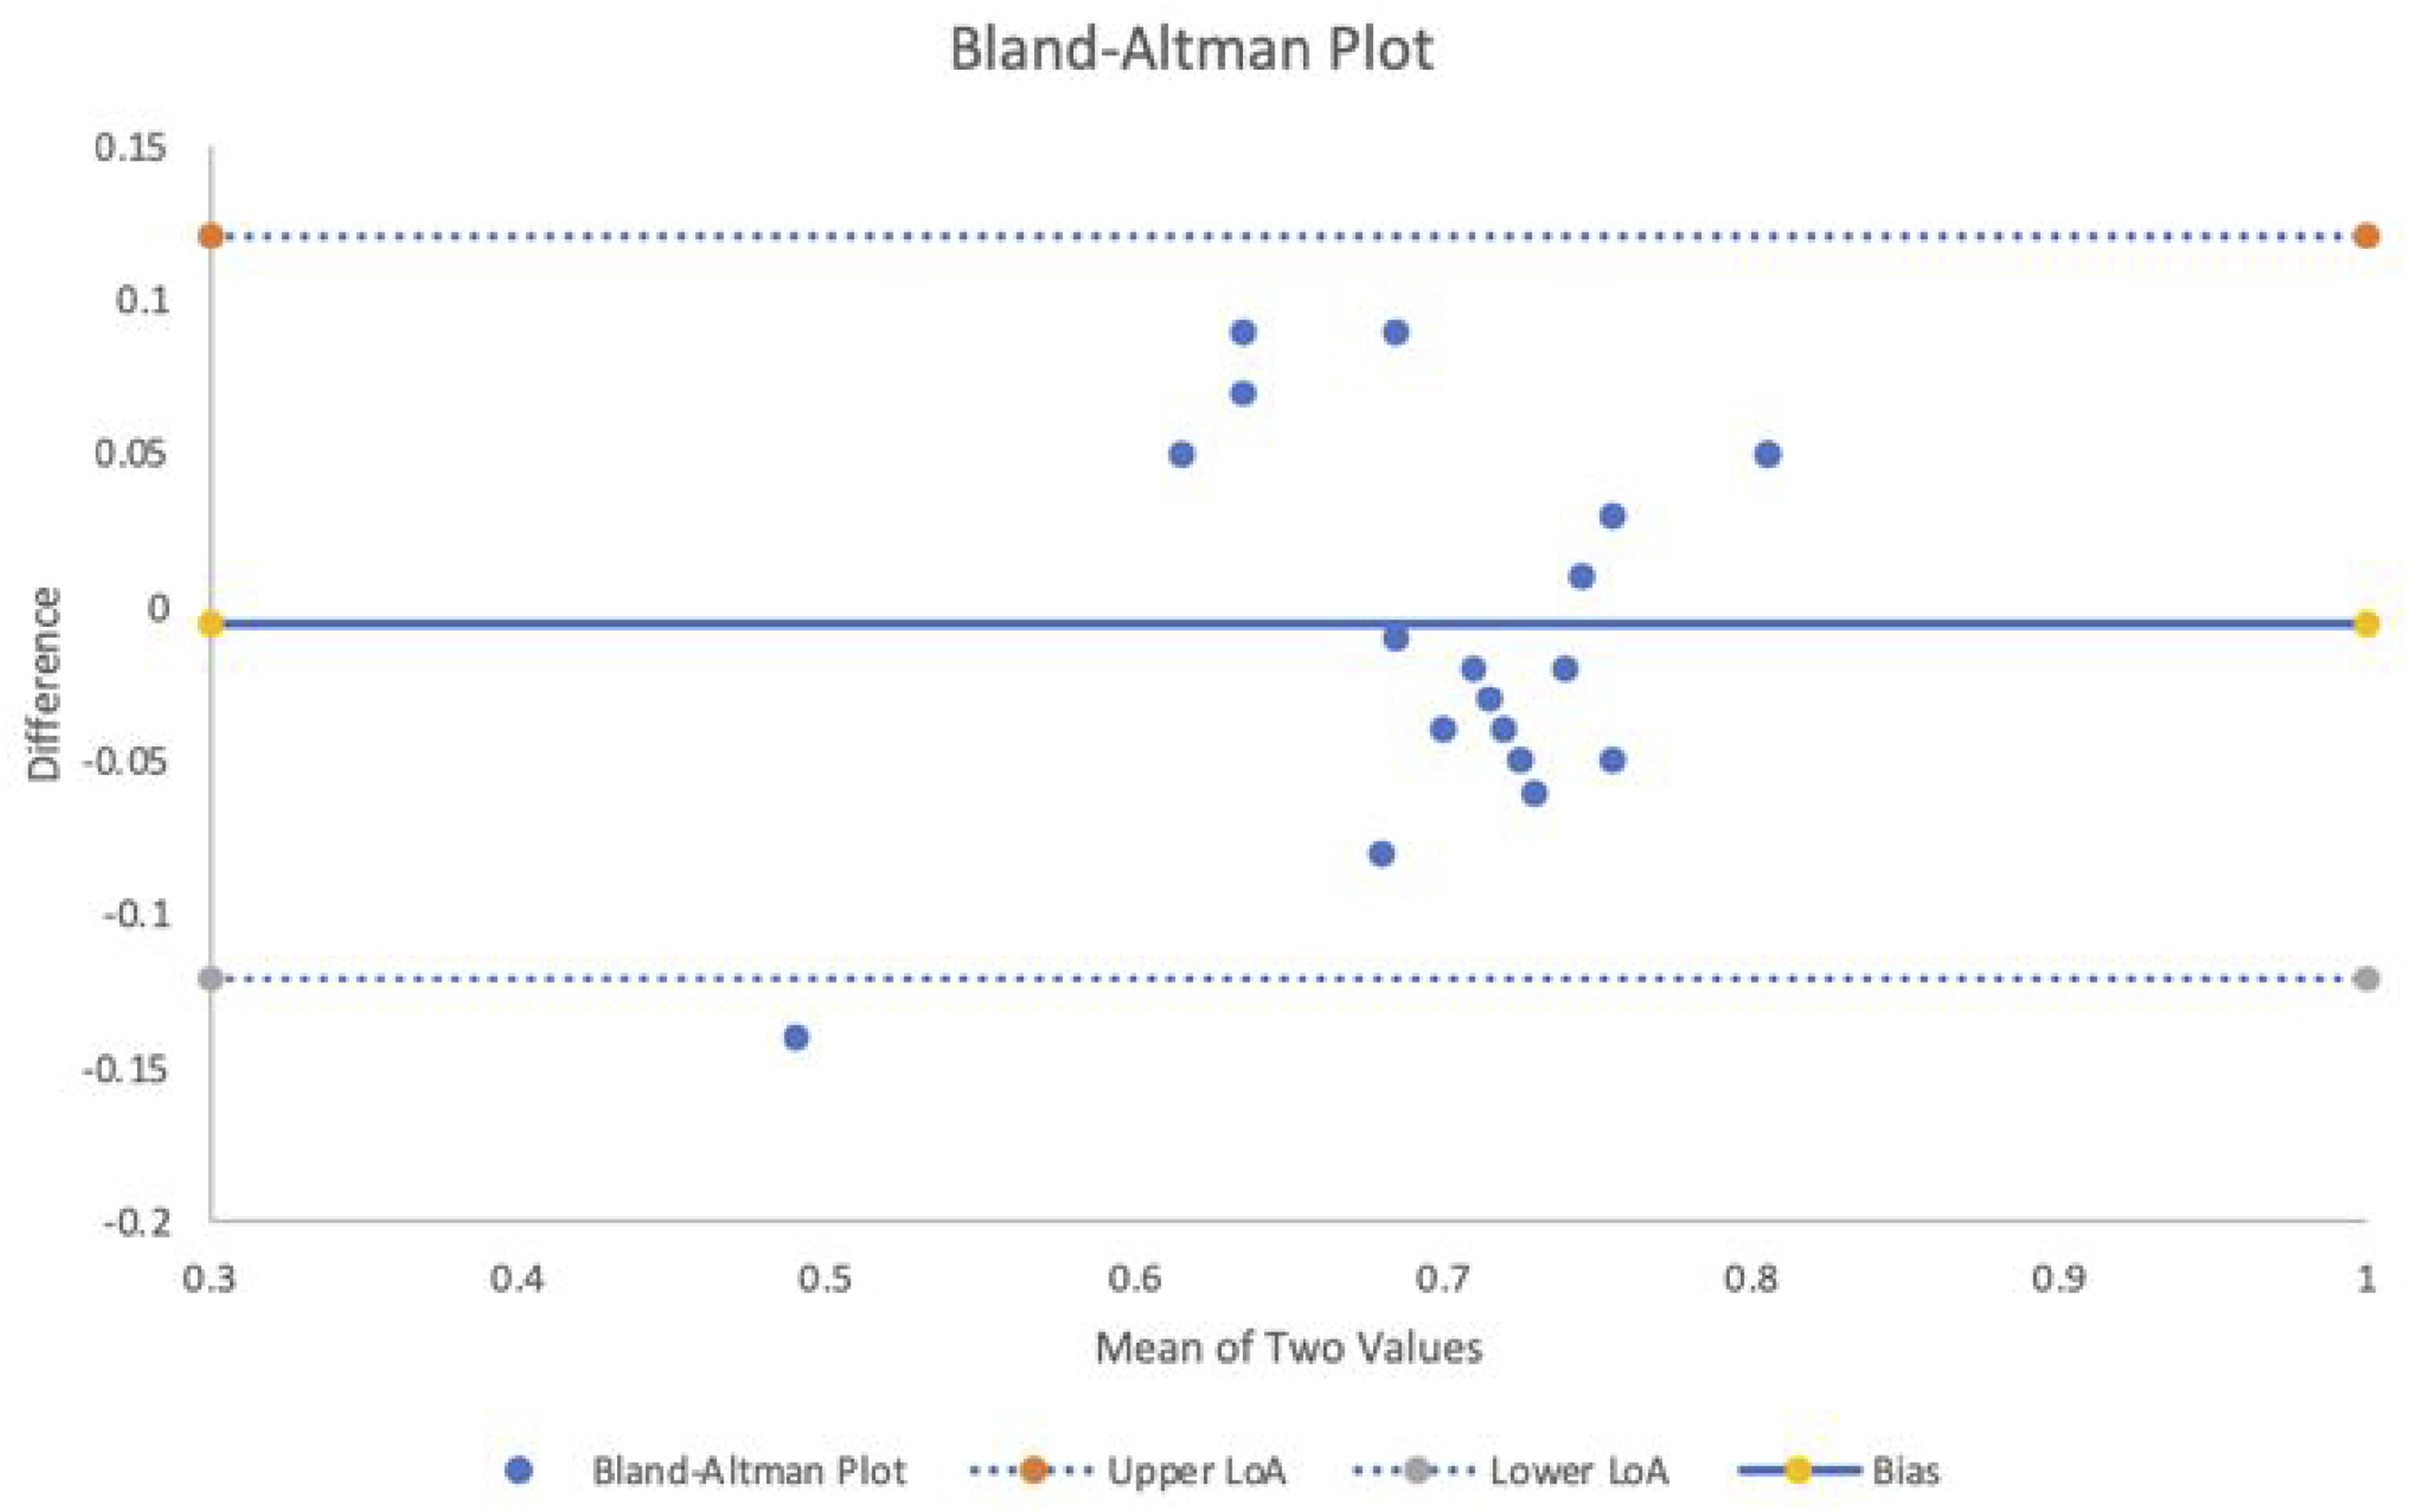
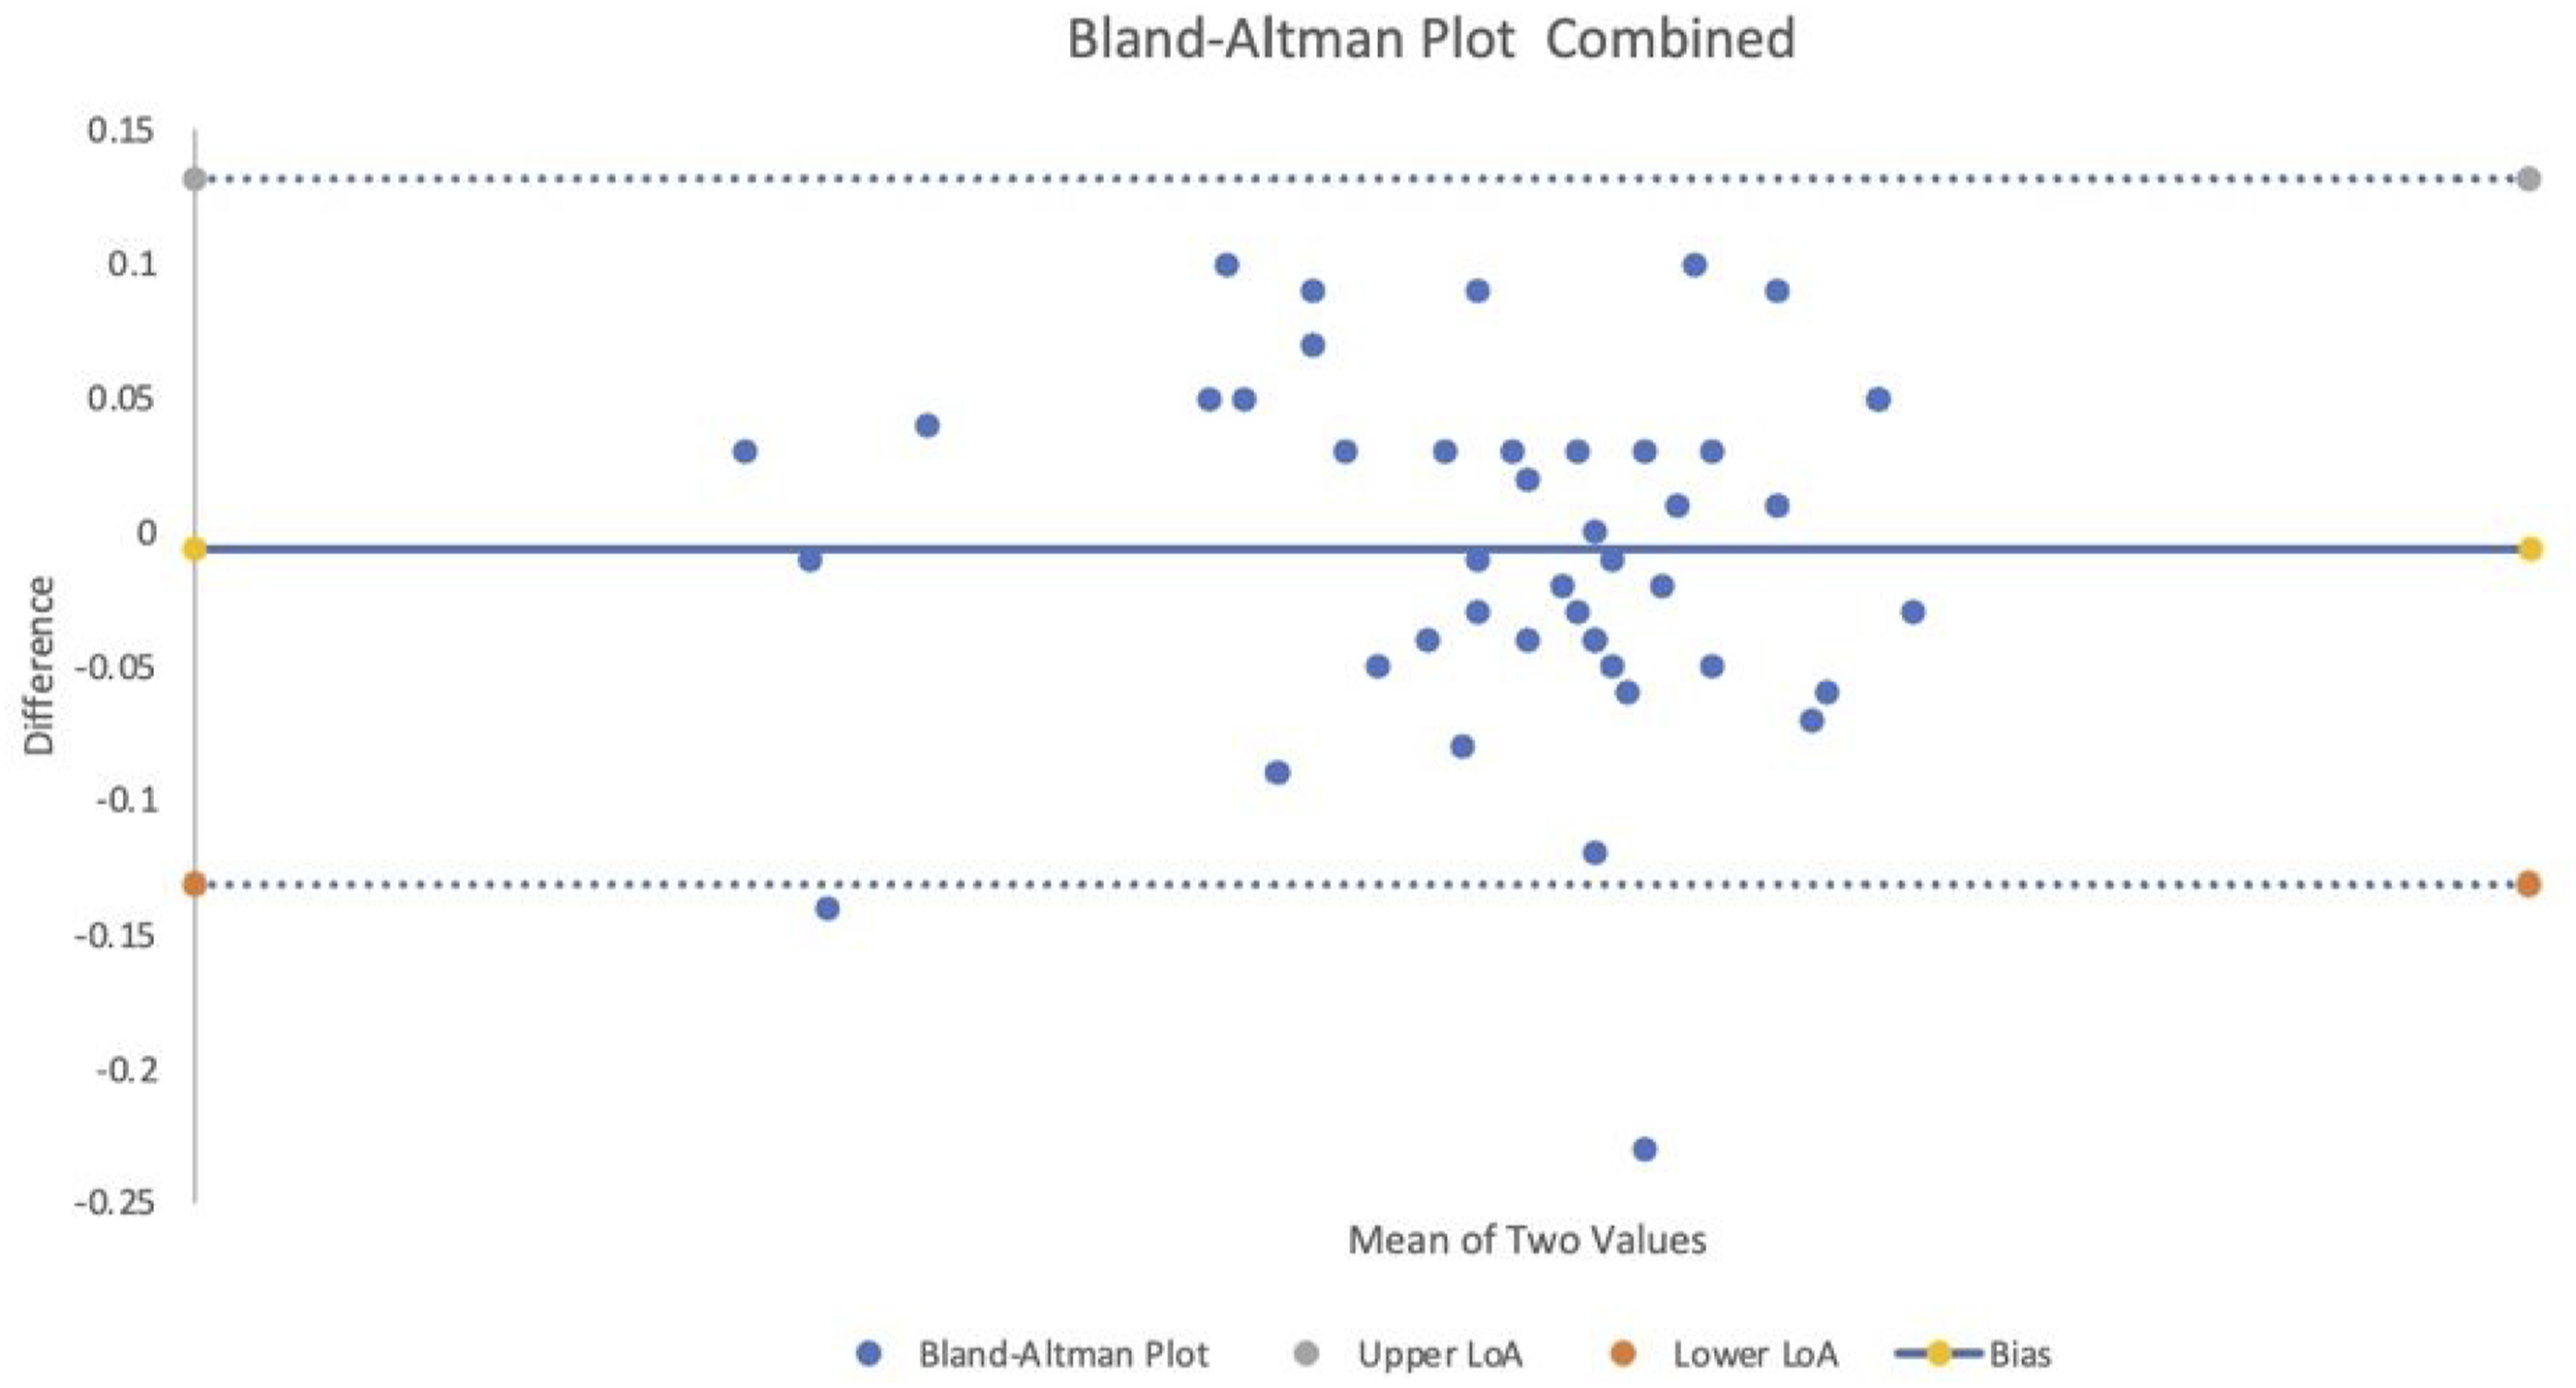
The ICC results for Group 1, two-way, agreement was 0.83 (95% CI 0.54–0.93) and for Group 2, 0.85 (95% CI 0.66–0.93), indicating good to excellent reliability for both groups. The ICC two-way, agreement for the combined groups was 0.84 (95% CI 0.73–0.91), with the 95% CI again indicating a range from good to excellent reliability.
The MDC90 for Group 1 was 0.082 AUC units and for Group 2, 0.086 AUC units. When the groups were combined the MDC90 = 0.08 AUC units, indicating that where there was a change of greater than or equal to 0.08 AUC units on an individual’s AMEDA score we can be 90% certain that the change in the measurement was not the result of inter-trial variability or measurement error.
Discussion
In this study, we sought to determine whether the use of a 25-response sequence for the AMEDA protocol would result in reduced reliability of the outcome score for assessing sensorimotor acuity when compared with the full 50-response sequence AMEDA. Using a 50-response protocol, previous investigators have reported that the ICCs for the AMEDA AUCs across two repetition trials reflected “good to high” Test 1 to Test 2 reliability (ICC = .89); across three repetition trials, reliability was “good” (ICC = .80; 95% CI 0.69 to 0.87, p < .001) with a maximum Standard Error of 0.014 (0.012–0.014) (Waddington et al., 2004; Witchalls et al., 2014). When we separated the 50-response AMEDA test into a first half of 25 and a second half of 25 responses, we found good to excellent reliability between the first and second half measures for both groups indicating that the 25-response protocol could be used in place of the 50-response AMEDA test.
Based on theaw results, the 50-response sequence AMEDA protocol can be replaced by a 25-response sequence protocol. The 50-response sequence takes approximately 5 minutes of test administration time, with the 25-response halving this. In time-poor environments, such as for athletic health assessments or in busy clinical environments this finding enables reliable, faster assessment of sensorimotor ability. Previous studies using the AMEDA have shown that physical fatigue reduced participants’ scores (Steinberg et al., 2023a, 2023b), and that scores were linked to higher cognitive function (Antcliff et al., 2021). Since the potential to reduce physical fatigue and cognitive load by shortening the protocol has potential to mitigate these fatigue influences and enable testing of proprioception in a broader range of testing contexts, we undertook the present study.
Our finding of no differences between the mean values for AMEDA performance scores between both the male and female athlete groups suggests that the determination of proprioceptive and tactile acuity measured with the AMEDA assessment task is a fundamental aspect of sensorimotor performance and is essentially the same between males and females. This makes sense if we consider that sensorimotor ability is less likely to be affected by factors such as muscle mass related strength, power or body size that usually separates males and females on conventional motor skill tasks (Drinkwater et al., 2008; Yanovitch et al., 2008).
In terms of the MDC90, where there is a change of greater than or equal to 0.08 AUC units on an individual’s AMEDA score, we can be 90% certain that the change in the measurement was not the result of inter-trial variability or measurement error. This represented approximately 12% of the raw AMEDA scores, and this finding is compatible with the values seen for the y-balance test and the balance-error scoring system (Amin et al., 2014; Foldager et al., 2023). As an example of the value of this level of sensitivity, all three tools have demonstrated discriminative ability between healthy participants and those with chronic ankle instability (Hertel et al., 2006; Linens et al., 2014; Steinberg et al., 2023a, 2023b).
Limitations and Directions for Further Research
This study was based on samples of young adult male and female athletes. It remains to be seen whether these data would generalize to other populations, such as non-athletes, adolescents, older adults, or those with ankle instability or other disabilities.
Conclusion
The multiple methods of assessing test re-test reliability applied to our two data sets as obtained from previous research indicate that the 25-response AMEDA was a reliable system for evaluating sensorimotor function in the lower limbs and may be an alternative to the more traditional 50-response protocol where lapses in participant attention from fatigue or other biases may be a concern. There are practical advantages to a shorter administration of this assessment for environments where time available for assessment is limited.
Footnotes
Declaration of Conflicting Interests
Professor Gordon Waddington is a founding shareholder in Prism Neuro Pty Ltd
Funding
The author(s) received no financial support for the research, authorship, and/or publication of this article.