
Abstract
The L Test has been developed to assess balance and gait disorders. Our aim in this study was to estimate the test-retest reliability and validity of the L Test when used with 82 persons with multiple sclerosis (PwMS). For these participants, we examined the degree of agreement between the results of a first and second administration of the L Test (separated by one day), using Bland-Altman analysis and intra-class correlation coefficients (ICCs). We computed minimal detectable change (MDC) and standard error of measurement (SEM) values for the L Test and evaluated concurrent validity by correlating L Test results with the Timed Up and Go test (TUG) and the 10-minute Walk Test (10MWT). Prior to administering these measurements, we randomized the sequence of the test administrations to our participants. The Bland–Altman analysis showed that L Test was reproducible, with upper and lower limits of agreement of 0.99 and −1.45 seconds, respectively. The L Test demonstrated excellent test–retest reliability, with an ICC value of 0.996 (95% CI: 0.994–0.998). Cronbach’s alpha coefficient was 0.996. The performance of the L Test is measured by seconds required to complete the task, and we found the L Test SEM value to be 0.35 seconds, and its MDC value to be 0.97 seconds. The L Test showed a strong correlation with both the TUG test (rho = 0.936; p < .001) and the 10MWT (rho = 0.925; p < .001). We concluded that the L Test is a reliable and valid \ tool for assessing functional mobility and balance in PwMS.
Introduction
Symptoms of multiple sclerosis (MS) include impaired lower extremity muscle strength, sensory, cerebellar, vestibular, and cognitive impairments; and these symptoms may be responsible for gait impairment and loss of balance (Rudroff & Proessl, 2018). Accordingly, persons with MS (PwMS) are prone to falls, with over 50% of MS patients displaying a history of falls (Matsuda et al., 2011). The impairment of gait and balance is one of the most disabling MS symptoms because it impacts mobility and quality of life for PwMS (Gil-González et al., 2020). To develop effective strategies for preventing or reducing falls, it is crucial to assess the various factors contributing to motor impairment and to accurately identify the underlying causes of falls (Matsuda et al., 2011; Peebles et al., 2018). Given the multifactorial basis of falls in PwMS, comprehensive evaluations are needed to assess gait and balance problems.
Effective interventions to minimize fall risk for PwMS rely first on these comprehensive multidimensional assessments of gait and balance abnormalities (Selgrade et al., 2020), and simple testing tools for this purpose can provide significant benefits in both research and clinical practice. Several such tools have been developed, including timed tests of walking speed or walking endurance. Paltamaa, West, Sarasoja, Wikström, and Mälkiä (2005) reported that the reliability or intra-class coefficient (ICC) for the 10-minute Walk Test (10MWT) was 0.91 (0.81–0.96) for normal walking speed and 0.95 (0.90–0.98) for maximal speed as a result of a three session evaluation method performed within a one-week interval with PwMS. Gijbels et al. (2012) demonstrated the validity of the Timed 25-foot Walk (T25FW), which shares with the 10MWT the task of walking a simple straight path for a relatively short distance. Nevertheless, Dalgas et al. (2012) noted that the 10MWT is not sufficiently reliable or valid when used with PwMS as the 10MWT exclusively assesses uncomplicated straight walking, which may limit its applicability to individuals with turning difficulties (Paltamaa et al., 2005). The 6-minute walk test (6MWT) has exhibited construct and discriminant validity for detecting PwMS, though administering this test may present challenges for some MS patients with limited walking capacity (Scalzitti et al., 2018). In the Timed Up and Go (TUG) test, the examinee must stand up from sitting in a chair, walk a distance of three meters, make a 180° turn around a cone, and then sit in a chair again (Scalzitti et al., 2018; Sebastião et al., 2016). The characteristics of the TUG test (e.g. from sitting to standing, walking and turning) are important measurements for activities of daily living and functional independence (Berg et al., 1992; Sebastião et al., 2016). The TUG test, with its established validity and reliability for PwMS, is often favored for assessing gait and balance (Martino Cinnera, Bisirri, Leone, Morone, & Gaeta, 2021; Scalzitti et al., 2018; Sebastião et al., 2016). Significant correlations were observed between the TUG test and the 2-Minute Walk Test (2MWT) (r = −0.911), the 6MWT (r = −0.922), usual gait speed (r = −0.911), and fast gait speed (r = −0.911) in a study conducted with PwMS (Scalzitti et al., 2018). The validity study of the TUG test as a measure of functional mobility among people with multiple sclerosis revealed significant correlations between the TUG test, the T25FW (r = 0.90), the 6MWT (r = −0.89), the Multiple Sclerosis Walking Scale-12 (r = 0.80), and average daily step count (r = −0.78) (Sebastião et al., 2016). Nevertheless, in these studies, the TUG test was proposed as a means of assessing both mobility and fall risk, given its simplicity and ease of use (Martino Cinnera et al., 2021; Sebastião et al., 2016). Longer completion times on the TUG test have been typically associated with decreased mobility and increased incidence of falls. However, the TUG test may lack the capacity to differentiate patients with varying stages of MS disease progression (Hershkovitz, Malcay, Grinberg, Berkowitz, & Kalron, 2019; Nilsagard et al., 2007; Sebastião et al., 2016). The TUG test only allows for turning in a preferred one-sided direction (Nguyen et al., 2007). For individuals affected by unilateral MS, it is crucial to assess rotation in both directions when evaluating balance and fall risk. Allowing PwMS to choose their preferred direction can obscure weakness that arises from muscle problems on only one side and features of turning during walking constitute significant factors in the determination of gait disorders and balance in PwMS (Adusumilli et al., 2018).
In a modified version of the TUG test, the L Test, the subject rises from the chair, traverses three meters to a cone, turns 90° to the right, continues walking seven meters to the next cone, turns 180° to the left around the cone, and then returns to the chair along the same path (Figure 1). In the L Test, gait and balance function is assessed by recording the time required for this sequence of movements (https://academic.oup.com/ptj/article/85/7/626/2804973). The original TUG test involved walking six meters, turning 180° (in the direction desired by the patient), sitting, and getting up from a chair (Sebastião et al., 2016). The L Test was developed to address the limitations of the TUG test, and it includes mandatory turns in both directions and, due to the relatively longer distance covered with the L Test, it may provide a more comprehensive assessment procedure in clinical practice than the TUG. Furthermore, the L Test necessitates 90° turns, which the TUG test does not (Deathe & Miller, 2005). This type of testing is important as it is understood that there are differences in trunk stabilization, range of motion, cadence, and stepping time between healthy people and PwMS, especially on the turning task (Weed et al., 2021). All these modifications may support potential advantages of the L Test for overcoming the limited sensitivity and ceiling effects of the TUG test. The L Test has shown satisfactory reliability when used with elderly individuals, individuals with amputations, individuals with chronic stroke, and individuals with Parkinson’s disease (Deathe & Miller, 2005; Haas et al., 2019; Kim et al., 2015; Nguyen et al., 2007). Furthermore, in elderly individuals, individuals with amputation, individuals with chronic stroke and individuals with Parkinson’s disease, the L Test was found to be positively correlated with the TUG test (Deathe & Miller, 2005; Haas et al., 2019; Kim et al., 2015; Nguyen et al., 2007). However, to the best of our knowledge, no researchers have yet examined the validity and reliability of the L Test when used with PwMS. Test-retest reliability is population-specific, making it essential to separately investigate the reliability of the L Test when used with this population. Therefore, our aim in this study was to estimate the test-retest reliability and concurrent validity of the L Test for PwMS. Schematic Diagrams of the (a) L Test and (b) TUG Test.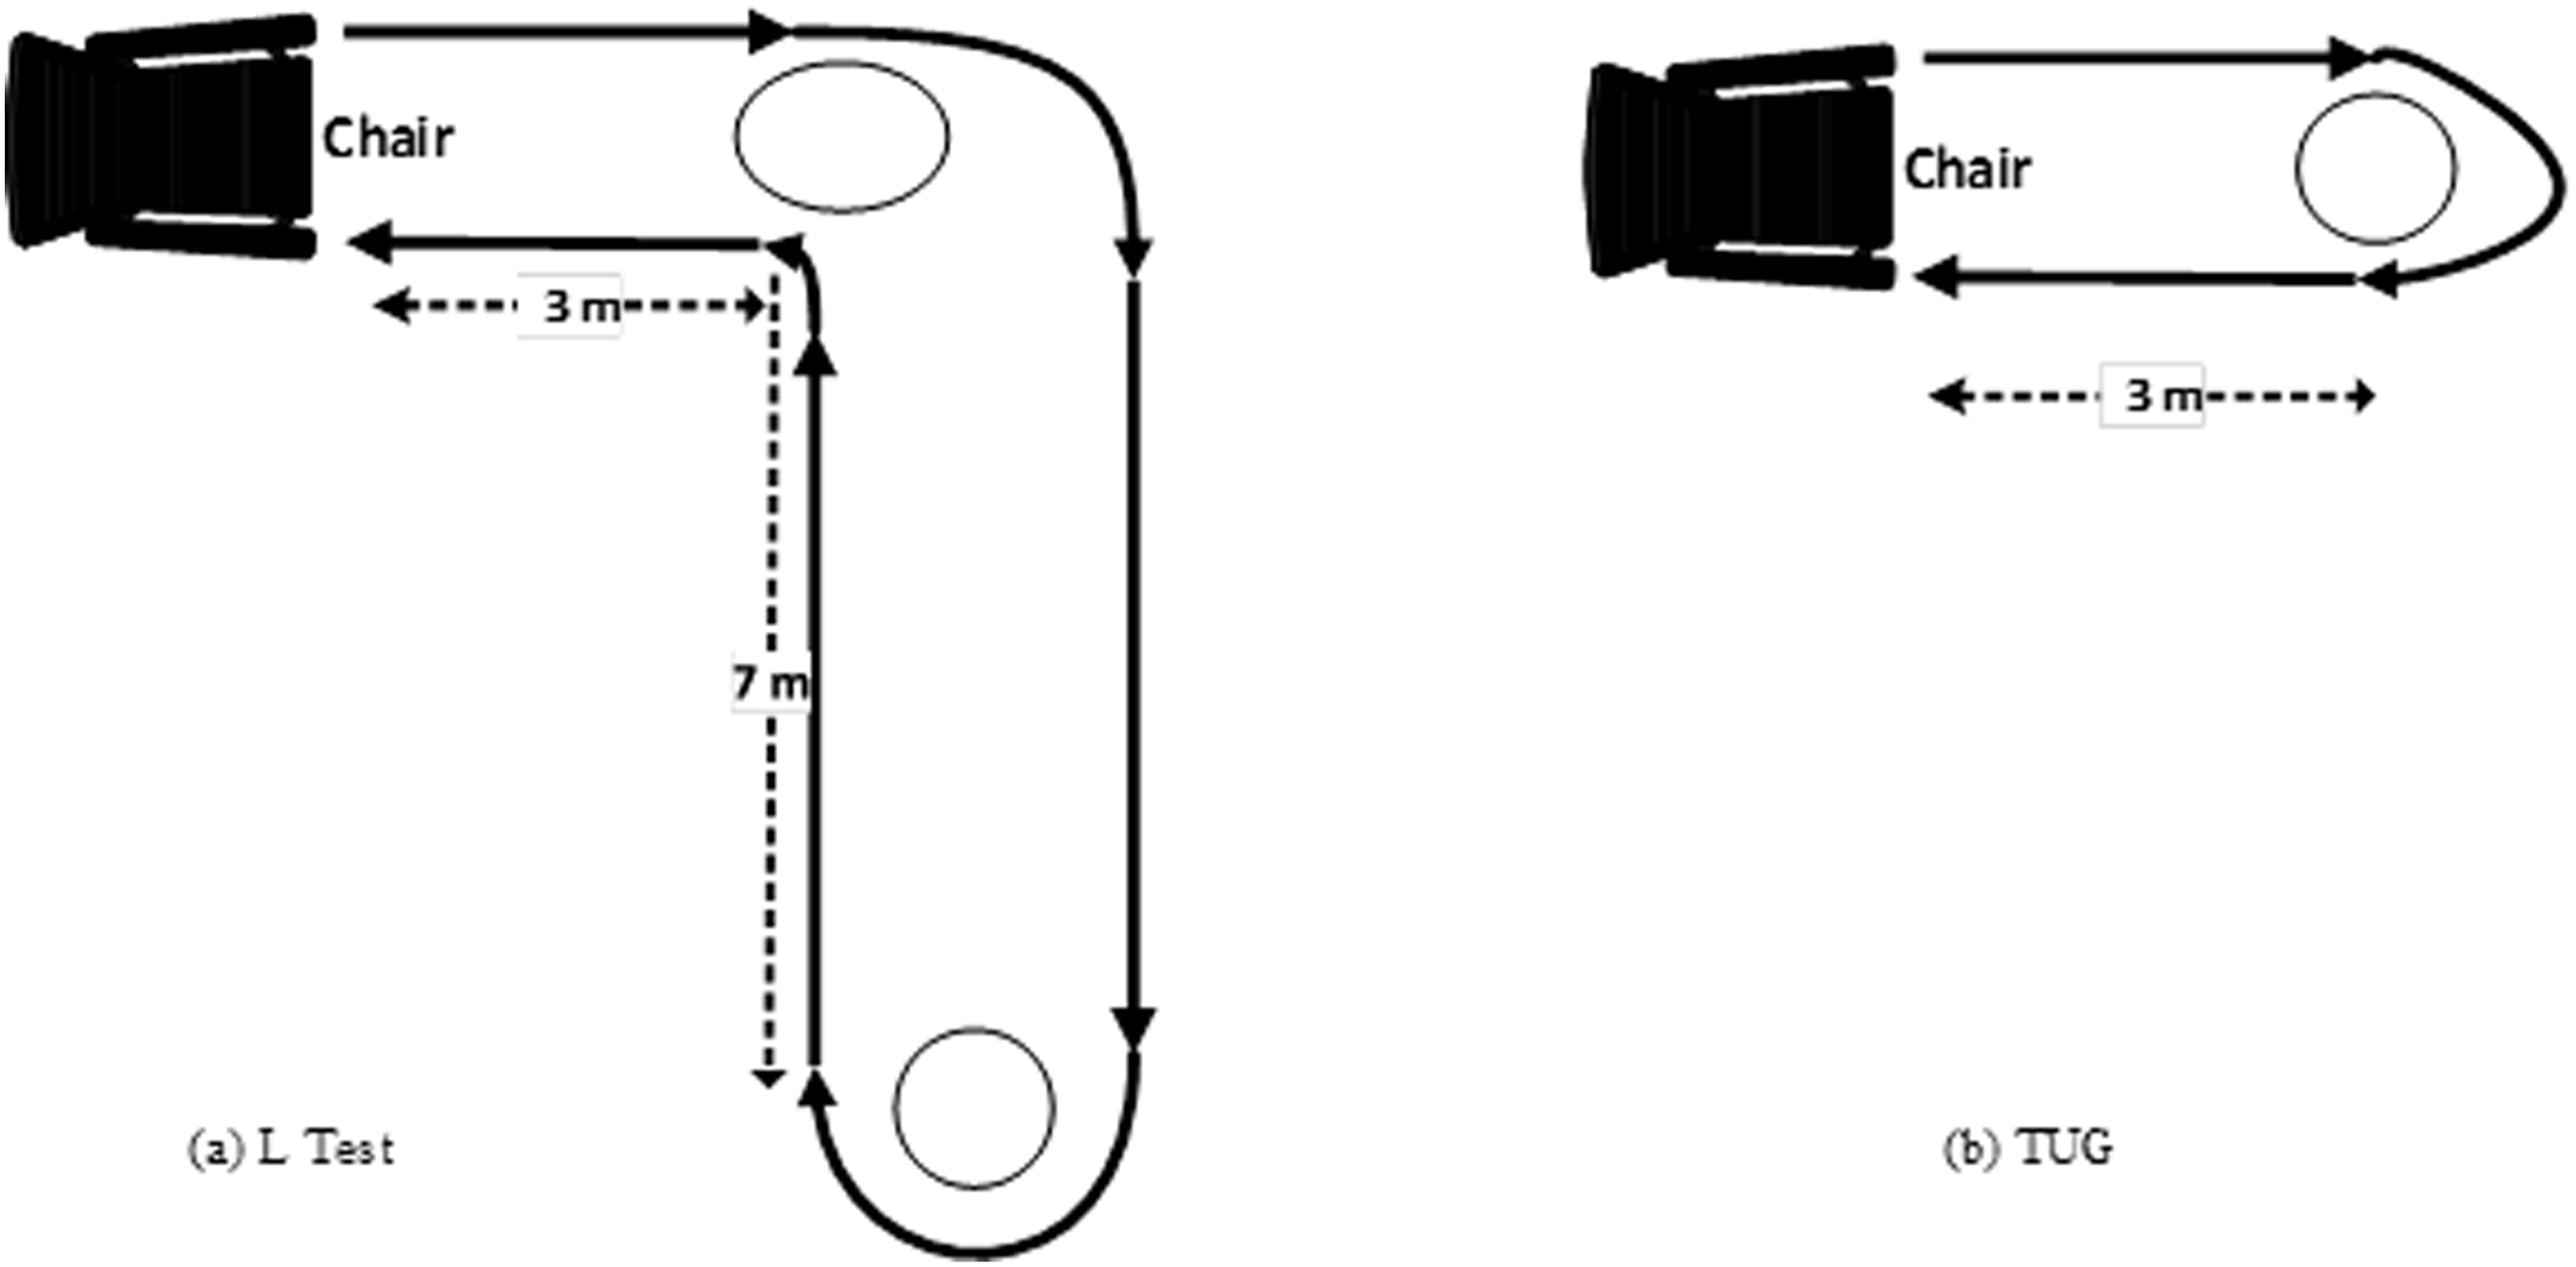
Method
Participants and Ethical Considerations
Participants’ Socio-Demographic Characteristics.
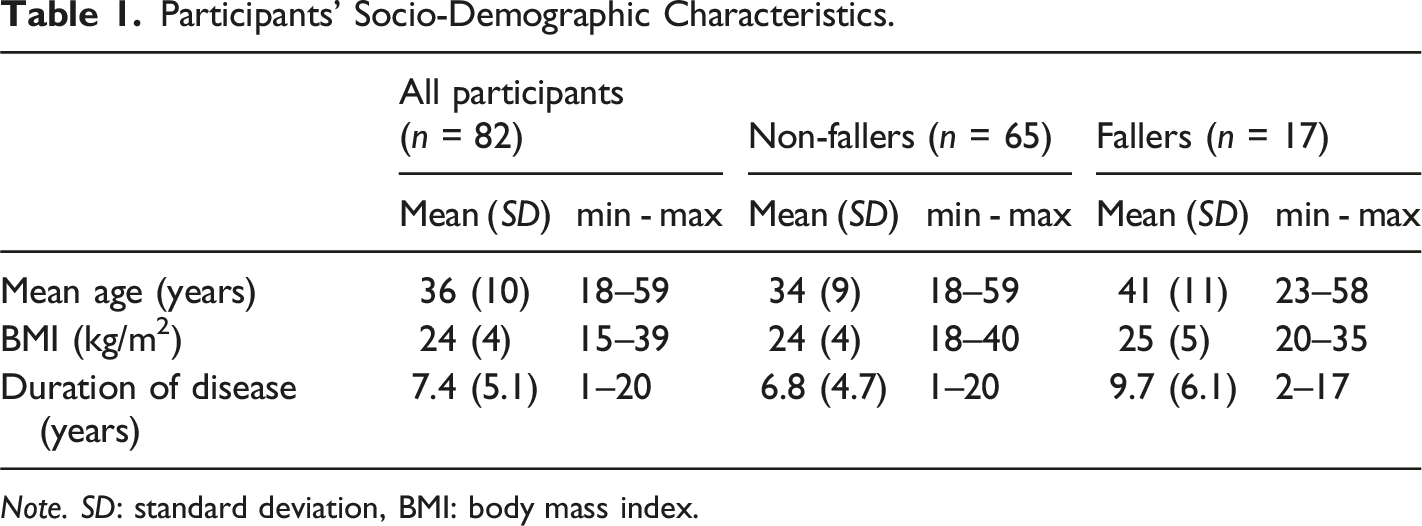
Note. SD: standard deviation, BMI: body mass index.
Study Design
We conducted this study using a “test-retest” and concurrent validity research design to examine the psychometric properties of repeating the L Test for patients with MS. Participants performed the L Test, TUG test, and 10MWT at least twice on each of two separate test days, one day apart. They performed outcome measurements with at least 1 minute of rest between trials and at least two minutes of rest between measurements. Before the measurements, we randomly determined the order of the tests (10MWT, L Test, and TUG test, respectively). All participants completed the tests consecutively (without switching to a different test) in this order. Prior to administering the tests, participants were provided with a standardized representation and description of the outcome measures. The same physiotherapist, using a high-precision stopwatch with hour, minute, second, and millisecond indicators, conducted all evaluations. To determine the test-retest reliability, the same physiotherapist conducted the initial assessment (test) and the subsequent follow-up assessment (retest). To minimize the potential for inter-rater error between evaluations, we deemed it preferable to collect data with the same evaluator. Chairs were placed close to the test area to ensure the participants’ safety. Prior to practice, all participants were allowed 1–2 practice trials. After trial administration, the mean times of the two assessments were used for data analysis.
Outcome Measurements
Timed up and Go Test (TUG)
The instructions provided to the participants in the TUG test were as follows: “Rise from a sitting position in a standard chair, walk 3 meters, turn 180°, walk back to the same chair, turn and sit down as quickly as possible (Figure 1).” In another test-retest study involving PwMS, the intraclass correlation coefficient (ICC) was 0.91 when the TUG test was administered twice, one week apart (Nilsagard et al., 2007). Nevertheless, the TUG test exhibited a robust correlation with other reliable measures of ambulatory mobility (Spearman rank correlation, r = 0.71–0.90) and disability status (r = 0.80), as well as a moderate to strong correlation with balance confidence (r = 0.66) (Sebastião et al., 2016).
L Test
The L Test is an extended version of the TUG test. The time the participant got up from the chair, walked three meters, turned 90° to the right, continued to walk another seven meters, turned 180° left around the cone, then returned from the same path and sat down was meticulously recorded (Figure 1). The recording period commenced with the command “Go” and culminated when the participant’s back touched the chair’s backrest. Before the actual test, the L evaluator demonstrated the task (Haas et al., 2019; Kim et al., 2015). In a study of individuals with chronic stroke, the L test demonstrated excellent intra-rater (ICC = 0.99) and inter-rater reliability (ICC = 0.99) (Kim et al., 2015).
10-minute Walk Test
For the 10-minute Walk Test, participants were instructed to walk continuously on a 14-meter path without either running or stopping. Timing began when the participant’s first foot crossed the two meter mark and ended when their first foot passed the 12 meter mark. However, the participant continued walking until the 14 meter mark. No incentives were provided during testing (Dalgas et al., 2012). In the 10MWT test-retest study, the intraclass correlation coefficient (ICC) was previously found to be 0.98 when the 10MWT was administered on consecutive trials (Peters et al., 2013). However, the 10MWT test was significantly correlated (r = 0.876) with the 6MWT (Gijbels et al., 2012).
Statistical Analysis
We conducted all data analyses using the Statistical Package for the Social Sciences (SPSS, Version 23.0) (IBM Corp., Armonk, NY, USA). We used the Kolmogorov-Smirnov test to determine that the variables did not show a normal distribution (p < .05). The Spearman rank-order correlation is a statistical method that is commonly used for ordinal variables and for some nonlinear relationships. It is also recommended as an alternative to the Pearson correlation when normality is violated (Field & Miles, 2010; Pagano, Gauvreau, & Mattie, 2022; Triola et al., 2004). The Spearman rank-order correlation can be conceptualized as a Pearson correlation that has undergone a transformation into a flat distribution of ranks (i.e. the histogram of the ranks will be flat in the absence of ties). In a study comparing Pearson and Spearman correlation coefficients across distributions and sample sizes, using simulations with low (N = 5) to high (N = 1000) sample sizes, the Person correlation coefficient and Spearman correlation coefficient were found to have analogous expected values for normally distributed variables; however, the Spearman coefficient was more variable, particularly when the correlation is strong (de Winter et al., 2016). For this reason, we selected the Spearman correlation analysis, a non-parametric analysis, as the preferred method. According to Lexell and Downham (2005), 30-50 participants should be sufficient for adequate statistical power in reliability studies. In studies examining reliability and validity in neurological diseases, sample sizes of at least 20 for reliability and at least 80 for validity have yielded estimates that are highly representative of the main study samples (Hobart et al., 2012). Considering this recommendation, we recruited 82 MS patients in this study.
We investigated the degree of agreement of the L-test measurements between testing occasions one and two using the ‘limits of agreement’ method described by Bland and Altman (Bland & Altman, 1986). We used Cronbach’s alpha as a measure of internal consistency, and we used the intra-class correlation coefficient (ICC) as a measure of test-retest reliability. Reliability was considered poor if the ICC was <0.50, moderate if ICC was 0.50–0.74, good if ICC was 0.75–0.89 and excellent if ICC was >0.89 (Koo & Li, 2016).
We next investigated the concurrent validity of the L Test by comparing the L Test with the TUG and the convergent validity of the L Test by comparing the L Test with the 10MWT. The assessment of correlations was conducted using the Spearman correlation test. Correlations were considered negligible if they were between zero and 0.20, weak if 0.21–0.40, moderate if 0.41–0.60, strong if 0.61–0.80, and very strong if 0.81–1.00 (Prion & Haerling, 2014).
Standard error of measurement (SEM) is an estimate of random variation that occurs when measuring. It can be calculated from the ICC. The minimal detectable change (MDC) is the minimum amount of change that can be observed in a group or individually. The MDC can be calculated from the SEM. The SEM and MDC values for the L Test were calculated using the following formula: MDC95% = 1.96 * SEM * √2; SEM = SD√ (1-ICC).
Results
Participants’ Clinical Characteristics.
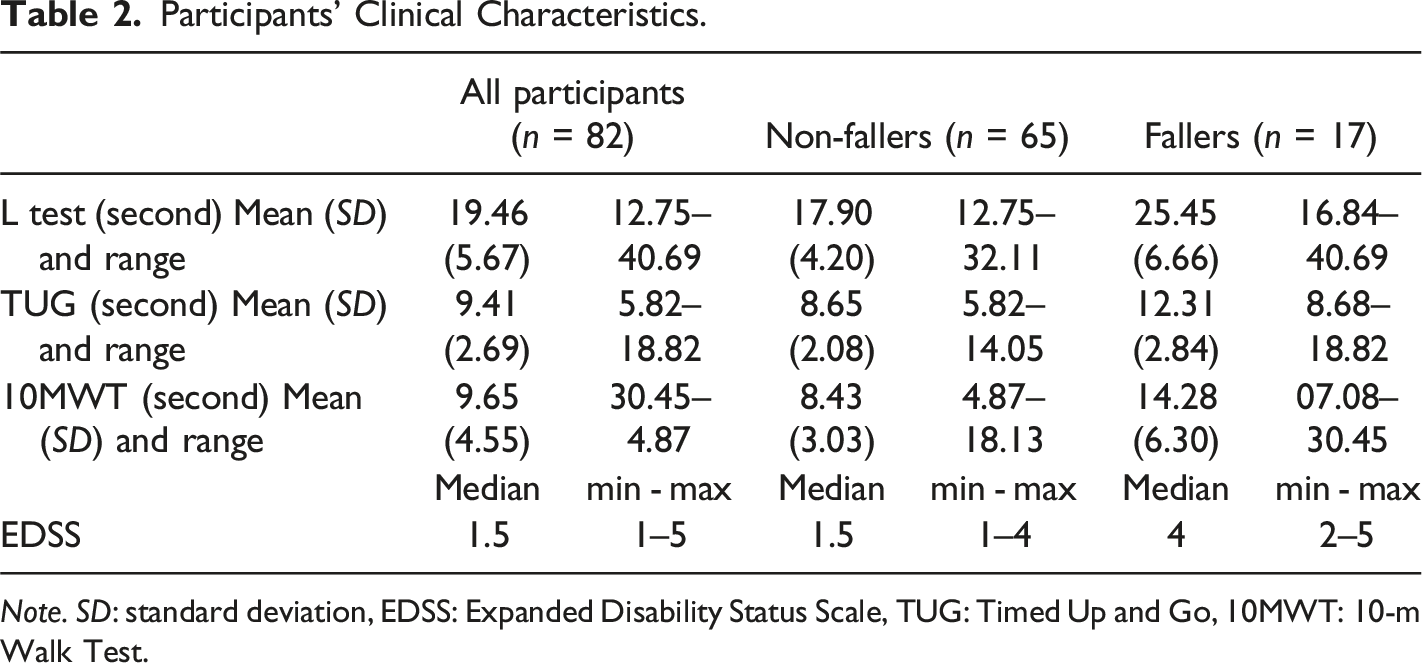
Note. SD: standard deviation, EDSS: Expanded Disability Status Scale, TUG: Timed Up and Go, 10MWT: 10-m Walk Test.
Considering the L Test, the combined mean L Test score between the mean value at the initial assessment and the mean value one day later was 19.35 seconds. Figure 1 shows the L Test test-retest degree of agreement in a Bland–Altman analysis for time in seconds on the L Test as performed by the 82 PwMS in this study. The L Test scores were consistent or reproducible across two administrations separated by one day, with upper and lower limits of agreement of 0.99 and −1.45 seconds, respectively, on Bland–Altman analysis (bias = −0.23). The bias of the Bland-Altman test indicates that the second day’s performance tended to be slightly slower than the first day’s performance (Figure 2). The mean L Test duration was 62 seconds in elderly individuals, 32.9 seconds in individuals with amputation, 60 seconds in individuals with chronic stroke and 35.46 seconds in individuals with Parkinson’s disease (Deathe & Miller, 2005; Haas et al., 2019; Kim et al., 2015; Nguyen et al., 2007). As we included individuals with mild MS, the mean L value (19.35 seconds) performed relatively well in comparison to other groups. However, the reproducibility of the L Test among participants with a high L Test duration (>30 seconds) is uncertain, based on the limits of agreement (with a high L-test duration indicative of poor performance). Bland–Altman Plot of the L Test for PwMS.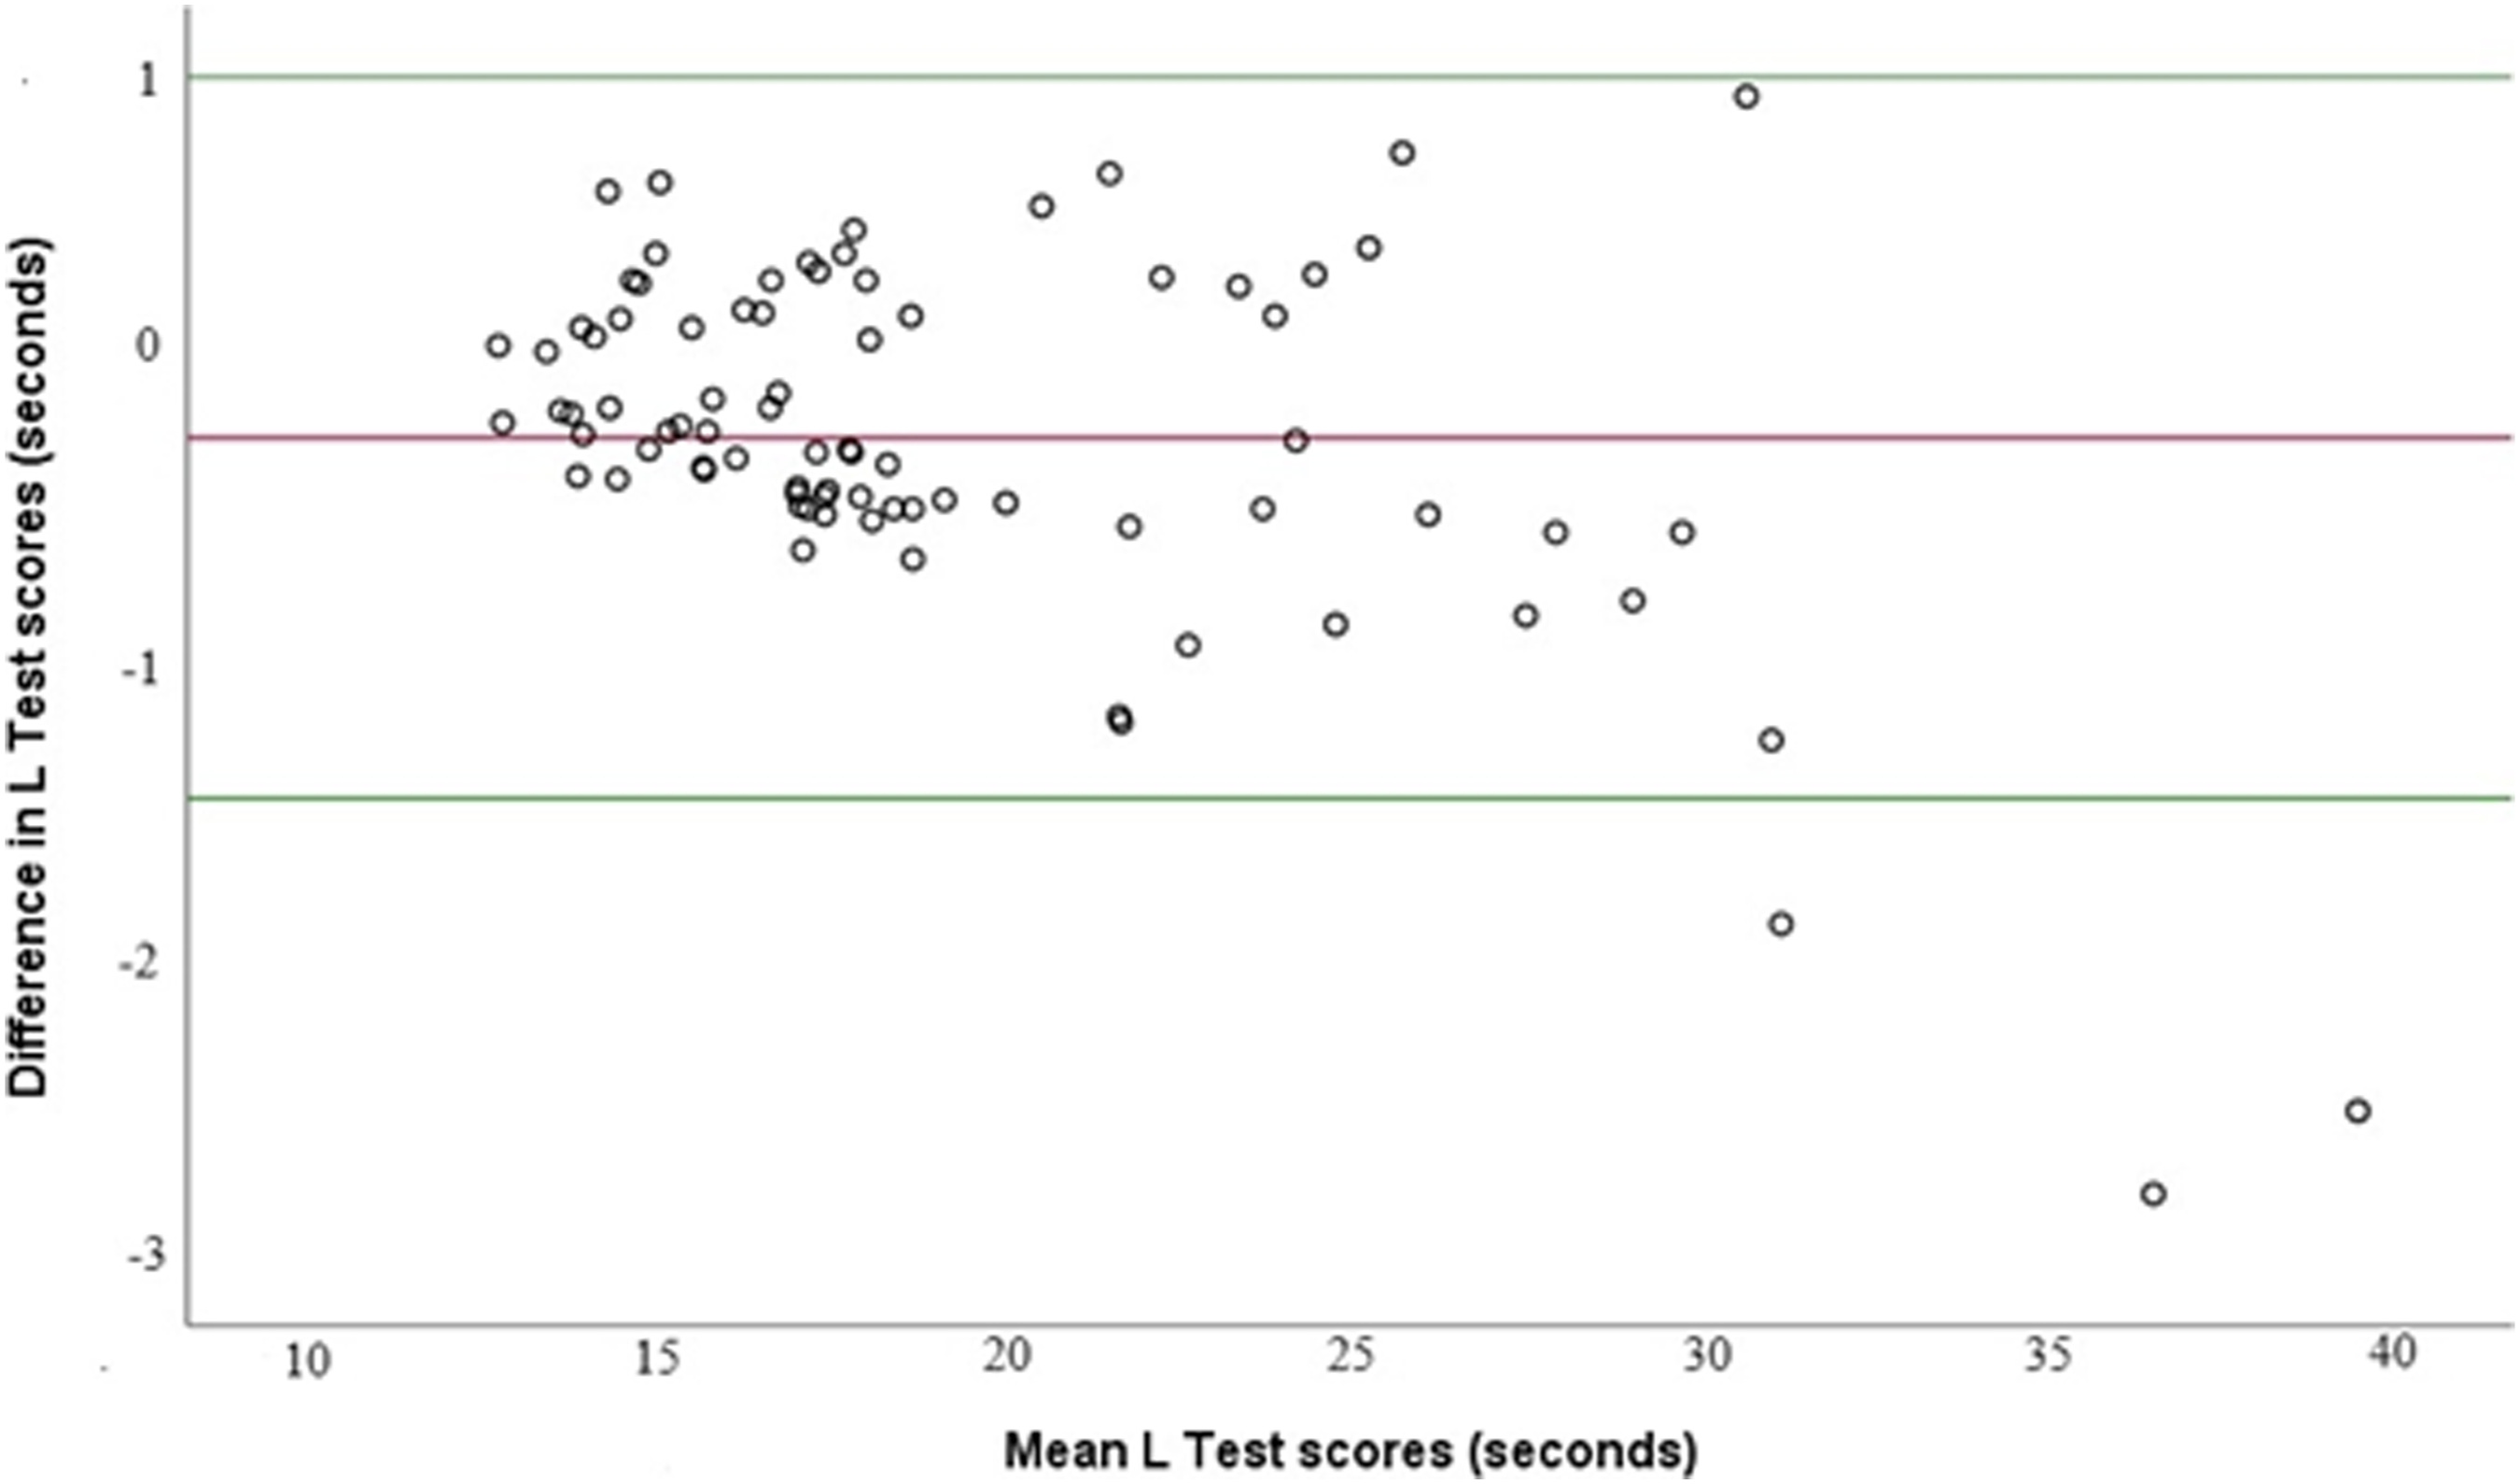
L Test Psychometric Properties.
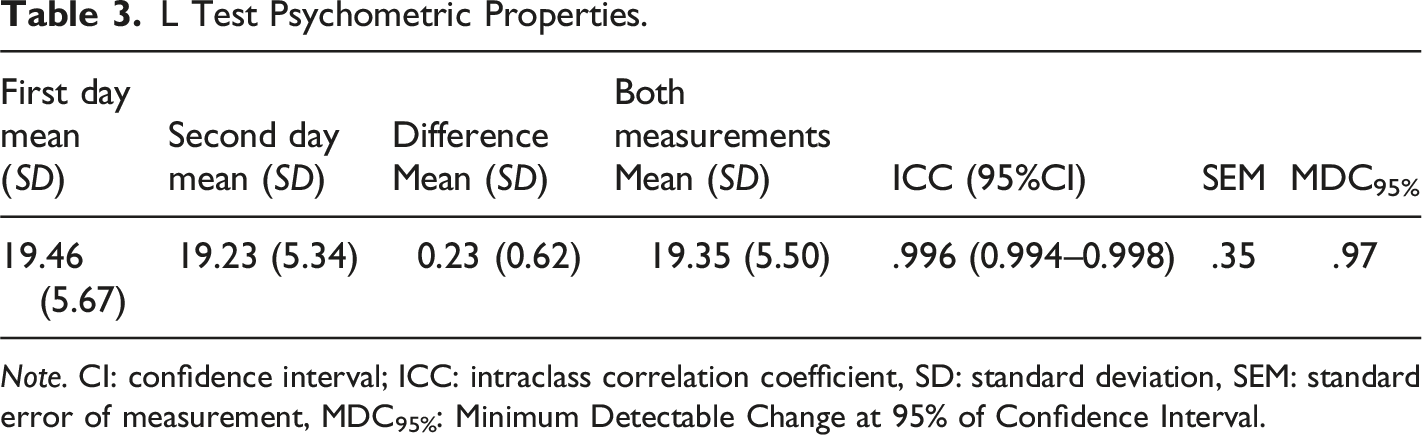
Note. CI: confidence interval; ICC: intraclass correlation coefficient, SD: standard deviation, SEM: standard error of measurement, MDC95%: Minimum Detectable Change at 95% of Confidence Interval.
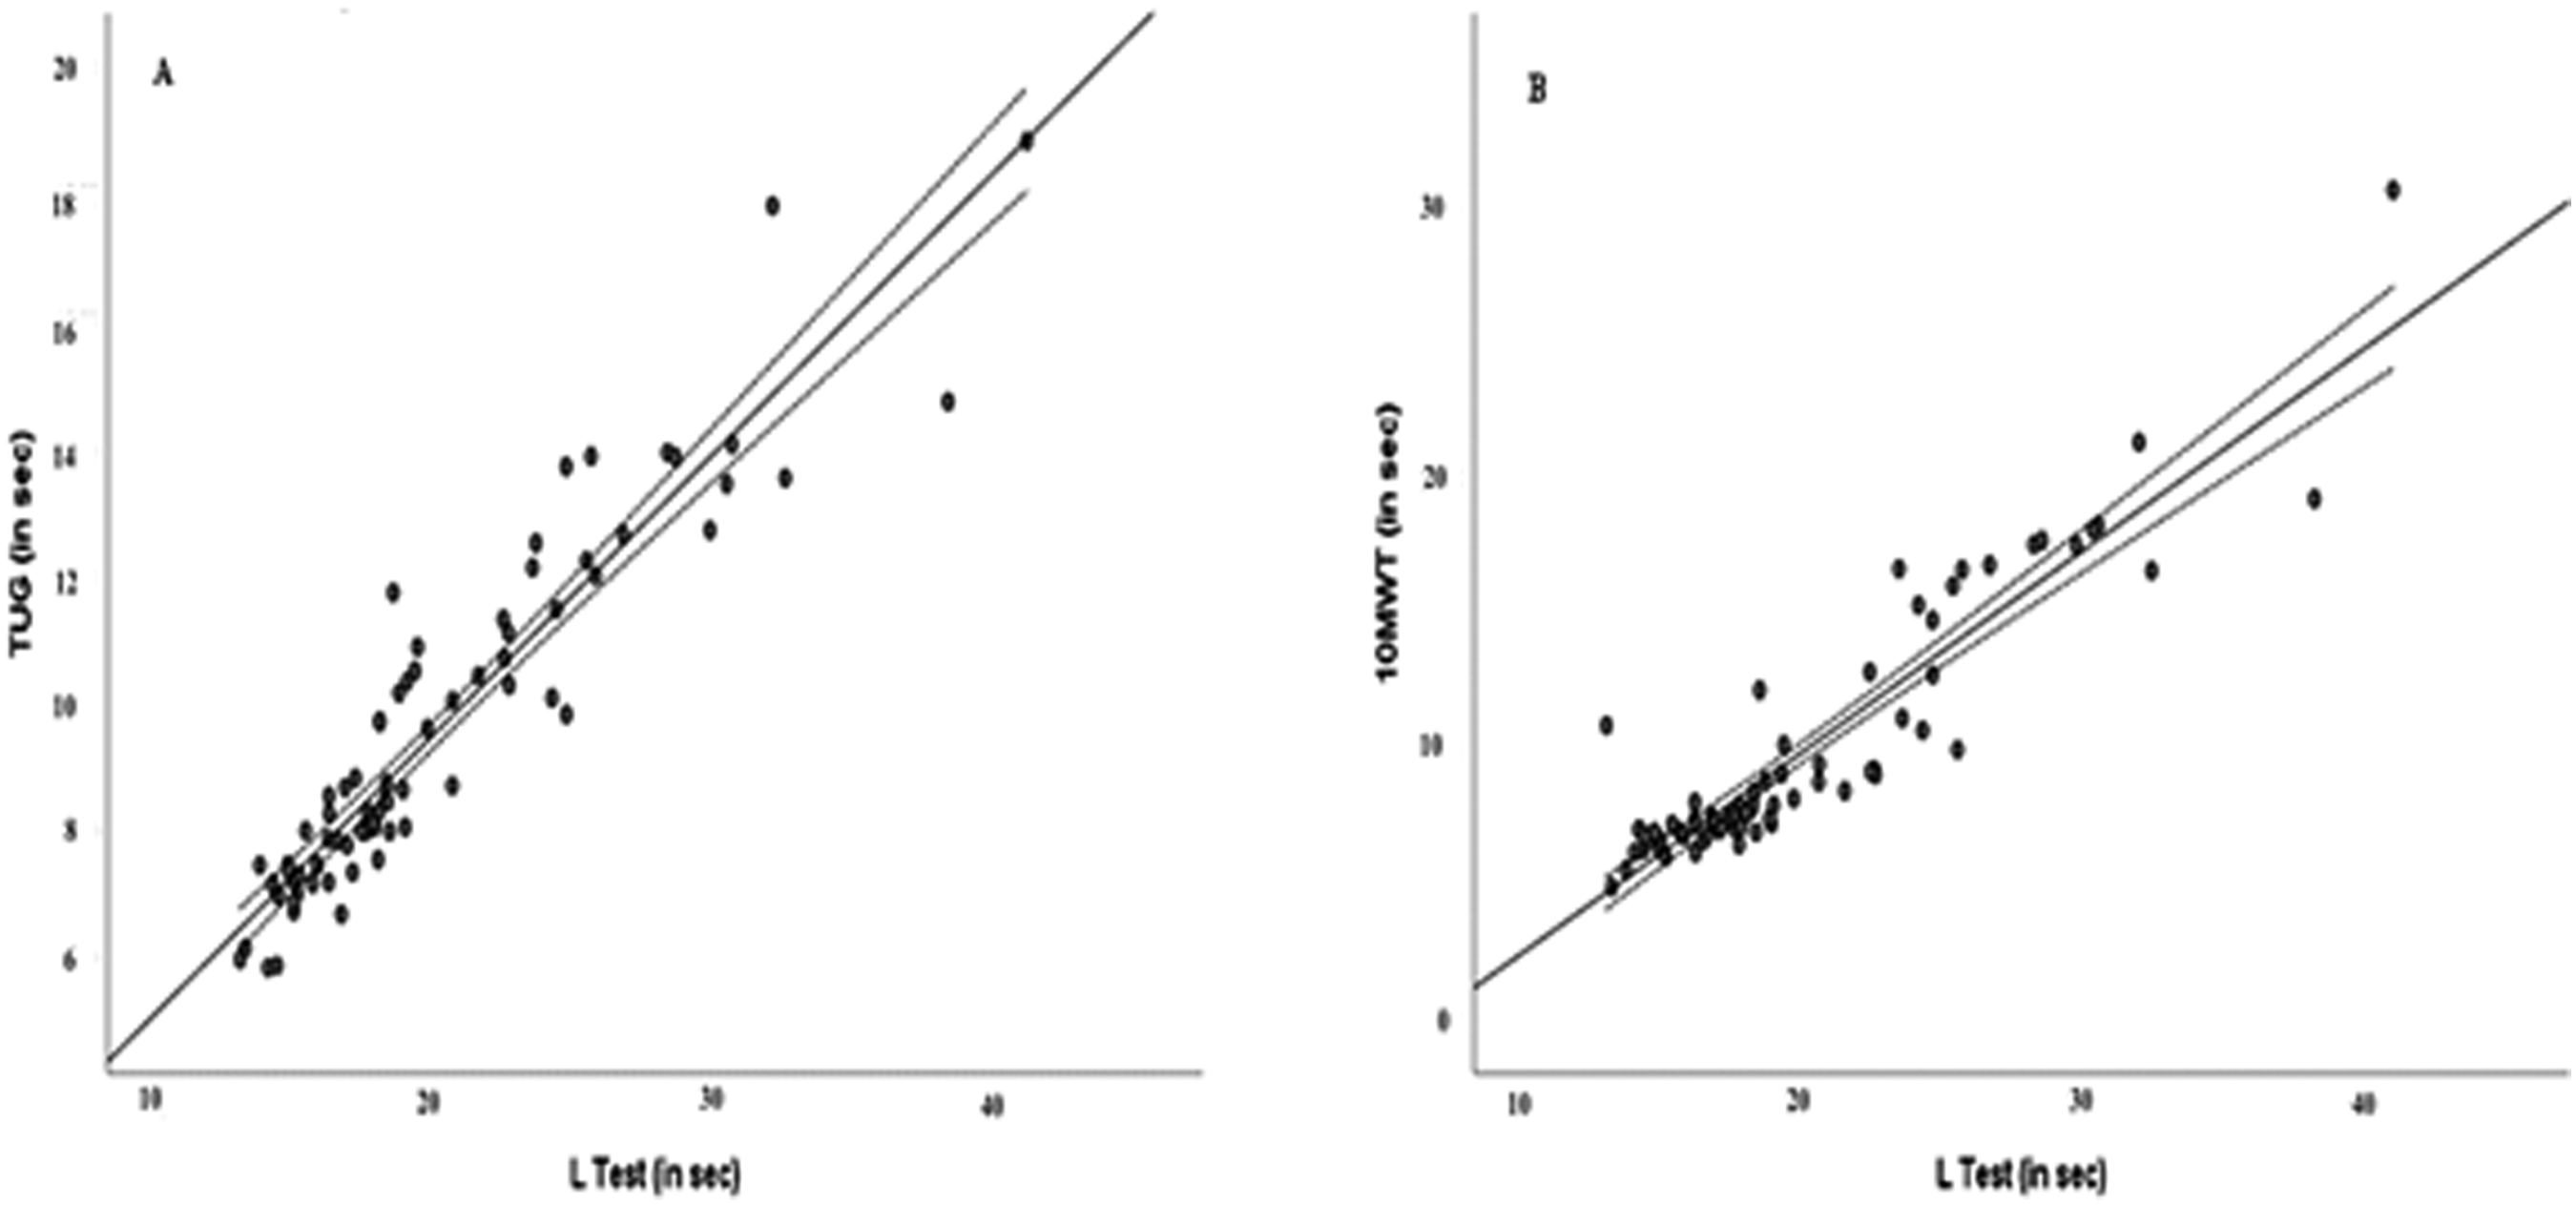
Relationships Between L Test and (a) TUG test and (b) 10MWT.
Discussion
In the present study, we demonstrated the validity and short-term reliability of the L Test among 82 PwMS. When ascertaining the effectiveness of gait practice or detecting changes in the patient’s current condition, outcome measures are valid and reliable. To our knowledge, this study was the first to examine the validity and reliability of the L Test among PwMS.
We included only PwMS with an EDSS value of 5 or less. The upper limit for independent walking in persons currently diagnosed with MS is an EDSS score of 6 (Kurtzke, 1983). We investigated the validity and reliability of the L Test in a homogeneous MS group. Neurodegeneration caused by MS can also lead to falls, functional mobility disturbances, and demyelination. The evaluation of balance and walking skills in PwMS is important for both the planning of preventive treatments and the implementation of interventions for the current disability/disabilities (Coote et al., 2020). In PwMS, the ability to maintain balance and control of the body’s position during turning movements has been identified as a crucial aspect of functional mobility (Adusumilli et al., 2018; Weed et al., 2021). An evaluation of turning in both directions on the L Test may yield a more precise and authentic assessment of balance and fall risk than the TUG test, particularly in individuals with unilaterally impaired MS (Hershkovitz et al., 2019; Nguyen et al., 2007). For this reason, we think that it is important to demonstrate the reliability and validity of the L Test for PwMS.
Balance and gait disorders in PwMS have been frequently evaluated with the TUG test, 10MWT, 2MWT, T25FW test and 6MWT (Bennett et al., 2017; Dalgas et al., 2012). Studies among PwMS have shown that these tests have satisfactory reliability (TUG ICC: 0.97; 2MWT ICC: 0.96′ T25FW ICC: 0.86; and 6MWT ICC: 0.97) (Bennett et al., 2017). The L Test (ICC: 0.996) also demonstrated excellent intra-rater reliability among these participants. To assess the validity of the L Test, when used in clinical assessments of balance and gait, we compared L Test results to TUG test and 10MWT results. Based on the correlation analysis, a very strong correlation emerged between the L Test and both the TUG test and 10MWT. We calculated the SEM and MDC of the L Test to be 0.35 and 0.97 seconds, respectively. To ascertain the efficacy of treatments for improving the balance and ambulatory abilities of PwMS, an improvement of at least 0.97 seconds should be observed in the L Test. In other validation studies of the L Test among other patient groups, the MDC values were 4 seconds and 4.35 seconds for individuals with chronic stroke and Parkinson’s disease, respectively, while the SEM value was 3 seconds among individuals with amputation (Deathe & Miller, 2005; Haas et al., 2019; Kim et al., 2015). Given the absence of investigation into SEM and MDC values for the L Test in MS patients, we compared our results with those of other patient groups. According to our Bland-Altman plot of agreement, the participants’ scores across two measurement events separated by one day showed a high degree of agreement. However, the disagreement between performance on days 1 and 2 was much greater for those who took much longer to perform the L Test (>30 seconds). While this is consistent with findings from other validation studies (Deathe & Miller, 2005; Kim et al., 2015; Rietberg et al., 2014), it is known that daily variations in these skills may vary between 30% and 53% on the T25FW, 5-repetition sit-to-stand test, 2MWT, Multiple Sclerosis Walking Scale-12 and 10MWT measurements, which have been frequently used in PwMS (Learmouth et al., 2013). Therefore, the functional discrepancies we observed in PwMS who were slow to complete the test over two administrations completed in a brief time interval are consistent with the existing literature.
Our estimations of SEM and MDC values in the context of rehabilitation enable clinicians and researchers to assess the precision of individual outcome measurement in gait abilities and to observe changes in measurements over time. In clinical practice, SEM and MDC values can be considered important references for following up PwMS. In a recent validity and reliability study of the Figure of 8 Walk Test performed by PwMS with EDSS values between 1 and 4, SEM and MDC values were 0.38 seconds and 1.04 seconds, respectively (Katirci Kirmaci, Adiguzel, Erel, Inanç, & Tuncel Berktas, 2023). In a separate investigation involving PwMS with an EDSS value of 4 or below, the MDC value of the TUG test was 1.3 seconds (Valet et al., 2019). In a study conducted on 62 participants with an EDSS median value of 3.5, the SEM value of the T25FWT was 1 second and of the MDC was 2.7 seconds (Learmonth et al., 2013). In another study, the SEM for T25FW and TUG were 4.56 seconds and 3.81 seconds, respectively. However, individuals with EDSS values between 5 and 6.5 were included in this study. For this reason, the SEM values were considered quite high (Learmonth et al., 2012). Especially in past studies, SEM and MDC values changed according to the participants’ EDSS values. In our study, our inclusion of a greater number of individuals with low EDSS values (median EDSS 1.5) may explain the observed reduction in SEM and MDC values.
Limitations and Directions for Further Research
Among this study’s limitations was that 20.7% of our participants had a history of falling, possibly affecting the homogeneity of our results. Second, we included individuals with EDSS ≤5 and patients with the RRMS and SPMS types of MS, limiting our ability to generalize these results to patients with other types of MS or individuals with high levels of disability. Third, these results may have been affected by learning effects, given that the participants underwent a trial test and a repetitive testing procedure during actual data collection. Fourth, we did not compare the L Test to the T25FW test, which is widely preferred for evaluating the walking and balance abilities of PwMS. We conducted a small number of evaluations to not fatigue the participants. Fifth, we did not include data for subscores of the EDSS in this study, meaning that cerebellar and gait subscores could not be analyzed with our results. Sixth, all data were collected from a single clinic by a single physiotherapist specializing in MS. The same level of reliability cannot be assumed for less experienced physiotherapists or other healthcare professionals. Additional research with a larger and more heterogeneous MS sample in various settings is needed to confirm these findings and improve their generalizability. Seventh, we conducted the tests on two consecutive days, meaning that there is uncertainty regarding the reproducibility of repeat testing more than one day apart. Finally, while our findings indicate that the L Test is a valid and reliable assessment tool over a short time interval in PwMS, they do not provide insight into the advantages and disadvantages of the L Test over the TUG test or inform us regarding longer test-retest intervals.
Conclusion
In this study we demonstrated for the first time that the L Test is a valid and reliable measurement tool for measuring functional mobility (gait) and balance ability in PwMS in a short two-day time period. While further follow on research with larger and more diverse samples and with longer test-retest intervals is needed, these data show that the L Test is a practical, inexpensive, and safe assessment method that clinicians or researchers can use to assess the balance and walking ability of PwMS.
Footnotes
Acknowledgments
We would like to thank all the participants and hospital staff for their cooperation.
Declaration of Conflicting Interests
The author(s) declared no potential conflicts of interest with respect to the research, authorship, and/or publication of this article.
Funding
The author(s) received no financial support for the research, authorship, and/or publication of this article.