
Abstract
The study of exercise dependence, or as we prefer, problematic physical activity (PPA), faces both theoretical and methodological challenges. Different factorial solutions were obtained for the widely used Exercise Dependence Scale-Revised (EDS-R), leading us to question both its latent underlying construct and the interpretation of its factor solutions. Through confirmatory factor analysis (CFA) and the use of a bifactor model (BCFA), we assessed the dimensionality of a French version of the EDS-R. We recruited 745 students from Paris Nanterre University, but we removed 88 responses (16.8%) to retain only those who (a) engaged in a moderate to high levels of physical activity, according to the Global Physical Activity Questionnaire (GPAQ; N = 494; 9.5%), and (b) completed the EDS-R. We used a final sample of 435 students (58.4% of the total population) for a factorial analysis of the EDS-R. We conducted a three-step CFA in Mplus, producing three models: (a) unidimensional, (b) second-order, and (c) bi-factor (BCFA). The results of the BCFA indicated that most EDS-R items were better indicators of a general factor than their respective group factors, except for the second factor measuring a withdrawal construct. These results add to an ongoing debate in the field of behavioral addiction as to how to better conceptualize and measure exercise dependence or PPA. Withdrawal appears to have a special position in this debate, since our BCFA suggested that it is the only specific sub-dimension of the EDS-R scale.
Introduction
Excessive physical activity, also known as exercise addiction or compulsive exercise, refers to a condition in which an individual engages in intense exercise routines to the point that they begin to negatively impact physical and mental health (Hausenblas & Downs, 2002a). While exercise is generally considered to be beneficial for overall health (INSERM, 2019), excessive physical activity can lead to a range of negative consequences, such as injuries, exhaustion, and social isolation. Excessive amounts of PA (frequency and/or intensity and/or duration) can have known negative effects on health (Eijsvogels & Thompson, 2015; O’Keefe & Lavie, 2013; Rao et al., 2018; Wasfy & Baggish, 2016). O’Keefe & Lavie (2013) have shown the effects of excessive physical activity on the heart, leading to accelerated aging, calcification of the coronary arteries, diastolic ventricle dysfunction, and cardiac fibrosis. Other researchers have highlighted the risks of injuries, illnesses, overtraining syndrome (Schwellnus et al., 2016; Soligard et al., 2016), burnout (Gustafsson et al., 2017), eating disorders (El Ghoch et al., 2013), and more severe pain in people who are so engaged in problematic physical activity that they are suspected of exercise addiction when they are compared to people who are not dependent on physical activity (Lichtenstein et al., 2014). Exercise addiction is more prevalent among individuals who have a history of eating disorders, anxiety, or depression, and it can be triggered by factors such as societal pressure to maintain a certain body shape or size (Hausenblas & Downs, 2002a). Franques et al. (2001) found two major risk factors for excessive physical activity: doping and exercise addiction. While the latter is of particular interest in this study, we prefer the term ‘problematic physical activity” (PPA), after noting 11 different terms in the literature to describe this same phenomenon (Kern, 2007). PPA is measured with scales called compulsions (e.g., Compulsive Exercise Test; Meyer et al., 2016), dependence (e.g., Exercise Dependence Scale-R; Hausenblas & Downs, 2002b) or addiction (e.g., Exercise Addiction Inventory; Terry et al., 2004, 2019) that often have common item content and dimensions. Hagger (2014) warned against this profusion of descriptive words and underlying definitions in discussing the same phenomenon in psychology, as this contributes to ambiguity and a feeling of ‘déjà vu’ (Hagger, 2014) from having encountered a variable named differently with almost identical definitions and characteristics.
This common perspective across terms helps the term PPA fall comfortably within the field of behavioral addictions, like gambling disorders; but, due to a lack of sustained, methodologically rigorous evidence for PPA as a morbid condition, it is not listed as a disorder in the Diagnostic and Statistical Manual of Mental Disorders – Fifth Edition (DSM-5) (American Psychiatric Association, 2013; Szabo et al., 2015). Therefore, we cautiously refer to excessive exercise as PPA rather than “exercise addiction” or “exercise dependence.” Goodman (1990) defined addiction as a combination of a physiological addiction and a behavioral compulsion. Goodman described an addiction as when a behavior is performed to reach a pleasant internal state (positive reinforcement), while compulsion refers to a stereotyped, ritualized behavior that relieves negative tension (negative reinforcement). Thus, addiction is a compulsive dependency that regulates the person’s internal state, either by providing pleasure or by reducing (or avoiding) negative tensions (or affects). Goodman later (2008) characterized addiction by repetitive failures to control the behavior on one hand, and by the continuation of said behavior, despite significant negative consequences, on the other. In this paper, we use the term PPA, because it encapsulates such varied descriptions of exercise as excessive, obligatory, compulsive, fanatic, addictive, and dependent. We agree with Szabo and Egorov’s definition that describes exercise addiction as a morbid pattern of habitual behavior in which the individual loses control over their PA habits and acts compulsively, exhibiting dependence and experiencing negative consequences on both their health and social/professional life (Szabo & Egorov, 2015). PPA is also linked to an irresistible urge to continue exercising despite injuries, fatigue, or other personal obligations. Consistent with these characteristics, we retained seven clinical signs of PPA: (a) tolerance - the need to increase the quantity to get the desired effect; (b) withdrawal symptoms during periods without physical activity, including psychological effects such as anxiety and physical effects such as tiredness, which decrease when the PA starts again; (c) intention or doing the activity more frequently or for longer than intended; (d) lack of control or persistent craving or ineffective attempts to control the level of activity; (e) time spent, corresponding to the time devoted to physical activity, including transport, buying equipment, etc.; (f) neglect of other activities, social, familial and professional; and (g) continuance or a compulsion to continue the activity despite persistent or recurring physical or psychological problems (Hausenblas & Downs, 2002a).
Different Validations of the EDS-R.
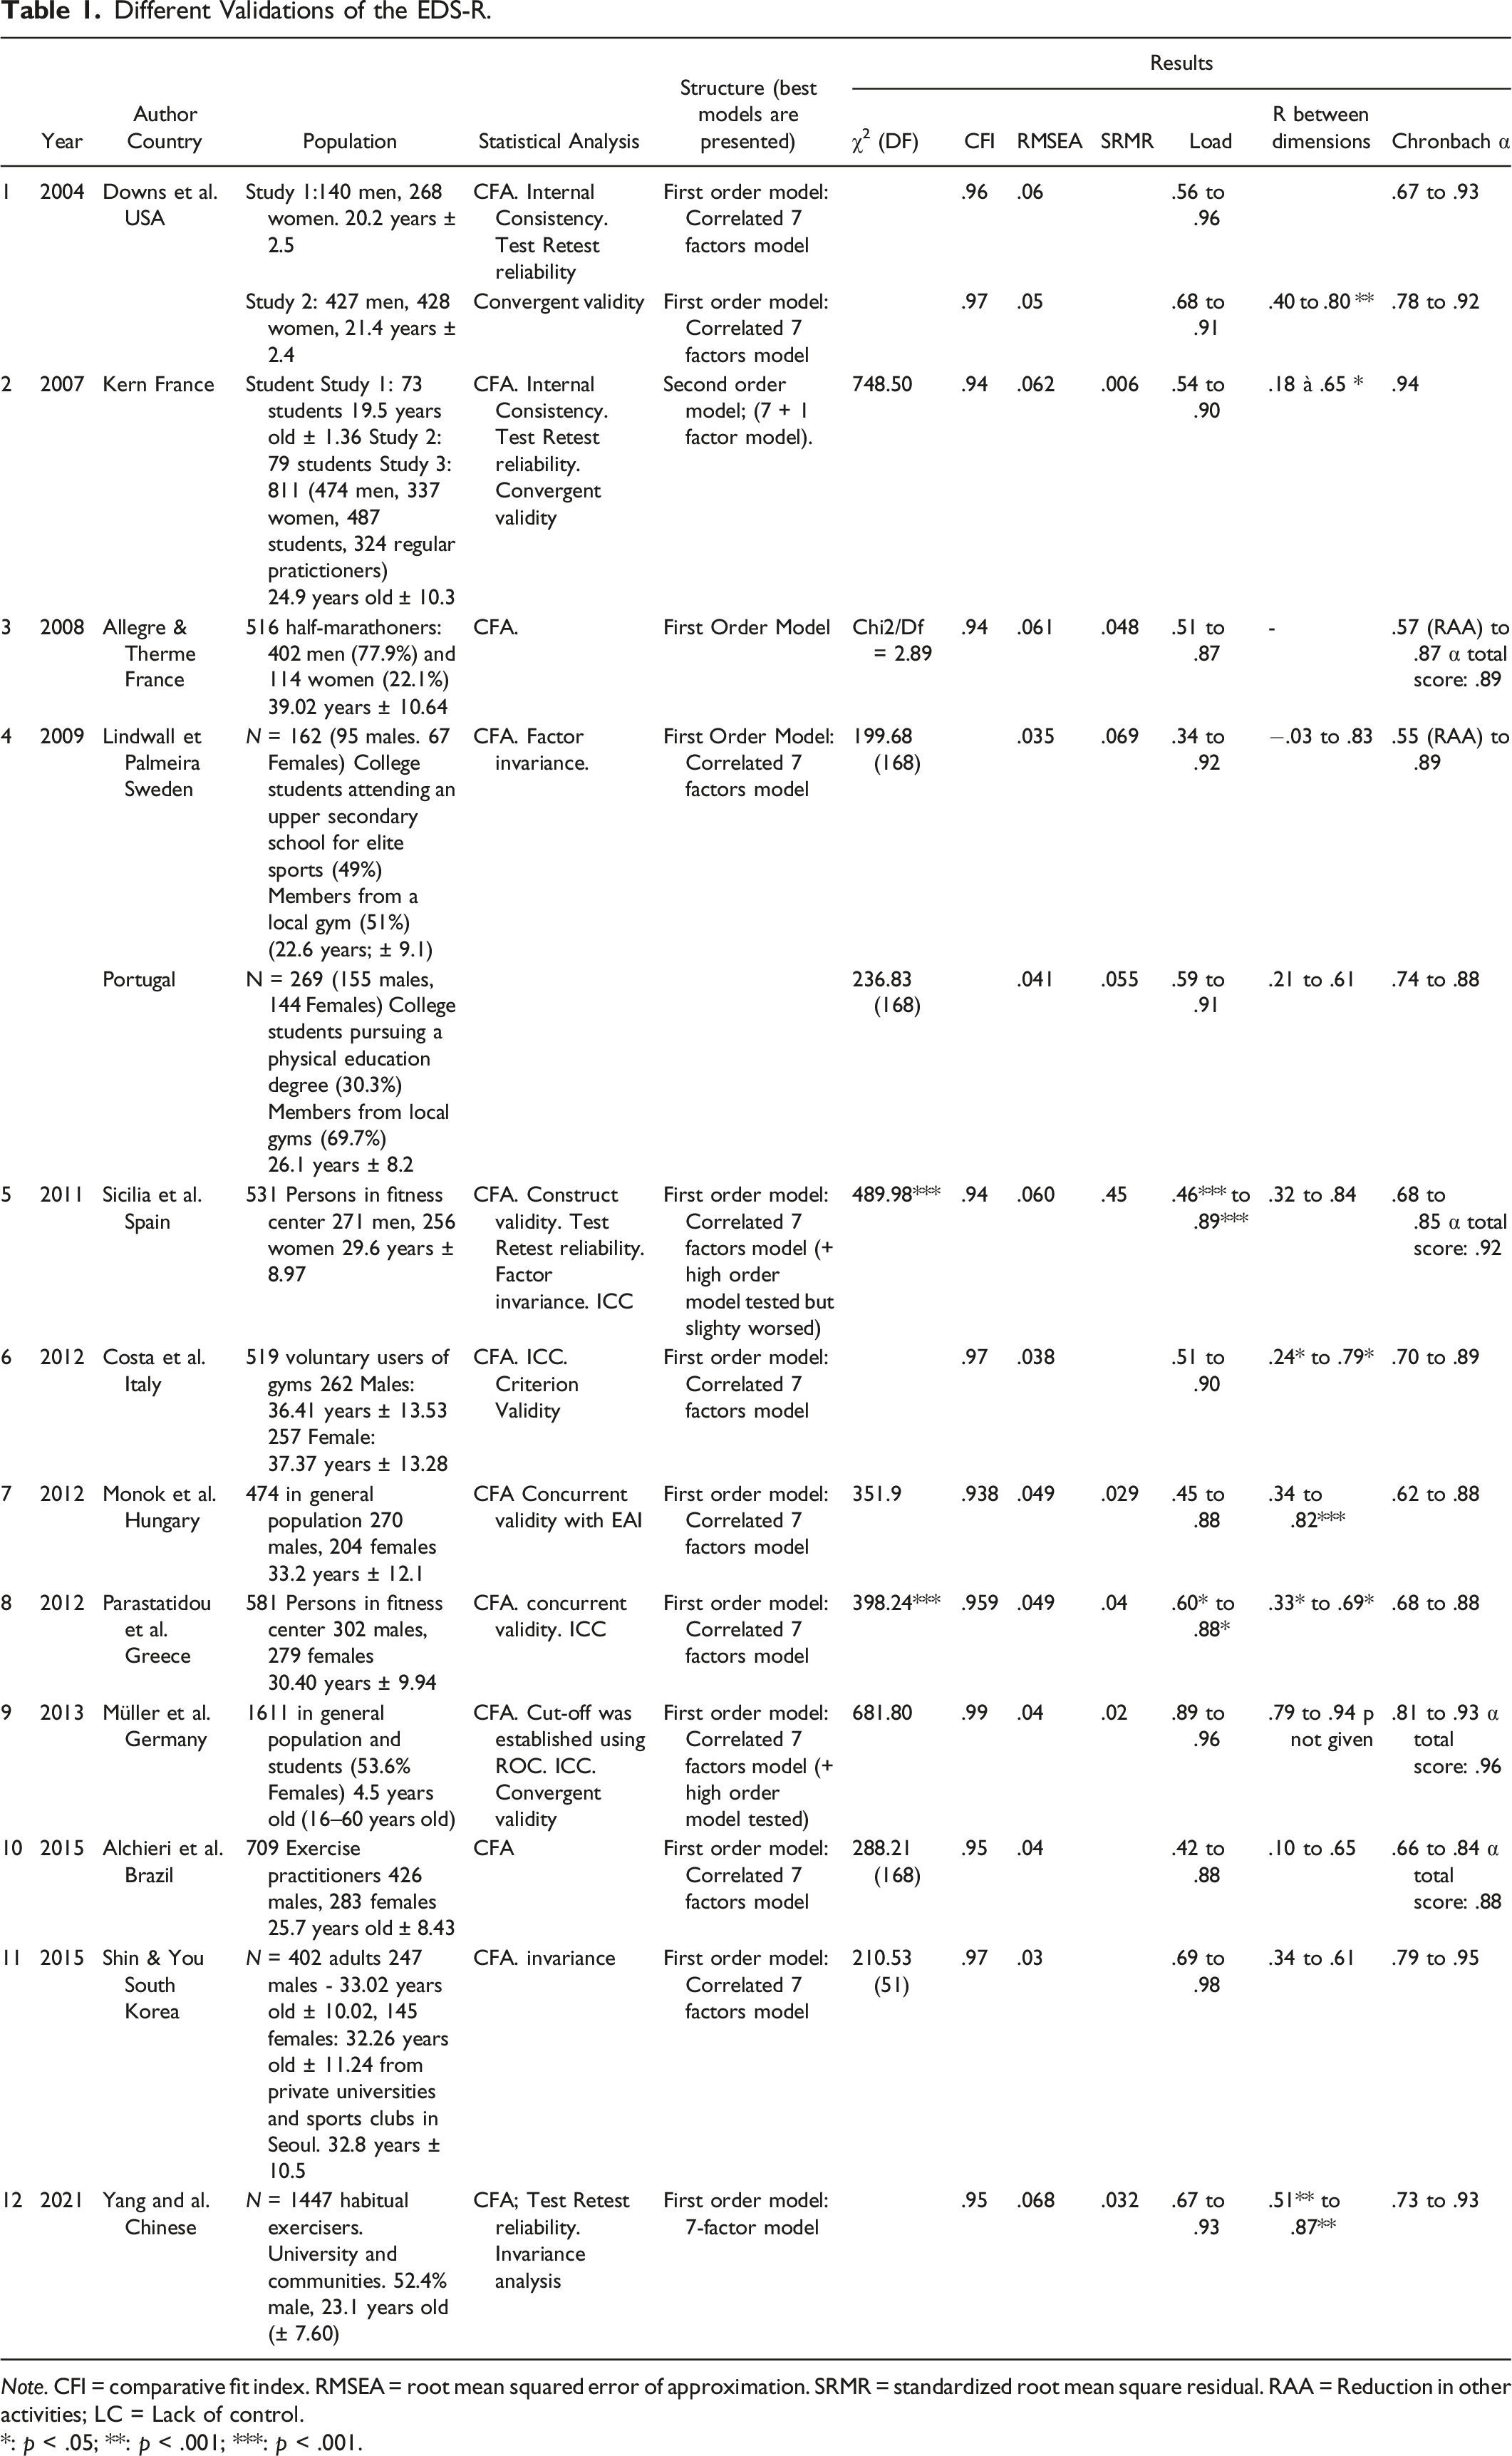
Note. CFI = comparative fit index. RMSEA = root mean squared error of approximation. SRMR = standardized root mean square residual. RAA = Reduction in other activities; LC = Lack of control.
*: p < .05; **: p < .001; ***: p < .001.
We identified 12 versions of the EDS-R that are available in English, French, Swedish, Portuguese, Spanish, Italian, Hungarian, Greek, German, Brazilian, Korean, and Chinese. All validation studies of these adaptations were conducted with both women and men, but in samples with different characteristics, as for example with students (Kern, 2007; Lindwall & Palmeira, 2009; Müller et al., 2013; Shin & You, 2015), people in fitness centers (Parastatidou et al., 2012; Sicilia & González-Cutre, 2011), gym goers (Costa et al., 2012), members of the general population (Mónok et al., 2012; Müller et al., 2013) and exercise practitioners (Alchieri et al., 2015; Shin & You, 2015). Of the 12 validated versions of the EDS-R, most of the underlying analyses, except for those of Kern (2007), tested and validated the initial model (a first-order model with the seven factors listed above, in our description of PPA). For our part, in 2007, we showed that a second-order structure presented better fit indices than a first-order correlated factor structure (Kern, 2007). To our knowledge, no other EDS-R factor structures have been tested or published.
Finally, some investigators calculated a total score and a score for each of the seven dimensions, while others chose one or the other, depending on the research context. Symon Downs et al. (2004), only calculated scores for the specific dimensions. According to Shin and You (2015), the EDS-R dimensions are all moderately or strongly correlated. At this stage, we question the dimensionality of the EDS-R and whether the seven subscales measure a single factor or several dimensions within a second-order or bifactor structure. To our knowledge, no investigators have assessed the dimensionality of this scale and whether its dimensions (or subscales) capture separate strongly related subdomains (making the instrument multidimensional) or whether they may reflect a single general dimension (making the instrument unidimensional). Bifactor modeling is an appropriate tool to investigate a psychological construct such as PPA and to evaluate the psychometric properties of an instrument to measure it like the EDS-R (Reise, 2012). Indeed, bifactor models are appearing more commonly, given psychometric procedures for examining the dimensionality of various measures (Reise, 2012; Rodriguez et al., 2016a) and the extent to which multidimensional data can yield univocal scale scores (Reise, et al., 2010; Rodriguez, et al., 2016b). Bifactor analysis can provide information on the adequacy of a total score and any need to create and score subscales (Reise, 2012; Rodriguez et al., 2016b).
Current Study
Our primary objective in the present study was to examine the latent structure of the EDS-R and to assess how items would be represented in an instrument with a general factor combined with multiple specific subdomains. Thus, we assessed both a first- and a second-order factor model on a data gathered from a large sample of French university students (see Method) before testing if a bifactor structure would be a better fit. Our second goal was to investigate several indices from a bifactor model (Dueber, 2017) to consider whether the EDS-R should be viewed as unidimensional, meaning that there is a larger relationship between items and a general factor than between items and each specific factor subdomain, or multidimensional, meaning several specific factor subdomains are more closely related to a general factor. Finally, like Muller et al. (2014), we ask what the EDS-R measures.
Method
Study Population
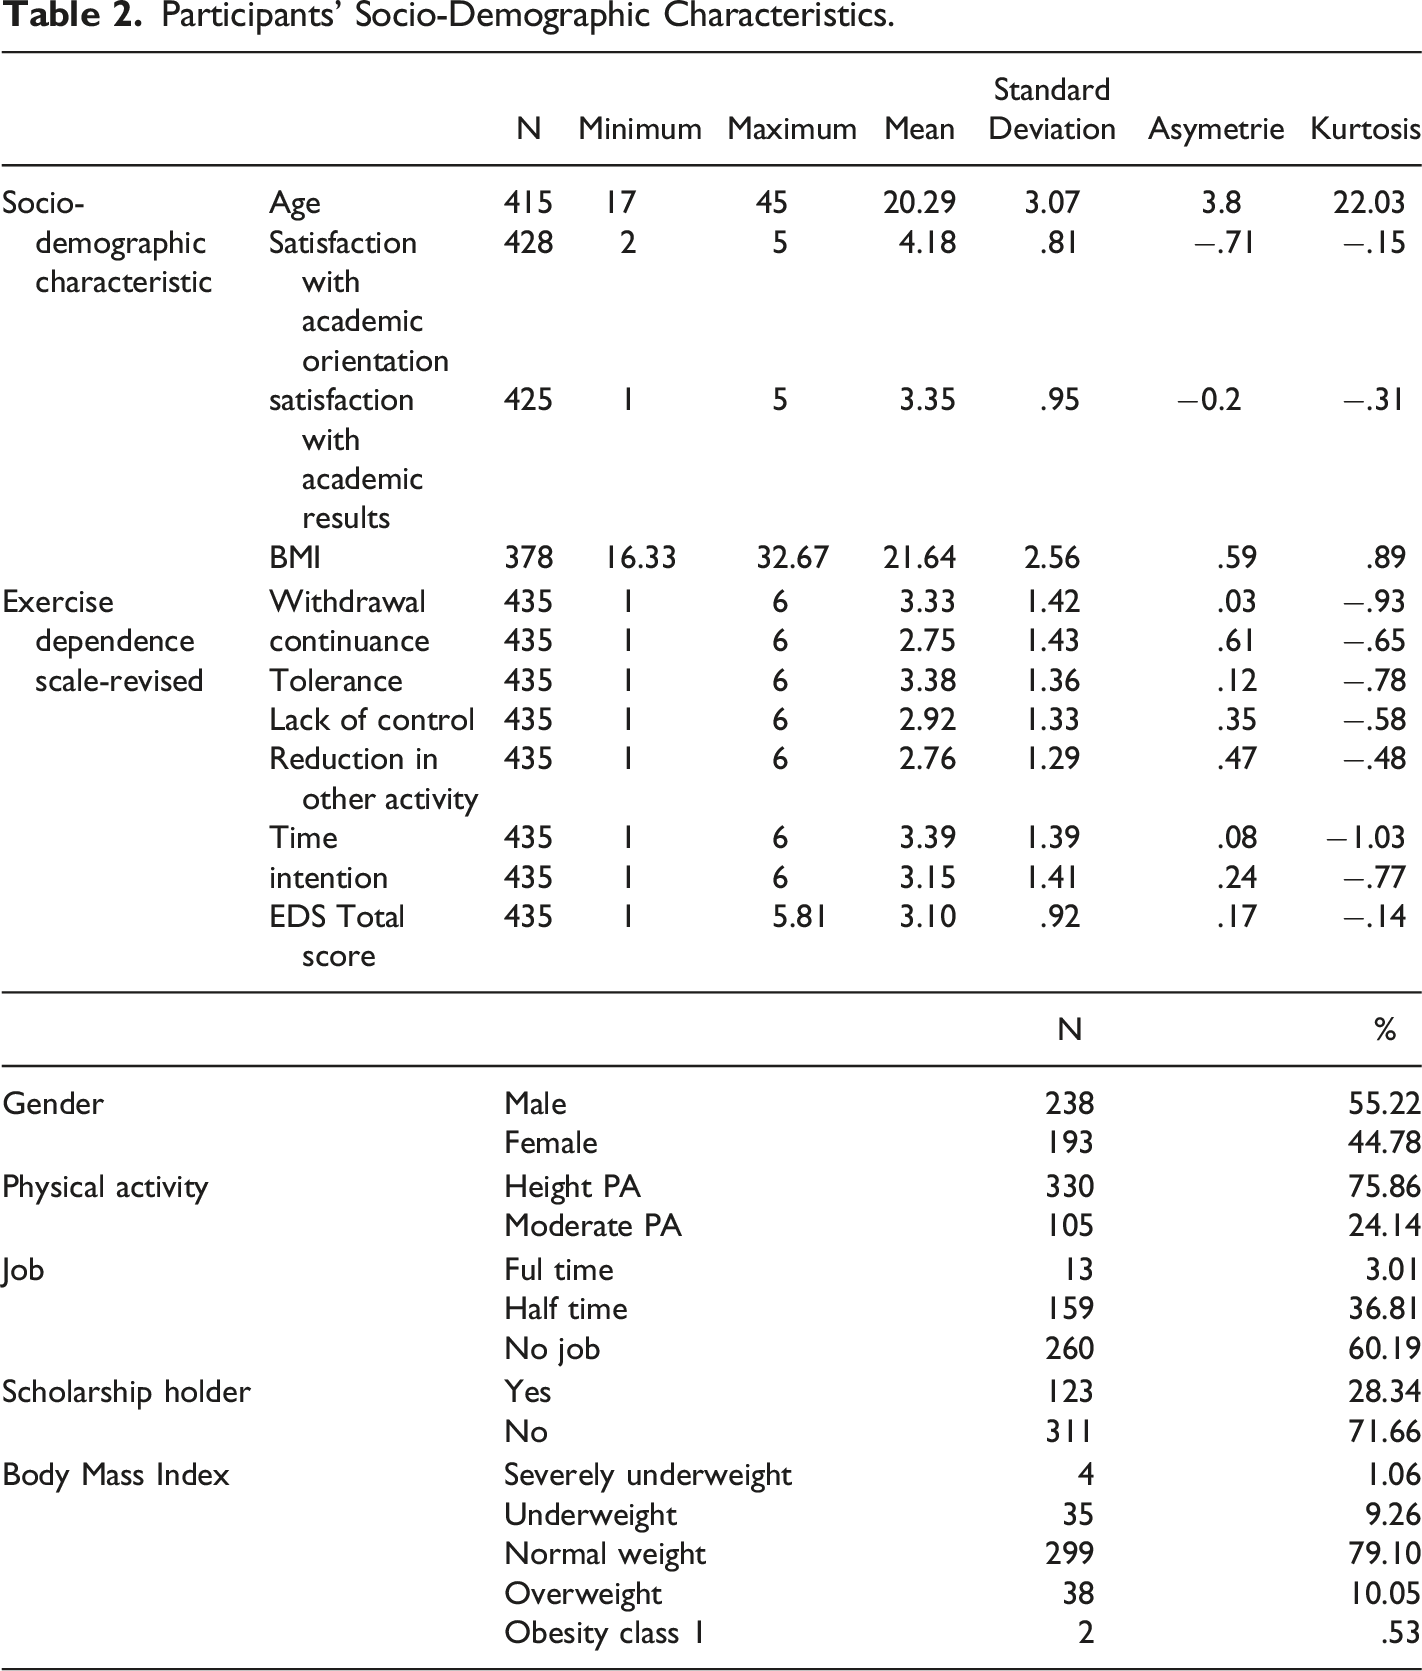
Students were recruited between October 2015 and February 2016, during mandatory lectures at Paris Nanterre University in France. Only those who could read and write French were recruited. All students completed an anonymous, hard-copy self-questionnaire. The questionnaire took approximately 20–25 minutes to complete. The initial dataset contained 745 students from Paris Nanterre University (sports sciences 46.1%, psychology 44.9%, and art, literature, politics, economics and other majors accounted for 9%). The sample population consisted of 57.6% women (N = 426). The mean age was 21.13 years (Min = 17, Max = 59, SD = 4.45). We included only those who declared that they engaged in physical activity (N = 514; 69.8%). Among them, we selected only those who declared a moderate to high level of physical activity according to the GPAQ (N = 494; 9.5%). Finally, we only retained students who had responded completely to the EDS-R. Thus, a total of 88 respondentss (16.8%) were deleted from the analyses, leaving us with a final sample population of 435 students (58.4% of the total population) for our factorial analysis of EDS-R.
This observational study design was approved by The French Electronic Data Protection Authority (Commission Nationale de l'Informatique et des Libertés- 1717103v0). This research was carried out in accordance with the principles of the Declaration of Helsinki. Our study followed the recommendations of the ethics committee of the Department of Psychology and Learning Sciences of the University of Paris Nanterre. Participants in our study provided informed consent. Since some participants were under the age of 18, we followed a process of assent from participants who were minors, while their parents or legal guardians provided informed consent on behalf of these minors.
Measures
Assessment of Participants’ Socio-economic Characteristics
Participants were administered a questionnaire that included items requesting their sociodemographic characteristics such as age, gender, job activity, scholarship status, accommodation status (in rented accommodation, living with parents or on campus), marital status, financial difficulties, weight, and size (body mass index).
Exercise Dependence Scale-Revised Scale
Participants also completed the EDS-R (Hausenblas & Downs, 2002c), designed to measure exercise dependence based on the Diagnostic and Statistical Manual of Mental Disorders, Fourth Edition (DSM-IV; APA, 1994) criteria for substance dependence. The following additional specific information describes this instrument: (a) The mean score of the symptoms of exercise dependence on the EDS-R was derived from 21 items that respondents rated on a 6-point Likert scale (from 1: never, to 6: always).; (b) This scale differentiates exercise dependence, categorizing respondents into a three-stage continuum: (a) at-risk for exercise dependence, (b) nondependent-symptomatic, and (c) nondependent-asymptomatic, based on cut-offs defined by the authors (Hausenblas & Downs, 2002c); and (c) This instrument also specifies whether individuals have evidence of (a) physiological dependence (based on evidence of tolerance or withdrawal dimensions) or (b) no physiological dependence (based on no evidence of tolerance or withdrawal dimensions).
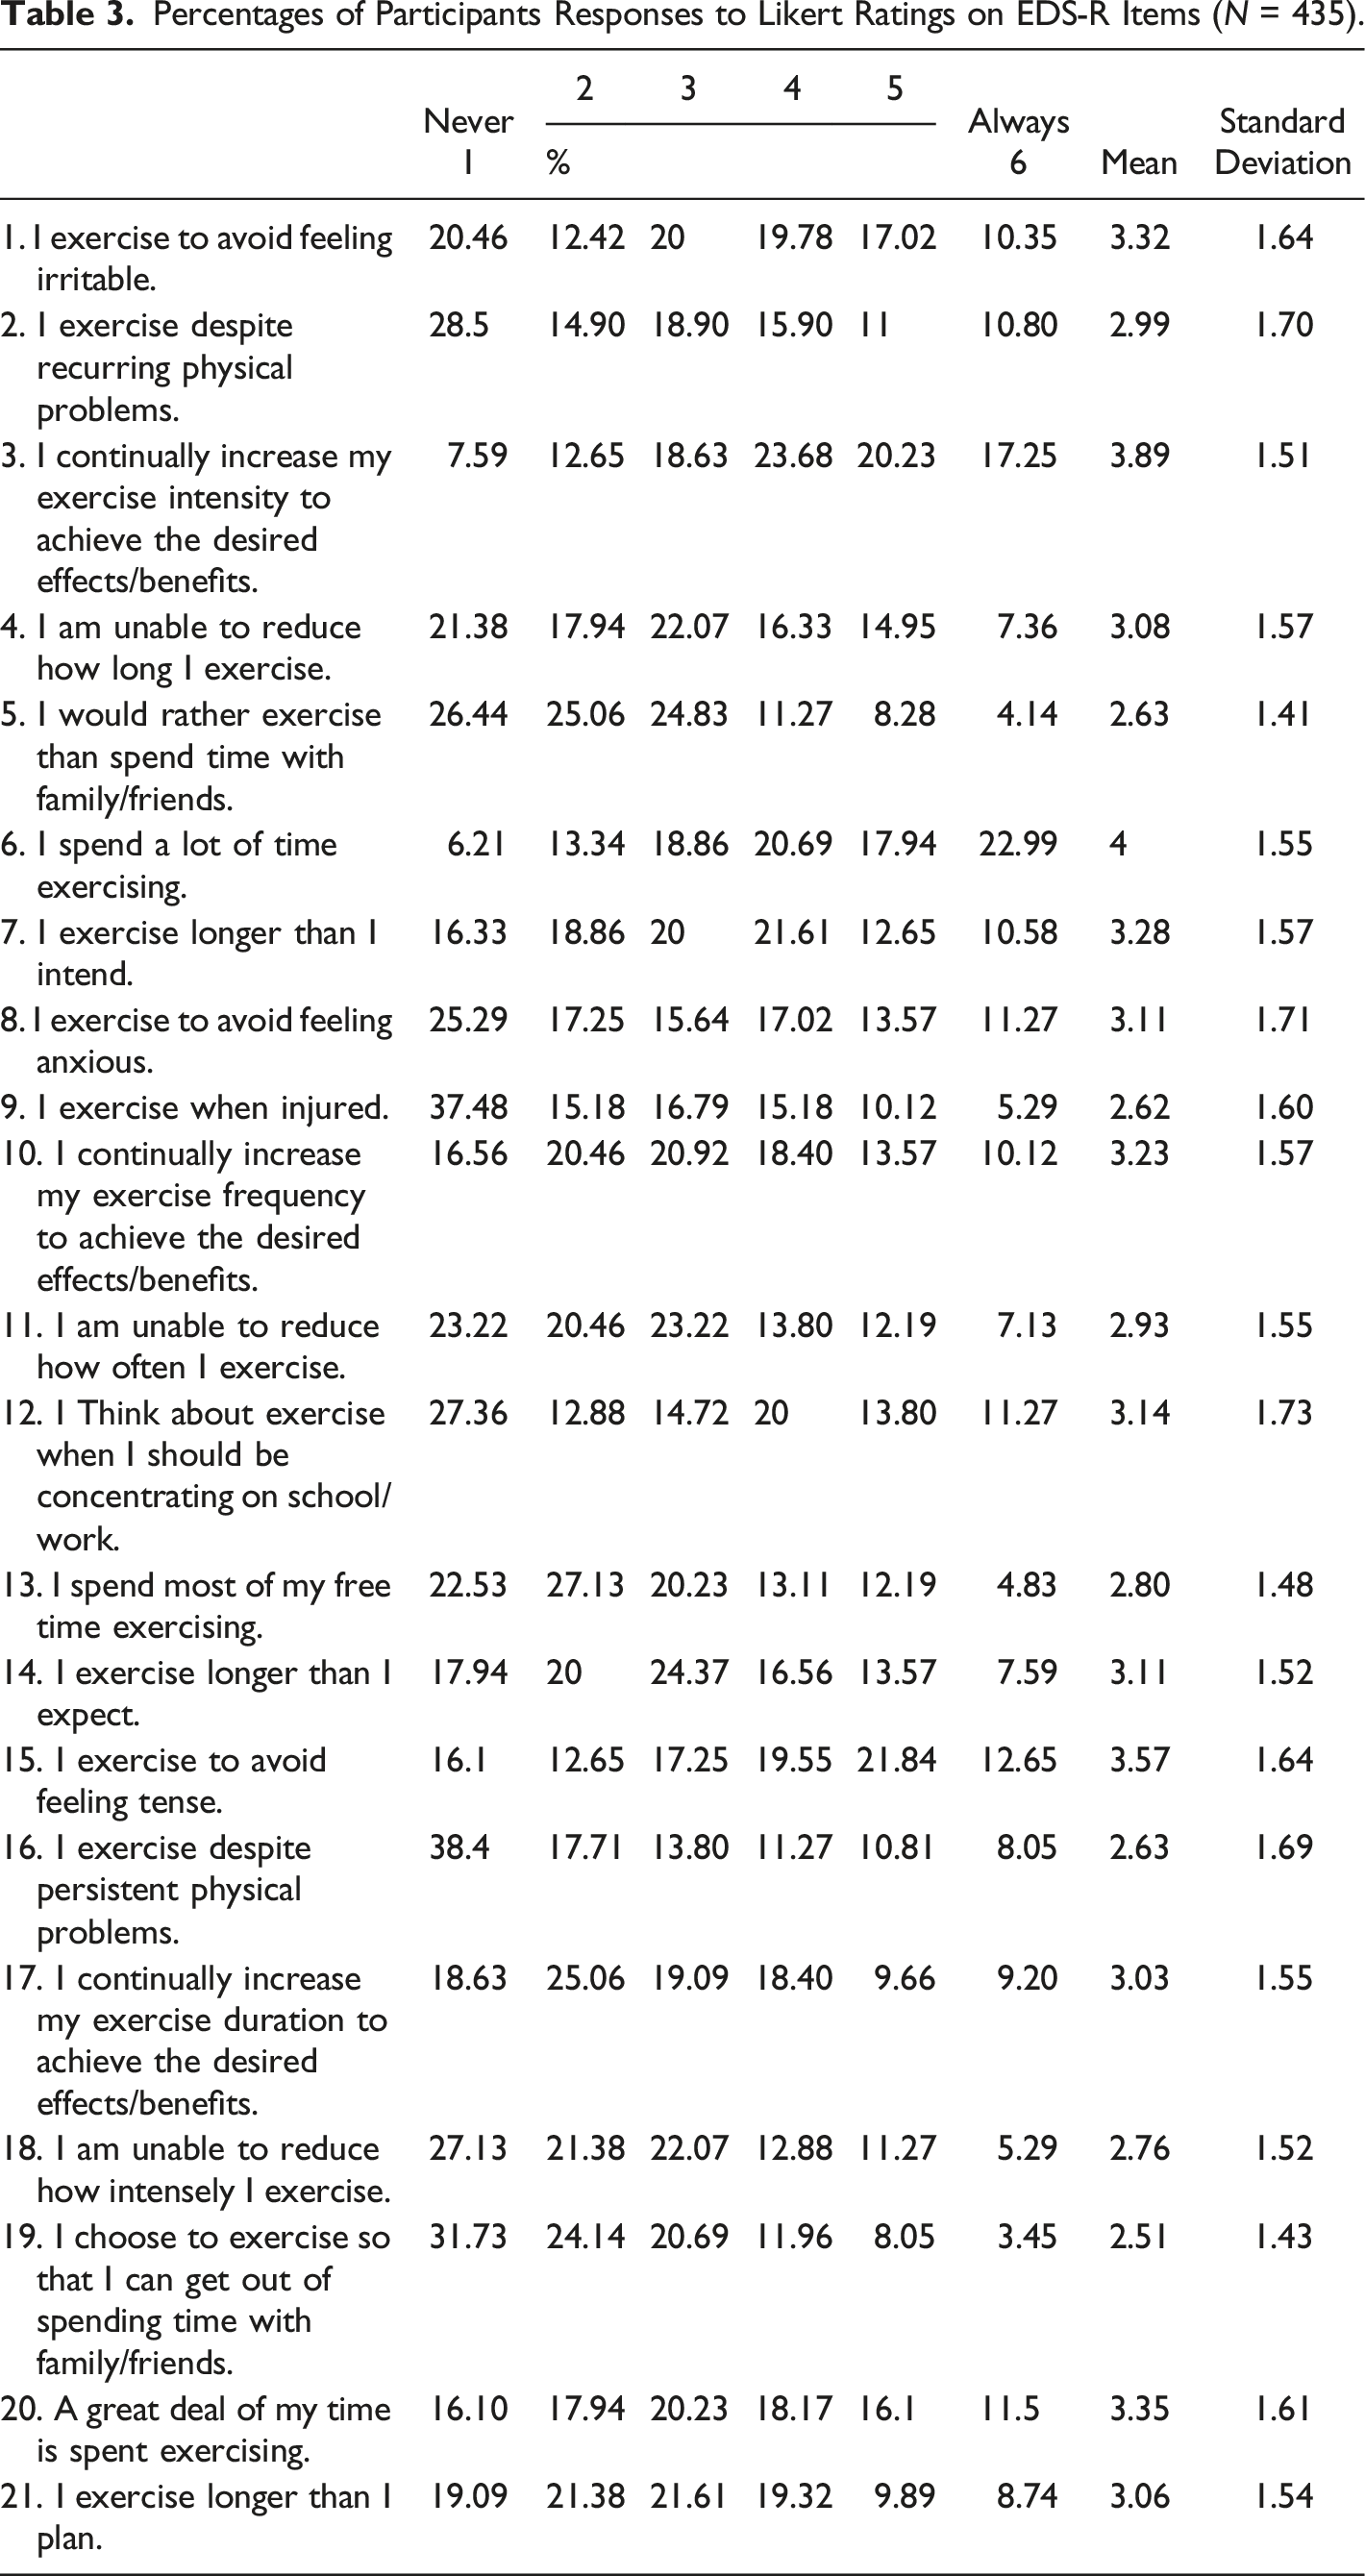
We reviewed 12 EDS-R CFA validation studies (Table 1). Almost all tested the model with these seven latent dimensions l: (a) withdrawal effects (items 1, 8, 15); (b) continuance (items 2, 9, 16); (c) tolerance (items 3, 10, 17); (d) lack of control (items 4, 11, 18); (e) reduction in other activities (items 5, 12, 19); (f) time (items 6, 13, 20) and (g) intention effects (items 7, 14, 21). We used the French version (Kern, 2007) of the original EDS-R (Symons Downs et al., 2004) which was found to have satisfactory psychometric properties (Table 1.)
Global Physical Activity Questionnaire
We measured participants’ physical activity with the Global Physical Activity Questionnaire (GPAQ) developed by the World Health Organization (2010). The GPAQ is made up of 17 questions, 16 that examine physical activity in different behavioral domains (at work, in transportation and at recreation or leisure), and one question that measures the participant’s sedentary lifestyle. To assess physical activity, we calculated the metabolic equivalent (MET) of the task. (One Met is defined as the amount of oxygen consumed while sitting at rest and is equal to 3.5 mL O2 per kg body weight per minute of time; Jetté et al., 1990). or we simply calculated Metabolic Equivalents (MET scores) separately for individual GPAQ domains and subdomains. For the calculation of a global categorical indicator of physical activity, we considered the total time spent in physical activity during a typical week, the number of days, and the intensity of the physical activity. Physical activity was further classified according to the MET minutes into three groups: inactive/low (<600 met-minutes), active (600–1200 met minutes), and highly active (>1200 met-minutes). Physical inactivity was calculated in the three domains of the questionnaire (that is, activity at work, travel to and from places, and recreational activities).
Statistical Analysis
All analyses were conducted with Mplus version 8.1 (Muthén & Muthen, 2017). Since some authors have suggested that Likert response scales should be treated as ordinal data (Kline, 2015), we used a Weighted Least Squares estimator adjusted for means and variances (WLSMV) (Schmitt, 2011). Indeed, since all items on the EDS-R may be non-normally distributed (with floor and/or ceiling effects), it was not appropriate to use the default Maximum Likelihood (ML) estimator (Bowen, 2010). The results of Mplus analyses included the Chi-square (χ2), (Jöreskog & Sörbom, 1993), the Comparative Fit Index (CFI), (Bentler, 1990), the Tucker-Lewis Index (TLI), (McDonald & Marsh, 1990), the Root Mean Square Error of Approximation (RMSEA) and the Standardized Root Mean Square Residual (SRMR). RMSEA values less than or equal to .05 indicate close fit, while values between .05 and .08 indicate a ‘reasonable’ fit. Values of .95 or higher are desirable for the TLI and CFI. SRMR values should be below .08 (Asparouhov & Muthén, 2018; Bowen, 2010). Nevertheless, it is important to remember that these model fit statistics are simply guidelines and should not be interpreted as golden rules (Schmitt, 2011). The Mplus CFA results were used to obtain several indices relevant to bifactor analysis with a Microsoft Excel-based tool developed at the University of Kentucky (Dueber, 2017). These indices are used to assess whether an instrument or a scale is better interpreted as unidimensional or multidimensional: Item and factor Explained Common Variance (IECV and ECV), Percentage of Uncontaminated Correlations (PUC) and Average Relative Parameter Bias (ARPB). Also, the coefficients Omega (ω), Specific Omega (ωS), Omega Hierarchical (ωH)/Hierarchical Specific Omegas (ωHS), Relative Omega (ωR), Construct Replicability (H) and Factor Determinacy (FD) for reliability. Corrected/scaled chi-square difference tests (Chi2), Akaike’s information criterion (Faik et al., 2017), and Bayesian information criterion (Babic et al., 2014) were used to compare the fit of the unidimensional, first-order, second-order and bifactor models.
Different factorial solutions within a CFA framework were computed with our data: a unidimensional model (M0; 1 latent factor), a first order model (M1; 7 latent factor structure proposed by Symon Downs et al., 2004), a second order model (M2; M1 + a higher-order factor) and a bifactor model (M3) (Figure 1). Data and code are available at: https://osf.io/juve5/. (This study was not preregistered.) Schematic Representation of the one factor (a), Seven factors 1st Order (b), Seven Factors 2nd Order (c) and Bifactor model (d) of the Exercise Dependence Scale Revised.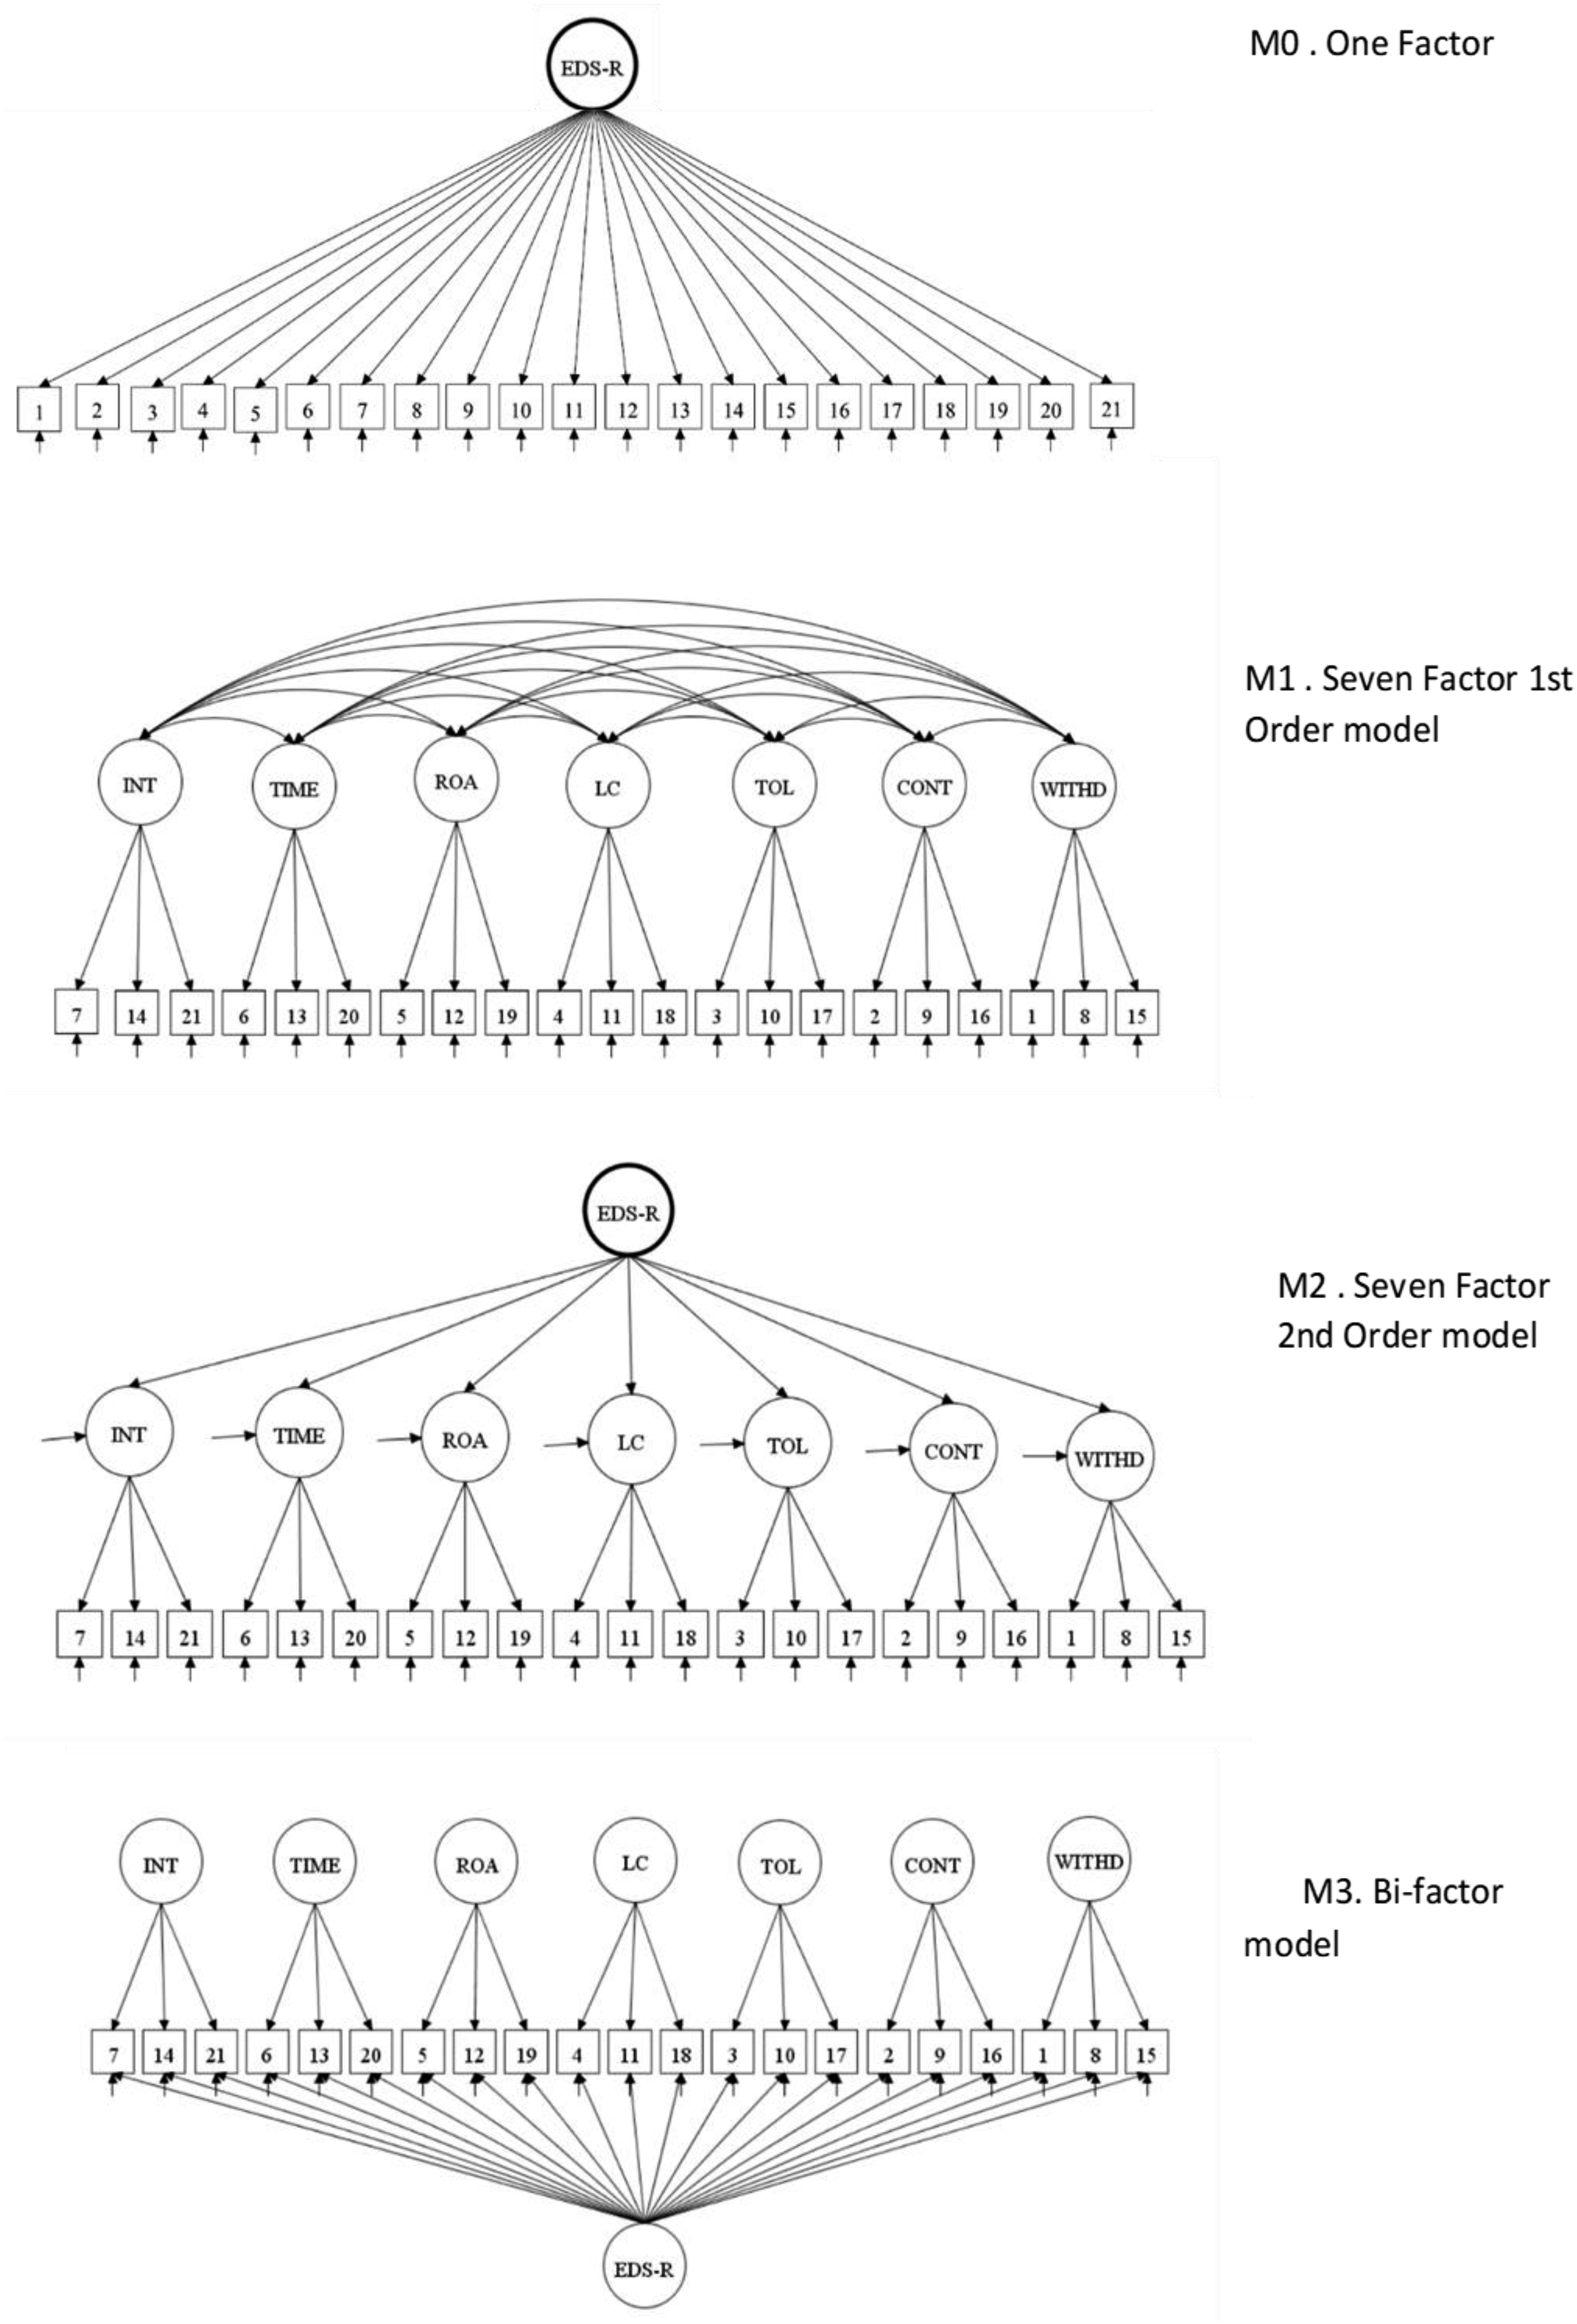
Results
Sociodemographic and Item Characteristics
Participants’ Socio-Demographic Characteristics.
Percentages of Participants Responses to Likert Ratings on EDS-R Items (N = 435).
Factorial Structure
CFA Indices to Assess Fit to Measurement Models (N = 435).
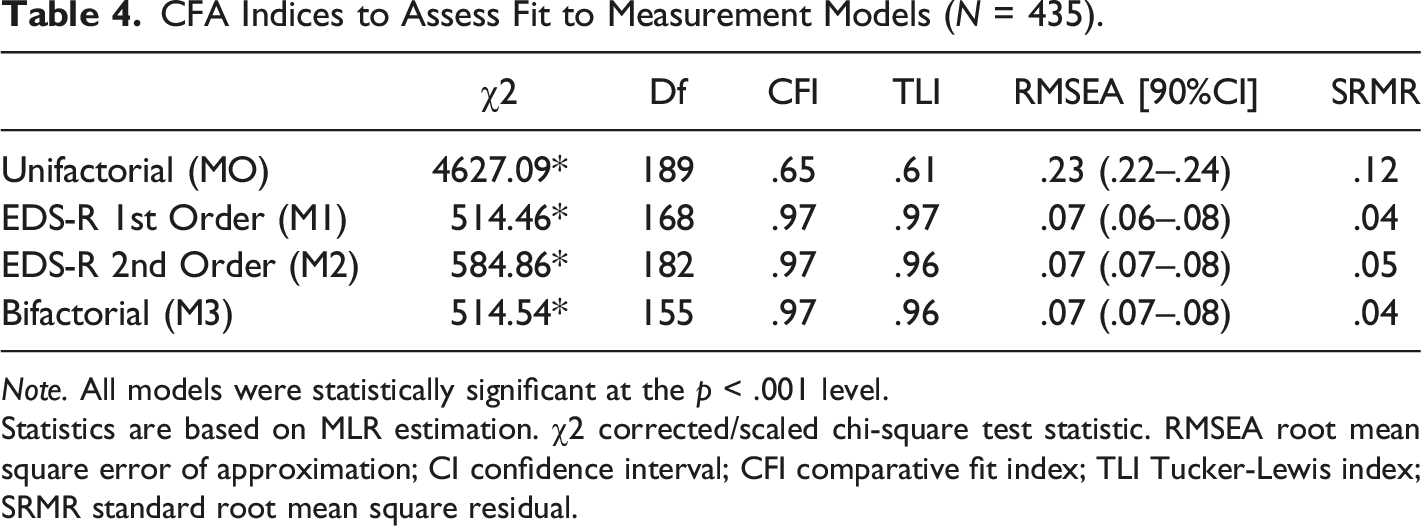
Note. All models were statistically significant at the p < .001 level.
Statistics are based on MLR estimation. χ2 corrected/scaled chi-square test statistic. RMSEA root mean square error of approximation; CI confidence interval; CFI comparative fit index; TLI Tucker-Lewis index; SRMR standard root mean square residual.
Dimensionality Analysis
Item Loadings for the One Factor. Seven Factors and Bifactor Models (N = 435).
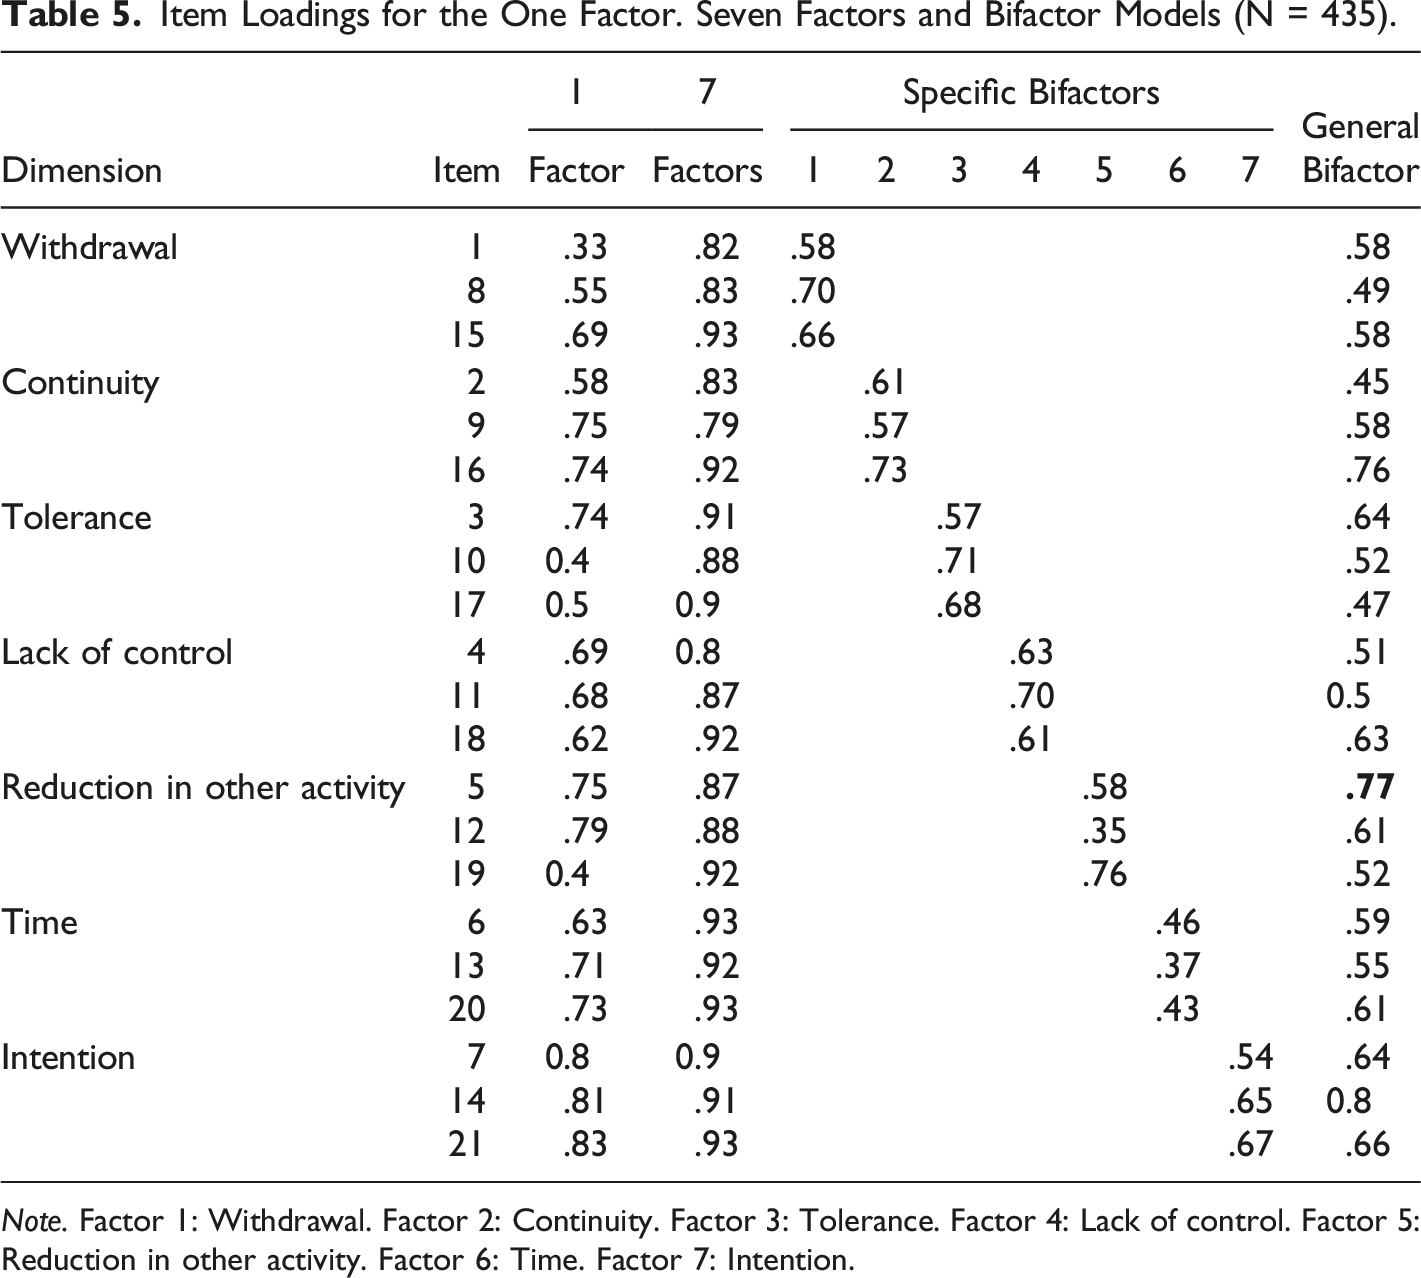
Note. Factor 1: Withdrawal. Factor 2: Continuity. Factor 3: Tolerance. Factor 4: Lack of control. Factor 5: Reduction in other activity. Factor 6: Time. Factor 7: Intention.
Bifactor Explained Common Variance and Model Based Reliability Estimates for EDS-R (N = 435).
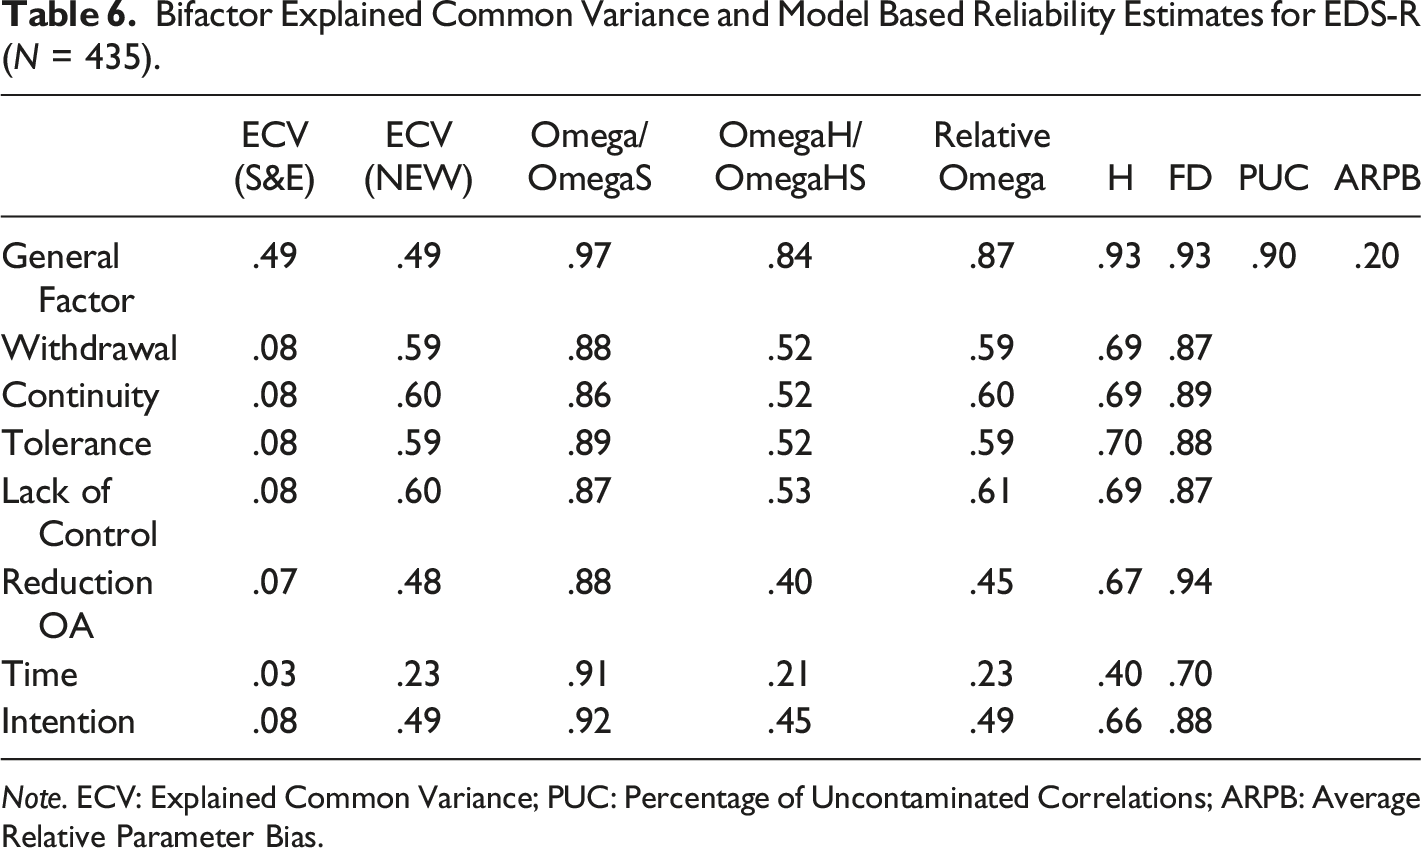
Note. ECV: Explained Common Variance; PUC: Percentage of Uncontaminated Correlations; ARPB: Average Relative Parameter Bias.
Bifactor Item Level Analysis Estimates for the EDS-R (N = 435).
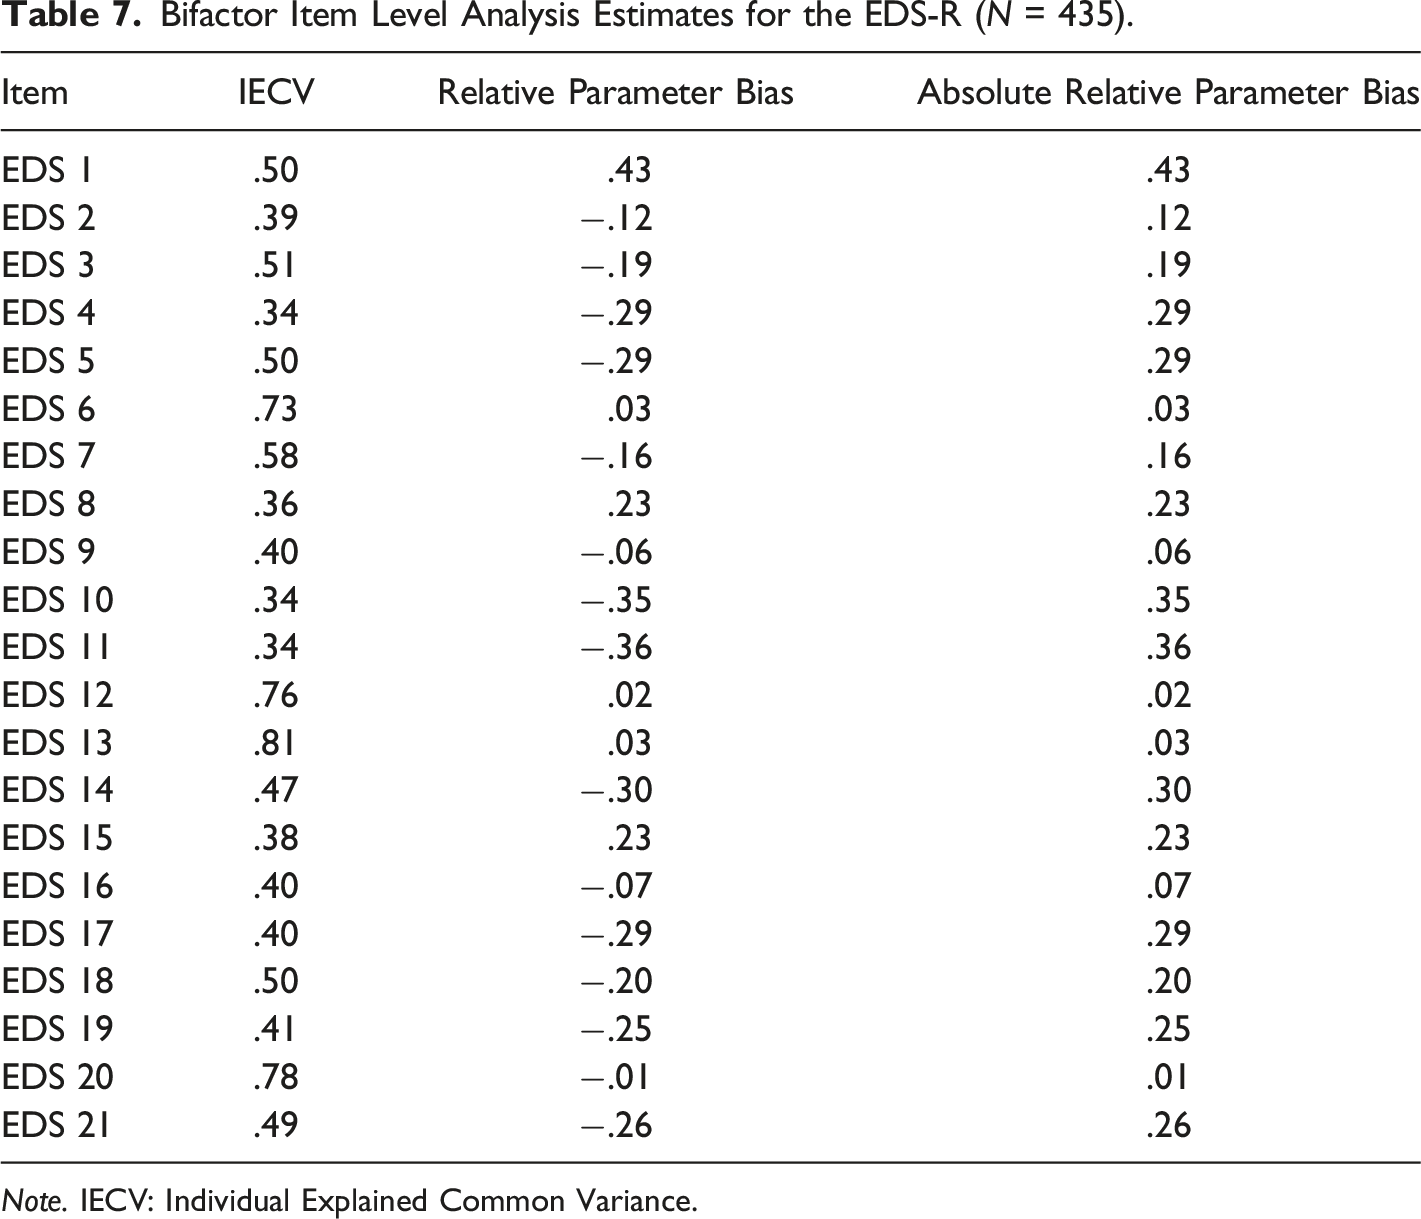
Note. IECV: Individual Explained Common Variance.
In this study, the ECV was .49 which means that the general factor represented 49% of the common variance, and 51% of the variance was distributed over the other seven dimensions (Table 5). Furthermore, an IECV> .50 indicates that the item reflects mainly the general dimension rather than the specific dimensions, which was the case for eight elements (38,1%; items (38,1%; items 1; 3; 5; 6; 7; 12; 18; 20). According to the IECV, the scale could also be considered as multidimensional with 12 items (item 2; 4; 8; 9; 10; 11; 14; 15; 16; 17; 19; 21) to be more reflective of specific dimensions. Regarding the Average Relative Parameter Bias (ARBP), a value of .20 (Dueber, 2017) suggested important differences between parameter estimates in a unidimensional and bifactor solution. The reliability indices (general omega and specific omega) indicated that the general variance (Omega = .97), as well as the specific variances (Omega Specific from .86 to .92) were high. In other words, 97% of the variance of the total score was due to all factors (general + specific), and for the subscales, 86–92% of the variance was due to the general factor and only the target dimension. The Hierarchical Omega (proportion of variance of the total score that can be attributed to the general factor after considering specific factors) with a value of .84 indicated that the EDS-R predominantly reflected a general factor, making it possible to calculate and interpret a total score (Hammer, 2016; Reise, et al., 2013). According to Hammer (2016), Hierarchical Specific Omegas <.50 indicate that the variance in the score of the subscale is mainly due to the general factor. This was the case for Reduction in other activities (Oméga HS: .40); Time (Oméga HS: .21) and Intention (Omega HS: .45). To be able to consider a score for a specific dimension, its Hierarchical Specific Omegas should have a value around .75 (Hammer, 2016). Our results showed that no dimension had an omega HS higher than .75. The H factor is a measure of the replicability of the construct. According to Hammer (2016), H > .80, means that the latent variable is well defined by its elements and would testify to good construct replicability (stability between studies). This criterion was only met for the general factor (.94) and the withdrawal dimension (.82). Factor Determinacy (FD) allows us to estimate the correlation between factor scores calculation with factors and tells us how much a calculated score would reflect the latent score (Rodriguez et al., 2016b). Values closer to 1 indicate better determination. According to Rodriguez et al. (2016a, 2016b), only the general factor (.93) was reliable since the FD was greater than .90.
Discussion
Our CFA results suggested that the EDS-R best conformed to a bifactor structure rather than a first-order, second-order or unidimensional structure, with seven factors, corresponding to the original scale developed by Symon Downs et al. (2004). However, bifactor models are prone to overfit (Faik et al., 2017), since they explicitly allow modeling of an additional path (for example, the general factor) compared to a correlated factor model with the same number of specific factors (Samuel, 2019). This is why several other dimensionality indices have been carefully studied (Bonifay et al., 2017) for the EDS-R rather than accepting a bifactor solution solely based on improved fit statistics (Samuel, 2019). The second objective of this study was to investigate the EDS-R uni- versus multi-dimensional structure. Dimensionality indices suggested that (a) the covariance between items in the EDS-R seemed best explained by a single general factor, (b) it is possible to calculate a total general score, and (c) only one dimension (withdrawal) represented a theoretically distinct construct that could lead to the calculation of a subscore as recommended by Bonifay et al. (2017).
Our results thus suggested that the EDS-R scale is neither a purely unidimensional nor a purely multidimensional tool. If 75% of the EDS-R items are saturated on a unidimensional structure (IECV greater than .50), it seems that six items could measure their specific dimensions. These items relate to: (a) “continuance” or physical activity is continued despite knowing that it has a persistent or recurrent physical or psychological problem that is likely to have been caused or exacerbated by physical activity (e.g. continued running despite injury) (3 items/3: items 2-9-16); (b) “withdrawal”, meaning that in the absence of physical activity, the person has ‘negative experience’ effects, including anxiety, restlessness, depression, guilt, tension, discomfort, sleeplessness and headache (2 items/3: items 8, 15; (c) “tolerance,” meaning either a need for increased amounts of physical activity to achieve the desired effect or a diminished effect occurs with continued use of the same amount of physical activity (2 items 10; 17), and (d) “intention,” meaning that the person is unable to stick to the intended routine as evidenced by exceeding the amount of time devoted to exercise or consistently going beyond the intended amount (2 items/3: items 14; 21). It might be of interest to further question these dimensions in the future by confronting them with cognitive interviews. Regarding the “continuance” dimension, 2 of the 3 items (item 2 ’I exercise despite recurring physical problems’ and item 9 ’I exercise when injured’) appear to reflect their specific dimension. The formulation of these items would probably need to be ‘reworked’ with cognitive interviews to better reflect a specific dimension if a general factor does not offer a better explanation. For the remaining EDS-R specific dimensions (time, reduction in other activities, tolerance, intention, lack of control, but also continuance), these constructs do not seem to be specific enough according to our analysis. The dimensions “time” and “lack of control” could be regarded as only one dimension. In other words, when physical activity becomes the most important activity in a person’s life, it then dominates his thoughts, his feelings, and his behavior. Thus, the loss of control would not, with regard to this explanation, be separated from the time dimension.
The Percentage of Uncontaminated Correlations (PUC) reflects the variance from the general dimension. According to Dueber (2017), a PUC <.70 and an ECV >.70 reflect a unidimensional scale. In our case, a PUC of.90 tended to show that the scale was unidimensional, but associated with the ECV, meaning that the scale should be in a “grey area” in which both general and specific dimensions must be considered. The reliability indices (general omega and specific omega) indicated that the general variance (Omega = .97), as well as the specific variances (Omega Specific from .86 to .92), were high. In other words, 97% of the variance of the total score was due to all factors (general + specific), and for the subscales, 86–92% of the variance was due to the general factor and only the target dimension. If the Hierarchical Omega indicates that the EDS-R predominantly reflects a general factor, according to Hierarchical Specific Omegas, the four dimensions of withdrawal, continuity, tolerance, and lack of control seem to be in a grey zone. Furthermore, the Relative Omega indicated that the proportion of variance attributable to the general factor was 87% regardless of specific dimensions. For specific factors, the relative Omega ranged from 23%–59%, regardless of the general factor.
Finally, our results also highlight the specificity of the withdrawal dimension. This issue was previously raised by Szabo (1995) (Chapter 2, page 15) when he spoke of physical activity deprivation. Along the same lines, Starcevic (2016) argued that repetitive and problematic behaviors did not have to be conceptualized as addiction. When it comes to behavioral addictions, withdrawal symptoms have generally been described as emotional states (irritability, agitation, anger, mood swings, sadness, guilt, anxiety, and feeling of tension) that occur when commitment to physical activity is thwarted. According to Kaptsis, et al. (2016), withdrawal symptoms can be easily mistaken for reactions to externally imposed deprivation of practice or a craving for practice. Physical activity is good for health and for some people, it provides a degree of psychological and physical balance, so withdrawal should be considered a normal reaction to stopping the practice. Furthermore, symptoms such as tolerance and withdrawal are, for Kardefelt-Winther et al. (2017), difficult to apply and measure convincingly, which begs the question of whether these symptoms constitute a useful and valid part of a definition of behavioral addiction. Finally, there is a great deal of evidence and growing recognition that withdrawal symptoms and tolerance sometimes accompany addiction, but rarely cause it (Alexander & Schweighofer, 1988). In their book, Sports and Exercise Psychology (2015), Szabo and Egorov criticized the inclusion of withdrawal as a key concept in defining PPA. According to them, most researchers in the field of PPA (e.g., Furst & Germone, 1993; Sachs & Pargman, 1979) have based their studies on the definition given by Sachs, in Sacks and Sachs (1981), describing running addiction as ‘addiction of a psychological and/or physiological nature, upon a regular regimen of running, characterized by withdrawal symptoms after 24 to 36 hours without participation’ (p. 118). However, defining PPA only based on withdrawal symptoms could be problematic since, as Szabo and Egorov (2015) pointed out, most researchers have only stated the presence or absence of withdrawal symptoms without giving any information on their type, frequency, or intensity. According to these authors, the severity of withdrawal symptoms and behavioral incentives aimed at dealing with withdrawal symptoms are crucial factors that need to be considered (Szabo & Egorov, 2015). Furthermore, intensity and impairment are key indicators that help to delineate normal and pathological behaviors in classification (Zimmerman et al., 2018). Therefore, withdrawal symptoms do not necessarily imply the presence of addiction, but rather the intensity and impairment that are necessary to delineate between committed and addicted exercisers. According to Szabo and Egorov (2015), ‘It is not the experience or lack of experience of withdrawal symptoms that should be considered, but rather their severity or intensity when they occur.’
These results provide a possible explanation for seemingly mixed findings from earlier factor analyses of the EDS-R, which supported a multidimensional interpretation, but also suggested that a unidimensional interpretation was acceptable. In contrast to earlier factorial analyses, our work, to our knowledge, is the first to investigate the dimensionality of EDS-R with a bifactor modeling approach. Beyond these analyses, a question was raised about the very operationalization of the PPA concept. In 2002, Hausenblas and Downs (2002a) operationalized exercise dependence symptoms based on the Diagnostic and Statistical Manual of Mental Disorders-IV criteria for substance dependence (DSM-IV, American Psychiatric Association, 2000; Hausenblas & Downs, 2002a, 2002b, 2022c; Veale, 1995), therefore assuming that PPA is close to substance addiction. This position is open to criticism, since physical activity is not a substance. Billieux et al. (2015) shared the same concern; they discussed the "usual story" behind the creation of new behavioral diagnoses, mentioned the development of diagnostic tools modeled on traditional substance abuse diagnostic criteria, and discussed the replication of studies with the same variables without considering the specificity of the behavior in question. Therefore, Billieux et al. (2015; page 121) openly questioned the strategy to adapt the criteria of substance abuse or pathological gambling, summing up the situation as follows: ‘Thus, we lack a solid theoretical model capable of specifying the factors and processes involved and the relationships between these factors’. Similarly, we should also return to qualitative studies to understand the phenomenology and specificity of these problematic behaviors. Starcevic (2016) also pointed out that using analogies with substance addiction for PPA may be inaccurate and tenuous at best. Even if we were to use this analogy, a common representation of the treatment of substance addictions usually involves abstinence. However, it would be reasonable to recommend abstinence if behavioral addictions are mistakenly specified due to fuzzy boundaries between normal and healthy behavior. Moreover, in the case of physical activity, an individual will continue to increase his frequency, intensity, and volume of physical activity in pursuit of further health benefits. Cessation of physical activity, as in the case of substance addiction, does not make sense; it is rather a question of finding the right balance between the benefit and risk of physical activity for each individual. Furthermore, by applying the basic criteria for substance dependence to PPA, we may have missed a specificity that might better delineate between normal and pathological behavior in such cases. Consequently, prevalence estimates of the “disorder” operationalized with the criteria for substance dependence may be inaccurate (Maraz et al., 2015). Therefore, confrontation with clinical cases is essential. As Falissard (2008) suggests, it is important to review the constructs and validate the scales by confronting them with clinical cases to ensure that they measure what they are supposed to measure. Thus, data obtained using these scales should be followed by interviews and/or supporting evidence to identify, or even confirm, individual negative consequences of PPA (Szabo et al., 2015). For these reasons that we compared the scales (EDS-R and EDQ) to a clinical case (Kotbagi et al., 2014).
Limitations and Directions for Further Research
In this study, we did not control the student’s level of mastery or habits on their physical activity that could have influenced their responses to the EDS-R scale. We also investigated the dimensionality of EDS-R using classic bi-factor modeling and indices. However, data models such as these have theoretical implications. Indeed, the analytical framework we chose to follow supposes that PPA is a latent entity that is indirectly measured by the EDS-R items. However, an alternative data model could also be considered, such as network analysis, with a different theoretical implication that PPA is an emergent property from interacting components that are questioned by the EDS-S items. A future direction would be to use novel and more flexible approaches to item redundancy (since this could affect a network structure) and scale dimensionality with the Exploratory Graph Analysis R package (Brown et al., 2023). Another would be to test whether a latent or network model is a better fit to the data using the psychonetrics R package (Kan et al., 2020).
Conclusion
We have shown, through bifactor analysis, that a unidimensional interpretation of the EDS-R was acceptable. Our analysis also revealed that withdrawal could be considered a specific dimension for the EDS-R scale. Withdrawal, like tolerance, is not specific to addiction. Furthermore, it is difficult to measure (Kaptsis et al., 2016; Kardefelt-Winther et al., 2017; Starcevic, 2016). In fact, withdrawal symptoms are measured in contexts where the item formulations refer to hypothetical behaviors: “If I cannot perform physical activity, then I feel anxious, angry, and depressed.” As Starcevic (2016) states, withdrawal symptoms in behavioral addictions have been described in the form of emotional states. Withdrawal as a factor in substance addiction involves both physical and emotional symptoms. Thus, an individual who stops taking drugs is bound to report physiological consequences of cessation. One cannot ask an athlete to stop doing physical activity forever. Therefore, cessation cannot be applied to behavioral addictions – PPA in this case. Concretely, if we were to ask an athlete or any active person how they would react today if they were prevented from doing their regular physical activity, they would probably say that they would experience a degree of emotional negativity due to lack of physical activity. But this alone is not sufficient to distinguish between the normal and pathological response to the cessation of physical activity.
If item answers are most often only hypothesized self-projections, we are brought back to two points. First, when you practice a physical activity that is pleasurable, it allows you to decompress, feel positive emotions, or manage those that are negative, so it is not uncommon to experience withdrawal symptoms when you stop the practice, without necessarily being dependent or developing addictive behavior (Szabo & Egorov, 2015). Second, most studies measured the presence or absence of withdrawal symptoms, but their intensity and severity should also be assessed (Szabo & Egorov, 2015). Given the inconsistencies with respect to the terminologies for PPA due to conceptual and methodological limitations (Szabo et al., 2015), it is important that the factors specific to PPA are determined. Therefore, as our bifactor analysis shows, the place of withdrawal as a psychological construct in defining PPA should be further investigated by other researchers.
As it is, the concept of PPA might still need to be further investigated, both as a construct reflecting subjective experience and in terms of the degree to which items capture this experience, with cognitive interviews. Also, modeling techniques such as structural equation modeling are a highly effective way to test the latent structure of PPA, if such a latent structure (common cause) is indeed the generative model explaining the subject’s responses to the item scale. However, since unidimensionality is plausible in light of our results, it is still possible that another model such as a network could be a generative model for PPA. This would involve local dependence between items and to consider PPA as an emergent property of its interacting parts (Borsboom et al., 2021). Such a model could help clarify complex interactions in the PPA system and might better delineate the role of withdrawal within it.
Footnotes
Authors’ Contribution
Laurence Kern: Conceptualization: Lead; Data curation: Lead; Formal analysis: Lead; Investigation: Lead; Methodology: Equal; Project administration: Lead; Resources: Equal; Software: Lead; Supervision: Lead; Validation: Lead; Visualization: Lead; Writing – original draft: Lead; Writing – review & editing: Lead). Mattar Lama (Visualization: Supporting; Writing – review & editing: Supporting; Verification English language: Equal). Kotbagi Gayatri (Methodology: Supporting; Project administration: Supporting; Writing – original draft: Supporting; data collection: Supporting). Romo Lucia (Project administration: Supporting; Writing – review & editing: Supporting; contributes to data collection: Supporting). Yannick Morvan (Conceptualization: Equal; Data curation: Equal; Formal analysis: Equal; Investigation: Equal; Methodology: Equal; Project administration: Equal; Resources: Equal; Software: Equal; Supervision: Equal; Visualization: Equal; Writing – Powered by original draft: Supporting; Writing – review & editing: Equal; open source data management: Lead)
Declaration of Conflicting Interests
The author(s) declared no potential conflicts of interest with respect to the research, authorship, and/or publication of this article.
Funding
The author(s) received no financial support for the research, authorship, and/or publication of this article.
Author Biographies