
Abstract
Auditory-motor and visual-motor networks are often coupled in daily activities, such as when listening to music and dancing; but these networks are known to be highly malleable as a function of sensory input. Thus, congenital deafness may modify neural activities within the connections between the motor, auditory, and visual cortices. Here, we investigated whether the cortical responses of children with cochlear implants (CI) to a simple and repetitive motor task would differ from that of children with typical hearing (TH) and we sought to understand whether this response related to their language development. Participants were 75 school-aged children, including 50 with CI (with varying language abilities) and 25 controls with TH. We used functional near-infrared spectroscopy (fNIRS) to record cortical responses over the whole brain, as children squeezed the back triggers of a joystick that vibrated or not with the squeeze. Motor cortex activity was reflected by an increase in oxygenated hemoglobin concentration (HbO) and a decrease in deoxygenated hemoglobin concentration (HbR) in all children, irrespective of their hearing status. Unexpectedly, the visual cortex (supposedly an irrelevant region) was deactivated in this task, particularly for children with CI who had good language skills when compared to those with CI who had language delays. Presence or absence of vibrotactile feedback made no difference in cortical activation. These findings support the potential of fNIRS to examine cognitive functions related to language in children with CI.
Introduction
Imitation and action learning are inborn abilities that help babies interact with external signals in real-time and build the neural basis for sensorimotor synchronization through their first months of life. Experiences like being rocked or listening to a rhythmic song stimulate babies’ sensory organs and help them connect sound to movement (Laland et al., 2016; Oztop et al., 2006; Repp & Su, 2013). Step by step and during the first year, babies become experts in beat perception, categorization of rhythms, and synchronization of body movements with auditory perception (Hannon et al., 2017). This entrainment and rhythmic coordination of movements toward external stimuli plays a key role in shaping the foundation of auditory-motor coupling, which is a prerequisite for higher cognitive functions and, most specifically, for speech performance (Chen et al., 2006; Kasdan et al., 2022; Lehmann et al., 2016; Puschmann et al., 2021; Zatorre et al., 2007).
A complicated neural network spreading from subcortical and cortical regions underlies auditory-motor interaction (Cannon & Patel, 2021; Nozaradan et al., 2018; Zatorre et al., 2007). More specifically, for speech performance, this auditory-motor interplay has been understood in terms of a dual stream model in which speech processing involves ventral and dorsal pathways that form the bases for speech recognition and production, respectively (Hickok & Poeppel, 2007). Structures in the superior and middle portions of the temporal lobe cooperate to form the ventral pathway, bilaterally, while the dorsal stream is more dominant in the left hemisphere and includes structures in the posterior temporal lobe, parietal operculum, and posterior frontal lobe. This dorsal pathway plays a prominent role in beat detection, auditory-motor integration, and most specifically in creating frontal lobe articulatory representations of speech signals (Hickok, 2022). From this neurological angle, it makes sense that this dorsal stream activity would be relevant to speech and communication disorders.
The interface between motor actions and auditory information in the dorsal pathway has some role in beat perception within the context of other sensory modalities like vision and proprioception. Such evidence emphasizes the importance of processing sensory stimuli independent of their modality, and pinpoints functional organization with respect to the stimuli attributes (Araneda et al., 2017; Karabanov et al., 2009; Su, 2014). Indeed, multisensory integration generates a comprehensive profile of the external world (Dionne-Dostie et al., 2015). The organizational balance between neighbouring brain regions involved in multisensory integration can be altered when one sensory modality is impaired or absent. Intra-modal changes then occur within different layers of the affected sensory cortex, but changes across modalities may also occur. This latter phenomenon is referred to as cross-modal neuroplasticity. The part of the cortex that is no longer exposed to sensation from the impaired modality becomes sensitive to other (intact) sensory modalities (Bavelier & Neville, 2002; Voss & Zatorre, 2012). One common cause of cross-modal plasticity - of particular interest here is the lack of auditory stimulation (Kral & Pallas, 2011).
Hearing loss is accompanied by substantial alterations in the structure and functional connections of the auditory cortex (Dell Ducas et al., 2021; Manno et al., 2021; Shiell et al., 2015; Wallace et al., 2020). The so-called takeover of the auditory cortex by the visual sense is one of the most notable, or rather most studied, phenomena (Campbell & Sharma, 2014; Wang et al., 2019). This phenomenon is highly adaptive (Voss et al., 2010) and has attracted numerous neuroimaging and electrophysiological studies revealing superior visual functioning among people with severe hearing loss, relative to those with typical hearing (TH) on tasks like visual speech comprehension (Lyxell & Holmberg, 2000), visual motion detection (Bottari et al., 2014), recognition of communicative gestures (Simon et al., 2020), and sign language (Capek et al., 2008; Fine et al., 2005). Considering the cooperation of three functional modalities (e.g., auditory, vision, and motor) in this multimodal network, the auditory cortex might be less connected to the motor cortex in children with severe hearing loss than in TH controls, and the visual cortex might be more connected with both motor and speech cortices (Shi et al., 2016).
Restoration of sensory stimuli might partially reverse the changes first associated with sensory impairment (although this is not always true for the visual sense; e.g., see Mowad et al., 2020). Within this context, children with cochlear implants (CI) provide an important opportunity to study how restoration of hearing might reverse changes induced during auditory deprivation (Kral et al., 2019). Children implanted early in life might be particularly prone to such reversal changes, depending on the strategies followed by a given child and their family in terms of language development (some being more prone to visual language at home, with others emphasizing oral communications). According to the sensorimotor coupling model of speech development (Westermann & Miranda, 2004), we hypothesized that at least some children with CI would bear similarities to children without hearing in that the functional connectivity between auditory and motor cortices would be weakened compared to controls with TH. In contrast, connectivity between their visual and motor cortices would be strengthened compared to children with TH.
Of note, however, coupling between two brain regions is not necessarily positive. In a purely motor task (devoid of speech content), neither the auditory nor the visual cortex would be expected to contribute to squeezing a joystick. Thus, the prediction of a weaker auditory-motor coupling could translate into a weaker deactivation of the auditory cortex; and, similarly, the prediction of a stronger visual-motor coupling could translate into a stronger deactivation of the visual cortex as the motor cortex activates. If changes in the multimodal integration network are related to language and communication, we would further hypothesize that the quality of coupling (auditory-motor or visual-motor) would differ for children with good versus poor language skills, with the latter group activating a network pattern more similar to individuals without hearing (non-implanted).
For the reader who is naïve to CI science, we should emphasize that outcomes with these devices are vastly heterogeneous. While CI technology has been effective in restoring hearing and allowing communication in quiet environments, there have been many cases in which users of these devices gained little benefit in important aspects of daily life. Concerning pediatric CI users, the research emphasis has often been on academic performance (Marschark et al., 2007; Wilson Ottley et al., 2023) and some children have continued to struggle despite early implantation (Ching et al., 2018; Dettman et al., 2016; Geers et al., 2017; Wolfe et al., 2021). The extent to which these differences stem from variable multimodal integration, language processing difficulties, or functional activation/deactivation of various brain regions has remained unclear.
Clinically, a better understanding is needed. One recent research team (Choi et al., 2020) evaluated the academic performance of 6-17-year-old children who had early implantation and at least five years of hearing experience with CIs. These children still had difficulties understanding abstract concepts in science and social sciences, and they showed problems in speech perception in noisy or group environments. Although assistive hearing technologies may enhance children’s speech perception and academic performance, they do not guarantee age-appropriate or grade-level abilities. Neuroimaging technologies may help researchers better understand the source of these discrepancies.
Functional near-infrared spectroscopy (fNIRS) is a safe, practical, and informative neuroimaging tool that can depict patterns of cortical activation and deactivation in pediatric CI recipients (Saliba et al., 2016). Like functional magnetic resonance imaging (fMRI), fNIRS relies on blood-oxygen-level-dependent (BOLD) signals. In fMRI, brain activation is inferred from an increase in blood flow (i.e., local oxygenation), and, hence, a reduction in the relative proportion of deoxy-hemoglobin. With less deoxy-hemoglobin, the fMRI or fNIRS signal rises above baseline and is detectable. BOLD activation has direct links to neuronal activation. On the other hand, deactivation happens when oxy-hemoglobin decreases, causing a net increase in deoxy-hemoglobin (Frankenstein et al., 2003).
Unlike fMRI, which only detects changes in deoxy-hemoglobin (most specifically in venous blood), fNIRS directly estimates the level of both oxy- and deoxy-hemoglobin in arterial and venous blood. Therefore, despite certain technical limitations (see Discussion section of this paper), fNIRS has an advantage over fMRI for examining the exact nature of neurovascular coupling. Since hemodynamic responses are dynamic interactions between vascular systems that cooperate to deliver and extract oxygen, imaging that does not provide information about the arterial side of this interplay can lead to misinterpretation; recording both oxy- and deoxy-hemoglobin depicts neurovascular coupling more precisely (Tam & Zouridakis, 2014). We took advantage of this technique with measurements over the whole brain, even though our analysis focused on certain brain regions of interest (ROI), namely motor, auditory, and visual cortices.
Method
Participants
Our study took place in Oklahoma City at Hearts for Hearing (https://heartsforhearing.org/). Seventy-five children between 7 and 18 years old were selected from patient records: 50 with CIs (CI group- Tables 1-A and 2-A) and 25 controls with typical hearing and language development (TH group). Details about inclusion/exclusion criteria, participants’ demographic characteristics, hearing experience, and device use are provided in Wolfe et al. (2021), a study that reported exclusively on audiological outcomes. In the present study, CI recipients were divided into two groups based on their language skills: 26 children had age-appropriate language skills (referred to as Typical Language, or TL group) and 24 had language delays (referred to as Low Language, or LL group). Language skills were assessed through the Clinical Evaluation of Language Fundamentals - Fifth Edition (CELF; Wiig et al., 2013). The CELF included an age-based assessment of Receptive Language Index, Expressive Language Index, Core language Score, Language Structure and Content.
All children with CIs had received implants before four years of age, and they were all properly fitted (aided thresholds <30 dB HL) and communicated primarily through spoken language. The three groups (CI with TL, CI with LL, and TH) were matched by sex but not by chronological age. While this age difference was not intended, it may have conferred a maturational advantage to the CI with LL group compared to the CI with TL group.
We explained the study rationale to each child and their parents, after which the parents provided their informed consent. Note that the full study from which this experiment was drawn was more extensive than that described in this article in that several other tasks were also conducted: a low-level visual task (checkerboard), a low-level auditory task (oddball design), a phonological task (words and sudo-words), audio-visual integration, emotional processing (a 10-min video from the movie Despicable Me), and a 7-min resting-state recording. As the entire protocol was lengthy, testing was conducted at different times separated by a large time break. Participants were compensated financially ($25/hour) for their entire participation. The study protocol was approved by the Western Institutional Review Board and all the ethical considerations in research were respected (reference #20190882).
Protocol
Children sat in front of a monitor and held a joystick. The response protocol involved completing a block design task with 10 motor events that were 15 seconds long, alternating with 10 rest periods of 15 seconds. In each event, the word “squeeze” was displayed every second on a laptop that was placed one meter in front of the children; and the children were instructed to squeeze the two back triggers of the joystick each time they saw the cue (Figure 1). In half of the blocks, the joystick also vibrated with the squeeze, allowing us to probe both somatosensory and motor processing. This experimental session lasted 5 minutes. It was coded in PsychoPy (https://www.psychopy.org/) and included triggers at the onset of each event. Experimental Protocol Depicting a Child Squeezing the Joystick When Instructed by a Monitor to Do So, in a 15-s Block-Design.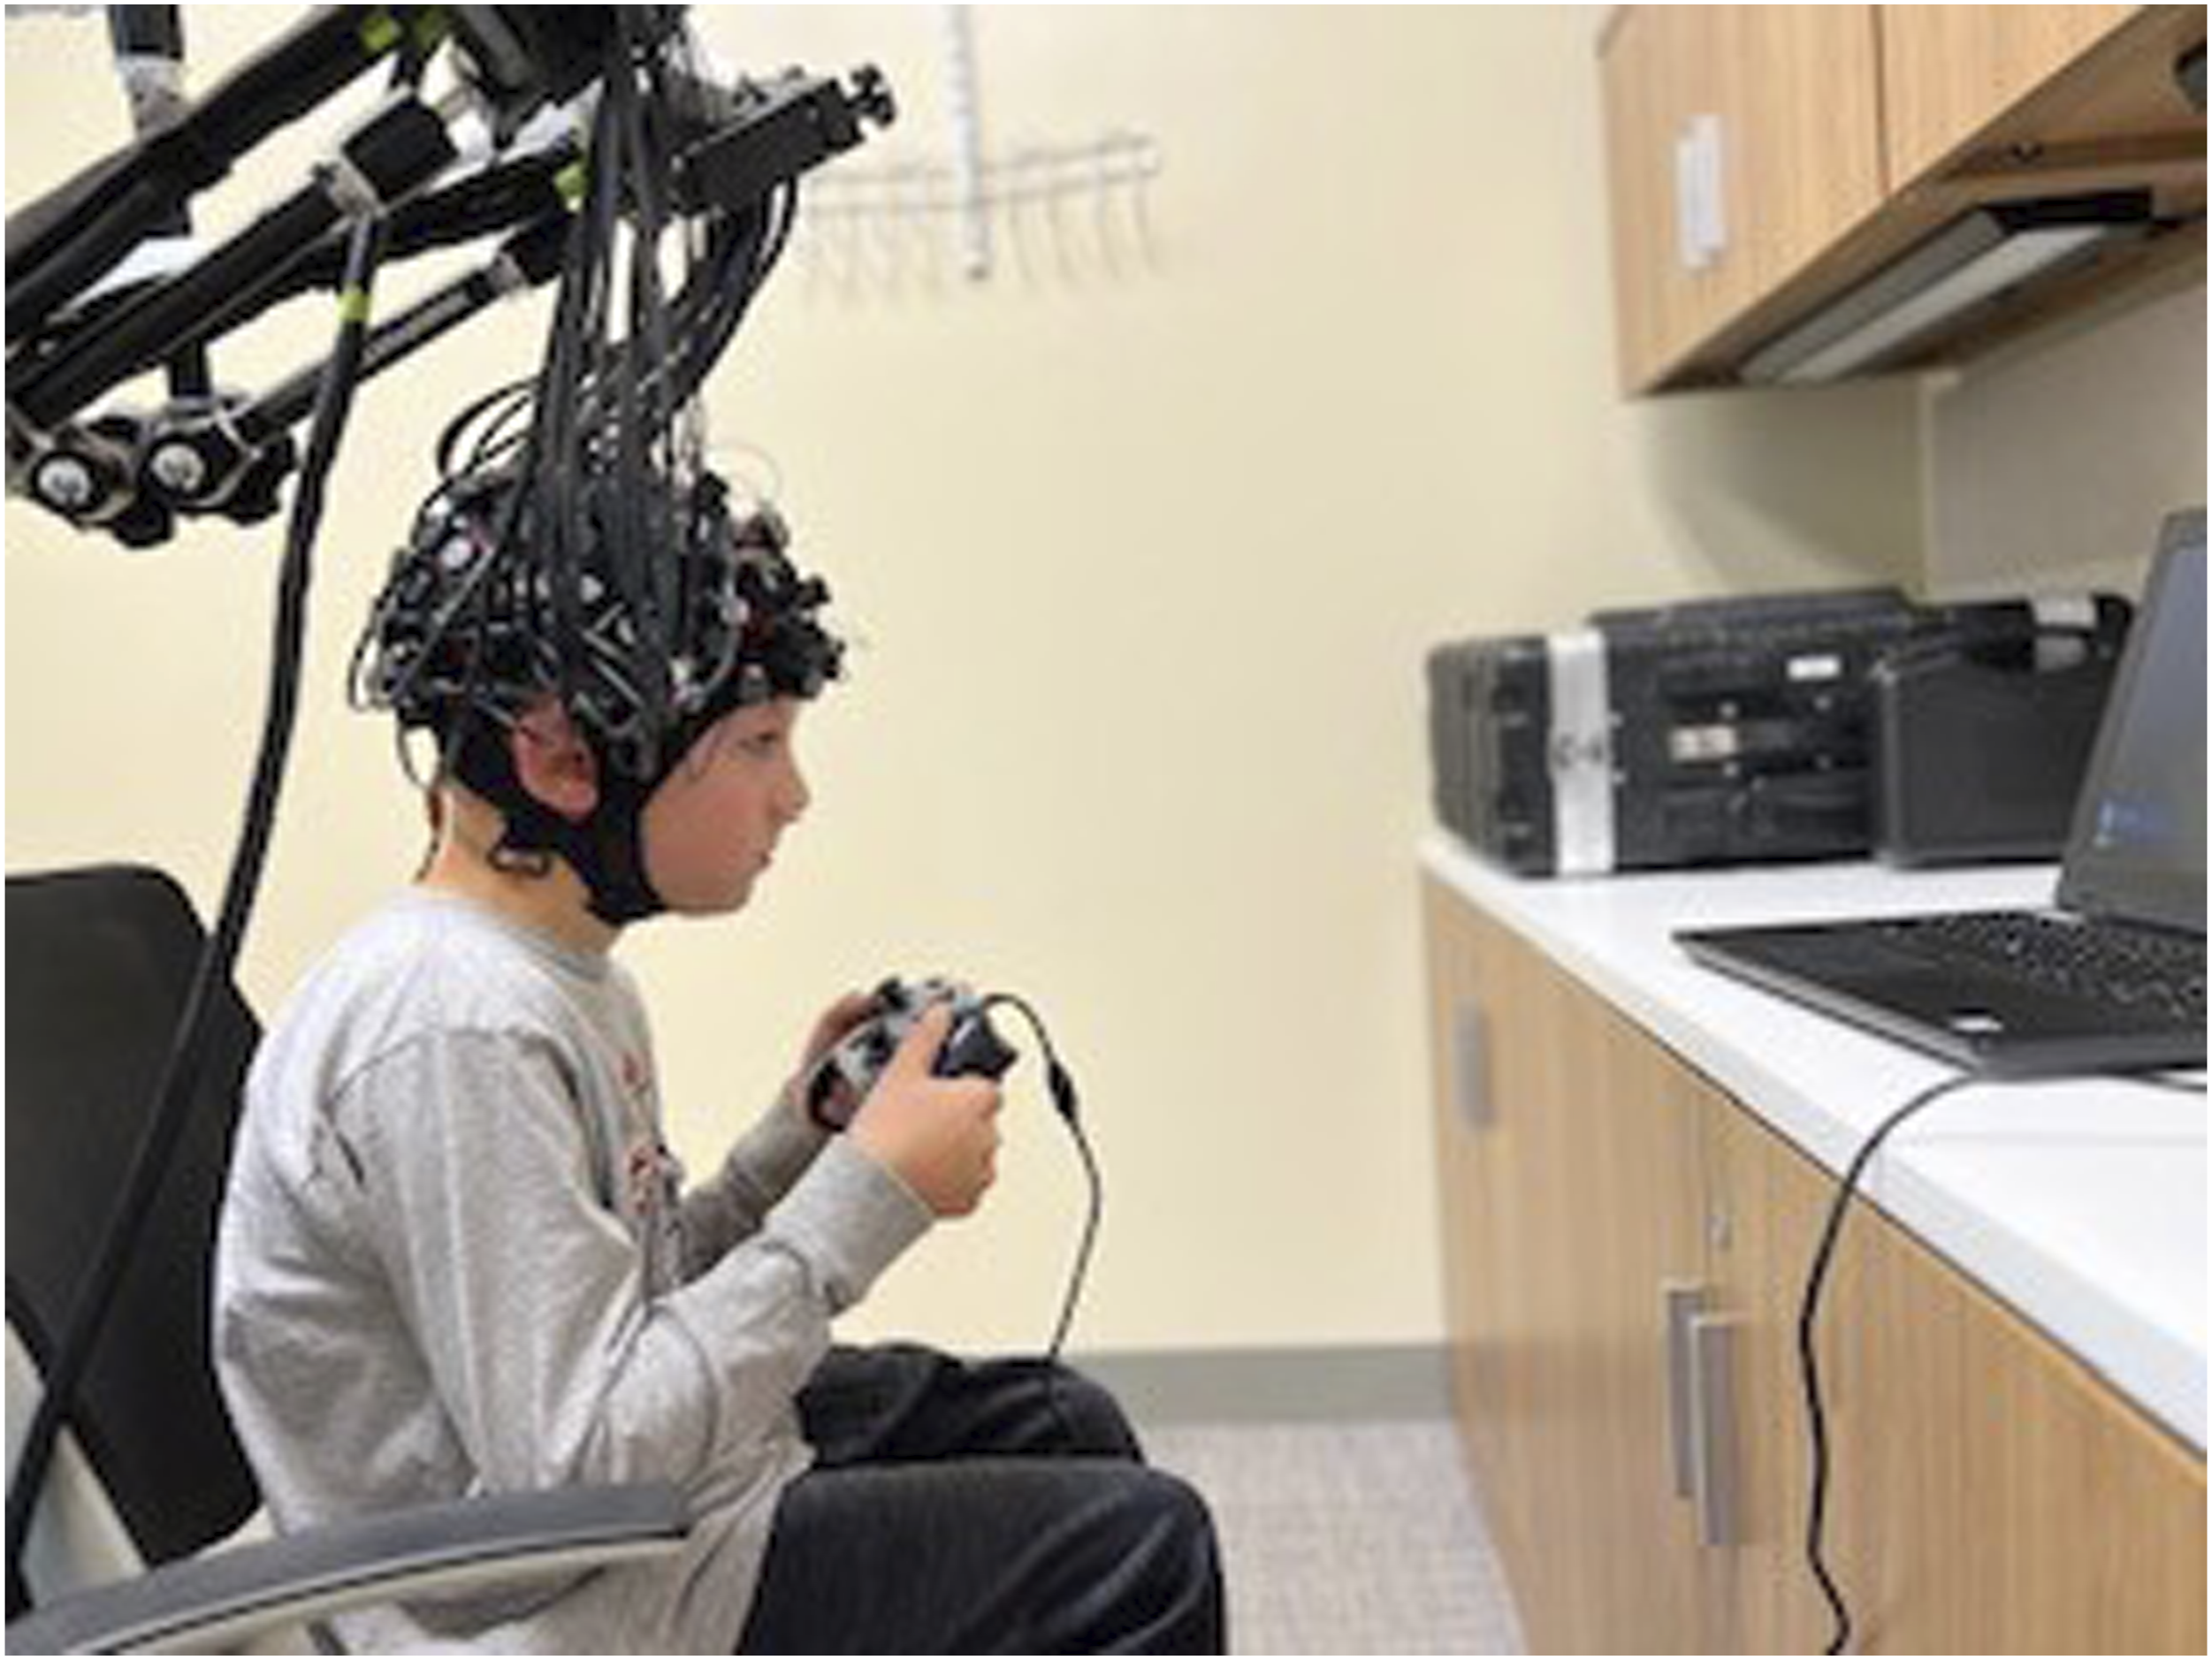
Apparatus
We recorded continuous fNIRS using 39 LED sources and 31 detectors from the NIRScout system developed by NIRx Medical Technologies (LLC, USA). The theoretical montage (Figure 2) resulted in a total of 122 channels, with no short channel. Each source emitted light at two wavelengths of 760 and 850 nm. An EasyCap (EASYCAP GmbH, Germany) was used to hold the sources and detectors, and their position was registered using the Structure Sensor Pro application by Occipital Inc. (https://structure.io/structure-sensor-pro. with three fiducials (nasion and left/right pre-auricular point) and later digitized using the FieldTrip Matlab toolbox (Oostenveld et al., 2011). Out of the 122 channels, the source-detector distance was on average 29.9 mm (SD = 6.5 mm). Four ROIs were selected. fNIRS Montage with 39 Sources (red) and 31 Detectors (Blue) Making Up a Total of 122 Channels.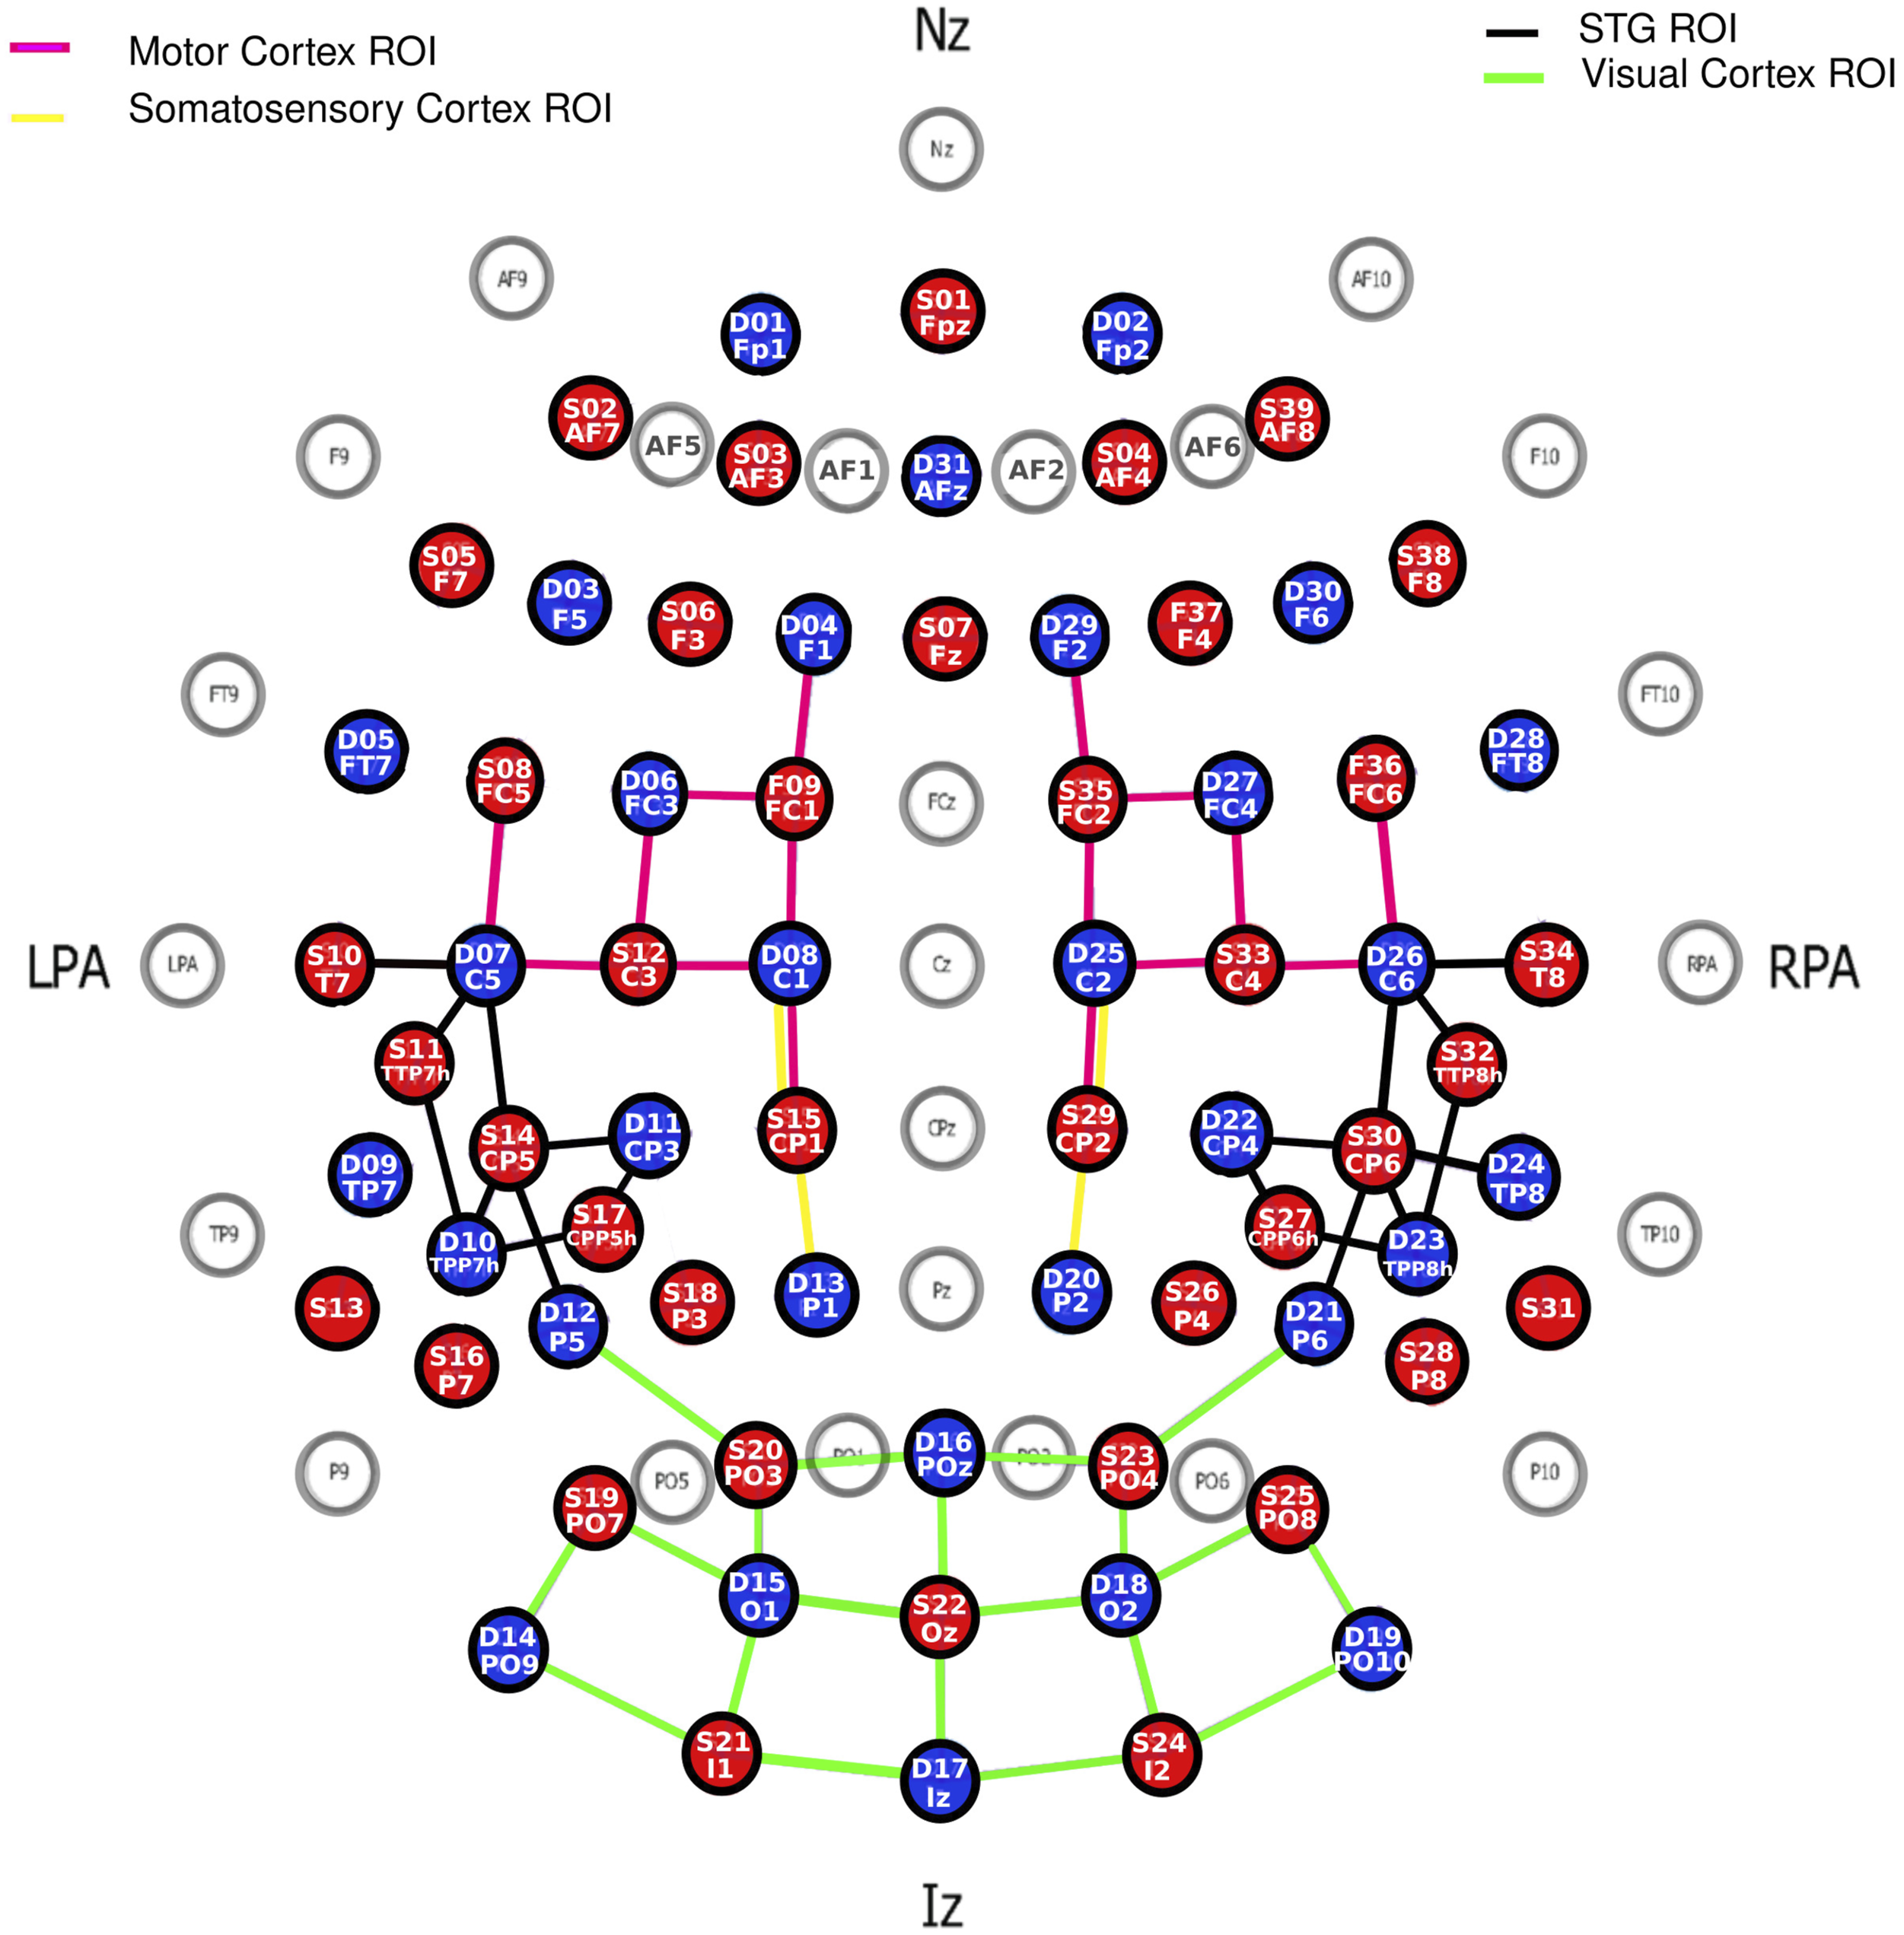
Data Analysis
We analyzed data using the NIRS toolbox (Santosa et al., 2018) running in MATLAB. First, the entire recording was trimmed 5 seconds before the first trigger and 5 seconds after the last trigger. Second, oversaturated channels were replaced with high-variance noise. Third, bad channels were flagged if their standard deviation over the trimmed signals (averaged over the two wavelengths) exceeded 15%. These bad channels reflected major alterations in the signal caused by environmental noise or physiological artifacts. There were, on average, 15.0 (SD = 13.7), 13.9 (SD = 11.3), and 7.3 (SD = 8.9) bad channels out of 122, in each group respectively. This number of bad channels differed significantly across groups, F (2,72) = 3.3, p = .043, as data obtained from TH children tended to be cleaner than data obtained from children with CI (although none of the pairwise comparisons reached significance, p > .056). This difference may have occurred because the presence of the coil may have been detrimental to scalp-to-optode contact. All flagged channels were linearly interpolated from adjacent good channels. Fourth, signals were converted to optical density (Huppert et al., 2009). Fifth, motion artifacts in these data were corrected using Temporal Derivative Distribution Repair (TDDR) that were first projected onto a principal components analysis (PCA) space before returning to the optical density space (Fishburn et al., 2019). Sixth, optical density signals were converted into changes in oxygenated hemoglobin concentration (HbO) and deoxygenated hemoglobin concentration (HbR) using the modified Beer-Lambert Law and using the source-detector distances calculated from the digitized montage specific to each child. The partial path length factors were set at 7.25 and 6.38 for the 760 and 850 nm wavelengths, respectively. Seventh, the hemoglobin signals were band-pass filtered between .01 and .25 Hz to limit low-frequency drift and cardiac oscillations. Eighth and finally, the hemoglobin signals were passed through a PCA, and the first component was systematically removed to reduce systemic physiological components. These participant-level statistics were performed by the AR_IRLS function of the NIRS toolbox which provided beta weights for each channel. These beta weights (just like in the fMRI field) represented the weight of the regressors (i.e., squeeze vs. rest) obtained when fitting the canonical hemodynamic response function to the time course of the recording, using ordinary least square fit conducted independently for HbO and HbR signals.
The statistical maps of t-statistics contrasting betas in squeeze versus rest were projected on the digitized montage averaged across all 75 children. But to address our hypotheses more directly, we isolated four brain ROIs (Figure 2): (a) the motor ROI was defined by 16 channels that overlapped (according to the Talairach atlas) in different proportions (between 14.2% and 94.4%) with either the primary motor cortex or the pre-motor and supplementary motor cortex; (b) the somatosensory ROI was defined by only four channels that overlapped between 14.4% and 87.0% with the primary somatosensory cortex or the somatosensory association cortex; (c) the auditory ROI was defined by 18 channels that overlapped between 20.7% and 32.1% with the superior temporal gyrus (STG) bilaterally; and (d) the visual ROI was defined by 20 channels that overlapped between 28.4% and 99.4% with either the primary visual cortex or the visual association cortex. In each ROI, a weighted average was calculated over all relevant channels with weights taken directly from how much each one overlapped with the ROI in question. Group averages of HbO and HbR waveforms across the ten blocks of the motor/vibrotactile task were calculated after baseline correction (using 5 seconds prior to the event onset).
We conducted analyses of variance (ANOVAs) with one between-subject factor (groups LL, TL, and TH) in each ROI on the weighted beta average of each ROI for HbO, HbR, and the difference (referred to as hemoglobin difference, HbDiff), for the comparison between the motor task (squeeze) versus rest period. When appropriate, pairwise comparisons were run with Bonferroni corrections to further explore group differences. In the absence of group differences, simple t-tests were conducted on the entire sample (of 75 children) to determine whether a given ROI was activated or deactivated when on the task as compared to rest. Pearson correlational analyses were systematically conducted to examine the relationships between HbDiff and (a) chronological age, (b) age at implantation, and (c) the CELF score. Each attempt was conducted independently (not in a stepwise fashion) for selected ROIs, and Bonferroni corrections were applied to adjust for the inflation of type-I error. Finally, all these analyses were reiterated for brain activity with or without joystick vibration (both being extracted from a common rest baseline).
Results
Motor Cortex
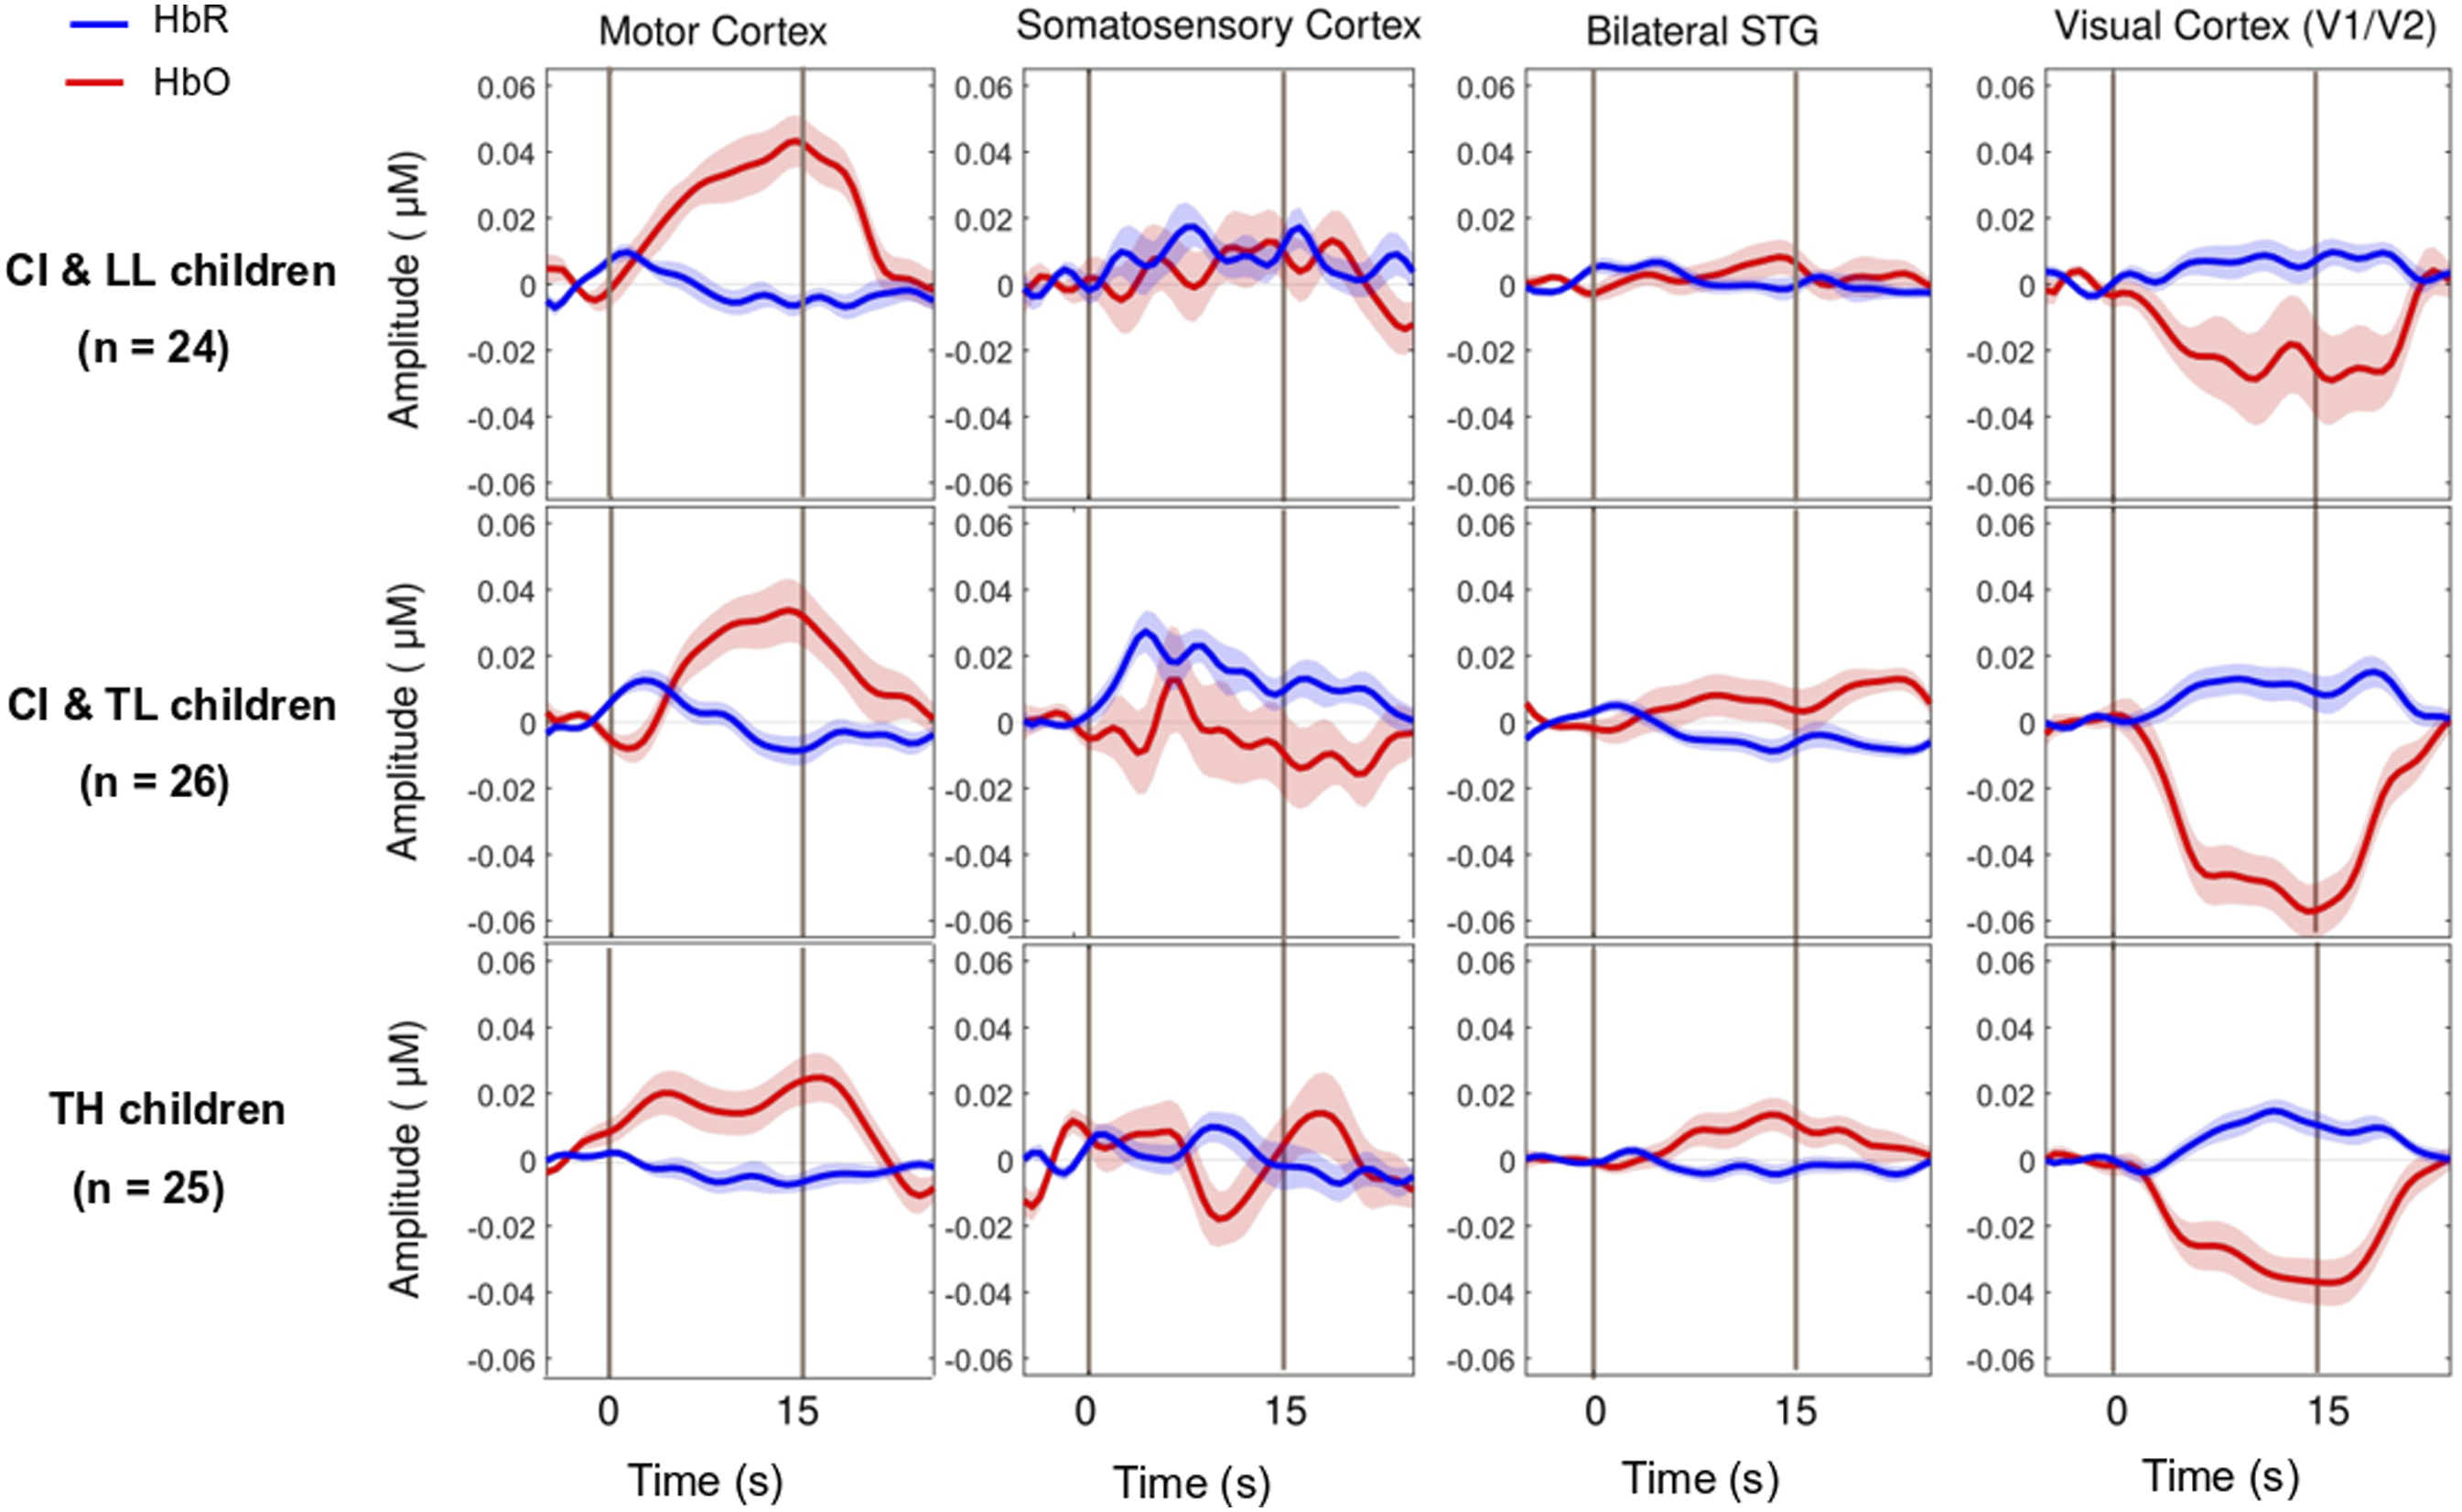
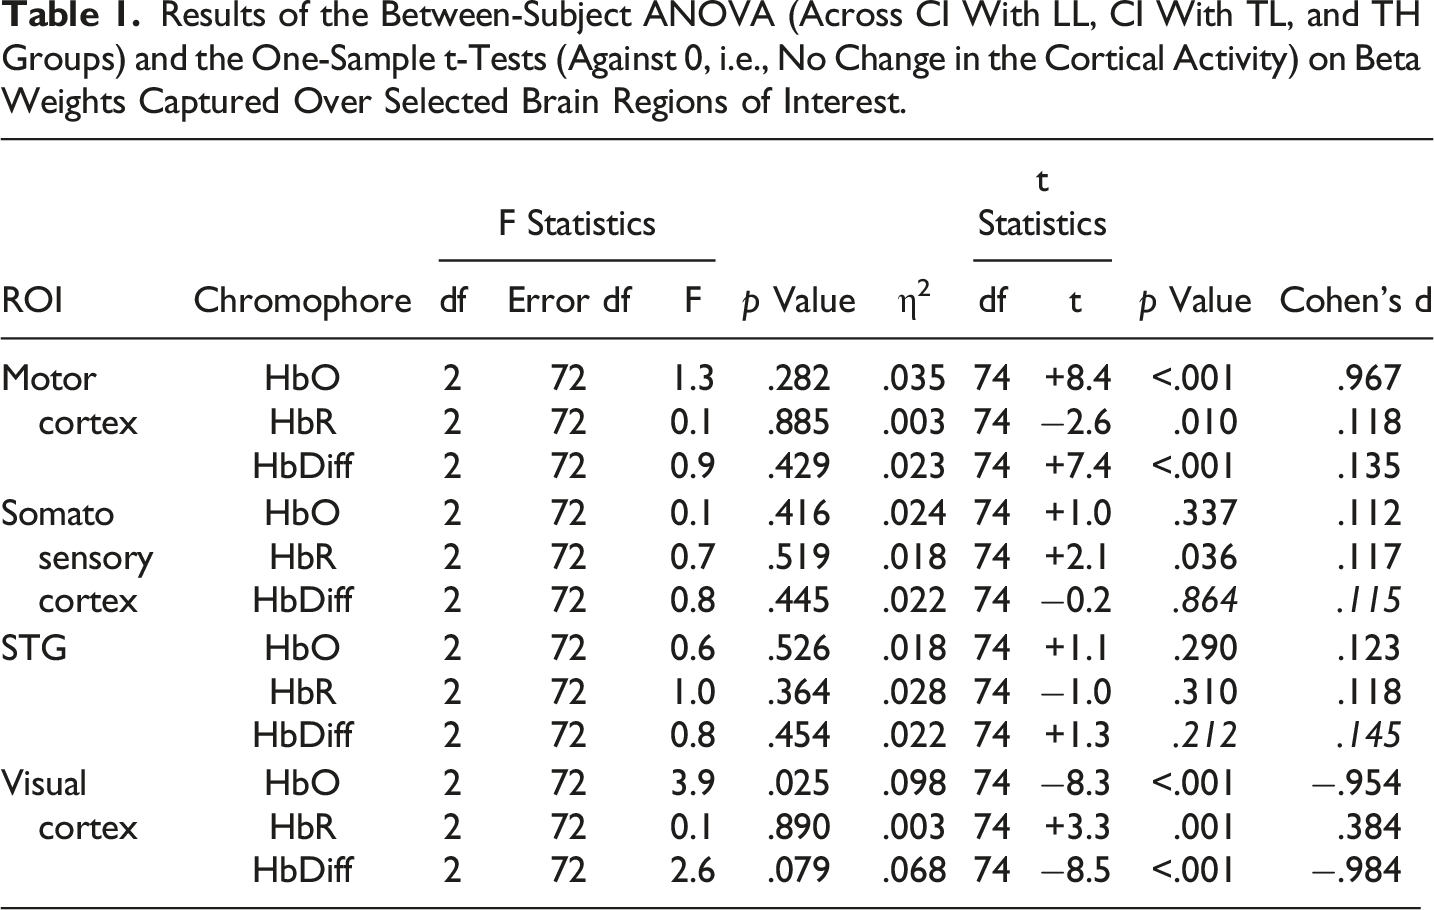
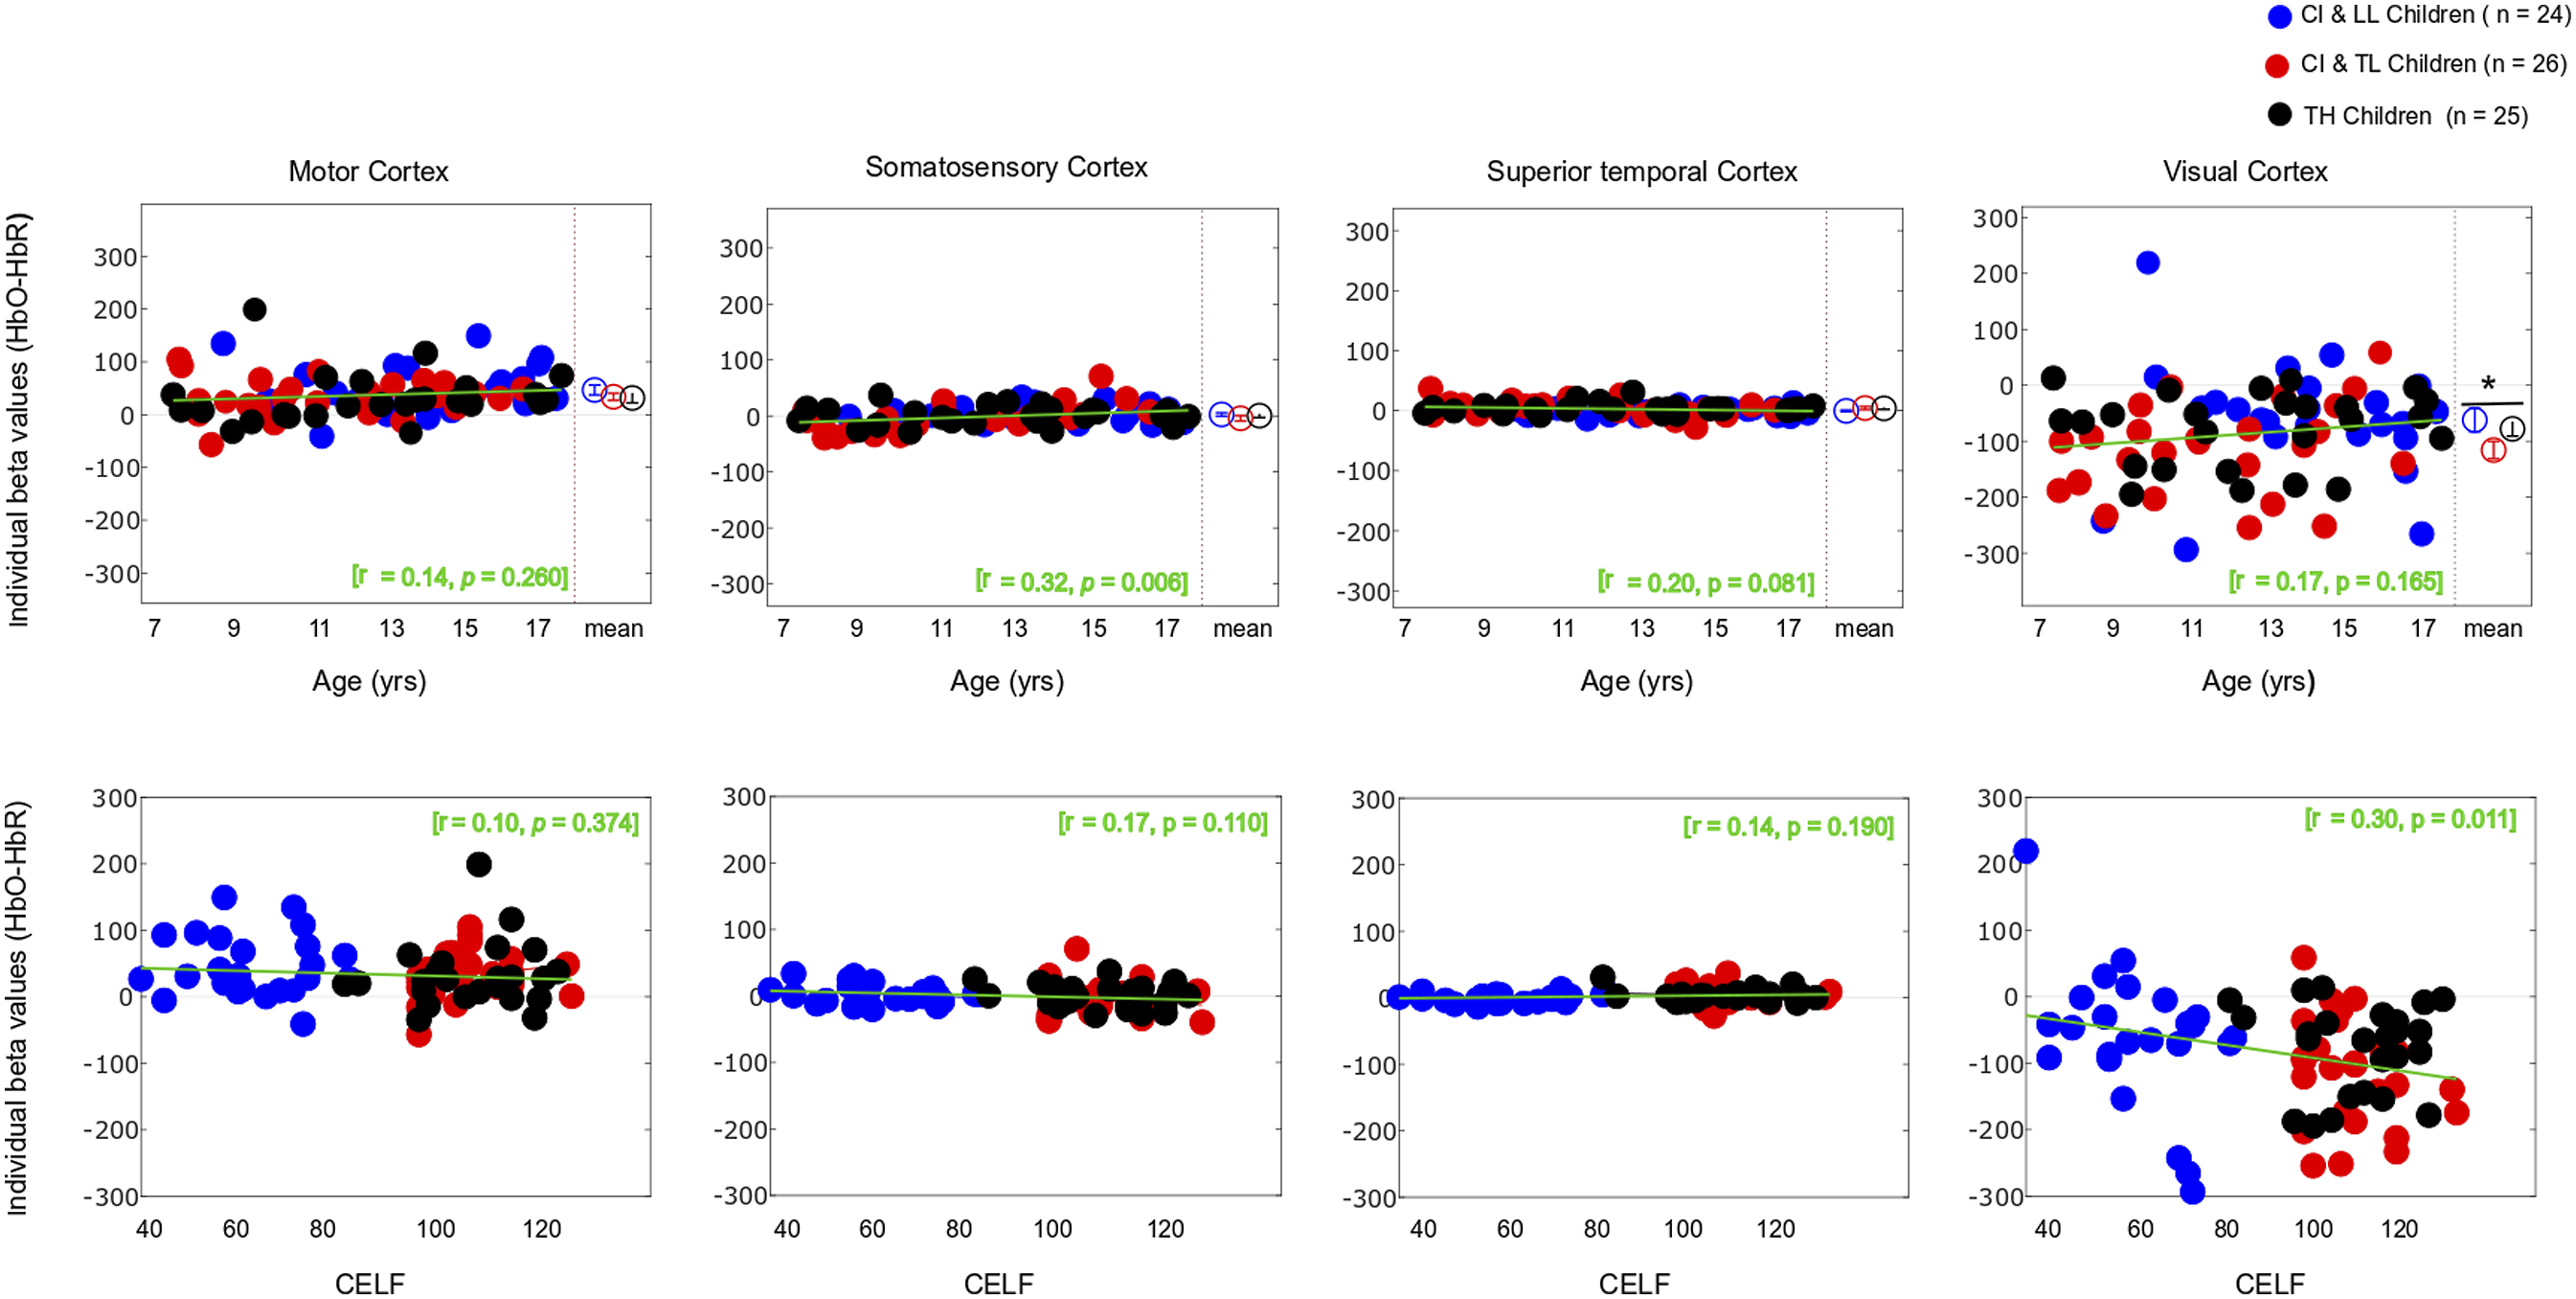
As expected, the motor task elicited a strong response from the motor cortex (Figures 3 and 4-left panels) in all groups, and there was no significant main effect for Group differences. The entire population exhibited a significant increase in HbO, a significant decrease in HbR, and a significant increase in HbDiff during the 15-s squeeze compared to the 15-s rest period (Table 1- top). In other words, all children engaged their motor cortex on this task (and fNIRS successfully revealed this engagement), but children engaged in the task, irrespective of their hearing/language status. Individual beta weights (HbDiff) illustrated that there were no relationships to chronological age or to language outcomes (Figure 5, left panels). Among the children with CI, these values did not relate to their age at implantation [p = .291] (not shown). Three-Dimensional Map of t-Statistic Values on the Beta Weights Obtained for the Effect of the Squeeze versus Rest Periods in Each Group, for Oxygenated Hemoglobin (Top) and Deoxygenated Hemoglobin (Bottom). Group-Averaged Event-Related Changes in Oxygenated and Deoxygenated Hemoglobin (HbO & HbR, respectively) Occurring in the Motor Cortex (Most Left), Somatosensory Cortex (Middle Left), Superior Temporal Cortices Bilaterally (Middle Right), and Visual Cortex (Most Right). Results of the Between-Subject ANOVA (Across CI With LL, CI With TL, and TH Groups) and the One-Sample t-Tests (Against 0, i.e., No Change in the Cortical Activity) on Beta Weights Captured Over Selected Brain Regions of Interest. Individual Beta Weights (HbDiff) Obtained in the Motor Cortex (Most Left), Somatosensory Cortex (Middle Left), Superior Temporal Cortices Bilaterally (Middle Right), and Visual Cortex (Most Right), as a Function of the Child’s Chronological Age (Top) and Their Language Skills (Bottom).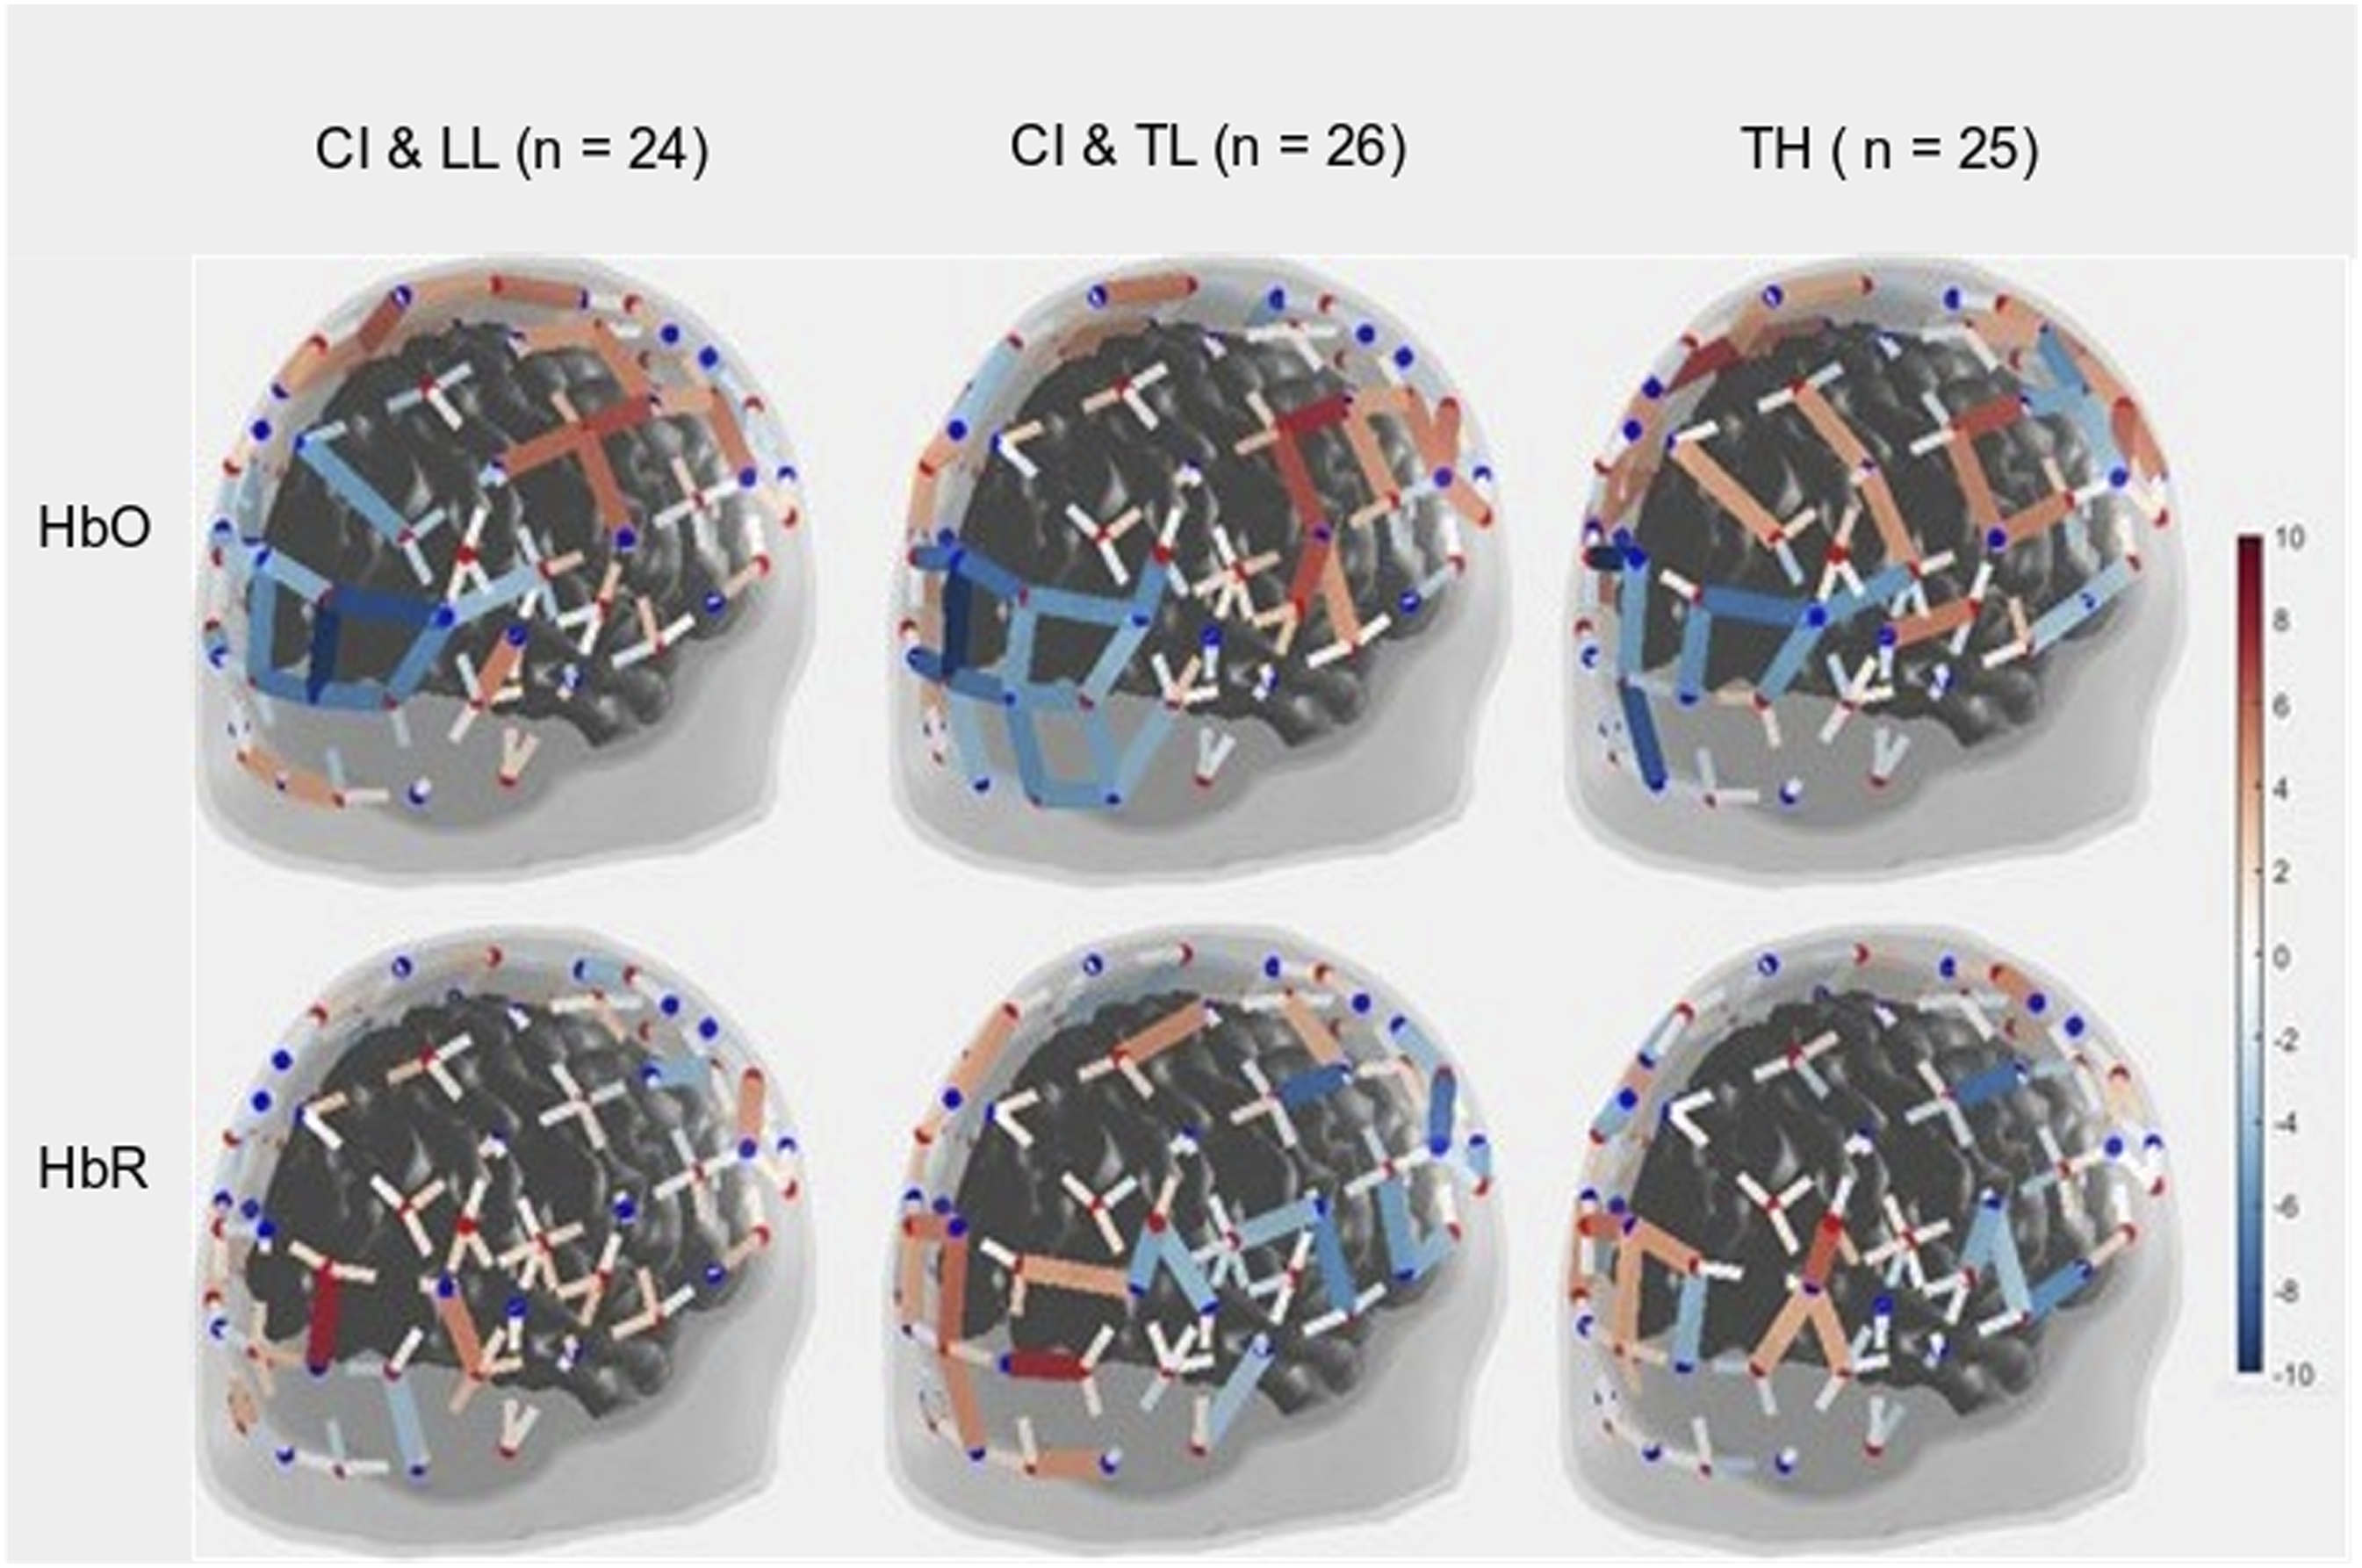
Somatosensory Cortex
There was no significant main effect of Group on somatosensory cortical activation (Table 1- middle top). Across the entire population, there was no significant change in HbO, but there was a modest increase in HbR and no change in HbDiff during the 15-s squeeze compared to the 15-s rest period. If anything, the somatosensory cortex seemed to have been deactivated, irrespective of hearing status (Figure 4, middle left). However, we caution this interpretation since somatosensory cortical activity was positively correlated (across all participants) with motor cortex activity, as illustrated in Figure 6 (left panel). Individual beta weights were correlated with chronological age; younger children tended to show deactivation while older children tended to show activation of their somatosensory cortex. Yet, there was no relationship between HbDiff and language skills (Figure 5, middle left). Within the CI group, there was no relationship between HbDiff in this ROI and age at implantation [p = .822] (not shown). Individual Beta Weights (HbDiff) Obtained in the Motor Cortex versus Somatosensory (left) or Visual (right) Cortex.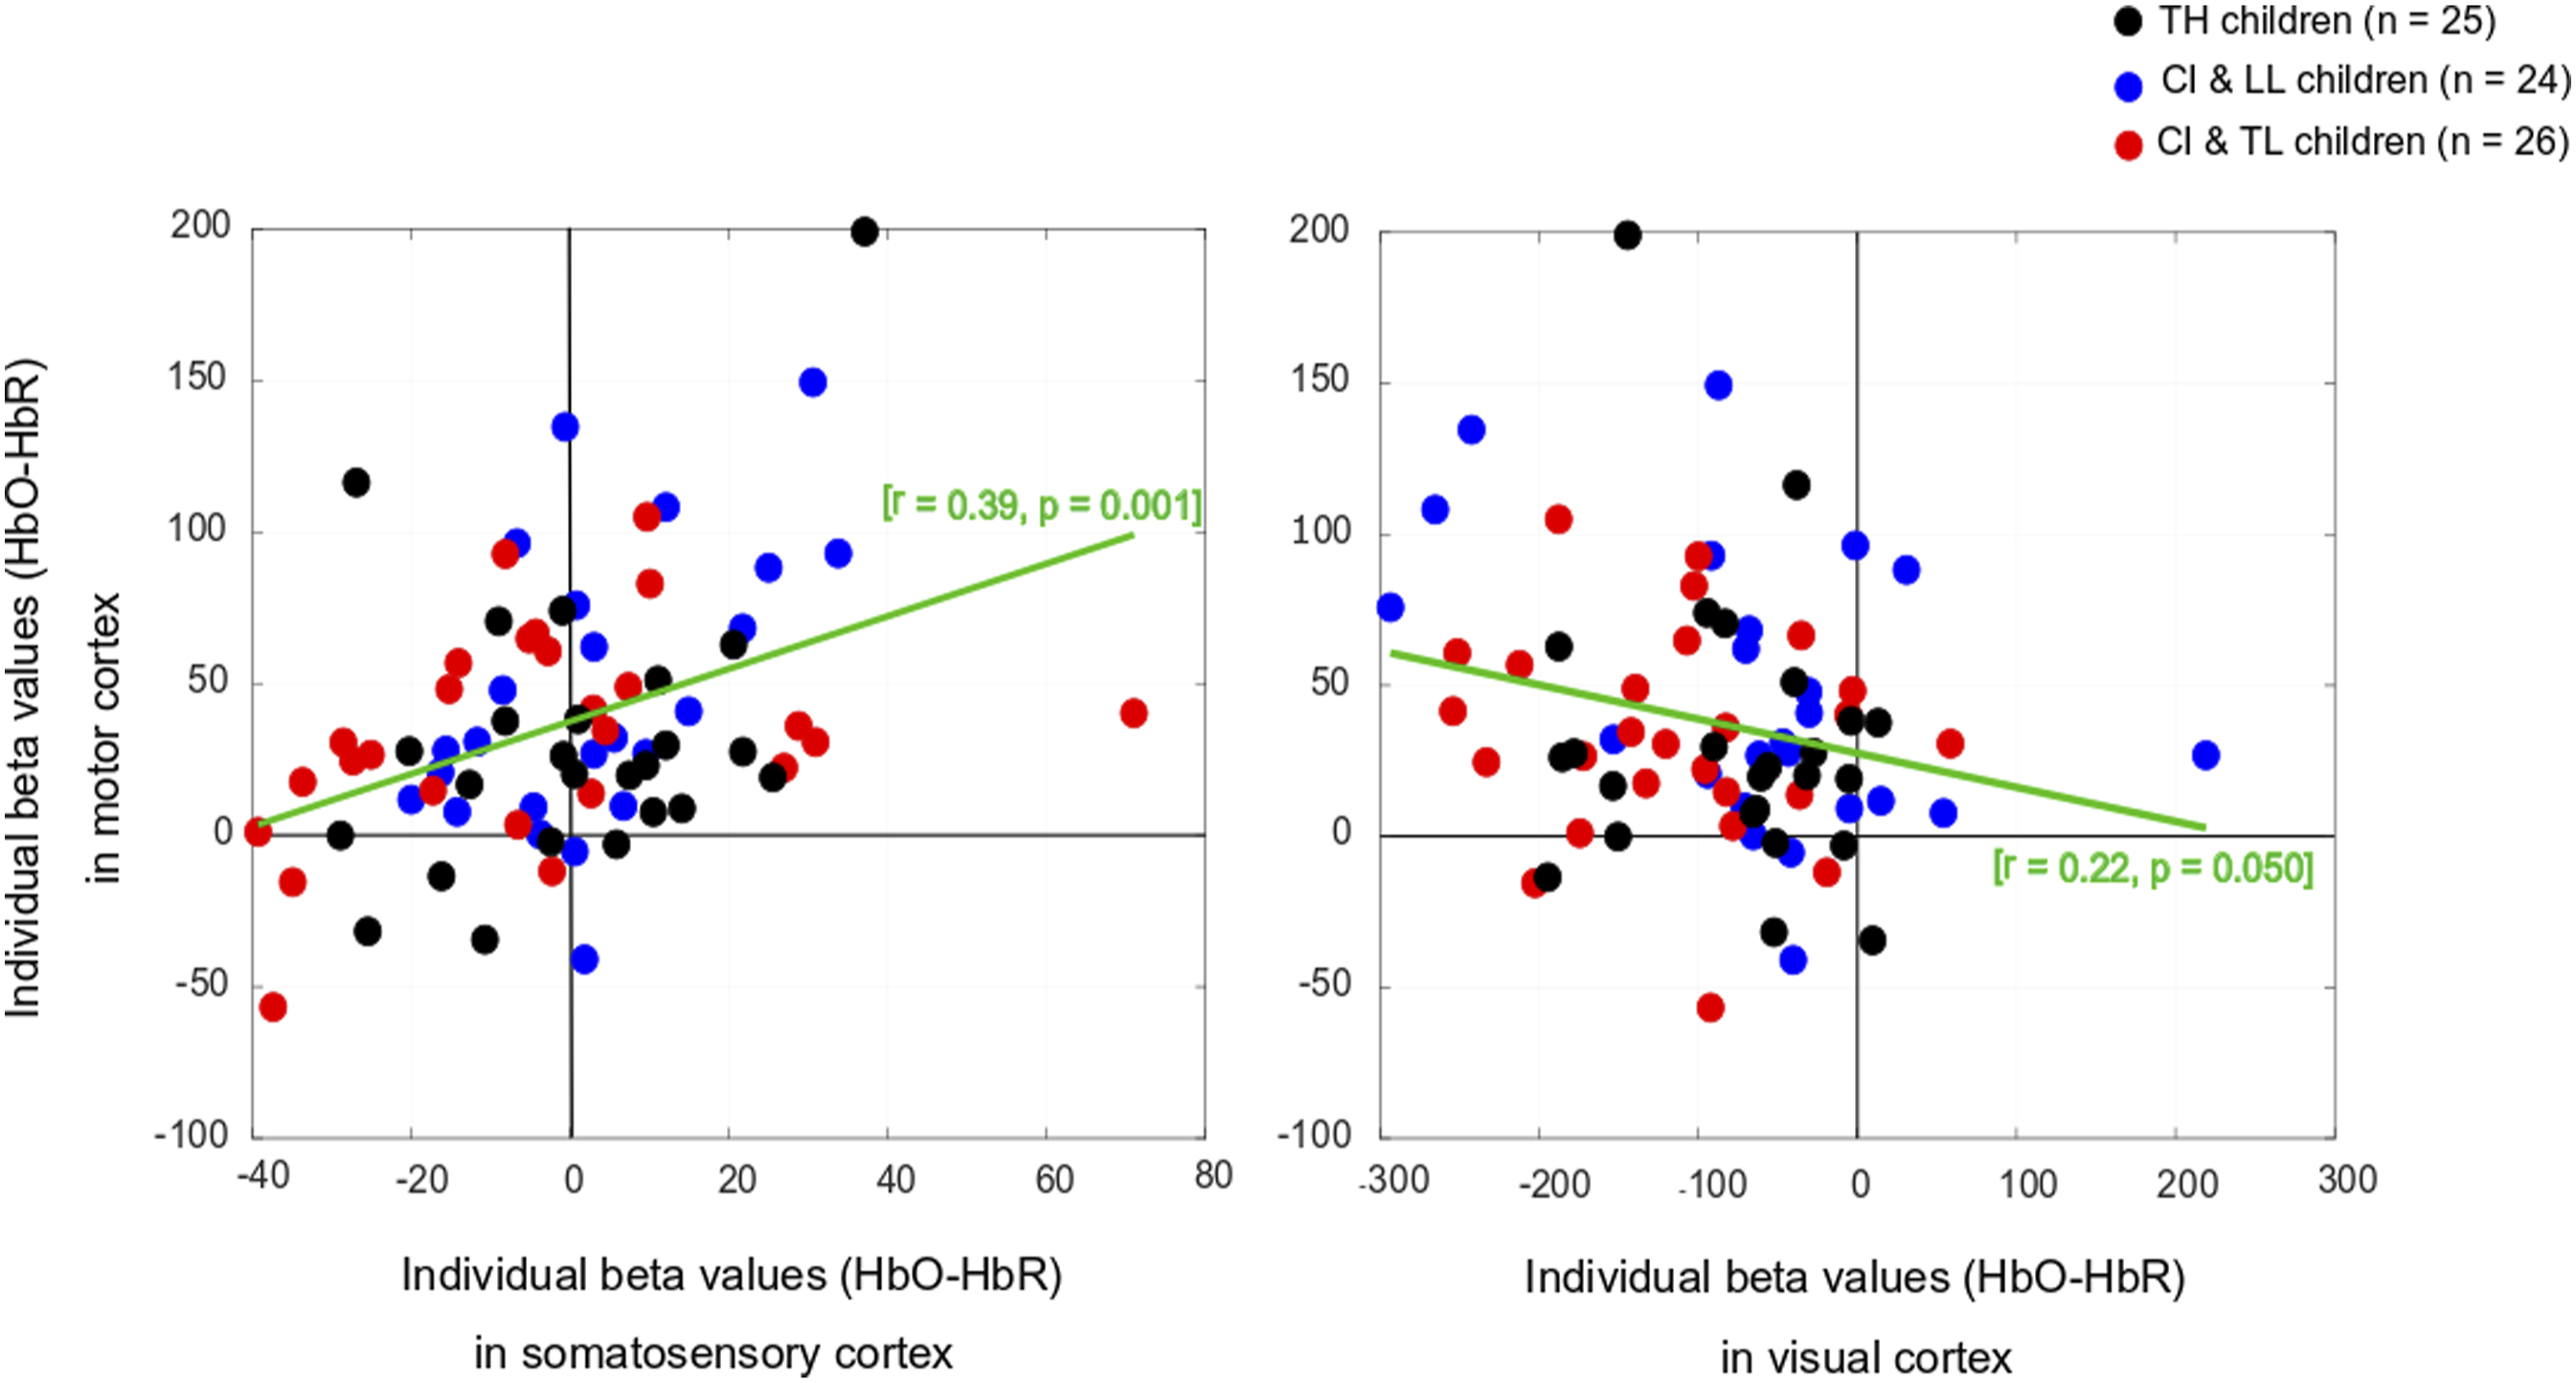
Bilateral Superior Temporal Gyrus
Regarding activation of the bilateral STG, there was no significant main effect across the three groups of study (Table 1- middle bottom). The entire population exhibited no significant change in HbO, HbR, or HbDiff during the 15-s squeeze compared to the 15-s rest periods (Figure 4, middle right). Put differently, there was no change in the activity of the STG, and activity in these regions was not significantly correlated with activity in the motor cortex [p = .874] (not shown). Individual beta weights for brain activity in this ROI did not depend on chronological age or language skills (Figure 5, middle right). Among children with CIs, age at implantation had no significant role in brain activity in this ROI [p = .136] (not shown).
Visual Cortex
There was a significant main effect of Group for HbO, but not for HbR in the visual cortex, and there was only a trend toward group significance for HbDiff (Table 1- bottom). The group difference in HbO was driven by larger deactivation of the visual cortex in the CI with TL group versus the CI with LL group [p = .025, 95% CI [5.03,105.0]], while the other two comparisons (i.e., CI with TL vs. TH; and CI with LL vs. TH) were not significant [p > .106]. The entire population exhibited a significant decrease in HbO, a significant increase in HbR, and a significant decrease in HbDiff during the 15-s squeeze compared to the 15-s rest period (Figure 4, right panels). In other words, children deactivated their visual cortex to perform the motor task and, among children with CIs, this behaviour was exacerbated among those with better language skills. Note that this deactivation tended to be inversely related to activity in the motor cortex, as illustrated in Figure 6 (right panel). Individual beta weights did not reveal any relationship between brain activation and age; but interestingly, there was a negative correlation between visual cortex activation and CELF scores (Figure 5, right panels). Specifically, the more a child deactivated their visual cortex during this task, the better their language skills. Age at implantation had no role in the degree of visual cortex deactivation [p = .260] (not shown). Same as Figure 4 in motor and somatosensory cortex but split by the two conditions where the joystick vibrated or not, as the child squeezed on the back triggers.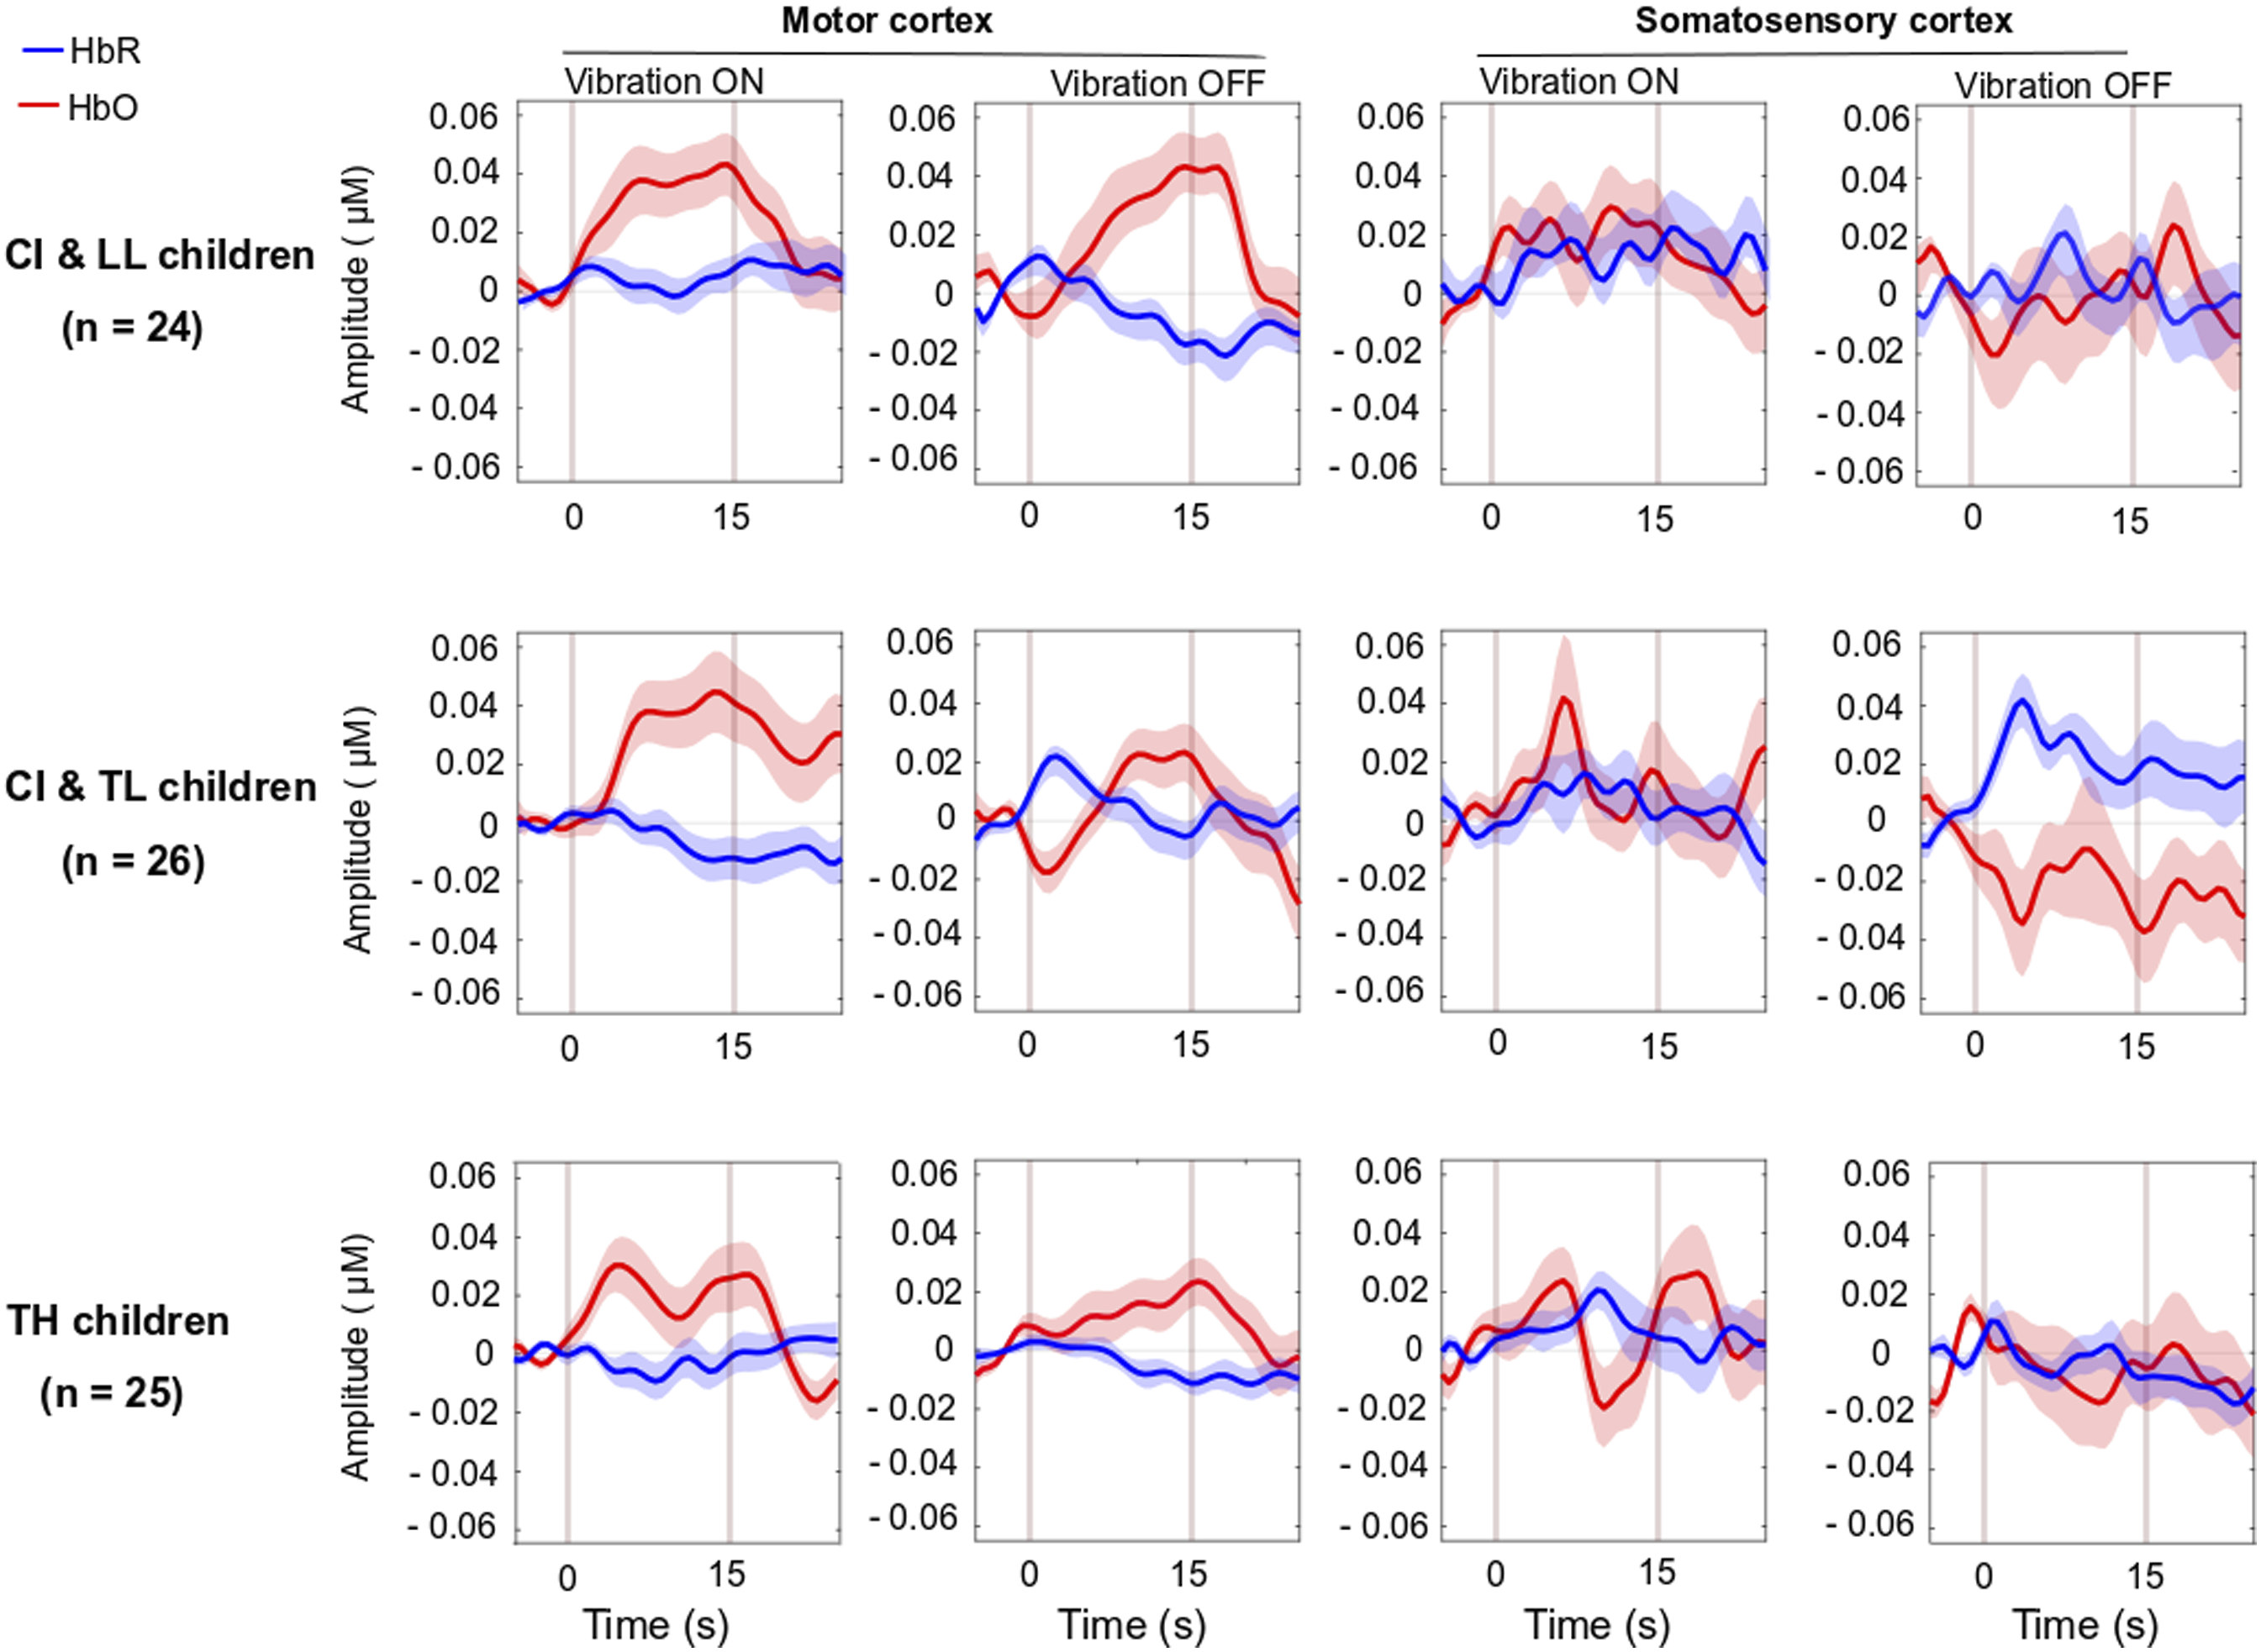
Vibrotactile Information
In the analyses above, we disregarded whether the joystick vibrated or not, as the child squeezed the triggers. However, the presence of the vibration across the ten events alternated, yielding a set of five events in which the joystick vibrated in response to the child’s action and five events in which the joystick did not vibrate. There was no group difference in brain activation in any of the four brain region activations (motor, somatosensory, STG, and visual cortex) for HbO, HbR, or HbDiff [p > .085 across all cases] when comparing events with and without vibration. Pooled data across all children revealed no vibration effect on brain activation in any ROI, [p > .202], except that there was a significant difference in HbR in the visual cortex [t (74) = −2.1, p = .044]. This means that there was a more pronounced deactivation of the visual cortex when the joystick vibrated than when it did not (Figure 7).
Discussion
Along with other reports on the same pediatric population (Deroche et al., 2023; Koirala et al., 2023; Wolfe et al., 2021), we explored motor cortex activity and its association with visual and auditory networks in children with CIs. We found an increase in HbO and a decrease in HbR in the motor cortex of all participants, irrespective of their hearing and language status. Meanwhile the visual cortex was strongly deactivated, with this finding more prominent among those CI users who had typical language than CI users who with low language profile; the pattern seen in CI users who had typical language was similar to children with TH. Thus, in addition to motor task activation of the motor cortex, a deactivation of supposedly irrelevant brain regions was detectable by fNIRS in children with better language functions.
No Differential Activity in the Motor Cortex, but Better Disengagement of the Visual Cortex
Recent investigators (Chen et al., 2017; Fullerton et al., 2023; Paul et al., 2022) have questioned the classical view (Lee et al., 2001) that cross-modal plasticity negatively affects speech performances of participants with CI. Cortical reorganization following CI may not always prevent the auditory cortex from responding to auditory stimuli (Land et al., 2016). Quite to the contrary, some individuals with CI may integrate multisensory information very effectively (Rouger et al., 2007) and cross-modal plasticity may strengthen their communication skills, especially those children who are familiar with sign language (see Beckers et al., 2023 for a comprehensive review on adult CI users). This is an unsettled on-going debate with many ramifications (Anderson et al., 2017b; Stropahl et al., 2016).
Perhaps closer to findings in this study, Chen et al. (2017) recruited 40 adult CI users and controls and separately measured fNIRS for circular checkerboard patterns as visual stimuli, and for words, reverse words, and tones as auditory stimuli. They found that intramodal connectivity within visual and within auditory areas was weaker in adult CI users than in their matched TH peers. In contrast, cross-modal connectivity between visual and auditory areas was stronger for these CI users, and this was beneficial to their speech recognition scores. They concluded that this strong cross-modal connectivity, which happened irrespective of the stimulus modality, was a result of concurrent processing of auditory and visual stimuli in both brain areas.
In a similar fashion, albeit with some methodological differences in experimental design and stimuli, Fullerton et al. (2023) used fNIRS to explore functional connectivity and cross-modal brain activation between visual and auditory cortices in fourteen post-lingual adult CI users. They tested these participants with speech and non-speech auditory stimuli and examined task-related differences in the evoked-related brain activity in auditory and visual cortices. Coordinated activity within the speech network was observed from both auditory and visual cortices; so, the authors concluded that such multimodal processing must be beneficial to the listening skills of CI users.
Anderson et al. (2017a) used fNIRS to examine changes between auditory and visual cortices in participants with CI, focusing on brain activations in some specific regions prior to and within six months of the implantation. Remarkably, they found that change patterns in brain activation were related to more successful speech understanding in CIs. Auditory cortex activation with visual stimuli was associated with adaptive benefits for these participants, as it seemed to promote auditory recovery after CI. While this claim was advanced for adult recipients, Mushtaq et al. (2020) applied this strategy to children with CI who mostly (16 out of 19) tested well on a phonetic perception task. While they found no difference in CI users relative to TH controls in processing auditory stimuli, the two groups differed in their ability to process visual speech stimuli such that children with CI then exhibited greater STG activity than TH controls. These authors concluded that cross-modal plasticity for processing auditory and visual speech stimuli is a synergistic process; they rejected the idea that visual language stimuli prevent the auditory cortex from responding to oral language.
From this multimodal perspective, we reasoned in this study that the motor cortex could also play a strong role for communication (and not just speech production) in daily life, especially for young children who are still amidst multifaceted development (Glennon et al., 2020). We hypothesized that in response to holding and squeezing a joystick, participants with CI would show weakened auditory-motor connectivity than TH controls (similar to findings in children with early-onset hearing loss without CI - Shi et al., 2016). However, this hypothesis was not supported. Our CI participants’ superior temporal cortices were simply not engaged (or disengaged) in this task. Presumably, such an association might exist in other tasks more closely related to speech (e.g., vocal production, tapping to an auditory beat, or perhaps writing). We also found mixed evidence for our hypothesis of stronger visual-motor connectivity in these participants than in TH controls. Indeed, the visual cortex of CI users was largely deactivated in an inverse relationship to motor cortex activity, particularly for CI users who had typical language functioning (CI with TL group). Thus, at least some children with CI (similar to children with early-onset hearing loss without CI in Shi et al., 2016) exhibited strong visual-motor coupling. The surprising aspect of this finding was that our CI with LL group did not exhibit as much visual deactivation as our CI with TL group (and yet they had a longer period of auditory deprivation). Exactly why this inverse coupling was not achieved by children in the CI with LL group remains unclear. Being able to visualize these cortical changes prior to (i.e., induced by the deprivation) and after implantation (i.e., induced by the restoration of auditory stimulation) would greatly help in this interpretation.
In the somatosensory cortex, there were no changes in HbO, but there was a modest HbR increase across all our participants. In other words, the somatosensory cortex tended to be deactivated irrespective of hearing or language skills status. These task-induced deactivations have been previously observed in studies using positron emission tomography scan (PET) (Haxby et al., 1994; Kawashima et al., 1995; Sadato et al., 1996; Shulman et al., 1997) and fMRI (Jäncke et al., 2000; Jorge et al., 2018; Morita et al., 2019, 2021; Newton et al., 2005; Shulman et al., 2007; Weisser et al., 2005) but their interpretation remains elusive. Yet, our findings warn that deactivation of brain ROIs may hold more predictive power than using specific tasks to direct sensory stimuli toward an expected brain ROI (here motor tasks directed toward the motor cortex). This finding generally calls for more fNIRS studies recording the activity of the whole brain rather than specific ROIs, even for seemingly low-level tasks.
The Meaning of Brain Region Activation or Deactivation
The exact mechanisms behind deactivation of brain regions, known as a negative BOLD response, are unclear (Hayes & Huxtable, 2012; He et al., 2022). To date, several mechanisms have been proposed. One is that deactivation acts as a filter (i.e., neuronal suppression) for behavioural relevance of a brain region to a specific task. When target objects in the task require shifts of attention, behavioural relevance is increased. Thus, deactivation widely occurs through many parts of sensory cortices and prevents attention shifts toward irrelevant cues, thereby enhancing target detection to maintain optimal performance). Considering, for example, the motor task used in this study, the visual and perhaps somatosensory cortices may have been deactivated to minimize brain processing of unimportant visual cues (or somatosensory joystick vibrations) to redirect cognitive resources toward the required motor activity. Notably, in a task that involves such targets, there is a direct relationship between the amount of deactivation and the performance such that the greater the deactivation of non-relevant cortical regions, the better the target detection (Shulman et al., 2007). In the current study, we could not observe this link because our motor task was devoid of any goal-related behaviour (e.g., earning points by squeezing more strongly or at a particular time). Yet, we still found a link between deactivation and the longer-term purpose of language development (as measured by the CELF), leading to speculation that the deactivation we observed in the visual cortex reflects a filtering process whose purpose was to better allocate cognitive resources.
Ecological Impact
Auditory-motor and visual-motor networks are often coupled in daily activities such as listening to music and dancing, helping us extract fundamental aspects of music, like rhythm and possibly aspects of melody. Coupling between auditory and motor modalities enhances attention, memory formation, and retrieval, as this multimodal learning has been shown to strengthen cognitive reserve, creating alternate neural pathways (Brown & Palmer, 2012; Mitterová et al., 2021). Although individuals with CI have difficulties decoding spectro-temporal cues to perceive melody (Jiam & Limb, 2020), they can still exploit CI technology to move to a beat (Phillips-Silver et al., 2015). Most relevant to this research, when children with CI listen and dance to music, active engagement of movement to auditory stimuli enhances learning and memory, as seen by improved song identification when moving, as compared to passive listening (Vongpaisal et al., 2016). Moreover, children with CIs were able to synchronize their body movements to the temporal pattern of music, generally a means of heightening pleasure with music (Janata et al., 2012; Matthews et al., 2020). Such observations highlight the importance of multimodal sensory networks other than those associated with speech (e.g., Kim & Zatorre, 2010). In audiology, we often take speech perception or production as a benchmark for evaluating CI outcomes, but there are many other human activities that require good auditory-motor and visual-motor coupling. Our study is another step towards better understanding innovative ways that patients with CI leverage multimodal integration.
Limitations and Directions for Further Study
We relied in this study on the assumption that fNIRS measurements could reliably reflect activation of the four brain ROIs we investigated, as confirmed recently by Lawrence et al. (2021). However, there are some common concerns about this assumption. First, fNIRS is arguably a newer and less reliable technique than fMRI. Perhaps as many as one third of the children we studied displayed little activity in either HbO or HbR (Figure 5), which has also occurred in other studies, leading investigators to have sometimes used an irrelevant task to first ensure that a BOLD-like response is measurable in a given participant (Cui et al., 2011; Sato et al., 2013). But this approach is less than ideal when examining special populations for which there are few participants. Investigators should pursue further developments in fNIRS technology to make it less dependent on skin pigmentation or melanin levels (Couch et al., 2015; Matas et al., 2002; Wassenaar & Van den Brand, 2005) and more reliable on an individual basis. Second, the “banana shaped photon path” of fNIRS limits its application to cortical regions that are relatively close to the scalp, narrowing the types of research questions that can be addressed with fNIRS (Harrison et al., 2021; Pinti et al., 2020). We easily captured activation/deactivation in the motor, somatosensory, and visual cortices, but one might question whether fNIRS could record activity from the primary auditory cortex (A1) located deep in the sylvian fissure. Our current view is that brain activation changes that occur in response to sensory deprivation have often involved broader structures (e.g., auditory association areas in visual tasks), making it likely that activity from the whole auditory cortex (but probably not A1 exclusively) may be captured by fNIRS (see reviews by Harrison & Hartley, 2019; Saliba et al., 2016). Third, one might question whether our motor task was too simplistic to observe anything useful. Squeezing the triggers of a joystick with both hands should generate activity in the motor cortex, and had there been group differences in that region, we should have detected them with this task. However, the fact that the task had little to do with speech or auditory-motor synchronization may be why there were no significant informative changes in STG activation between groups. We recommend replicating this work with a motor task that is more closely linked to language-related functions. Finally, a strength of fNIRS (e.g., over fMRI) is its ability to deal with motion artifacts (depending on the equipment/system) such as head and jaw movements resulting from speaking or singing. Such tasks would have enormous rehabilitation potential, opening new neuroimaging questions previously impossible to address in this population such as using altered feedback designs (Alemi et al., 2020, 2021) to explore the extent to which children with CI can correct for errors they detect in their vocal productions.
Conclusion
Severe hearing loss, especially early in life, is known to weaken auditory-motor coupling and reinforce visual-motor coupling. In the present study, we showed that hearing loss in children with CIs with good language skills was associated with stronger visual-motor coupling than was the case for children with CIs who had weaker language aptitudes. We suggest that this finding hints at a general adaptive strategy to allocate as few cognitive resources as possible to the task at hand, sparing attentional systems from irrelevant visual information. This interpretation is in line with what “Resource-rational Models” suggest when making realistic assumptions about the behaviour of the brain in cognitive tasks (Lieder & Griffiths, 2020).
Footnotes
Acknowledgements
We thank the Oberkotter Foundation for providing funding for this research program and are deeply grateful to all the children who participated.
Author Contributions
MD, JW, and VG developed the rationale of the research program. MD coded the experimental interface, analyzed the data, generated figures, and wrote up the core of the manuscript with RA. In Oklahoma, JW, SN, JM, LH, WT collected all the fNIRS data. CW, AB, SM, and ES helped with subject recruitment. JG helped with data analysis. All authors contributed to manuscript editing.
Declaration of Conflicting Interests
The author(s) declared no potential conflicts of interest with respect to the research, authorship, and/or publication of this article.
Funding
The author(s) received no financial support for the research, authorship, and/or publication of this article.
Appendix
Demographic Information for the Cochlear Implant Users in the Low Language Group. Abbreviations: Bil, bilateral; CELF, Clinical Evaluation of Language Fundamentals- Fifth edition standard score; CI, cochlear implant; HA, hearing aid; L, left ear; Nuc, Nucleus; R, right ear; Seq, sequential.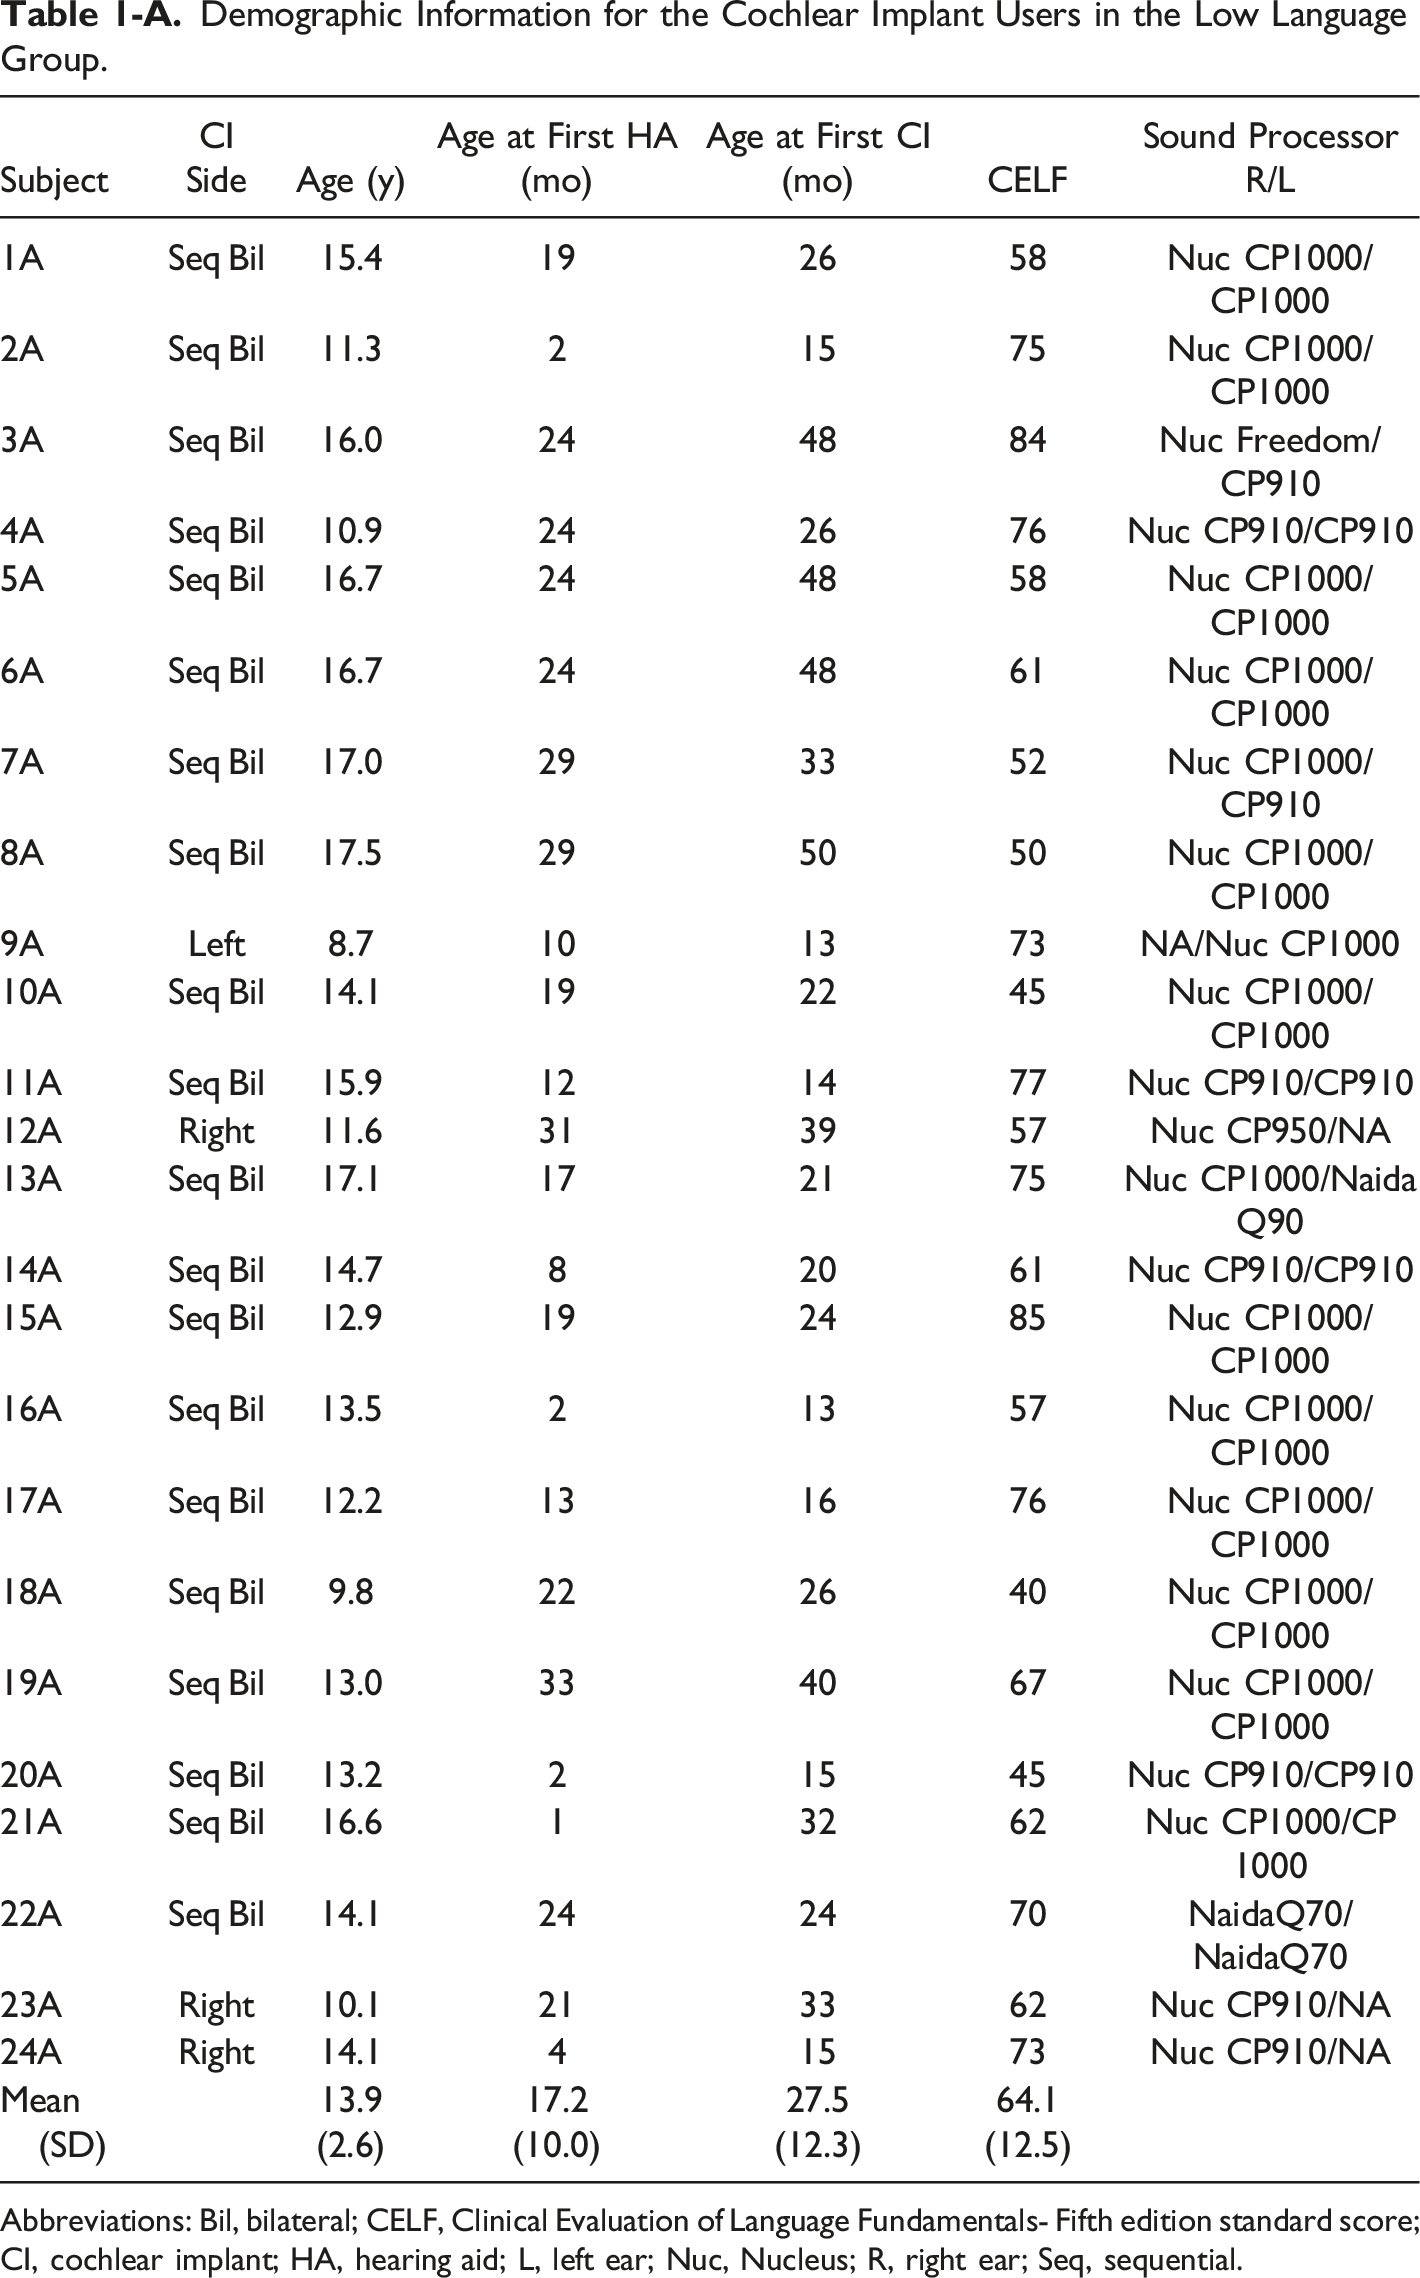
Subject
CI Side
Age (y)
Age at First HA (mo)
Age at First CI (mo)
CELF
Sound Processor R/L
1A
Seq Bil
15.4
19
26
58
Nuc CP1000/CP1000
2A
Seq Bil
11.3
2
15
75
Nuc CP1000/CP1000
3A
Seq Bil
16.0
24
48
84
Nuc Freedom/CP910
4A
Seq Bil
10.9
24
26
76
Nuc CP910/CP910
5A
Seq Bil
16.7
24
48
58
Nuc CP1000/CP1000
6A
Seq Bil
16.7
24
48
61
Nuc CP1000/CP1000
7A
Seq Bil
17.0
29
33
52
Nuc CP1000/CP910
8A
Seq Bil
17.5
29
50
50
Nuc CP1000/CP1000
9A
Left
8.7
10
13
73
NA/Nuc CP1000
10A
Seq Bil
14.1
19
22
45
Nuc CP1000/CP1000
11A
Seq Bil
15.9
12
14
77
Nuc CP910/CP910
12A
Right
11.6
31
39
57
Nuc CP950/NA
13A
Seq Bil
17.1
17
21
75
Nuc CP1000/Naida Q90
14A
Seq Bil
14.7
8
20
61
Nuc CP910/CP910
15A
Seq Bil
12.9
19
24
85
Nuc CP1000/CP1000
16A
Seq Bil
13.5
2
13
57
Nuc CP1000/CP1000
17A
Seq Bil
12.2
13
16
76
Nuc CP1000/CP1000
18A
Seq Bil
9.8
22
26
40
Nuc CP1000/CP1000
19A
Seq Bil
13.0
33
40
67
Nuc CP1000/CP1000
20A
Seq Bil
13.2
2
15
45
Nuc CP910/CP910
21A
Seq Bil
16.6
1
32
62
Nuc CP1000/CP 1000
22A
Seq Bil
14.1
24
24
70
NaidaQ70/NaidaQ70
23A
Right
10.1
21
33
62
Nuc CP910/NA
24A
Right
14.1
4
15
73
Nuc CP910/NA
Mean (SD)
13.9 (2.6)
17.2 (10.0)
27.5 (12.3)
64.1 (12.5)
Demographic Information for the Cochlear Implant Users in the Typical Language Group. Abbreviations: Bil, bilateral; CELF, Clinical Evaluation of Language Fundamentals - Fifth edition standard score; CI, cochlear implant; HA, hearing aid; L, left ear; Nuc, Nucleus; R, right ear; Seq, sequential; Sim, simultaneous.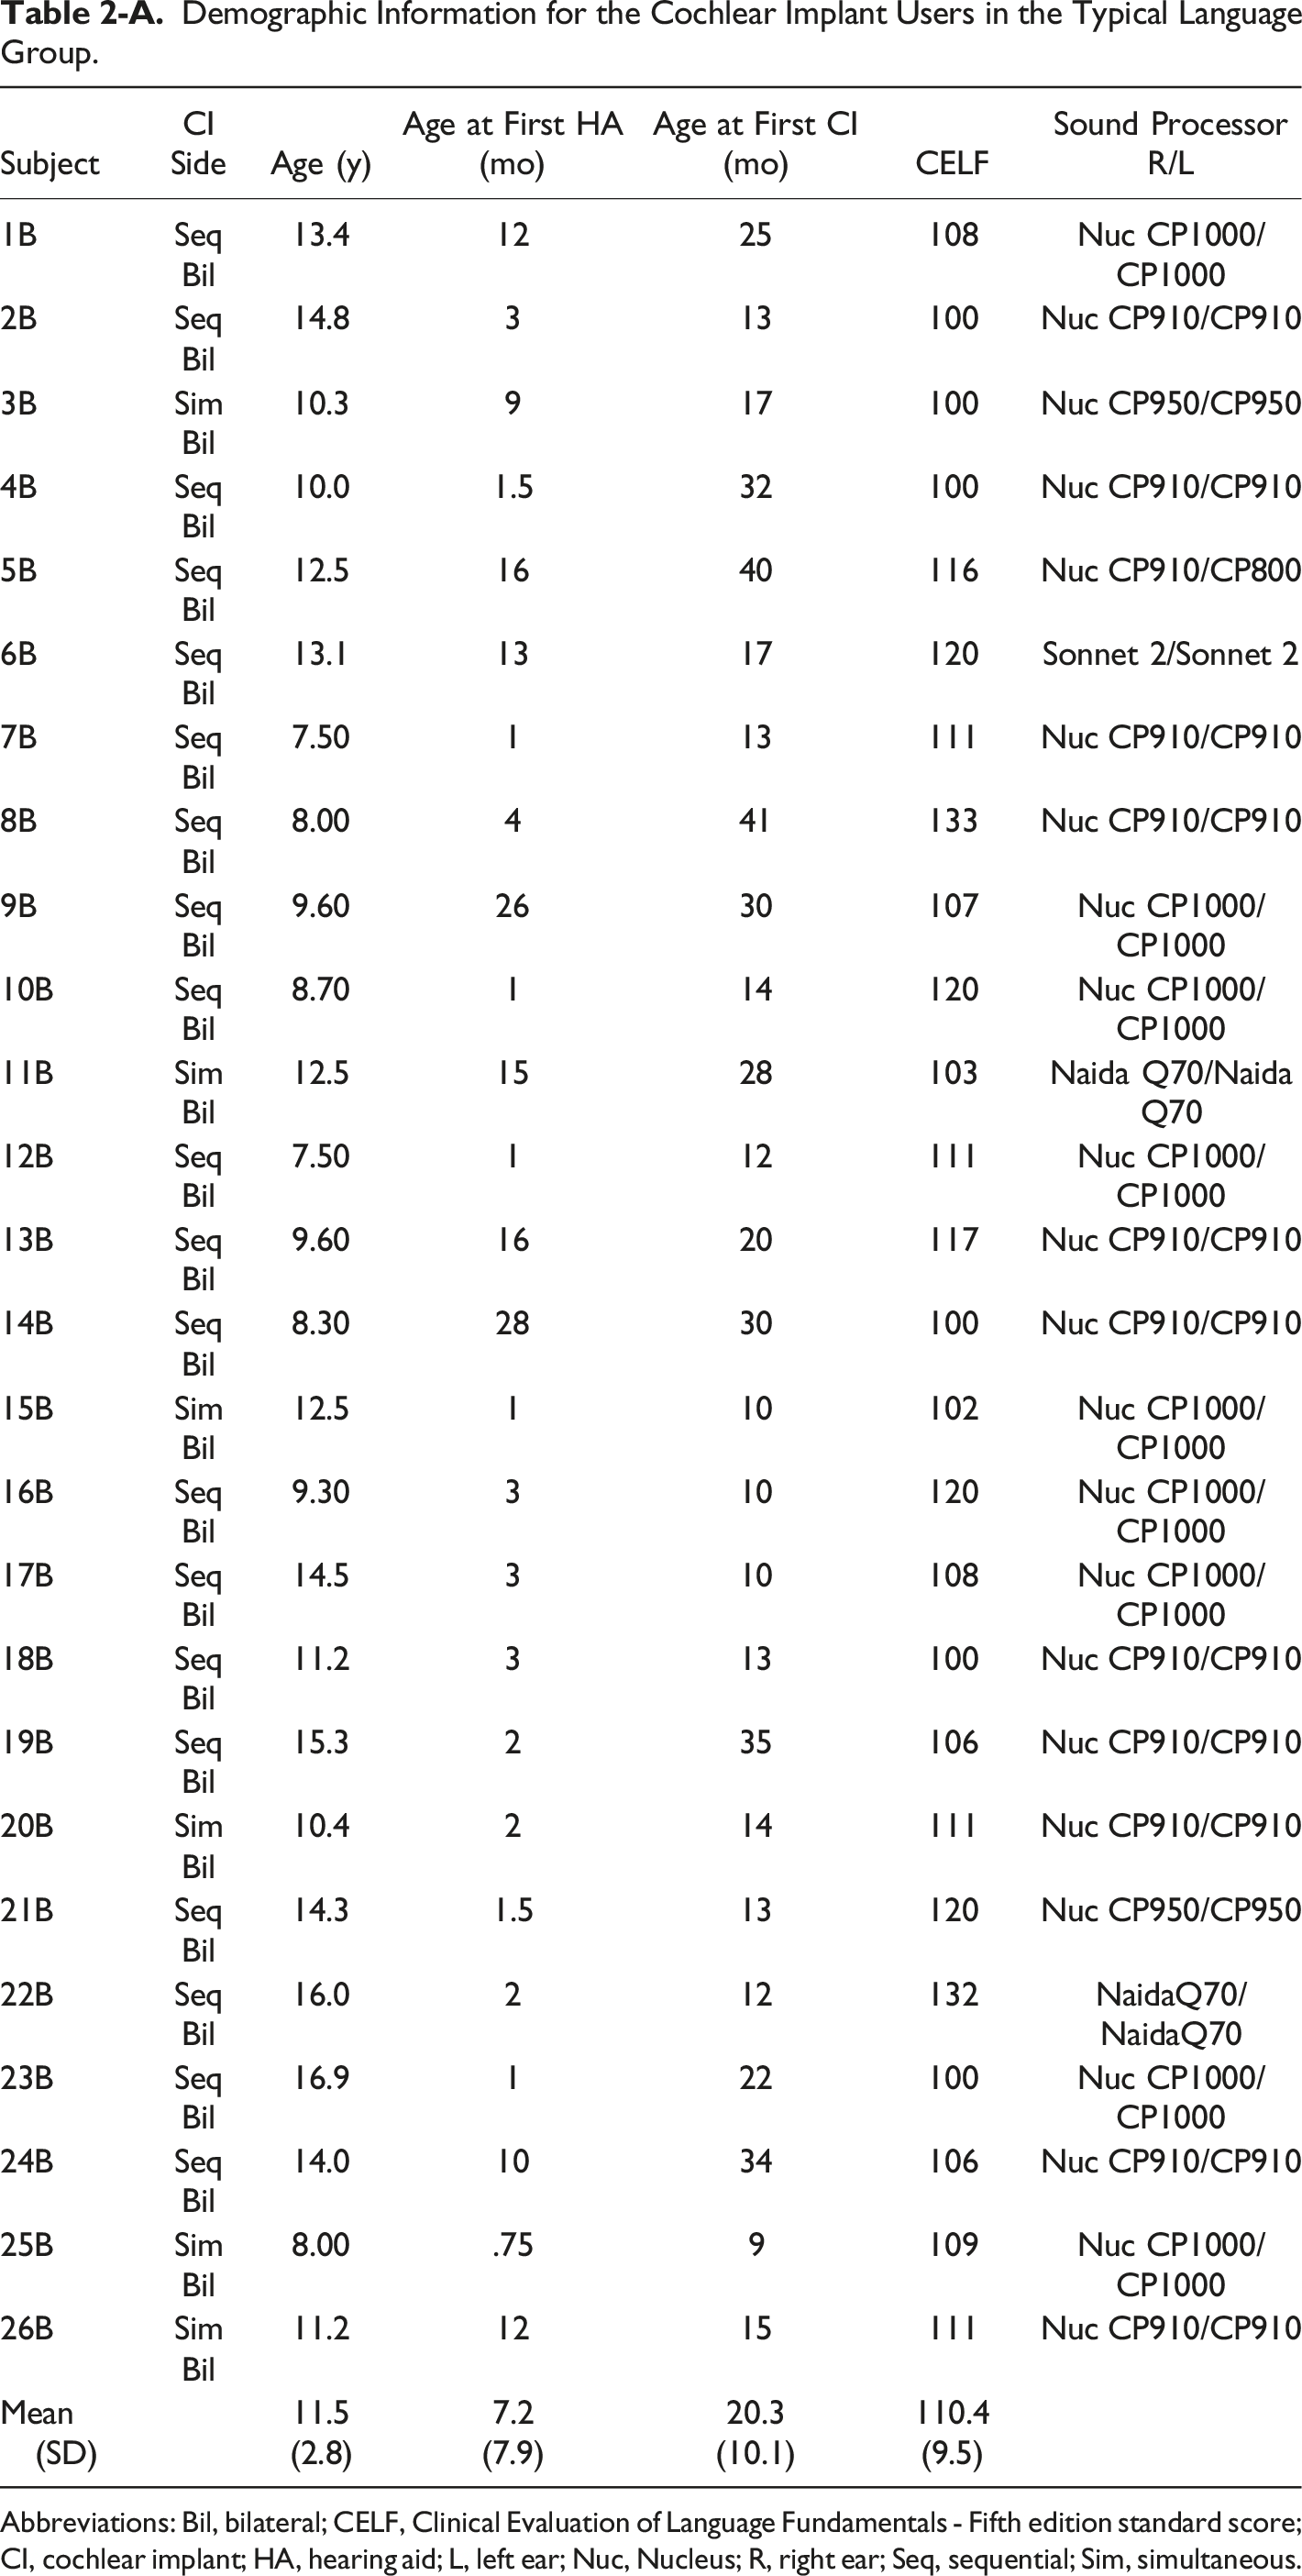
Subject
CI Side
Age (y)
Age at First HA (mo)
Age at First CI (mo)
CELF
Sound Processor R/L
1B
Seq Bil
13.4
12
25
108
Nuc CP1000/CP1000
2B
Seq Bil
14.8
3
13
100
Nuc CP910/CP910
3B
Sim Bil
10.3
9
17
100
Nuc CP950/CP950
4B
Seq Bil
10.0
1.5
32
100
Nuc CP910/CP910
5B
Seq Bil
12.5
16
40
116
Nuc CP910/CP800
6B
Seq Bil
13.1
13
17
120
Sonnet 2/Sonnet 2
7B
Seq Bil
7.50
1
13
111
Nuc CP910/CP910
8B
Seq Bil
8.00
4
41
133
Nuc CP910/CP910
9B
Seq Bil
9.60
26
30
107
Nuc CP1000/CP1000
10B
Seq Bil
8.70
1
14
120
Nuc CP1000/CP1000
11B
Sim Bil
12.5
15
28
103
Naida Q70/Naida Q70
12B
Seq Bil
7.50
1
12
111
Nuc CP1000/CP1000
13B
Seq Bil
9.60
16
20
117
Nuc CP910/CP910
14B
Seq Bil
8.30
28
30
100
Nuc CP910/CP910
15B
Sim Bil
12.5
1
10
102
Nuc CP1000/CP1000
16B
Seq Bil
9.30
3
10
120
Nuc CP1000/CP1000
17B
Seq Bil
14.5
3
10
108
Nuc CP1000/CP1000
18B
Seq Bil
11.2
3
13
100
Nuc CP910/CP910
19B
Seq Bil
15.3
2
35
106
Nuc CP910/CP910
20B
Sim Bil
10.4
2
14
111
Nuc CP910/CP910
21B
Seq Bil
14.3
1.5
13
120
Nuc CP950/CP950
22B
Seq Bil
16.0
2
12
132
NaidaQ70/NaidaQ70
23B
Seq Bil
16.9
1
22
100
Nuc CP1000/CP1000
24B
Seq Bil
14.0
10
34
106
Nuc CP910/CP910
25B
Sim Bil
8.00
.75
9
109
Nuc CP1000/CP1000
26B
Sim Bil
11.2
12
15
111
Nuc CP910/CP910
Mean (SD)
11.5 (2.8)
7.2 (7.9)
20.3 (10.1)
110.4 (9.5)