
Abstract
Abstract
This article offers an overview of agricultural research in India through the analysis of a database established and curated by the Indian Council of Agricultural Research (ICAR), in which PhD theses are deposited. The analysis considers 35,122 PhD dissertation titles over a period of about 80 years (1947–2023), with the objective of identifying patterns of research and their evolution. The procedure followed to prepare data and the statistical methods used are described. These are specific to the multidimensional analysis of qualitative data. Descending hierarchical classification led to the identification of five theme-clusters: “Agronomy”, “Genetics”, “Plant Health”, “Animal Sciences”, and “Social Sciences”, accounting for 29.0, 16.9, 17.7, 21.0, and 15.5% of the total number of classified PhD titles (93% of the total), respectively. Multiple correspondence analysis allows quantifying the links between and mapping of these theme-clusters and their associated terms (key-words), along with supplementary variables: disciplinary fields and years. Overall, the analysis shows stability of the theme-clusters over time, along with the disciplinary fields of Indian research. There however is a clear dynamic in the importance of terms. Besides the stability of these theme-clusters, the importance of research on agricultural extension, and the permanent importance over the 80-year period of key staples (rice and wheat), along with pulses, fruits and vegetables, are among some key features of Indian agricultural research. The required future research on climate change regarding its impacts and the need for adaptation on crops, animals and agricultural systems is emphasised. We discuss the relevance of PhD dissertation titles (as opposed to, for example the commonplace literature review approach) as an instrument to explore and analyse a large and diverse landscape of research. The analysis also brings about a discussion and views on the merits and the required balance between short-term, application-oriented research versus long-term, knowledge- and understanding-oriented research.
Keywords
Introduction
The Indian Council of Agricultural Research (ICAR) is in charge of managing and supporting research centres of its own, providing research support to multiple public universities in India, supporting public agricultural extension (through thousands of extension centres – Krishi Vigyan Kendra: KVK, or “farm science centre”) and supervising agricultural education. ICAR is the largest public research-education-extension organisation in the world.
Among the many activities ICAR undertakes, providing support to PhD students, and therefore to research in the entire public higher-education system of India, is critical: even before Independence, India had to become independent in terms of human capital for its agricultural research. In order to monitor the evolution of this segment of research, ICAR established a web-based data source that enables search and queries on any subject in the PhD thesis titles, authors, university or institute and year of defence. To the best of our knowledge, no such specific database on PhDs that covers all the topics of agricultural sciences, over such a long period of time, exists anywhere in the world. Because PhDs constitute a key instrument of research and education in any research laboratory, and because they collectively constitute the future of science through the training of scientists, a statistical analysis of patterns in themes, in their evolution and their evolving linkages was undertaken.
The present work is an analysis of this database with the objective of identifying patterns of research and their evolution. The database includes 35,122 PhD dissertation titles at the time when the analysis was initiated, covering some 80 years of research. The purpose of the present work is to describe the landscape of agricultural research in India and its evolution over some eight decades. One may safely assume that the conduct of PhDs reflects the basic “metabolism” of research. Whether that research effort leads to science products, for the academia (e.g. publications) and society at large (e.g. applications, patents and innovations) is not addressed here. It however is a fair assumption that research with no results, over a span of eighty years, would stop: past impacts necessarily fuel new research efforts. This landscape of PhD activity is also important to consider simply because it constitutes the matrix where higher education of young science professionals takes place, which obviously is crucial to explaining the evolution of science itself, understanding its past directions and considering its possible future.
Some of the questions we ask are whether priorities in research for agriculture have changed over the decades; whether patterns, if identifiable, have evolved, and which are the research subjects that these patterns involve; what has been the interplay between the different fields of science, from the bio-physical to the socio-economic, that agricultural research involves. These questions are addressed through the analysis of the words of science that are used in the titles of theses; a specific statistical approach, which respects the nature of the original data and enables answering some of these questions, is therefore necessary. We have provided details on the statistical approach we used.
Material and methods
Description of the data to analyse
The data set considered in this analysis is the body of PhD theses conducted under the aegis of ICAR since 1947 until 2023. Three earlier PhD theses were also considered, so that the data set actually spans the period 1925–2023. The database covers the entire domain of the agricultural sciences, from the bio-physical to the socio-economic. The present analysis restricts itself to the texts of titles. Each PhD title, that is each individual of the analysis (datum), is associated with four additional variables: a serial number, a year of defence, a scientific department (of a university or research centre) and an author name. The analysis concentrates on the word content (terms) of each title and the linkages among word contents of different titles. In all, 35,122 PhD thesis titles were thus analysed along with the four additional variables.
Steps of the analysis
The objective of the analysis is to extract statistically significant trends in the terms used in PhD titles, considered as a corpus (Silge and Robinson, 2017), to identify the respective weights of different disciplines in the research effort which the database represents, to highlight main research objectives and approaches that are covered by this database, and to assess the evolution of research through the lens of the titles of these PhDs. These objectives were addressed through a series of steps:
Data cleaning: removal of abbreviations, standardisation of scientific and common terms (Supplementary Material S1, S3, lemmatisation). Definition of disciplinary fields associated unequivocally with each PhD title. Creation of tags: new terms that group a cohesive ensemble of connected original terms (e.g. Animal Disease, to account for the diversity of health disorders in a wide range of animals); tags were inserted within summarised titles prior to analysis. Identification and analysis of key words, which are the terms (after lemmatisation) of each PhD title. Classification of titles using a descending hierarchical method and a chi-square distance Chi-square tests to assess the strength and statistical significance among keywords and disciplinary fields and between keywords and disciplinary fields and keywords and clusters. Correspondence analysis to produce a statistical overview of associations among clusters via the keywords which represent them most, and among variables associated with titles (year, disciplinary field). Steps 4–7 were taken up again after dividing the corpus into distinct periods in the history of agricultural research in India.
Data cleaning
Data cleaning broadly followed Silge and Robinson (2017). Tidying texts of PhD titles entailed correction of spelling mistakes and data entry errors, the implementation of standardised spelling (e.g., modelling vs. modeling; bio-fertiliser vs. bio-fertilizer or biofertilizer), the spelling out or removal of unspecified symbols and replacement of plurals for nouns by singulars, and included several stages of standardising names of studied entities (e.g., species names) or converting abbreviation of acronyms. It is for instance common that different vernacular names be used for the name of the same cultivated plant (or domestic animal species) across India. Scientific names (i.e. Latin binomials for animal and plant species), which may vary over time, were not retained, but served as basis for a consistent glossary (Supplemental Material S1) of vernacular (commonly preferred) names across species. Tidied texts (titles) led to creating summarised titles consisting only of terms that could be used as keywords in subsequent analyses.
Definition of disciplinary fields
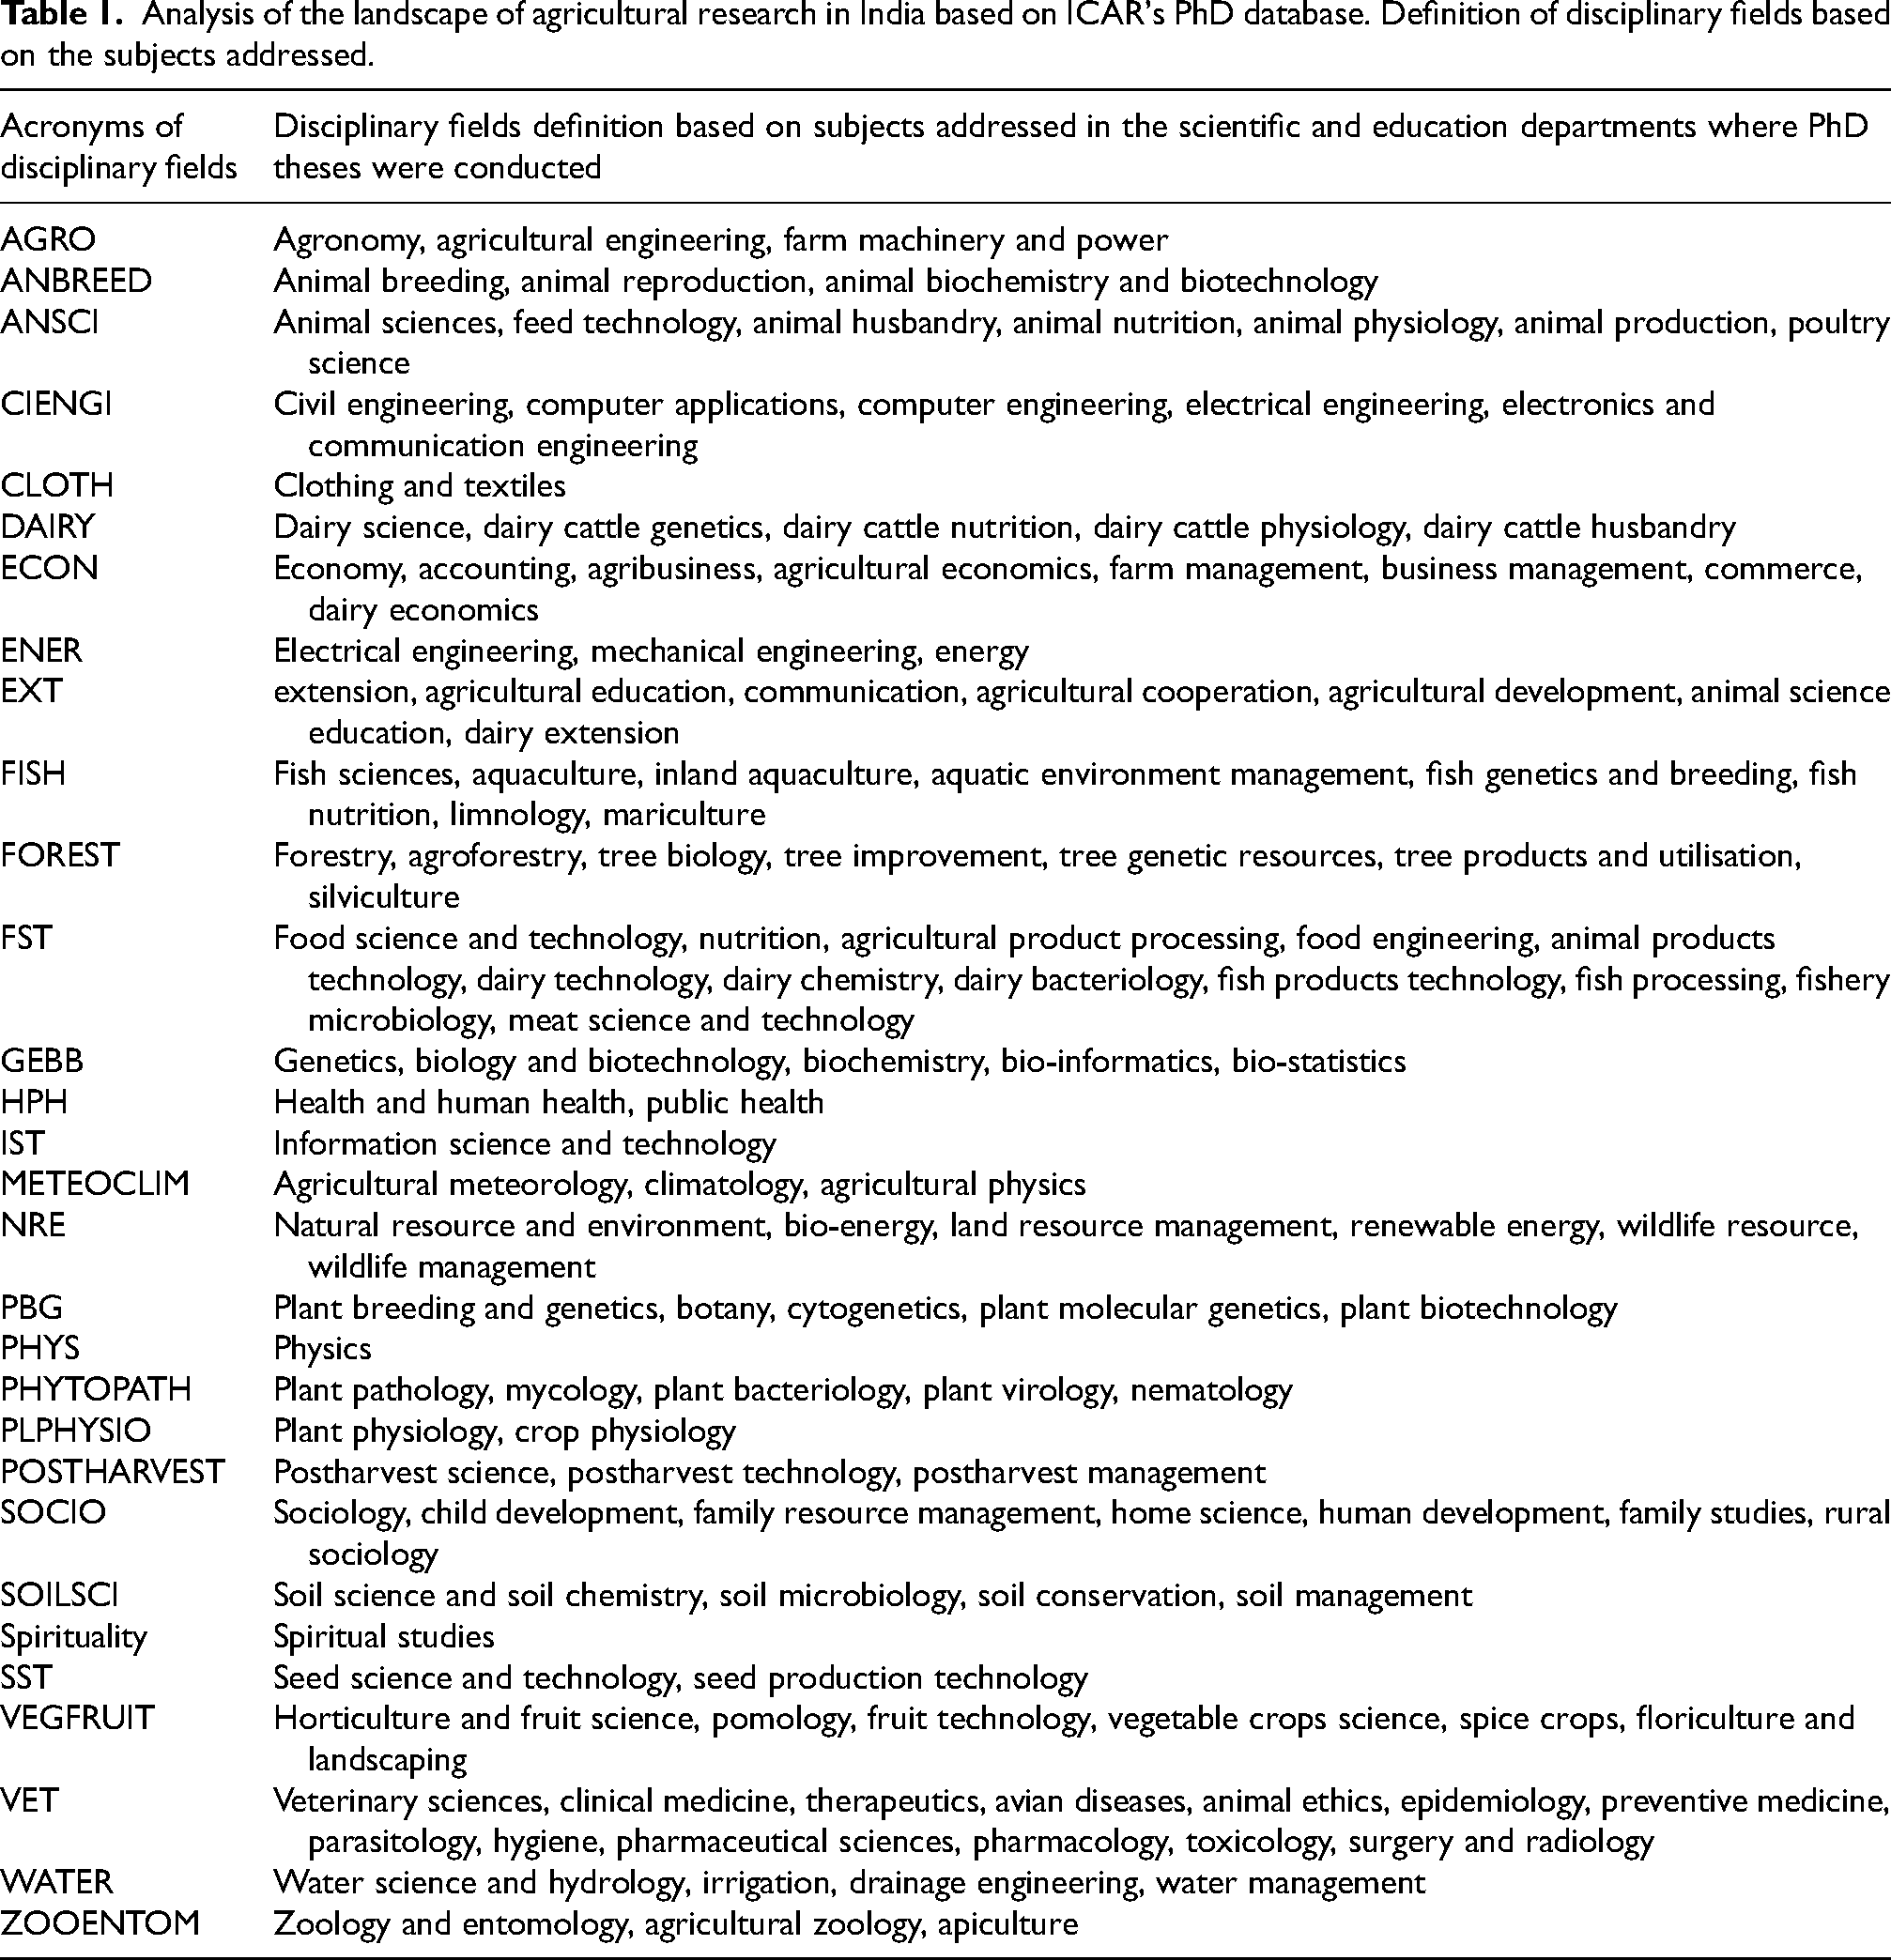
Disciplinary fields were defined on the basis of the department or institutional unit accompanying each title. The list of disciplinary fields is given in Table 1. Any given research and education entity may have hosted theses belonging to different disciplinary field: each thesis was therefore assigned to a given disciplinary field on the basis of the key words the thesis title carries.
Analysis of the landscape of agricultural research in India based on ICAR's PhD database. Definition of disciplinary fields based on the subjects addressed.
Keywords and tags
Lemmatisation (Silge and Robinson, 2017) led to the identification of keywords or terms. A tenet of the approach followed was to consider each title as an observed fact, not to be altered. Each PhD title consists of a set of title-specific terms, which therefore in no way may be modified. Three classes of terms in titles were then considered:
objects: terms which refer to the object or subject of the research conducted in a PhD, such as “yield”, “gene”, “soil”, “rice” or “buffalo”; concepts: terms which refer to processes or properties that are considered in research, such as “growth”, “quality”, “response”, “impact” or “use”; methods: terms referring to the research investigation methods, such as “statistical”, “experiment”, “evaluation”, “molecular” or “economic”.
Many of the terms for objects could belong to given, broader, object-domains, which would be overlooked in the analysis if not considered. For example, many pesticide names were found in titles, without the term “pesticide” being used; similarly, numerous specific names for animal diseases were found without mention of a generic “animal disease” indication in the title. Tags were thus created to reflect object-domains that were illustrated by one or several specific terms used in a title (Supplemental Material S2). Glossaries of terms belonging to the same object-domains were thus developed. Tags were then appended to the text of each title when an object term belonging to a given object-domain was detected. These tags for object-domains were “AnimalDisease”, “EdibleOilPlant”, “Fish”, “Flower”, “Fruit”, “Fungicide”, “Herbicide”, “Insect”, “Insecticide”, “Pulse”, “PlantDisease”, “SoilType” and “Vegetable” (see glossaries and definitions in Supplemental Material S2).
The insertion of tags corresponding to object-domains was considered safe, that is not representing an alteration of title meaning. However, no concept-domain tags or method-domain tags were created and inserted, as this could alter the meaning or purpose of an investigation represented by a PhD title. For example, a concept-domain could have been considered for climate-smart agriculture. Climate-smart agriculture may however refer to an array of approaches, possibly reflected in titles by one or several concept-terms (e.g. “intercropping”, [planting] “date” or “tolerant” [breed, variety]), along with one or several subject domains (e.g. “water”, “soil”, “tillage” or “residue”). Defining concept-domain would therefore necessarily have led to (1) interpreting titles before their analysis and (2) possibly interpreting titles wrongly. No concept-domain therefore were therefore created. The same reasoning was applied to possible method-domains.
Therefore, while the definition of object-domains, and their insertion in original titles, was considered harmless toward the meaning of the objects (i.e., PhD titles) to be analysed, the identification of possible concept-domains or method-domains was left to the interpretation of results from analyses.
Definition of time periods in the data set
The history of agricultural research in India may broadly be considered in four phases: a colonial period, a post-Independence period, the period during which the Green Revolution took place, a post-Green Revolution period and the recent period. The first of these periods is represented by a very small number of theses (90 titles prior to 1947). Three time periods were thus considered: a post-Independence and Green Revolution time period (GRY, 1925–1985, n = 4082 titles), a post-Green Revolution time period (PGY, 1986–2011, n = 17,905 titles) and a recent years period (RY, 2012–2023, n = 13,135 titles).
Chi-square tests of association
Each title was thus associated with the following set of complementary attributes: a thesis serial code number, author, year, time period and disciplinary field. Among these, the latter three attributes may be considered as statistical variables. The text of the thesis title itself generates a number of additional variables, that is the terms which are used, and on a which a text analysis may focus. Distribution frequencies of each of these variables (terms of the title, year, time period and disciplinary fields) and cross-distribution tables (contingency tables) among these variables were built enabling chi-square independence tests (Agresti, 2002; Wilkinson, 2009) to be performed. Distribution frequencies were studied, contingency tables built and chi-square tests performed using SYSTAT 13 (SYSTAT Software, 2009).
Overall multivariate analytical approach
The data set to analyse therefore includes a very large number of terms in titles and disciplinary fields (both of them corresponding to qualitative and cardinal, that is non-ranked variables; Savary et al., 1995), and two quantitative, continuous variables (year and time period), each statistical individual in the data set (a given PhD thesis) being represented by a vector of such variables. A suitable statistical approach was sought that enables quantification of links among almost exclusively qualitative variables, and among meta-variables (i.e. new variables generated through clustering). This approach should (1) respect the qualitative nature of the original information, (2) enable the testing of associations among variables in a quantitative manner (strength of linkage) and (3) enable producing a quantitative display of the multidimensional association of such associations.
Correspondence analysis (Benzécri, 1973b; Greenacre, 1984) is a method of choice for this purpose, especially if associated with cluster analysis (Benzécri, 1973a). Correspondence analysis enables achieving the three above purposes on individual variables. This method was developed and applied by the mid-20th century, at a time when Europe was recovering economically from the Second World War, and when the European Community was being built: by then, considerable planning effort was made in order to meet the livelihood requirements of a needy and growing population, and to ensure a sustainable agricultural and economic development. Typical examples of the application of correspondence analysis for national development plans, or for regional development plans, include analyses of socio-economic categories and causes of death in France between 1956 and 1960 (Lebart et al., 1982) and of household budgets in different regions of the European Commission in 1963–64 (Italy, France, Belgium, Luxemburg, the Netherlands and Germany; Tabard, 1982). Correspondence analysis also allows achieving these purposes on clustered variables if a suitable clustering method is used. Such an approach (hierarchical cluster analyses and correspondence analyses, both methods using a chi-square metric) was also used by Savary et al. (2000) to analyse the linkages between rice production situations and injury profiles (plant pathogens, animal pests and weeds) in a large population of farmers’ fields across tropical Asia.
We followed in the present work the approach described in Reinert (1990) and Loubère and Ratinaud (2014), which is implemented in R (Camargo and Justo, 2013) under the acronym “IRaMuTeQ” (for R Interface for Multidimensional analysis of Texts and Questionnaires). This R program performs both a classification (clustering) procedure and a multiple correspondence analysis.
Classification of the overall data set
The classification method used in the present work is a descending hierarchical method, which was developed by Reinert (1990). According to Reinert (1990), the method is inspired by several other techniques: segmentation (Bertier and Bouroche, 1975), hierarchical classification (Benzécri, 1973a), factorial analysis (Benzécri, 1973b) and dynamic clouds (Diday et al., 1971). Key features of the approach are the following: it (1) considers titles as statistical entities, which (2) are characterised by a set of variables (attributes), including year, time period and disciplinary fields, as well as all the extractable terms that constitute a title and (3) are hierarchically clustered using a chi-square metric.
Correspondence analysis of the overall data set
Correspondence analysis (Benzécri, 1973b; Greenacre, 1984; Savary et al., 1995) is a multivariate method enabling mapping of multidimensional linkages amongst variables using a chi-square metric. Correspondence analysis enables the analysis of a set of joint distribution frequencies of paired variables, that is of a series of contingency tables (Benzécri, 1973b). A specific feature of correspondence analysis (in which it profoundly differs from for example principal components) is that besides considering strictly qualitative variables, the method addresses the rows and the columns of a data table simultaneously and in a symmetric manner. Correspondence analysis results are interpreted in terms of axes (their eigenvectors and the quantity of information, or inertia, they carry, and the variables which mostly contribute to this inertia) and of variable characterisation (their mass, that is frequency in the table; their inertia, that is mass times the squared distance to the origin of axes; and their projection, that is the vector length of their representation on axes, or “cosine” values).
In a correspondence analysis, all variables are considered qualitative. This includes the terms used in the title of theses, as well as meta-variables such as the clusters defined through Reinert's method – whether a thesis belongs to a given cluster or another is a new variable per se. Such meta-variables, whether a priori defined (such as the disciplinary fields) or resulting from former analytical procedure (such as theme-clusters generated with Reinert's descending hierarchical classification), are the main guides to generate a synthesis of the analysed corpus of 35,122 PhD titles.
Analysis of data within successive time periods
The same steps (chi-square tests of association, classification using Reinert's method and correspondence analysis) were separately taken on each of three considered periods of Indian's research in agriculture: post-Independence and Green Revolution (1925–1985, GRY), post-Green Revolution (PGY, 1986–2011) and recent years (RY, 2012–2023). Each separate analysis aimed at identifying patterns and trends of research via the terms used in their corresponding PhD theses.
Results
Number of theses over time
The evolution of the number of PhD theses is shown in Supplemental Material S4.1. Prior to 1980, the number of theses per year is quite small, as would an exponential growth in its early stage. After 1980, growth sets in, reaching a first maximum about 2000–2005, at over 1000 per year. This is followed by a temporary slump (2008–2012), and a renewed growth, which exceeds 1500 per year by 2018. The most recent years (2020–2023) are not shown on the graph (with lower figures per year, possibly due to gaps in data entry).
Overall, the number of PhD theses produced per year shows a very strong imbalance over time, with a great majority of PhD theses defended after 1985. This has considerable bearing on the ensuing analysis and warrants the need to analyse data within successive periods.
Main terms used in Indian PhDs in agriculture
The most frequent terms encountered in titles of PhD theses on the overall data set are shown in Supplemental Material S4.2. The 50 most frequent terms (including tags indicated by capitals; Supplemental Material S1 and S2) encountered (frequencies in parentheses) in the data set are management (3773); yield (3134); rice (2934); Fruit (2645); growth (2553); Pulse (2338); quality (2214); development (2160); genetic (2126); system (2117); wheat (2005); evaluation (1997); Vegetable (1872); soil (1730); production (1728); characterization (1581); nutrient (1532); crop (1520); molecular (1509); PlantDisease (1396); resistance (1354); performance (1241); nitrogen (1232); maize (1215); seed (1088); response (1060); cropping (1060); condition (1056); Insect (1034); gene (1028); buffalo (1013); plant (1002); water (960); trait (928); Pesticide (918); integrated (915); biochemical (903); productivity (887); EdibleOilPlant (875); district (855); irrigation (823); impact (823); cotton (810); root (780); sorghum (773); economic (744); use (737); disease (711).
The frequency levels (Supplemental Material S4.2) according to terms, starting with “management”, resembles a negative exponential distribution, although a plateau is observed at frequencies about 600–300. Terms retrieved from titles differ in their values. Some correspond to research objects, such as “rice”, “soil”, “wheat” or “nutrient”. Other pertain to approaches in science, such as “development”, “genetic”, “system”, “evaluation” or “characterization”. Others still refer to studied processes, such as “growth”, “resistance” or “response”. The list includes tags (i.e., terms inserted within the summarised text of thesis titles to bring together elements of a broader group; Supplementary Material S2). In particular, apparent tags are “Fruit”, “Pulse”, Vegetable”, “PlantDisease”, “Insect” or “EdibleOilPlant”.
Disciplinary fields in Indian agriculture and their evolution of over time
Table 1 lists the 31 disciplinary fields that were defined, which range from the bio-physical to the socio-economic sciences. The evolution of disciplinary fields is shown in Supplemental Material S4.3, where each field in a given year is represented as a percentage of theses in that year, in order to compensate for the asymmetric distribution of theses over time shown in Supplemental Material S4.1. Although showing some variation over time, Supplemental Material S4.3 shows that the most important disciplinary fields are: AGRO (agronomy), ANSCI (animal sciences), ECON (economy), EXT (extension science), FST (food science and technology), PBG (plant breeding and genetics), PHYTOPATH (plant pathology), SOILSCI (soil science), VEGFRUIT (vegetable and fruit sciences), VET (veterinary science) and ZOOENTOM (zoology and entomology). Table 1 provides the list of acronyms and details on the corresponding disciplinary fields.
Despite variation, Supplemental Material S4.3 exhibits an overall stability of disciplinary research themes over the years. In particular, AGRO (agronomy), ANSI (animal sciences) or PBG (plant breeding and genetics) are important and stable themes, irrespective of the year considered. So is extension science (EXT), which should be considered as an important domain of investigation in Indian agricultural research.
Some disciplinary fields however grow in time. This is for instance the case of GEBB (genetics, biology and biotechnology), with the emergence of novel technologies at the molecular and gene levels. Neighbouring fields in Supplemental Material S4.3, FISH, FOREST and FST (food science and technology), although smaller, also show an increase of their shares of PhD titles in recent years. Some other fields show some decline. Such declines however are small, never reduce significantly their importance, and actually reflect a diversification of these themes, which fuels others. AGRO, PBG and PHYTOPATH (Table 1) belong to these groups. For instance, the relative declines of PBG and PHYTOPATH may be associated with the growth of GEBB.
Disciplinary fields constitute a first, a priori, means to cluster the population of PhD theses. Theses belonging to these fields may, or may not, share the same contents in terms – terms that refer to research objects, to processes, to the approach used in science, or to concepts and paradigms underpinning science. The next stages of analysis addresses the question of (dis)similarity among disciplinary fields, with respect to the words that are used by Indian scientists.
Evolution of terms in Indian PhDs in agricultural research over time
In contrast to the disciplinary fields, the dynamics of terms over time in the titles of PhDs is very high. Figure 1 displays a pattern over time of a selection of terms. As in Supplemental Material S4.3, terms are represented in Figure 1 as proportions of their use over a given year, in order to counter-balance the growth in number of theses over time.
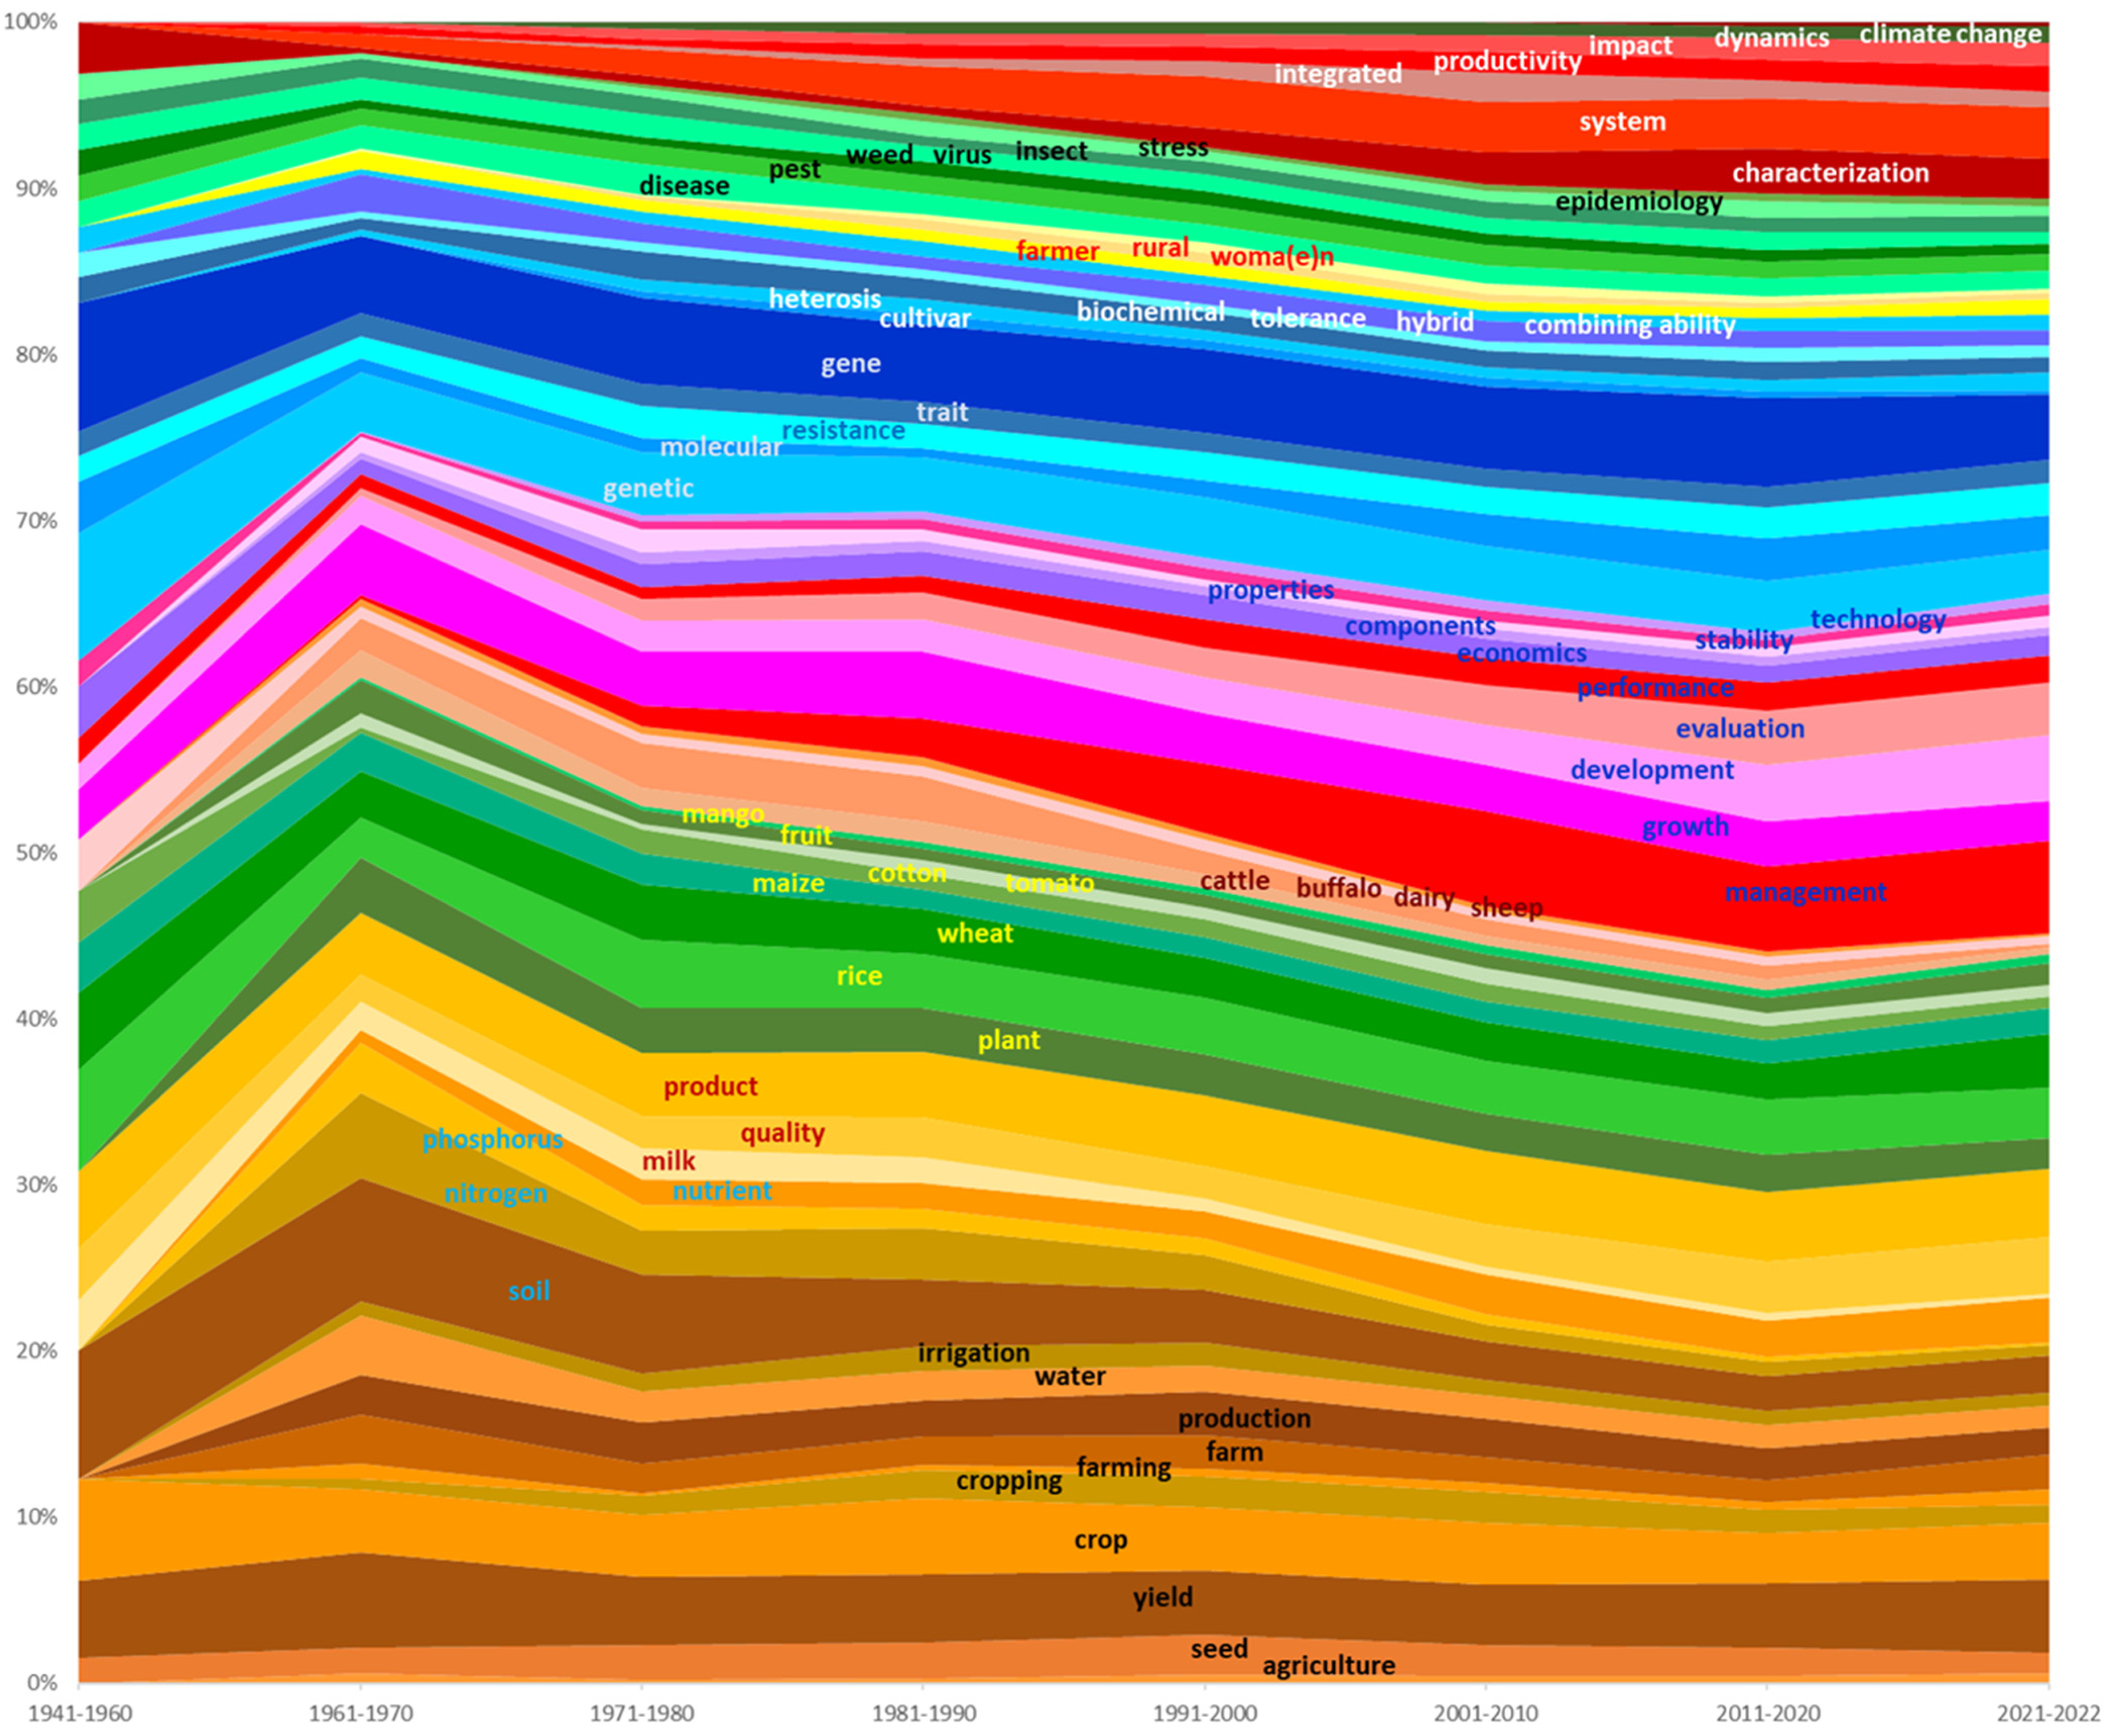
Analysis of the landscape of agricultural research in India based on ICAR's PhD database. Dynamics of selected terms over decades as percent theses.
The pattern in Figure 1 results from “layers” of stable terms with disturbances caused by the disappearance or appearance of emerging terms. Among the invariants, i.e., terms with little change in their frequency over time, one may notice: “growth”, “quality”, “physiological”, “disease”, “trait”, “gene”, “characterization”, “soil”, “rice” or “wheat”. Other terms decline (but seldom disappear): “utilisation”, “nutrient”, “response” or “insecticide”. A number of terms show increase, sometimes in the recent years: “integrated”, “systems”, “combining (ability)”, “assessment”, “fruit” and “vegetable”, along with several terms associated with studies of the social sciences: “farmer”, “rural” or “woman”. The increasing use of some terms in recent years (especially: “integrated”, “systems” and “assessment”) suggests a shift in approaching the agricultural sciences, with a growing systems view. The term “management” stands apart with a considerable increase, especially after 1980.
Overall classification tree on terms used in in Indian PhDs in agriculture
Descending hierarchical classification led to the identification of five theme-clusters (Figure 2). These five theme-clusters account for 29.0, 16.9, 17.7, 21.0, and 15.5% of the total number of classified PhD titles, respectively. The fraction of titles which are captured within these clusters is 93% of the total (i.e. about 7% of the titles are un-classified), so that clusters 1, 2, 3, 4 and 5 actually account for 22.0, 17.7, 16.9, 21.0, and 15.5% of the classified titles, respectively (Table 2).
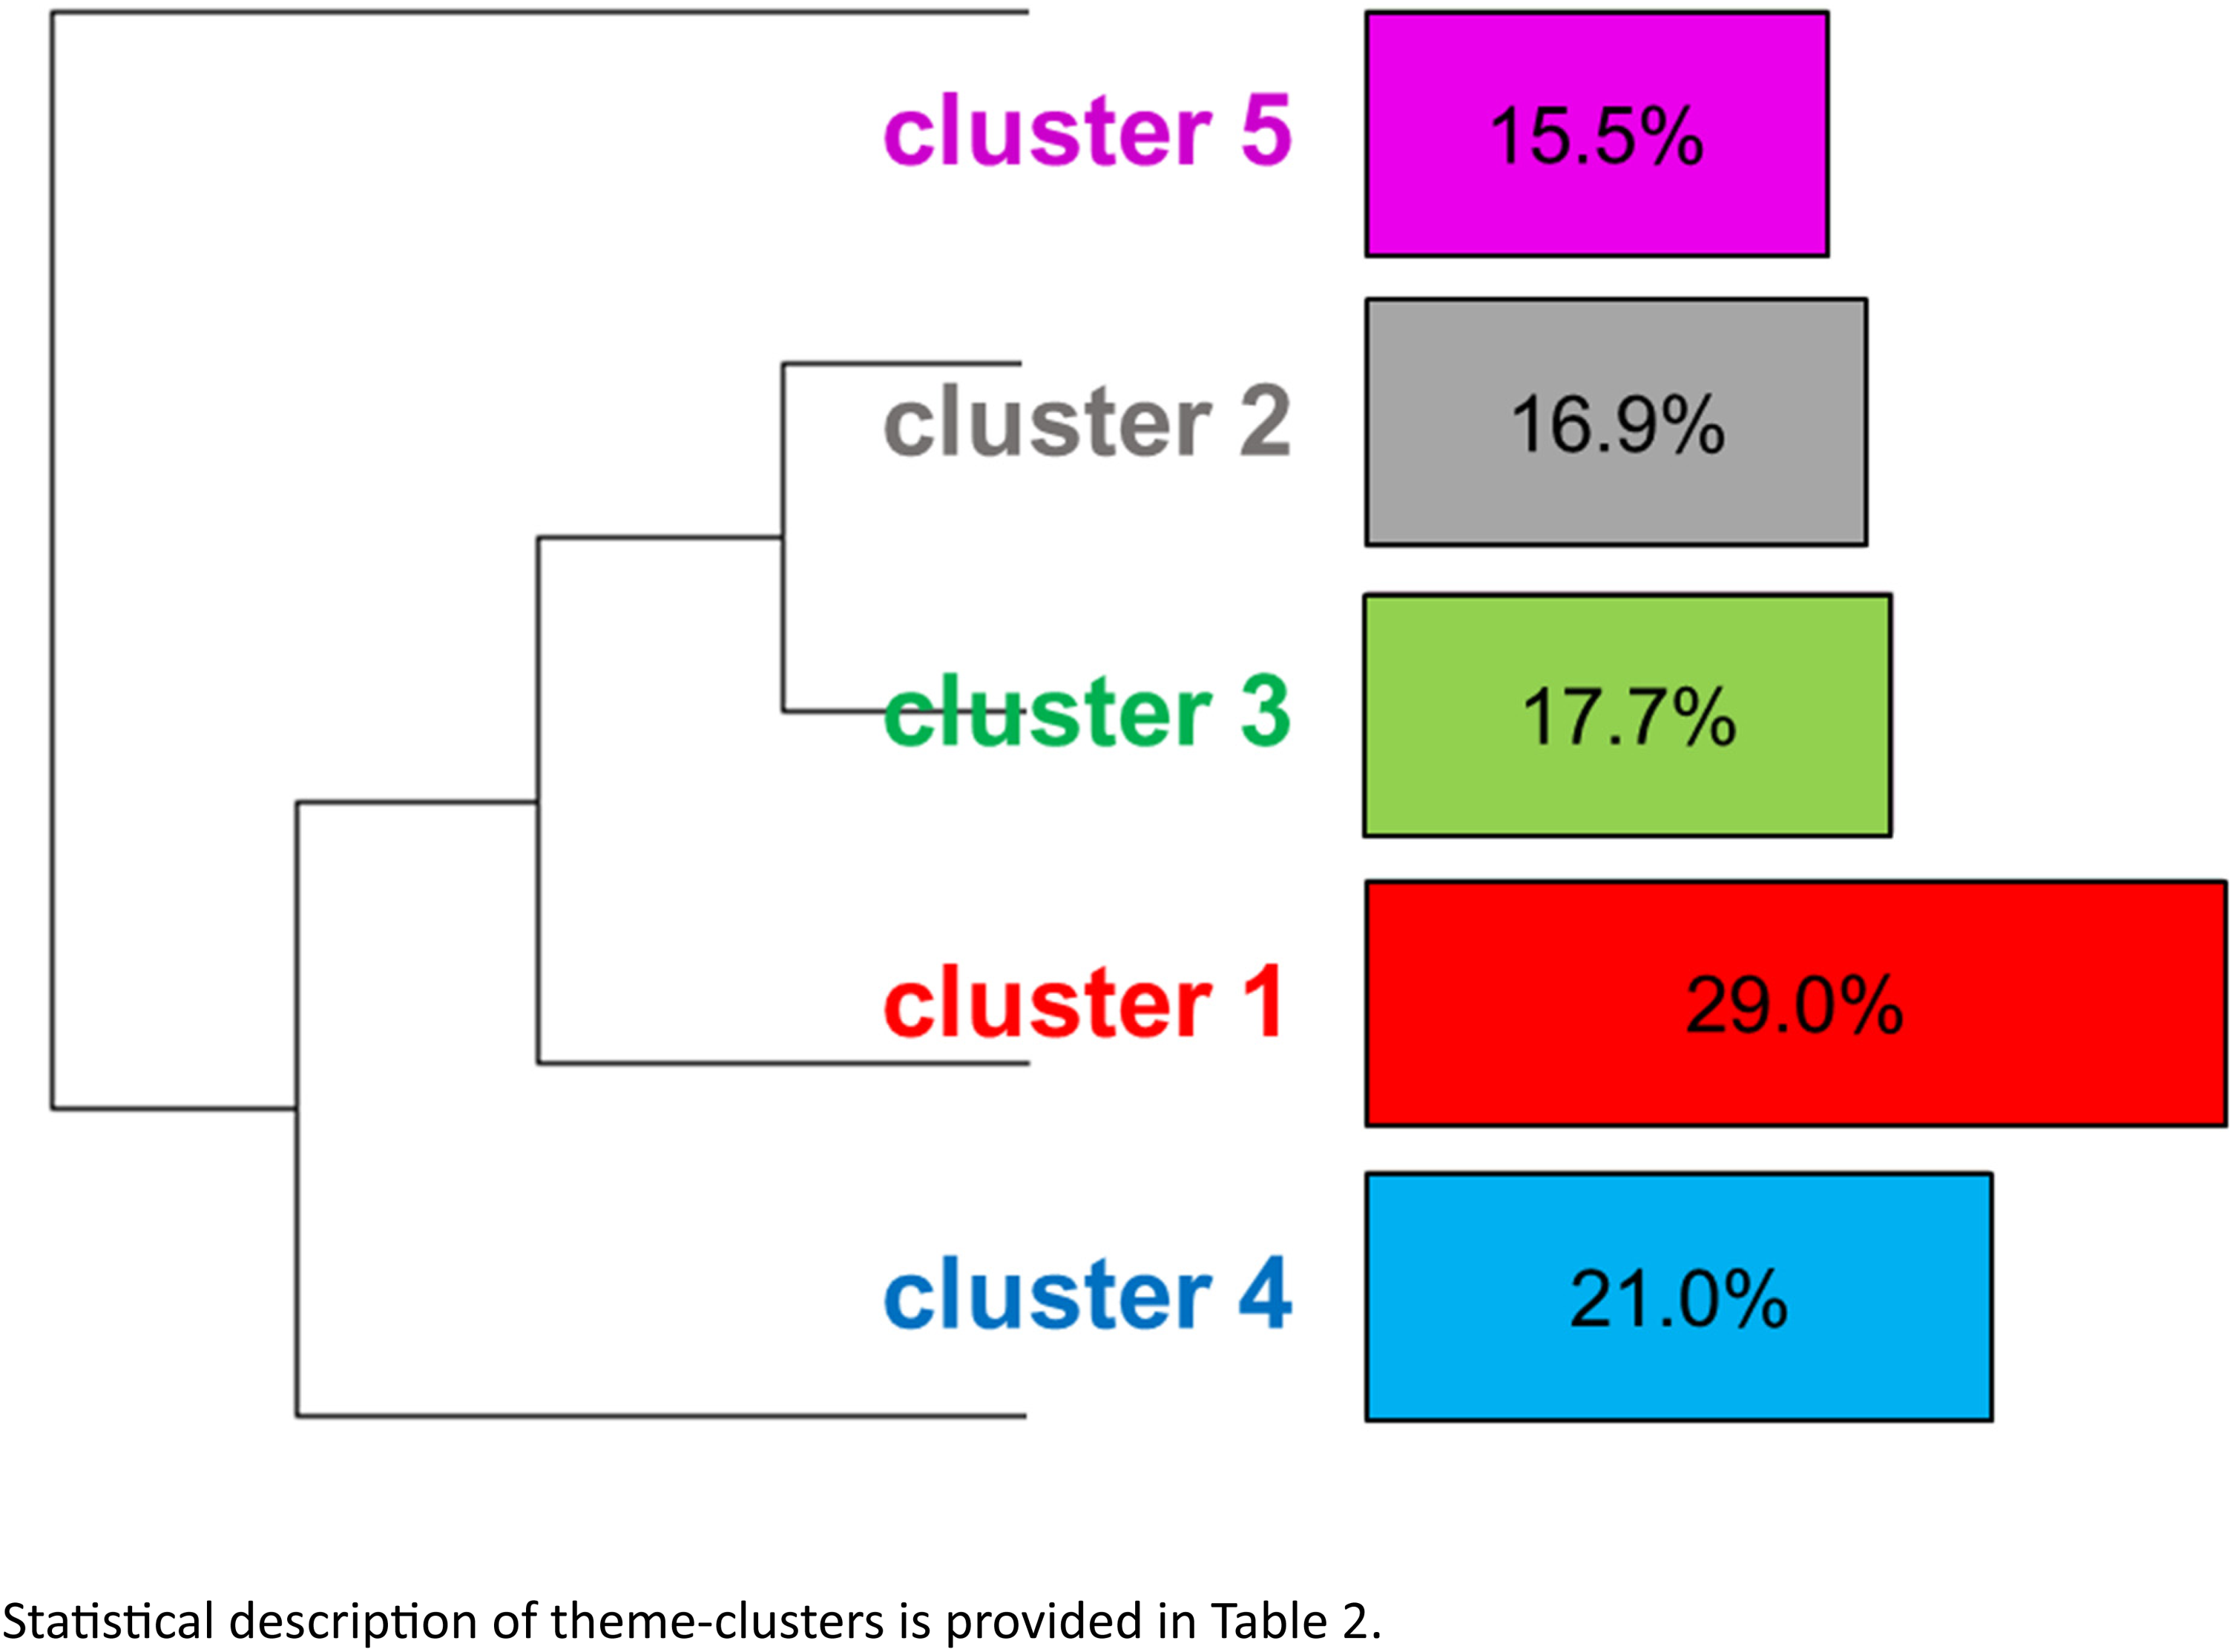
Analysis of the landscape of agricultural research in India based on ICAR's PhD database. Classification tree of ICAR PhD theses. Statistical description of theme-clusters is provided in Table 2.
Analysis of the landscape of agricultural research in India based on ICAR's PhD database. Description of five theme-clusters using their associated terms: within-cluster and absolute frequencies, within-cluster percent occurrence, and chi-square association of terms with clusters.
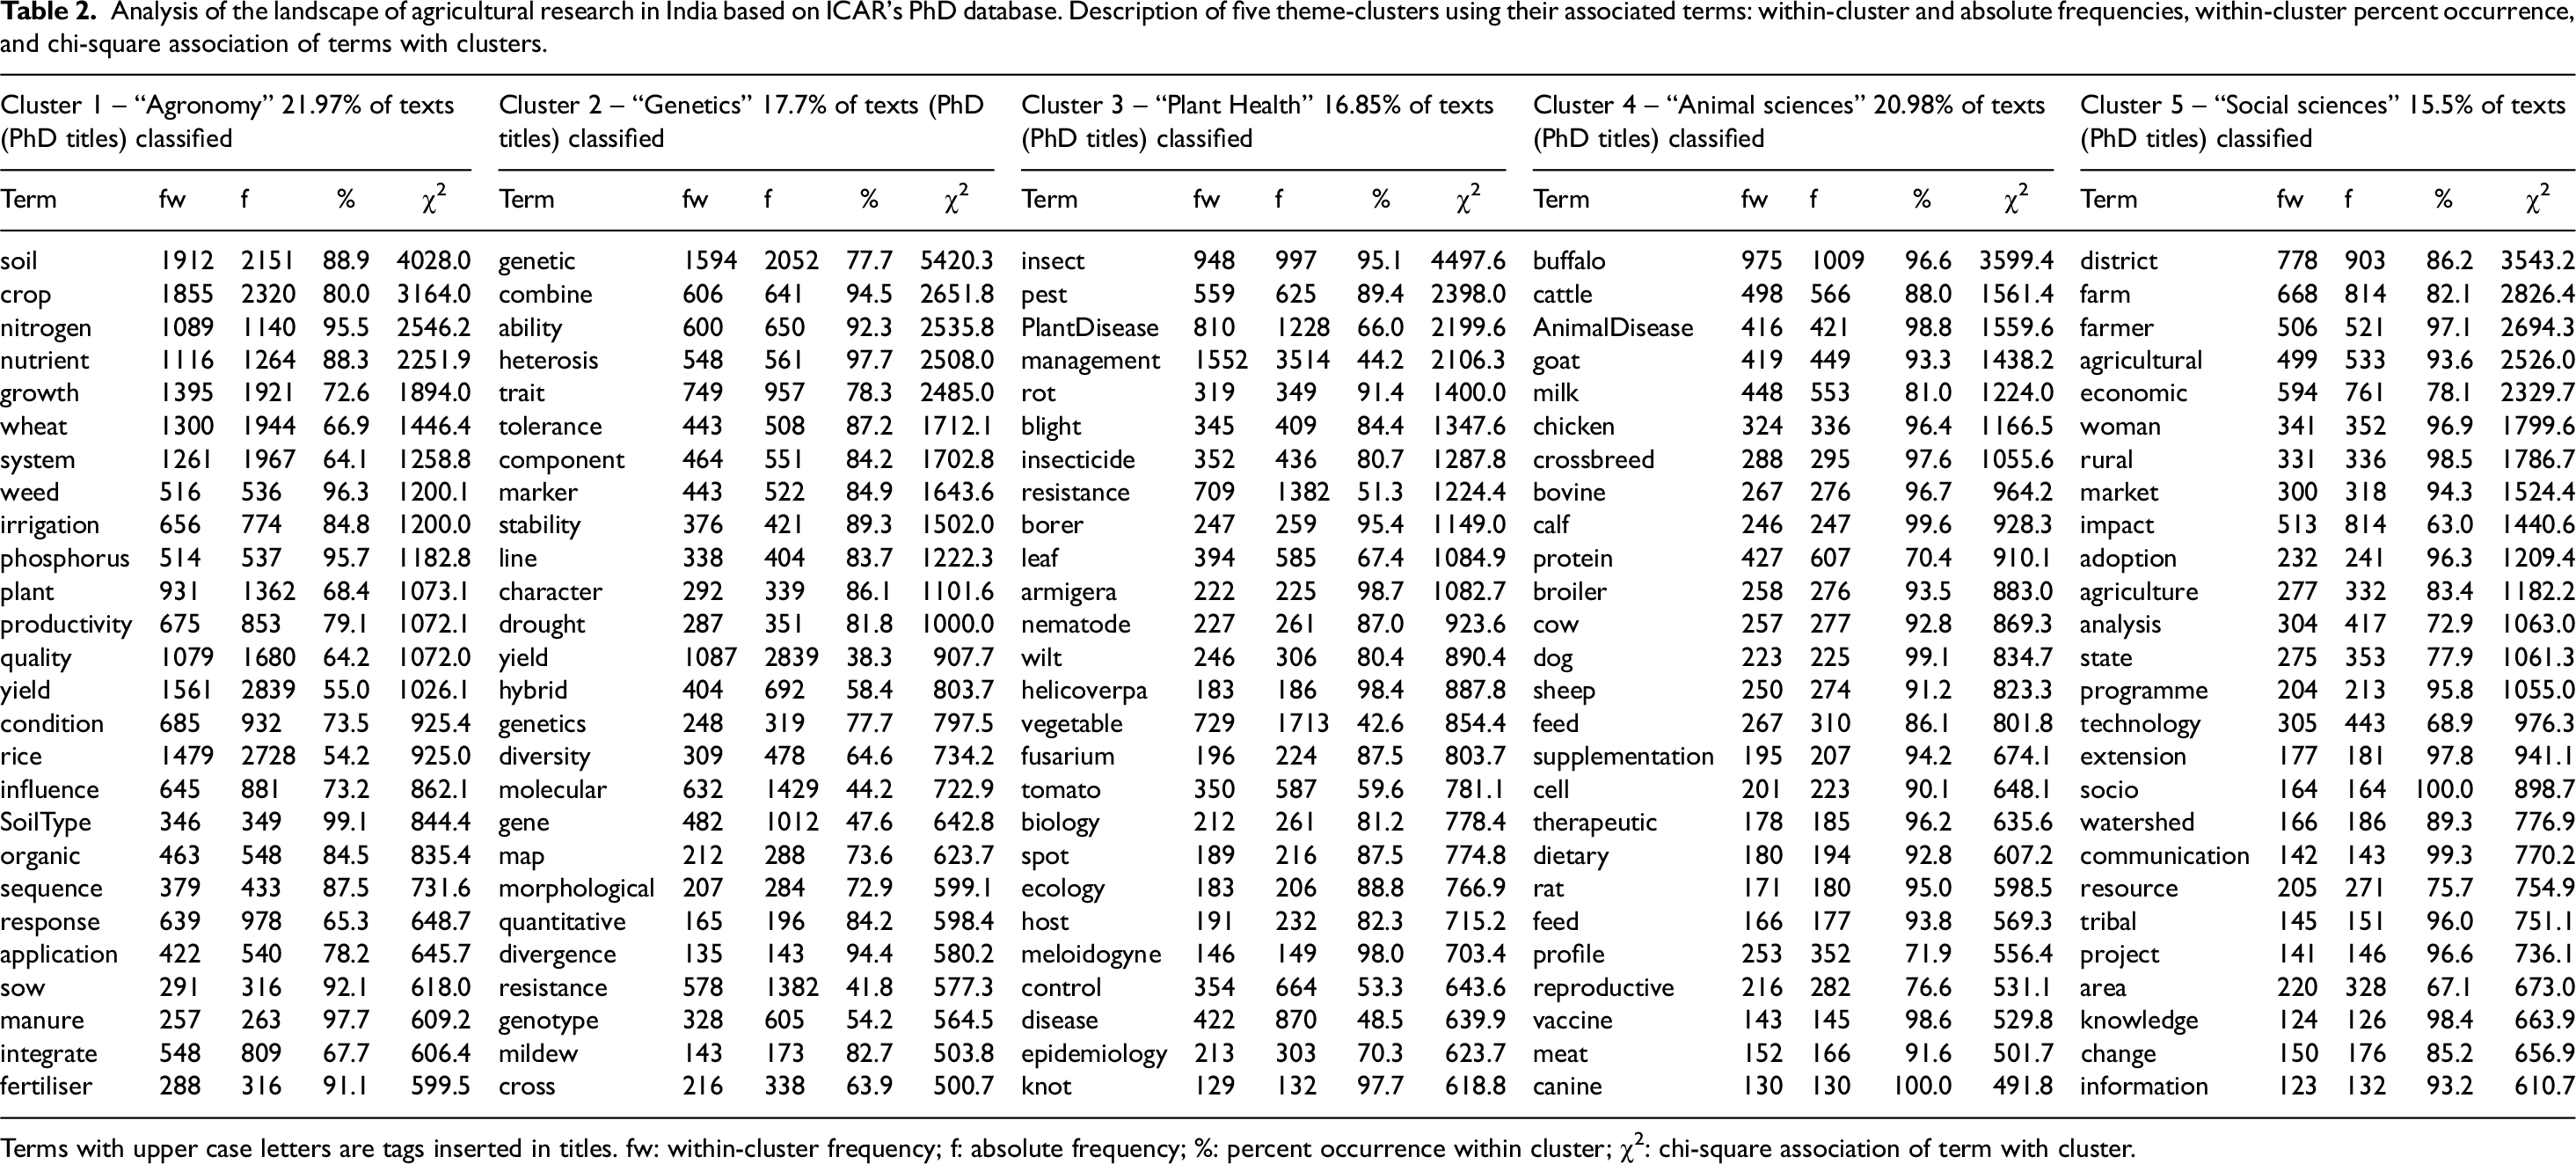
Terms with upper case letters are tags inserted in titles. fw: within-cluster frequency; f: absolute frequency; %: percent occurrence within cluster; χ2: chi-square association of term with cluster.
Table 2 provides details of the meaning of each cluster, with the within-cluster frequency of multiple terms, the absolute frequencies of these terms across the entire data set, the percentage of usage of a given term with a cluster and the chi-square association (correlation) level each term with a given cluster. The five theme-clusters may be described as follows:
Theme-cluster 1 (21.97% of titles, Table 2): “Agronomy” refers to the agronomy-related sciences with terms such as “soil”, “crop”, nitrogen”, nutrient”, “growth”, “wheat”, “system”, “weed”, “irrigation”, “phosphorus”, “plant”, “productivity”, “quality” and “yield”, which have χ2 association values in excess of 1000 with this cluster. Theme-cluster 2 (17.70% of titles): “Genetics” reflects research dealing with genetical aspects of investigations, with terms such as: “genetic”, “combine”, “ability”, “heterosis”, “trait”, “tolerance”, “component”, “marker”, “stability”, “line”, “character” and “drought”, which have χ2 larger than 1000 in their association with this cluster. Theme-cluster 3 (16.85% of titles): “Plant Health” groups together theses with terms such as: “insect”, “pest”, “PlantDisease”, “management”, “rot”, “blight”, “insecticide”, “resistance”, “borer”, “leaf” and “armigera”, with χ2 larger than 1000 in their association with this cluster. Theme-cluster 4: “Animal Sciences” (17.7% of titles) involves terms such as: “buffalo”, “cattle”, “AnimalDisease”, “goat”, milk”, “chicken” and “crossbreed”, with χ2 larger than 1000 in their association with this cluster. Theme-cluster 5: “Social Sciences” (15.5% of titles) groups theses with terms such as: “district”, “farm”, “farmer”, “agricultural”, “economic”, “woman”, “rural”, “market”, “impact”, “adoption”, “agriculture”, “analysis”, “state” and “programme”. This series of terms and those listed in Table 2 highlight the diversity of what is referred to under “Social Sciences”, from sociology (e.g. “woman”, “adoption”), to economics (e.g. “economic”, “market”), to extension and communication sciences (i.e. “programme” and in Table 2: “extension” and “communication”), to rural activities (“farm”, “agriculture”) and to the professional domain (e.g. “farmer” and in Table 2: “knowledge”).
Note that the above description emphasises not the frequency of terms but instead chi-square values, that is statistical information: a term such as “woman” has a quite low frequency: n = 363 only but has a very high chi-square value (i.e. inertia or information: 1799.6) associated with a given theme-cluster. Note also that a given term may be associated with different clusters, having in some clusters a fairly high frequency, but a small χ2: this is a reflection of the statistical bearing of a given term within a particular grouping of terms that constitute a cluster, a bearing that this same term may not have in another cluster.
Timelines of theme-clusters
The above analyses have so far considered the entire data set, from 1947 and earlier, until 2023. Using the methods described above, theme-clusters have been defined, which share to some degree, and depending on the clusters, some terms. It is of interest to see if these theme-clusters are invariant, or if, on the contrary, their sizes vary over the decades of Indian research. Our results so far indicate that Reinert's (1990) descending classification suitably groups 93% of the PhD theses: it may be interesting to see whether the remaining 7% are randomly distributed over time, or, on the contrary, aggregated, therefore indicating a dynamic.
The dynamic of cluster throughout decades is shown in Figure 3, which shows that all clusters retained fairly stable frequencies over time. However, the fraction of unclassified PhD thesis titles is not randomly distributed, but on the contrary increases over time. While the whole-data set clusters seem quite robust, they may not fully account for changes in terms or term frequencies. Analyses within distinct successive time periods is therefore warranted.
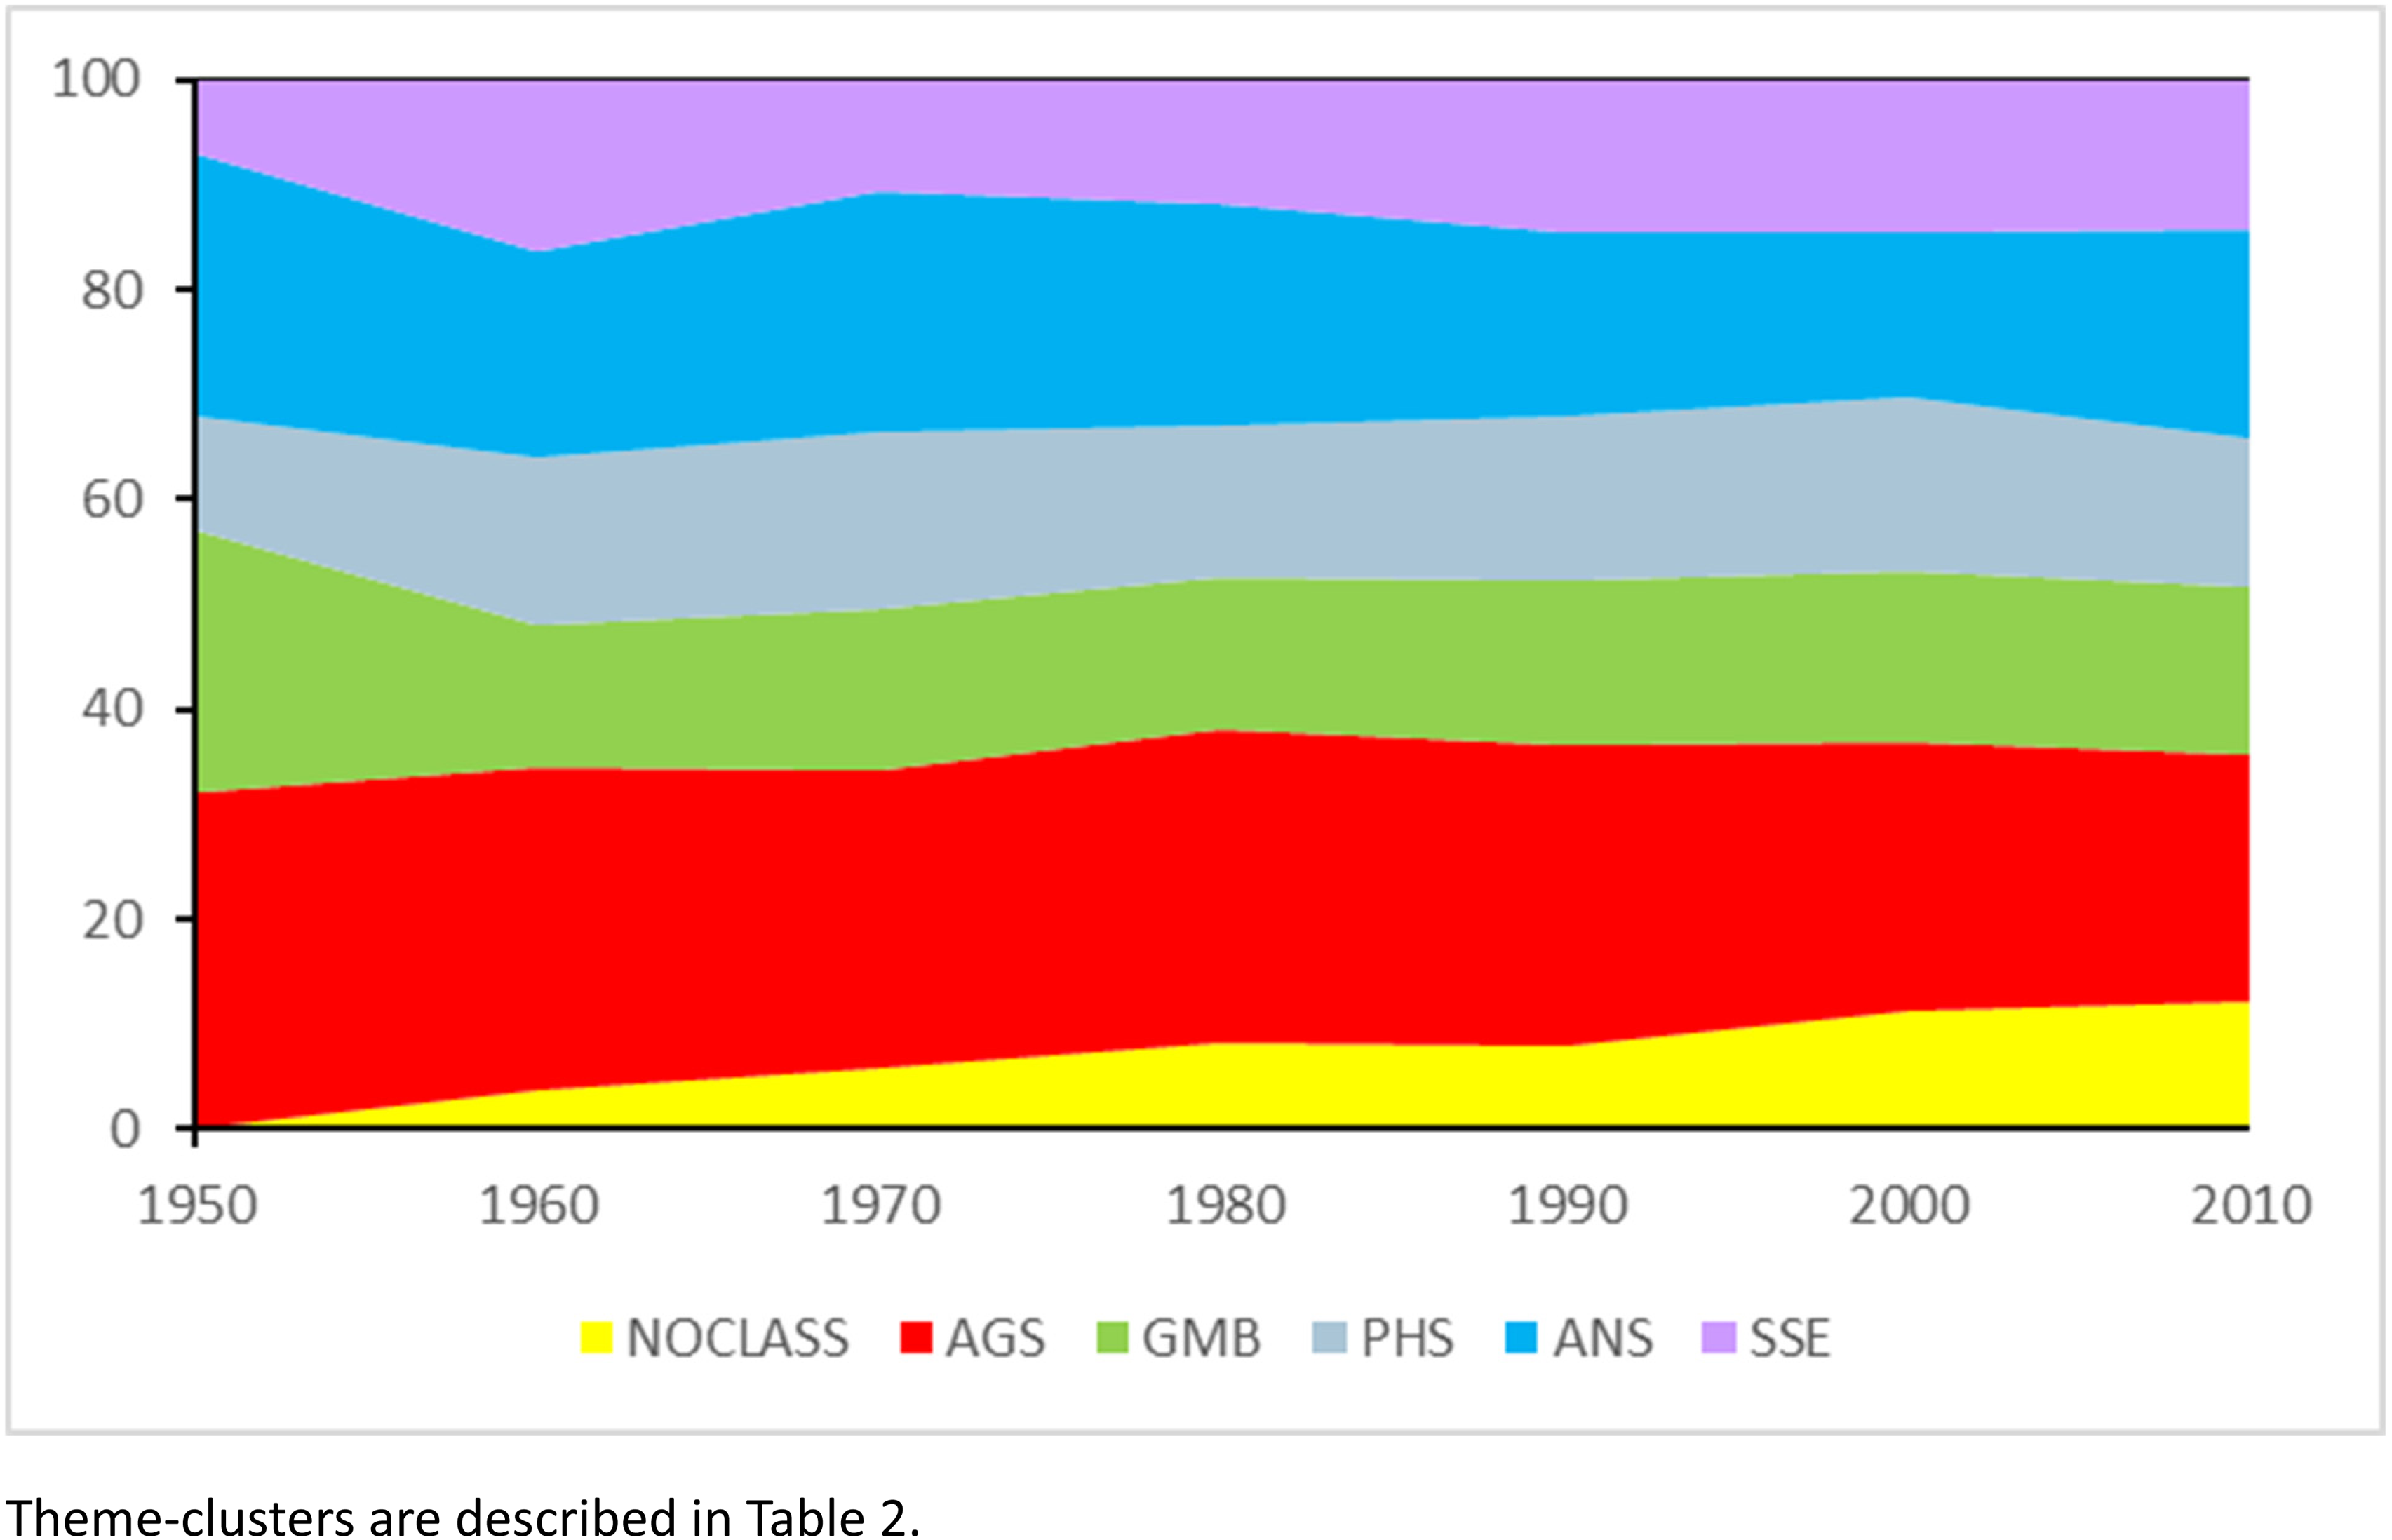
Analysis of the landscape of agricultural research in India based on ICAR's PhD database. Time-line of importance expressed as relative frequencies per year of PhDs belonging to five theme-clusters across the entire data set. Theme-clusters are described in Supplementary Material S5.
Overall correspondence analysis on terms used in in Indian PhDs in agricultural research
Correspondence analysis generates four axes (Supplemental Material S5) which account for 30.4, 28.4, 22.3 and 19.0%, respectively, of the total inertia (information) constituted by the 35,122 thesis titles. Analysis therefore focuses on the three first axes, especially axes 1 and 2:
Axis 1 (see Table in Supplemental Material S5) is very strongly associated with cluster 5 (“Social sciences” in the negative direction: contribution: 0.701, coordinate: –2.249) and is associated with Clusters 2 (“Genetics”) and 3 (“Plant Health”, in the positive direction: contributions: 0.927 and 0.877; coordinates 0.156 and 0.134). Axis 1 therefore opposes “Genetics” and “Plant Health” to the “Social Sciences”. Axis 2 (Supplemental Material S5) carries a strong contribution (0.806) of cluster 4 (“Animal Sciences”) in the negative direction (−2.083), which is opposed (in the positive direction) to clusters 1, 2, 3, and 5. Axis 3 (Supplemental Material S5) carries a strong contribution (0.514) of cluster 1 (“Agronomy”) in the positive direction (1.268), which is opposed to cluster 3 (“Plant Health”, contribution: 0.390) in the negative direction (−1.499).
Terms may be associated with different axes, with different contributions to these axes. Considering “rice”, the most frequently used term for a crop, the contribution of “rice” is very small (0.002) to axis 1, is larger yet small (0.04) to axes 2 and 3, and is near-zero to axis 4. Despite its very high frequency (mass), therefore, “rice”, as a term, is actually close to the origin of axes: the term is neutral toward all axes generated, implying that its very frequent usage is shared among theme-clusters in an equivalent manner. This contrasts with “management”, the most commonly used term across all 35,122 theses. “management” has small contributions to axes 1, 2 and 3 (0.001, 0.004, and 0.002), but a quite large contribution (0.021) to axis 4. The term “management”, therefore, is closely associated with the theme-clusters (Table 2) that are mainly associated with this axis: “Genetics” (in the negative direction – implying that “Genetics” does not use “management” much) and “Plant Health”, in the positive direction – implying the opposite: plant health often refers to management.
Coordinates and correlations with axes are computed for disciplinary fields (which are not involved in the generation of axes) and listed in the table of Supplemental Material S5. This allows projecting each disciplinary field, considered as an individual variable, on the system of axes generated. The coordinates and correlations of disciplinary fields are in line with their associations with theme-clusters (Table 2), and therefore, with the results of the descending hierarchical classification.
Graphical interpretation of correspondence analysis
The information of the Table in Supplemental Material S5 is graphically summarised in correspondence analysis graphs. Figure 4(a) shows correspondence analysis results using axes 1 (horizontally) and 2 (vertically) as a system of axes. Correspondence analysis graphs may be interpreted as follows:
Each element of the analysis is a qualitative variable, whether active and contributing to the definition of axes (here, the five clusters generated through descending hierarchical classification, and therefore, all the terms these clusters incorporate), or projected, that is not contributing to the definition of axes (here, the disciplinary fields, and in other graphical representations, years of PhD defence); Each variable has a mass, which is strictly equal to its frequency in the data table analysed; Each variable thus has an inertia which is equal to the product of the variable mass (frequency) with the squared distance between the origin of the system of axes and the location of this variable in the system of axes that has been generated; Mass and inertia are irrelevant for variables not involved in the definition of axes; Two (active) variables that are spatially close one another in a given two-axes plan may be assumed associated; The strength of such association between two variables increases with their distance to the origin of axes; the strength of such association is measurable by a χ2 test of association, which exactly reflects the χ2 metric of correspondence analysis: in a correspondence graph, all active variables are positioned exactly according to the χ2 values that link them.
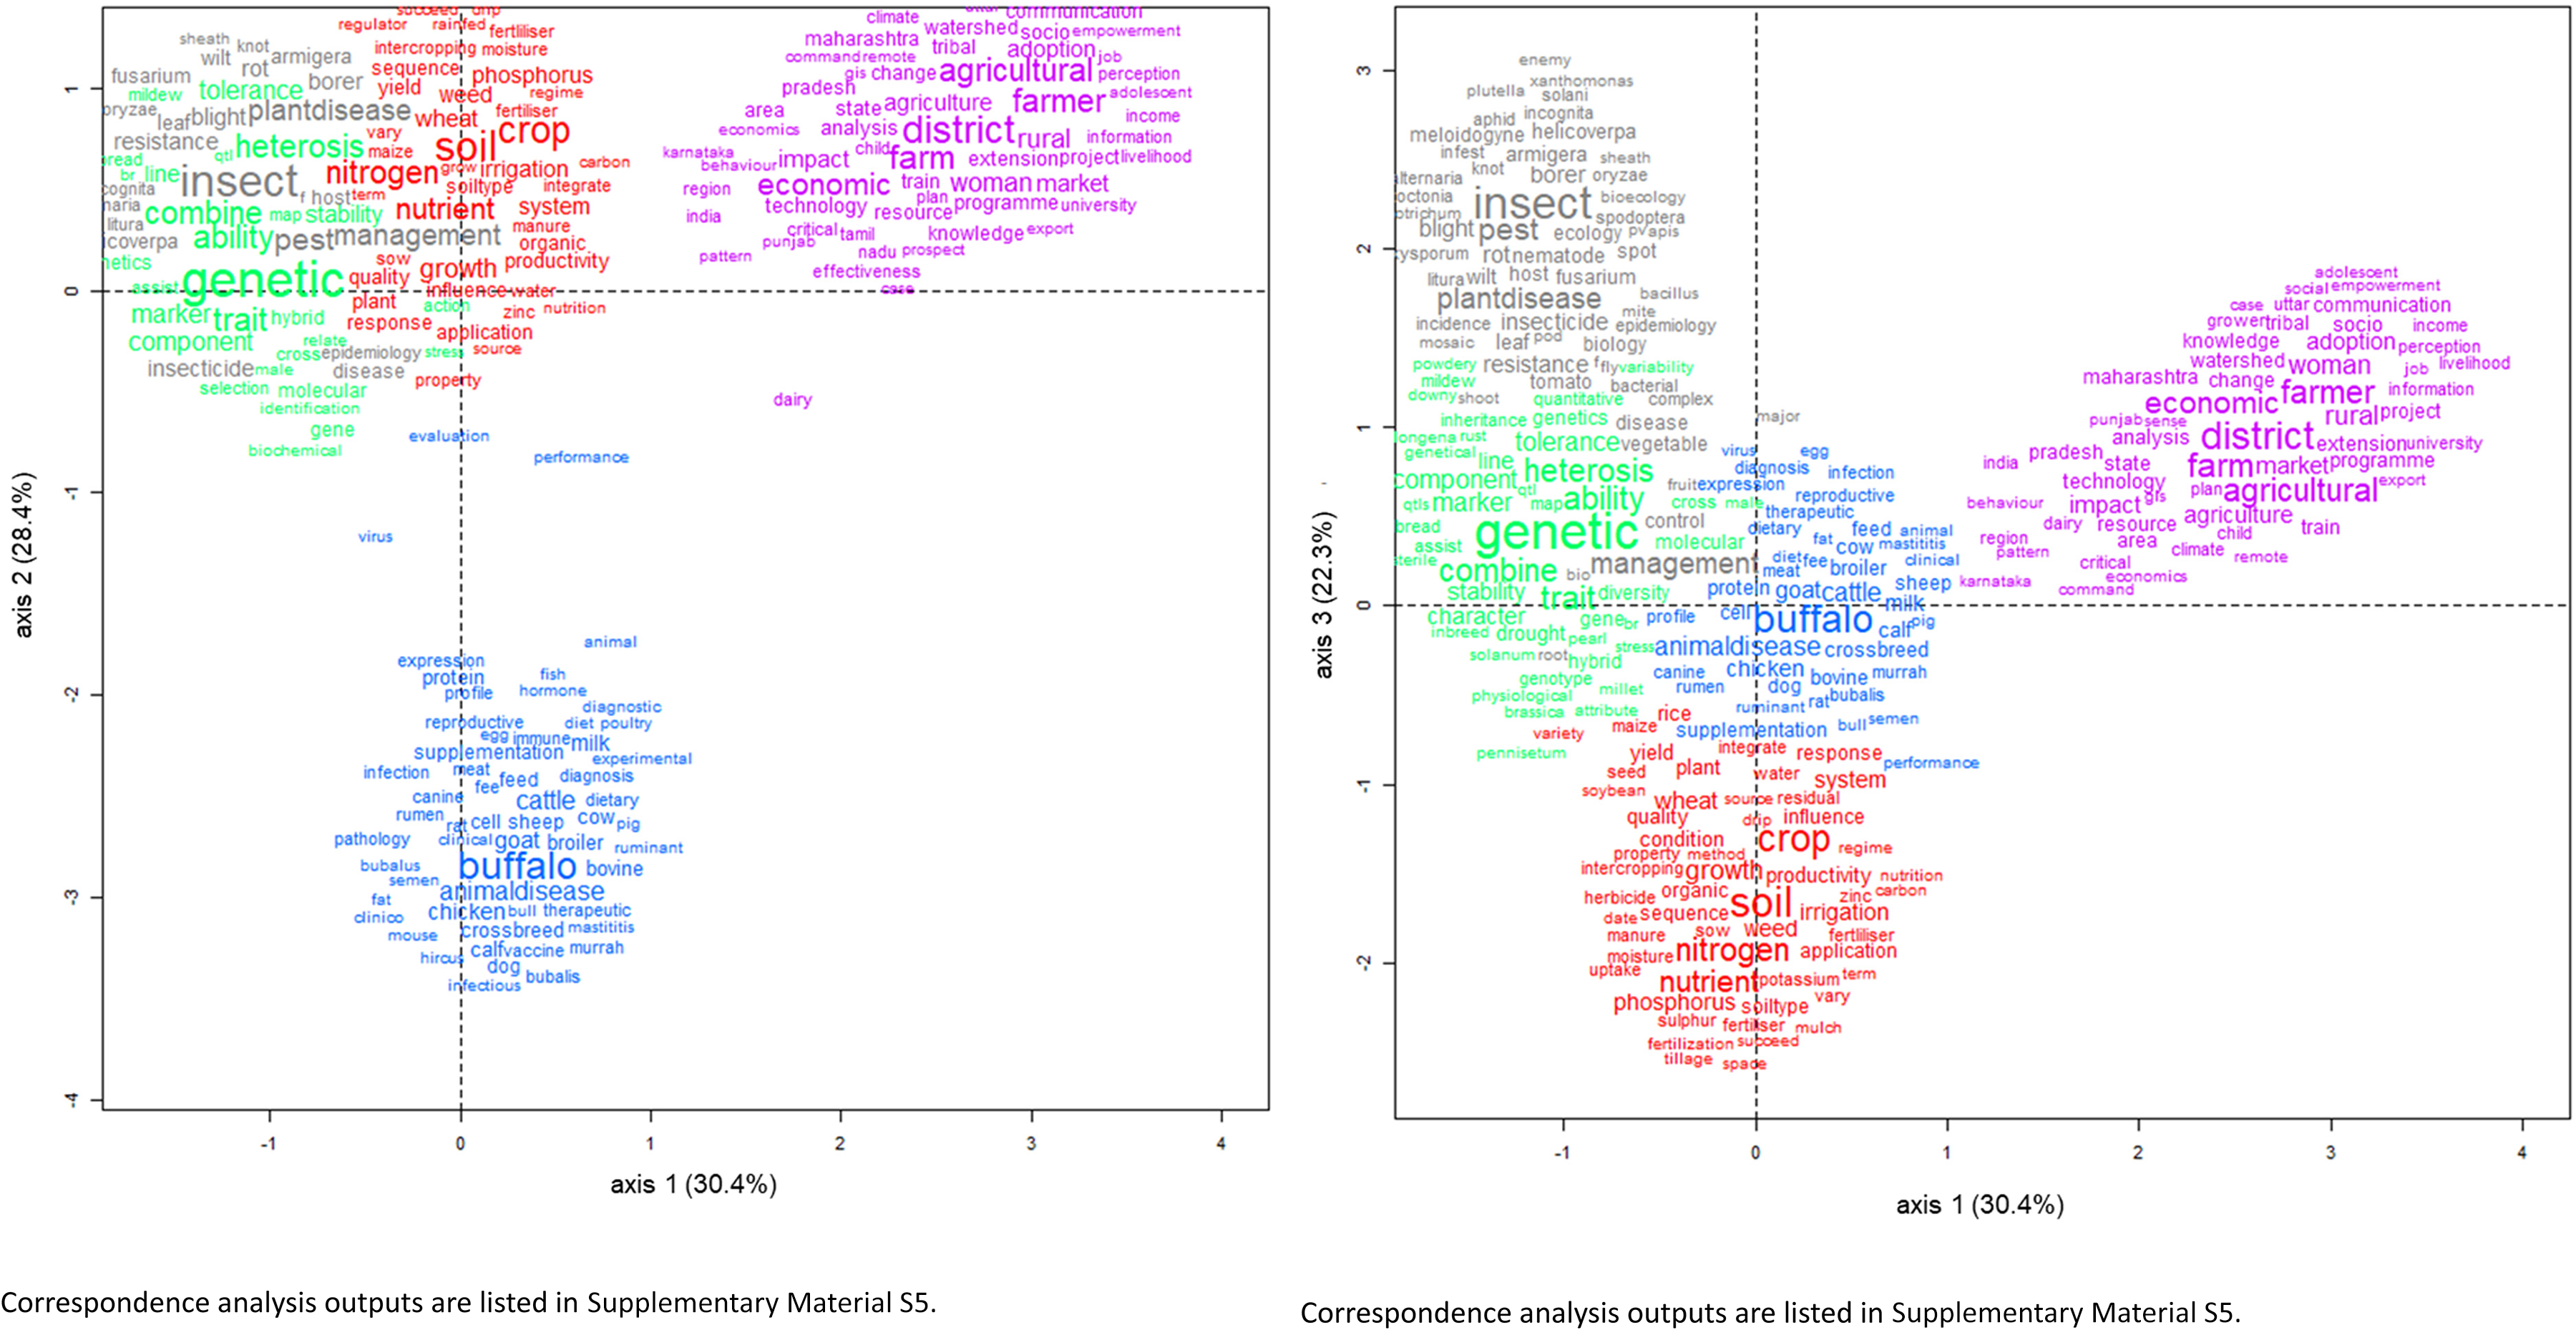
Figure 4a. Analysis of the landscape of agricultural research in India based on ICAR's PhD database. Correspondence analysis of clusters of ICAR PhD theses – Axes 1 and 2. Correspondence analysis outputs are listed in Supplementary Material S5. Figure 4b. Analysis of the landscape of agricultural research in India based on ICAR's PhD database. Correspondence analysis of clusters of ICAR PhD theses – Axes 1 and 3. Correspondence analysis outputs are listed in Supplementary Material S5.
Graphical interpretation of correspondence analysis of the entire data set
Figure 4(a) displays the spatial distribution of variables (terms in PhD titles) on axes 1 and 2 (30.4 and 26.4% of total inertia), thus reflecting about 56.8% of the total information extractable from the data table. Three groups of clusters are distinguished: one is cluster 5 (“Social Sciences”), in the positive direction along the horizontal axis 1, another is theme-cluster 4 (“Animal Sciences”), in the negative direction along the vertical axis 2, and a third, which involves clusters 1 (“Agronomy”), 2 (“Genetics”), and 3 (“Plant Health”). This latter group of three clusters is closer to the origin of axes, however with small negative coordinates along axis 1. Clusters 2 and 3 are hardly distinguishable. Cluster 1 is more easily visible, with coordinates approaching 0 on axis 1. This association of clusters suggests that the terms used in “Plant Health” often are used in “Agronomy” (and vice versa), while this is not the case between “Genetics” and “Agronomy”; and that “Plant Health” and “Genetics” have many common terms (see also Figure 2, which confirms this: clusters 2 and 3 are the closest in the classification).
Considering axes 1 and 3 provide a complementary view (Figure 4(b)) with 30.4 + 22.3 of the total inertia of the data set, using these two axes enables distinguishing all five clusters. Cluster 5 (“Social Sciences”) has positive coordinates along axis 3, and is thus located at the upper right-hand of the graph. The average coordinates of cluster 4 (Animal Sciences”) on axis 3 is near-zero, and so is located at the centre of the graph. The average coordinates of cluster 3 (“Plant Health”) is positive along axis 3, and thus is located at the upper left-hand of the graph, that of cluster 2 (“Genetics”) is near-zero on axis 3, and is located at the mid-left-hand of the graph, and that of cluster 1 (“Agronomy”) is negative, and this cluster is at the bottom centre of the graph. In this view of the five clusters, “Plant Health”, “Genetics”, “Animal Sciences” and “Agronomy”, in this order, slightly overlap. They however are apart from “Social Sciences”.
Complementary variables: Years and disciplinary fields in the overall correspondence analysis
Correspondence analysis further allows analysing the positioning of disciplinary fields (Table 1) and successive years. These are complementary variables projected on the system of axes generated by correspondence analysis. The figure in Supplemental Material S4.4 shows these supplementary variables, which are represented with font sizes that are proportional to their chi-square associations with axes: a complementary variable with a large font, therefore, does not necessarily have a high weight (frequency) since inertia is proportional to the squared distance to the origin of axes.
Among the disciplinary fields, those which are the most apparent in terms of inertia in the figure in Supplemental Material S4.4 are the veterinary sciences (VET), extension (EXT), zoology and entomology (ZOOENTOM), and plant breeding and genetics (PBG). In the case of the former two, this is due to a large distance from axes, indicating strong associations with cluster-themes 4 (“Animal Sciences”) for VET and with cluster-theme 5 (“Social Sciences”) for EXT. The large inertia of ZOOENTOM and PBG are related to both their large frequencies (Supplemental Material S4.3) and their close linkages with cluster-theme 3 (“Plant Health) and cluster-theme 2 (“Genetics”), respectively. Several disciplinary fields are quite visible in Supplemental Material S4.4, including PHYTOPATH, SOILSCI, AGRO, ECON and ANSCI, whereas many others have little visibility, in part due to their small weight (frequency), or their poor representation (inertia) in this system of axes.
Among the low-visibility, low-inertia fields of science of the figure in Supplemental Material S4.4 is GEBB (genetics, biology and biotechnology; circled). GEBB represents one of the rapidly expanding fields of science (Figure in Supplemental Material S4.3), which is closely associated with other disciplinary fields, such as, on axes 1 and 2, plant breeding and genetics (PBG), phytopathology (PHYTOPATH), vegetable and fruit science (VEGFRUIT), and zoology and entomology (ZOOENTOM), and on axes 1 and 3 (axes in the figure in Supplemental Material S4.4 are the same as in Figure 4), animal sciences (ANSCI) and veterinary science (VET). Despite its size in mass and its growth in numbers of PhDs, GEBB is quite unobtrusive, with a low inertia and a positioning close to the origin of axes. This is because the PhD theses of GEBB have commonalties – in terms used – to a very wide array of distant disciplinary fields in the plant and the animal sciences. GEBB represents a rapidly expanding field, which is pervasive to a very large fraction of the science landscape (only the Social Sciences are poorly linked with it). GEBB has a very strong, shareable disciplinary content.
No conclusion can be derived from the size or positioning of years in the figure in Supplemental Material S4.4, except the fact that years are randomly distributed, mostly close to the origin of axes, indicating time-neutrality of theme-clusters, which may be considered as near-invariants in the entire data set.
Cluster and correspondence analyses within time periods of Indian agricultural research
Titles in each of the three time periods were in turn submitted to the above classification and correspondence analysis procedures: post-Independence and Green Revolution (1925–1985, GRY), post-Green Revolution (PGY, 1986–2011) and recent years (RY, 2012–2023). As shown in the above analyses on the entire data set, these analyses may reliably be summarised by the resulting final correspondence analysis graphs.
The results shown in the figure in Supplemental Material S4.5 may be summarised as follows. Each separate analysis led to five theme-clusters, as the analysis on the entire data set did (Figure 4(a) and 4(b)). The theme-clusters necessarily differ from one analysis to the other; however, they broadly correspond to the same themes as in the whole-data set analysis. Differences occur in the geometry of cluster-themes shown in Supplemental Material S4.5; however, the linkages among cluster-themes are similar. All three analyses account for large fractions of total inertia (for each period): the axes 1 + 2 account for 29.5 + 26.9 = 56.4, 30.4 + 27.5 = 61.5, 30.7 + 28.9 = 59.6%, respectively, enabling similar and valid overall conclusions.
Timelines of some terms and tags
The figure in Supplemental Material S4.6 shows the timelines of some selected key words and tags in absolute terms (numbers of PhDs per year). The upper graph of the figure in Supplemental Material S4.6 shows the progress of research on rice and wheat, with a regular increase in rice, and irregular in wheat. In both cases, the number of PhDs is quite large. This graph also shows the progress of research on vegetables and fruits, which is on par with that of the two key staples, rice and wheat. Note that research on vegetables and fruits already was quite large by the 1970s and 1980s, and never showed a decline. Research on fruits and vegetable then made considerable progress after 1990.
Research on insecticides (Supplemental Material S4.6, centre of the figure) always was very strong in India. Note however that (1) this research is slowing down since 1990, and (2) a large fraction of research on insecticides deals with their toxicity, with insect resistance to chemicals, or with the development of bio-insecticides. Research on fungicides is much smaller in volume; it also includes the development of bio-control agents. Research on herbicides is making steady progress. In this case, contrary to insecticides and fungicides, the focus is truly weed control with chemicals.
Research on hybrids (Supplemental Material S4.6, bottom of the figure) has considerably increased after 1990. This increase is mainly related to research on maize, but there has been a strong contribution on hybrid rice. Hybrids in vegetable and fruit production also are quite important. There has been, on the other hand, very limited research on climate change. Even the terms with root “clim*” (i.e. “climate”, “climatology”, “meso-climate”, etc.) are collectively rare, comparatively, in the database, even if an increase is observed after 1990.
Discussion
Although agriculture has played in the Indian subcontinent, as elsewhere in the world, a pivotal role in the development of societies over time and space (Thapar, 2002), agriculture has not had the anthropocentric role there that it occupied, for instance, in the Middle East in its early history (e.g. Rudgley, 1999), a position that agriculture still occupies today in Western Europe and most of today's globalised world. A vision of agriculture in India today still bears the marks of the diverse successive spiritual frameworks from its historical past, where the human being is only part, not the at the centre, of the living world. We believe that these frameworks of the past still matter today in explaining the path of agricultural development, and therefore of society construction, in India.
PhD dissertation titles as an instrument of investigation
This analysis offers an insight in the recent development of agriculture in India, using the research subjects of PhDs as an instrument to document what the focus of scientific investigation has been. The questions that research may address can both be a reflection of the aspirations of science in making agriculture a better basis for society and its environment, as well as a response to the many challenges that agriculture must face in order to ensure the sustenance and sustainability of society. How narrow, and possibly limited, the sole examination of PhD subjects as an instrument of investigation may be (as opposed to for example scientific publications or an inventory of research accomplishments) is addressed briefly at the end of this Discussion.
Value of the data analysed
The database of PhD dissertations assembled and curated by ICAR is a repository that is specifically dedicated to document PhDs that are defended in India in the domain of agricultural research. To the best of our knowledge, this database constitutes the largest of its kind in the world. It may be a powerful instrument to see where research efforts have been invested in the past, and therefore, as a very useful basis to look into future needs.
On the methods used in the present study
Analytical tools, such as IRaMuTeQ, are extremely useful and powerful in the analysis of large databases, as here in the case of ICAR's PhD data base. Specifically, these methods enable (1) processing qualitative data of a cardinal (non-ranked) nature; (2) producing multidimensional analyses of associations between the original variables (here, terms) or meta-variables (here, clusters), and complementary variables (here, years or disciplinary fields; (3) enabling formal statistical testing of such associations; and (4) producing graphical outputs which enable mapping multidimensional associations.
Despite their value, these tools, which were developed by the end of the 1970s and improved over the following decades, have been very seldom used, in both the socio-economic and bio-physical domains. IRaMuTeQ (which was developed by psychologists of the University Jean-Jaurès of Toulouse-Mirail, France) is one example of software which now is available on an R interface: it is widely and freely accessible.
On the stability of agricultural research themes in India
Despite, or perhaps because of, the extraordinary diversity of agriculture in India, the present analysis shows that the research themes in ICAR's supervised research in India have been, in appearance, strikingly stable over decades as shown by the evolution in importance of its broad themes (Figure 3). The respective importances of the various 31 disciplinary fields show, too, a very high overall stability (Supplemental Material S4.3). These elements of stability reflect, in part, the integrated roles of the three components of ICAR's mission: education, extension and research. Agricultural research in India, as reflected by its PhDs, has been conducted within specified departments or research-education structures, each having very specific domains of action.
This stability in research themes may be, at least in part, associated with the steady, constant progress of India's agriculture: FAO's data (https://www.fao.org/statistics/en) demonstrate that the production of animal and plant products has regularly increased, apace with and even exceeding the needs of India's population, today the largest in the world. Stability for science is essential: it takes roughly a decade for a new variety of cultivated plant, or a new breed of animal, to be selected, and it may take longer for the new plants or animals to be adopted by agriculture. We note that the present analysis does not highlight some fundamentals of agriculture, such as seed production—one critical area, with much technology involved. It also is strategic for the independence of India's agriculture.
The evolution of the words of science over time (Figure 1), however, shows patterns of change. Some terms are very stable in their (relative) frequency (e.g “gene”, “economics”, “performance”, “water”, “production”, “farm” or “yield”; many names of farm animals and cultivated plants to be added). There are, however, terms which have (1) progressively declined, (2) progressively increased or (3) strongly increased recently in frequency. The first group (decline) includes “growth”, “phosphorus”, “nitrogen” and “soil”; the second group (increase) includes “productivity”, “system”, “woman(en)” and “rural”; and the third group (sharp increase) includes “characterisation”, “integrated” and “management”. We also note that the stability of some terms is of significance as regards research priorities; for instance, “quality” – a term typically associated with crop harvests and agricultural produce – has a very stable presence, indicating an early and durable consideration in research agendas in India.
The variation in the use of terms over time reflects the inner dynamics of research. They may represent expanding subjects of investigation, or the phasing out of subjects. Caution, however is required: for example, the declines of “phosphorus”, “nitrogen” and “soil” (Figure 1) does not imply a decline of soil science, which remains a stable field over time (Supplemental Material S4.3). This may be explained by the fact that some terms may be traded over others in a given field of research (e.g. an increased focus on plant mineral nutrition rather than soil contents or fertilisers). Cluster and correspondence analysis provide additional insights. For example, “management”, a common term of economy, actually is associated in these analyses to plant health sciences (cluster 2, Figure 2), as in “pest management”. However correspondence analysis shows that the term is strongly shared among clusters 1, 2 and 3 (“agronomy”, “genetics” and “plant health”, respectively) along axes 1 and 2 (Figure 4(a)), and also among clusters 1, 2 and 4 (“agronomy”, “genetics” and “animal sciences”) along axes 1 and 3 (Figure 4(b)). One may thus conclude that “management” is pervasive across all theme-clusters, except perhaps the one where it would have conceptually come from, the social sciences (including economics, cluster 5 of Figure 2).
On agricultural extension
The public extension system of India probably is the largest in the world in terms of personnel and resource involved. This strong component of India's agricultural research may be, at least in part, associated with the progress in terms of food production. Extension, and the associated Social Sciences, is a main feature of ICAR's supervised research: the present work shows that there is research, and many PhD theses defended, on agricultural extension: this appears to be a unique feature of India's research. Anderson (2007) provides insights on the difficulties in quantifying the impacts (not just in money terms) of extension on the many facets of agriculture (not just production). This might represent an opportunity for ICAR to seize: the need for research on extension is very real.
Some remarks on features of India's agricultural research, seen from the ICAR PhD database
Research on India's main staples, such as, for example rice and wheat, is traditionally very powerful. This strength of research on key staples, however, never seems to have suppressed research on fruits and vegetables, even at the peak of the Green Revolution (Supplemental Material S4.6). Research on fruits and vegetables today is very strong in India, and is comparable to that on wheat or rice.
Research in India has, very early in its history, addressed the issue of toxicants, in its many forms: towards animals (not shown), as well as towards plants. Research on pesticides (insecticides, nematicides, fungicides or herbicides) is very strong. Much of this research does not limit itself to the efficiency of chemical control, however. Many PhDs address the toxicology of agricultural chemicals, their effects on the natural environment, plants and animals. Much research also addresses the bio-control of pathogens and pests. India has a major international advantage in the domain of integrated pest management (“pest” being used to include any crop-damaging organism). Research on herbicides, however, seems to concentrate on chemical weed control.
What the present analysis shows and does not show
Our results do not highlight themes such as “biotechnology”, “precision agriculture” or “digital tools”. These would be concept-domains created as tags in the lemmatisation and keyword definition phase prior to its analysis. We emphasised in the Material and Methods section the paramount importance of title (datum) integrity, and explain why tags for concept-domains (and methods-domain) were not used in this analysis: this would amount to introducing a prior interpretation, and possibly a bias in the very data to be analysed before their processing.
The reasons why such concept-domain terms as “biotechnology”, “precision agriculture” and “digital tools”, which one might expect to see highlighted, are omitted are three-fold: (1) they are recent and possibly not strongly represented in the sample of 35,000 theses over 80 years; (2) they may not be, in relative terms, frequent; and (3) the set of terms to which these concept-domain terms refer to is so wide and diffuse, that they cannot easily be defined.
Then again, to take one example only, “Biotechnology” (had the concept-domain been created), for example, is strongly present and shared (Table 2) in clusters 2 (genetics), 3 (plant health) and 4 (animal sciences); and the “Biotechnology” term-domain is heavily represented by individual terms (frequencies) such as genetic (2126), molecular (1509), resistance (1354) and biochemical (903), among the 50 most frequently used terms. Furthermore, Figure 4(a) and 4(b) show the very large inertia of terms such as: “tolerance”, “genetic”, “marker”, “trait”, “molecular”, “gene”, “biochemical”, “resistance”, “expression”, “protein” or “profile” – all terms which, to varying degree, may be related to “Biotechnology”. This reasoning is very close to the one used earlier for the rapidly expanding disciplinary field of genetic engineering, biology and biotechnology (GEBB).
GEBB in India and presumably anywhere else represents one of the major moves within the agricultural sciences: it is very strong, but pervasive, therefore shared, and so, unobtrusive. It constitutes a good example of a technology-driven, rapidly growing, field of science: on the one hand, the field uses a large number of specific words (method-terms) which have rapid turnover (low mass, low inertia) as a technology replaces another, and on the other hand, it always is associated with a limited number of object- and concept-terms respectively reflecting the subject and the purpose of research. These object- and concept-terms are not specific to the field, because these objects and concepts belong to other fields. GEBB is an illustration of the difference between science and technology.
Climate change
Strangely, climate and climate change seem poorly addressed, from what is visible in ICAR's PhD database (only 120 PhD thesis titles out of the total surveyed include the phrase “climate change”); and “climate change” does not appear to have a measurable inertia in Figure 4. For the reasons discussed in the previous paragraph and in Materials and Methods, caution is required in interpreting this observation. Nevertheless, it appears that climate change as a research theme is under-represented in the ICAR database. If so, strong priority should be given to the subject.
We know far too little, for instance, on the impacts of climate change on the soil and plant microbiota, the symbionts, the endophytes, and all the micro-organisms (the phytobiome) that contribute to microbial balance on and in root and foliage tissues (e.g. Khatibi et al., 2024). Research on the interaction between abiotic stresses and plant pathogens and pests is under-invested, globally (e.g. Newton et al., 2011). Heat waves and water shortages also have dramatic consequences on farm animals, with massive impacts on livestock (e.g. Rojas-Downing et al., 2017). Climate adaptation research addressing animal husbandry and sustainable crop systems could mobilise all the disciplinary fields, from sociology and economics to the bio-physical fields. This would enhance interdisciplinary research, discoveries at the large to the molecular and gene scale, generating major benefits for Indian agriculture and society.
Of science impacts, the pressure of the short term, and the needs of the future
The word “management” thus occupies a quite visible position in this analysis. While relatively infrequent in the early phase of the analysed time-series, it rapidly increased by the 1970s, reached a maximum by 1980–90, and only slightly declined afterwards (Figure 1). The term “management” is the most frequent word in the 35,122 titles surveyed (figure in Supplemental Material S4.1); and it occupies a central position in the correspondence graphs of Figures 4(a) and 4(b), indicating its being shared by all theme-clusters identified in this work. Its mass is the largest, yet its inertia is negligible.
We offer three lines of thoughts to explain the central position of “management” in the landscape of India's words for agricultural research. One is that scientists want to be practical: they want science to have applications to address concrete problems. On this line of thought, the need for solutions dominates that of understanding. The term “management” comes from economics, and so, a second line of thought belongs to the Homo economicus, implying utilitarian benefits. These benefits, we assume, are mostly in the short than in the long term. A third line of thoughts is based on the opposition between “management” and “control”. The former word refers to soft, progressive and possibly anticipated actions to operate systems, while the latter refers to strong, harsh, possibly brutal and blanket actions. Such actions, on complex systems where much feedback is at play, may lead to disasters. An example of the contrast “management” vs. “control” is the phrase “Integrated Pest Management” (IPM) created by the 1970s. IPM illustrates the response of the scientific community against the sole, unidirectional and pesticide-based control of crop pests and pathogens, leading to the abuse of the products of the chemical revolution of the late 19th and early 20th centuries, and the destruction of nature, as illustrated in Silent Spring (Carson, 1962).
PhDs represent the core of any research activity today: PhD dissertations are one main scientific output and a main basis for research publications. PhDs also constitute the foundation for the education of the future generation of scientists. A PhD is typically a short endeavour of about three years. To address in just three years the “management” of complex systems (such as agricultural systems, or some of their sub-systems), in which the time constant (De Wit and Goudriaan, 1974) may be one year (e.g. field production), decades (e.g. a herd or the chemical cycles of most elements), or successive human generations (e.g. in the evolution of rural communities), is very ambitious. If the question addressed, truly, concerns “management”, it thus appears that PhD titles constitute a quite ineffective entry point. Science takes time.
We might thus further consider, in general, that the instrument we chose has limitations anyway as a pointer for investigating patterns of research, which necessarily requires much longer periods of time. This criticism may be countered by the fact that many PhD subjects, however, are addressed in the present study; that a research department does not usually engage PhDs randomly, but rather, as part of an overall strategy with several successive or complementary PhD projects; and that research departments usually conform to institutional frameworks generated by universities, institutes and government at different scales. These reasons may compensate for the inherent time-limitation of using PhDs as markers for analysing patterns of science and research over time.
Conclusions
The present study provides a description of the quantitative output of Indian agricultural research in terms of PhD theses defended from about 1947 till 2023 (Supplemental Material S4.1). It enables ranking keywords in research (Supplemental Material S4.2), shows the evolving pattern of importance of disciplinary fields (Supplemental Material S4.3) and individual terms (Supplemental Material S4.4). Analysis leads to identifying five theme-clusters in Indian agricultural research over the period studied: (Figure 2; Table 2): “Agronomy”, “Genetics”, “Plant health”, “Animal sciences” and “Social sciences”. The evolution in importance of these theme-clusters is described (Figure 3). Correspondence analysis allows exploring and quantifying the multidimensional linkages among theme-clusters (Figure 4(a) and 4(b)), and the weight of terms and years in the observed patterns of associations (Supplemental Material S4.4). These patterns of associations are examined at three phases in the evolution of India's agricultural research (Supplemental Material S4.5), and the importance over time of some terms is examined in particular (Supplemental Material S4.6).
This work shows how non-parametric multivariate statistical methods can be useful to explore large qualitative data sets. These methods are designed to respect the inherent qualitative nature of the original data while generating both quantitative outputs and graphical visualisations.
Our results show how stable disciplinary fields have been over a period of about 80 years in India. Yet, a fairly strong dynamics in the words of science in Indian agricultural research is found; however, cluster analysis leads to show that research theme-clusters, too, have been quite stable. Such stability, we believe, creates the proper environment for long-term investigation which is essential in science, as plant genetics and breeding or animal husbandry for instance illustrate. Such stability, we also believe, is a fundamental reason to explain the overall success of India's agriculture today.
Our results further stress a series of points, including the following: (1) there has been a consistently high level of research on fruits and vegetable in India, on par with major staple such as rice and wheat, even at the heights of the Green Revolution; (2) extension and research on extension are very much alive in India, which hosts the largest public advisory system in the world; and (3) there have been, very early in the period studied, concerns about the limitations and dangers of pesticide use in India, where research on bio-control thrives.
The analysis also points at the need for a balance between the science that enables understanding, which leads to excellence, and implies the long-term and the short-term science that leads to addressing current issues, which leads to scientific applications; the latter is illustrated in the analysis by the term “management”, which has become omnipresent in the last decades. Yet current challenges are dominated by the consequences of climate change on Indian agriculture and the absolute necessity to better understand the many, multi-scale, impacts of climate change, and to engage research to adapt agriculture to climate change. This implies long-term commitment, of which we find little trace in the present analysis.
Such a large analysis inevitably would invite one to phrase recommendations. We consider doing this with caution, bearing in mind that in dealing with PhDs one deals with education-for-research as well as research itself. Framing recommendations would require some measure of impact, one of them being scientific publications, which unavoidably would create assessment pitfalls. A PhD student involved in animal or plant breeding, in an agronomic long-term experiment (30 years or more of field work), or again, in a long-term social science survey (India has many such underway), will not necessarily publish results in a major scientific journal immediately, will always publish with others, or perhaps not publish in formal science journals at all. Such research contributes to long-term, often vital, efforts, seamlessly feeding common goods: food security, sustainable agriculture, environmental protection, the progressive resolution of gender injustice or the reduction of poverty. Contributing to these common goods is what agricultural research is supposed to do everywhere in the world, including India. Quantifying the economic, social and environmental benefits generated by long-term science, by major but slow contributions to science, is extremely hard. Long-term science thus does not shine. It is extraordinarily vulnerable in a world of perpetual competition for funding and where research is Taylor-ised (Taylor, 1911).
Our analysis offers a description. This description does suggest that a good balance has been maintained over the years between major staple (e.g., rice and wheat) with other grain staples, and crucially, with nutrient-dense food crops such as fruits and vegetables. It also suggests that far too little is done with respect to climate change impacts and climate change adaptation in agriculture. On such research depends the ability to provide food for India, the largest population in the world.
Supplemental Material
sj-docx-1-oag-10.1177_00307270251321175 - Supplemental material for An analysis of the landscape of agricultural research in India: The database of PhDs of the Indian Council of Agricultural Research, 1947–2023
Supplemental material, sj-docx-1-oag-10.1177_00307270251321175 for An analysis of the landscape of agricultural research in India: The database of PhDs of the Indian Council of Agricultural Research, 1947–2023 by RC Agrawal, Amrender Kumar and Serge Savary in Outlook on Agriculture
Footnotes
Acknowledgements
The authors gratefully acknowledge the support of Dr. Laetitia Willocquet, INRAe France, in undertaking analyses with the IRaMuTeQ software.
Data availability
Data involved in this study may be made available upon reasonable request to the corresponding author.
Declaration of conflicting interests
The authors declared no potential conflicts of interest with respect to the research, authorship, and/or publication of this article.
Funding
The authors received no financial support for the research, authorship, and/or publication of this article.
Supplemental material
Supplemental material for this article is available online.
References
Supplementary Material
Please find the following supplemental material available below.
For Open Access articles published under a Creative Commons License, all supplemental material carries the same license as the article it is associated with.
For non-Open Access articles published, all supplemental material carries a non-exclusive license, and permission requests for re-use of supplemental material or any part of supplemental material shall be sent directly to the copyright owner as specified in the copyright notice associated with the article.