
Abstract
Productive global agriculture is under a convergence of pressures, and particularly climate change and population growth. The impact is especially stark in East Africa where crop production is mostly rain-fed and population growth rates are among the highest in the world. Our objective for this study was to understand how climate change and population growth have impacted the size of agropastoral areas across Kenya over 40 years. Climate-suitable areas for all primary crops decreased 28% over the study period. Climate-suitable areas for primary crops increased 3% in highly productive counties, decreased 25% in moderately productive counties, and decreased 62% in low productive counties. Climate-suitable areas over the study period decreased 13% for ranching areas, 21% for dairying areas, 24% for mixed crop and ranching areas, and 28% for mixed crop and dairying areas, while climate-suitable areas for pastoralism increased 12%. Population across Kenya more than tripled over the study period, while population relative to climate-suitable areas for crops increased nearly fourfold, and population relative to climate-suitable areas for pastoralism nearly tripled. Population relative to available climate-suitable areas for crops more than doubled in highly productive counties, increased more than four-fold in moderately productive counties, and was nearly 15 times higher in low productive counties. Examining the cumulative effects of climate change and population growth on agricultural sectors across Kenya can help to develop policies and strategies to reach the UN Sustainable Development Goals.
Introduction
Global productive agriculture is under a convergence of pressures, and particularly due to climate change and population growth (Dawson et al., 2016; Haile et al., 2020). Increased dryness and higher temperatures are driving reductions in primary productivity and changes in animal diets and feeding strategies and livestock productivity, while the increase in human population density is a major driver of change for a wide range of livestock production systems, including pastoral and agropastoral systems (Seré et al., 2020). These changes are also leading to new farming techniques with intensive management modes of modern agriculture and animal husbandry that place increasing demands on the natural resources (e.g. water) farmers need (Waage et al., 2022). Despite attempts to adapt to such changes there are marked declines in agricultural land suitability (due to climate) and availability (due to population growth: Venter et al., 2016; Zhang and Cai, 2011), for both crop and livestock production (Henry et al., 2019), which are leading causes of severe food crises (Molotoks et al., 2021) and are strongly linked to food and agricultural livelihood insecurity (Nidumolu et al., 2022; Stavi et al., 2021). The declines are especially concerning because global hunger is on the rise, returning to levels prior to 2010 (Molotoks et al., 2021), with global food demand estimated to rise more than 70% between 2005 and 2050 (Roche, 2021). Furthermore, agricultural livelihoods comprise 40% of the world's population and contribute to roughly 30% of economic activity in low-income countries (Ramankutty et al., 2018).
In East Africa, climate change impacts agricultural suitability (Gelorini and Verschuren, 2013; Marchant et al., 2018) because rain-fed agriculture accounts for approximately 96% of overall crop production (Dawson et al., 2016) and changes in weather patterns and increasing water scarcity negatively impact cropland yields and productivity (Chemura et al., 2020; Fitton et al., 2019). As a result, farmers in this region of Africa have relied on the integration of crop and pastoral livestock production with ecosystem-based adaptive management practices to optimize resources and reduce risk and vulnerability (Dixon et al., 2019). Also, agropastoralism is highly complex and involves diversifying species, crop varieties, and livestock breeds in the agroecosystem over time and space—including integrating crops, trees, and livestock at the field and wider landscape levels (Pimbert et al., 2021). However, East Africa, including the Horn of Africa is considered one of the most vulnerable regions to the impacts of climate change (Serdeczny et al., 2017). Further, agropastoralists who depend on both livestock keeping and rain-fed crop production are considered the most vulnerable groups to climate change (Henry et al., 2019). Concurrently, population growth rates in East Africa are among the highest in the world, creating increasing pressure for land conversion, and specifically for the expansion of cropland (Bullock et al., 2021). However, the majority of food in East Africa is produced on farms with low productivity, stagnating crop yields due to nutrient-depleted soils, and small farm sizes (Brandt et al., 2020). Also, landscape degradation due to soil erosion (Wynants et al., 2019) and agriculture, specifically monocropping, that is culminating in the reduction of native vegetation and biodiversity loss is notable in most East African countries due to the pressure of population growth (Rukundo et al., 2018) and cultivatable land is now scarce due to dense population patterns (Nakawuka et al., 2018). Such a situation also results in broader implications for ecological systems and natural resources (Venter et al., 2016), such as affecting species interactions (Shi et al., 2020) and declines in native plant and wildlife populations (Maitima et al., 2009).
Despite the importance of climate change data to land-use assessments, there has been a limited inclusion of such data in the application of agricultural suitability analysis (Akpoti et al., 2019). Further, studies undertaken on the agricultural impacts of climate change in Africa have often been done on a broader regional basis (Nidumolu et al., 2022), with less attention on country-specific studies that can provide detailed assessment and evidence of climate change impacts on agricultural suitability (Kogo et al., 2021; Mumo et al., 2021; Peter et al., 2020). Further still, country-specific studies in East Africa have not examined the combined impacts of climate change and population growth on the suitability and availability of agricultural areas, respectively.
Agricultural suitability is often based on the Food and Agricultural Organization guidelines (FAO, 1976), where suitability is defined as a function of crop requirements with five physical control factors of rainfall, temperature, slope percentage, soil types, and the distribution of groundwater wells (AL-Taani et al., 2021). However, the primary climate-related aspects that drive changes to agricultural suitability are variability in temperature and precipitation (Kogo et al., 2021). Agro-climatic suitability models are simplified crop models that include primarily temperature and precipitation data to assess agricultural suitability (Akpoti et al., 2019). Particularly, agro-climatic zones (ACZs), the delineation of landscapes into regions with relatively homogeneous and contiguous areas with similar climate characteristics (Boitt et al., 2014) can be a valuable approach to investigating changes in agricultural suitability. Historically, ACZs and the related broader approach of agro-ecological zones have been important to land-use assessments and natural resource management, and particularly for agricultural development (van Wart et al., 2013) and conservation (Habel et al., 2016). ACZs were first developed in the 1970s (Agrell et al., 2004), published in A Framework for Land Evaluation (FAO, 1976), and have since been utilized in land-use assessments worldwide, such as in Bangladesh, China, Mozambique, Nepal, Nigeria, the Philippines, and Thailand (Agrell et al., 2004). Further, ACZs can be an important analytical framework to assess progress toward United Nations Sustainable Development Goals (UN SDGs) at a country-specific level, especially under the combined pressures of climate change and population growth.
Our objective for this study was to understand how climate change and human population growth have respectively impacted the climatic suitability and availability of agropastoral areas across Kenya between 1980 and 2020. Focusing our study on Kenya was important because agriculture is central to the country's economy, comprising one-third of its GDP and employing more than half its labor force (Nechifor et al., 2021). Moreover, Kenya is a key food-producing country (accounting for 65% of its exports) for the East African region and a key player in regional food security (Eichsteller et al., 2022). However, rangelands in Kenya are spreading, increasingly unable to support rain-fed agriculture (Maoncha et al., 2022), suffer from a severe lack of agricultural inputs, and the country ranked 84th out of 107 in terms of food security, with hunger levels defined as serious (Ni et al., 2022). Further, the dominant source of crop production in most Kenyan communities is rain-fed farming and agropastoral activities, which are organized according to ACZs (Kogo et al., 2021). Therefore, our research questions were: (1) how has climatic suitability for primary crop, livestock, and mixed-farming systems changed over time across Kenya; (2) how have climate-suitable areas for crops changed in counties with potentially low, moderate, and high productivity; and (3) how has the availability of climate-suitable crop and pastoral areas changed due to population growth and geographical shifts in population patterns? To answer these questions, we first created agro-climatic suitability maps representing areas that reflect the specific temperature, precipitation, and ACZ requirements for primary crops and livestock in 1980, 2000, and 2020. Next, we overlaid the agro-climatic suitability maps of primary crops with the county-level crop productivity map and extracted the suitable areas according to high, moderate, and low productive counties. Finally, we overlaid population density on climate-suitable areas for primary crops and livestock and assessed the population density relative to climate-suitable areas according to high, moderate, and low county productivity of crops.
Material and methods
Study site: Kenya
Located in East Africa, Kenya lies on latitude 5°S-5°N and longitude 34°E-42°E (Kogo et al., 2019) and comprises approximately 583,000 km2 (Kogo et al., 2021) that is divided among the 47 counties, established by the 2010 Kenyan constitution. Kenya's lands are categorized as predominately arid or semi-arid with only 15% suitable for agricultural production and roughly 80% being rangelands for the roughly 48 million human population (Koeva et al., 2020). Thus, agricultural livelihoods in Kenya rely on the integration of crop and pastoral livestock production with ecosystem-based adaptive management practices that optimize resources and reduce risk and vulnerability (Dixon et al., 2019). The smallholder agroecosystems fundamentally contribute to biodiversity across Kenya (Mburu et al., 2016), which is especially important because there is ever less biological capacity of ecosystems remaining within the country to enable biodiversity to persist (Raven and Wackernagel, 2020).
Primary crop production in Kenya comprises maize, wheat, rice, tea, coffee, sugarcane, sisal, and cotton (KNBS, 1980, 2000, 2020), mostly grown in Kenya's southwest region (Figure 1). Maize is the main staple food crop, primarily consumed at household levels (Jayne et al., 2008). Wheat is the second most important cereal grain with an average of 300,000 metric tons produced annually (Gitau et al., 2010). Rice is another important staple food across Kenya and is almost entirely grown under irrigation (Recha, 2019). Tea is Kenya's principal agricultural sub-sector, while coffee is regarded as the fourth leading foreign exchange earner after tourism, tea, and horticulture (Recha, 2019). Sugarcane is another main source of livelihood to cultivating farmers and is among the top commercial crops grown in Kenya (Mati and Thomas, 2019). Kenya has become the third largest producer of sisal in the world, while the cultivation of cotton has slowed substantially in the past decade (Recha, 2019).
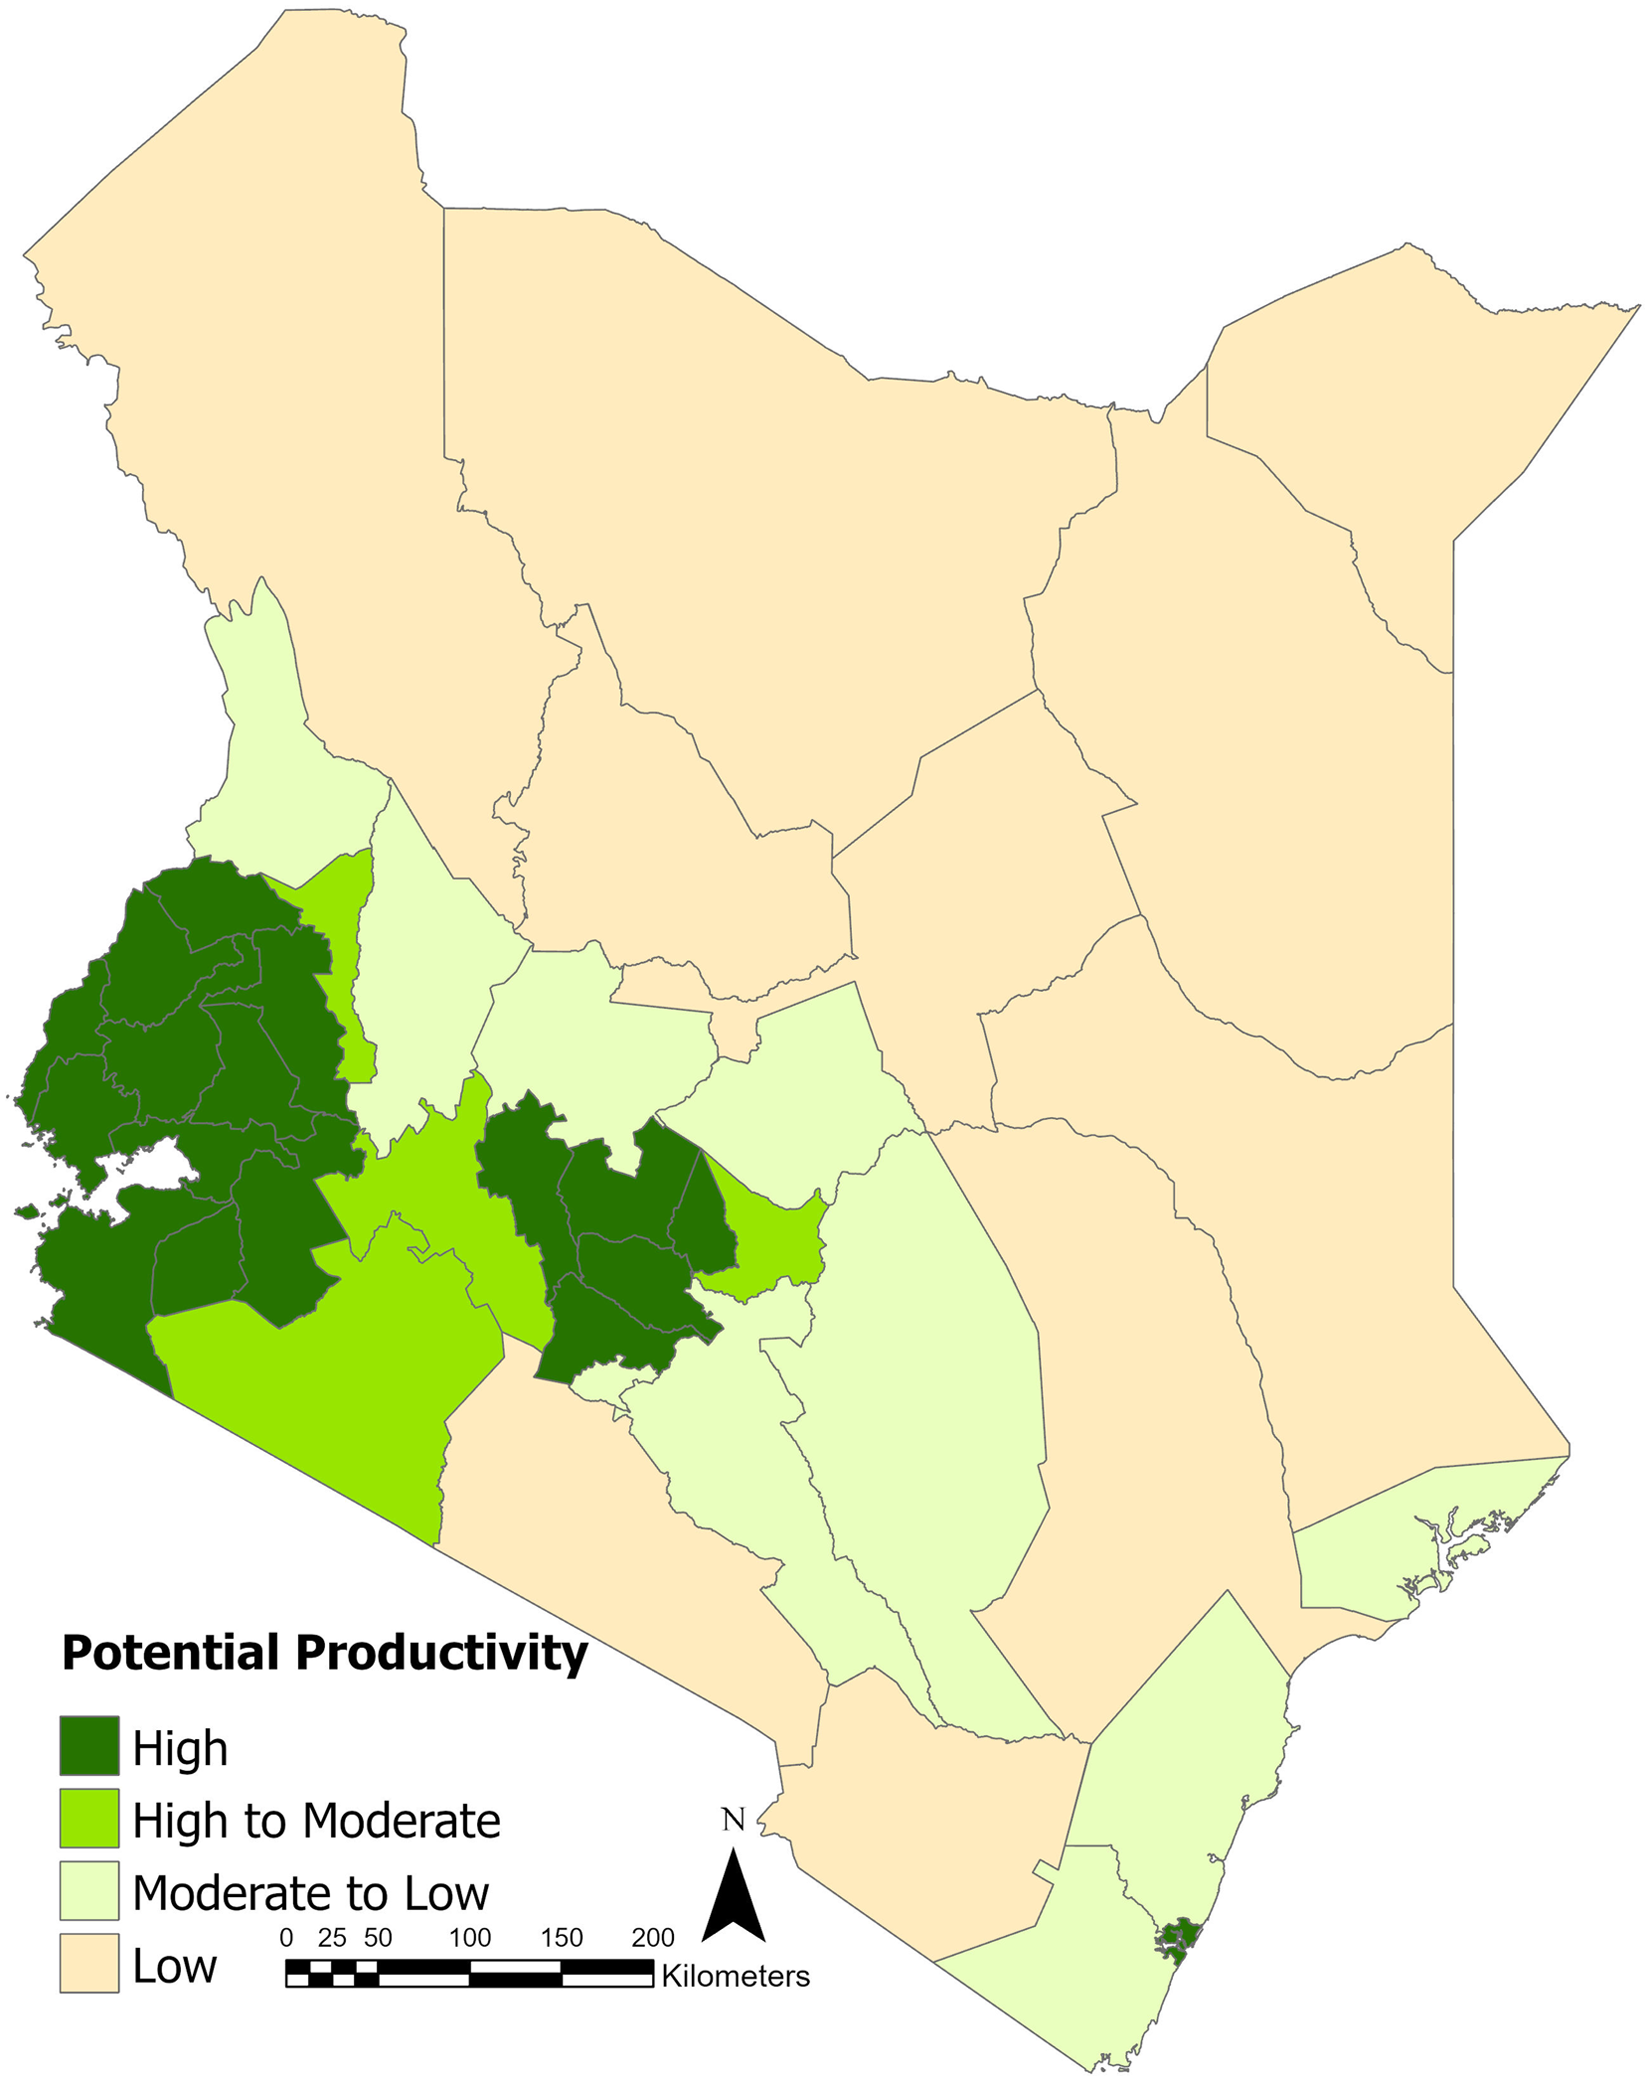
Potential productivity of primary crops grown in Kenya at the county level. Potential productivity in each county is reported in Statistical Abstracts of the Kenya National Bureau of Statistics.
Smallholder farmers dominate the livestock sector in Kenya, which is concentrated in the arid and semi-arid lands. There are three main livestock production systems across Kenya: pastoral, dairying, and ranching, as well as mixed crop and livestock farming (Cecchi et al., 2010). The single largest livestock sub-sector is dairy farming (Recha, 2019). Kenya is the leading milk producer in East Africa (Nyokabi et al., 2021), contributing approximately 40% of the livestock gross domestic product (GDP), 14% of the agricultural GDP, and 3.5% of the overall GDP in Kenya (Ajwang and Munyua, 2016). Smallholder dairy farmers produce about 75% of Kenya's total milk supply (Chepkoech, 2010), while milk consumption rates in Kenya are among the highest in sub-Saharan Africa (Nyokabi et al., 2021).
Climate change is a major threat to Kenyan farming systems with seasonal changes in precipitation and temperature of varying severity and duration that negatively affect crop production and food security to the already vulnerable communities in the arid and semi-arid areas (Kogo et al., 2021; Lawrence et al., 2023). Further, agricultural development and livelihood practices in Kenya are tightly linked to ACZs (Recha, 2019). Kenya is divided into roughly 40 ACZs, which were designated circa 1980 and documented by a report of Kenya's Ministry of Agriculture (Sombroek et al., 1982). Each ACZ comprises a moisture zone reflecting mean annual rainfall and overlapped with a temperature zone reflecting mean annual temperature for a total of seven moisture zones and nine temperature zones, as shown in Figure 2 (Gikonyo et al., 2018). Fundamentally, crop and livestock practices are linked to ACZ according to their specific temperature and precipitation requirements.
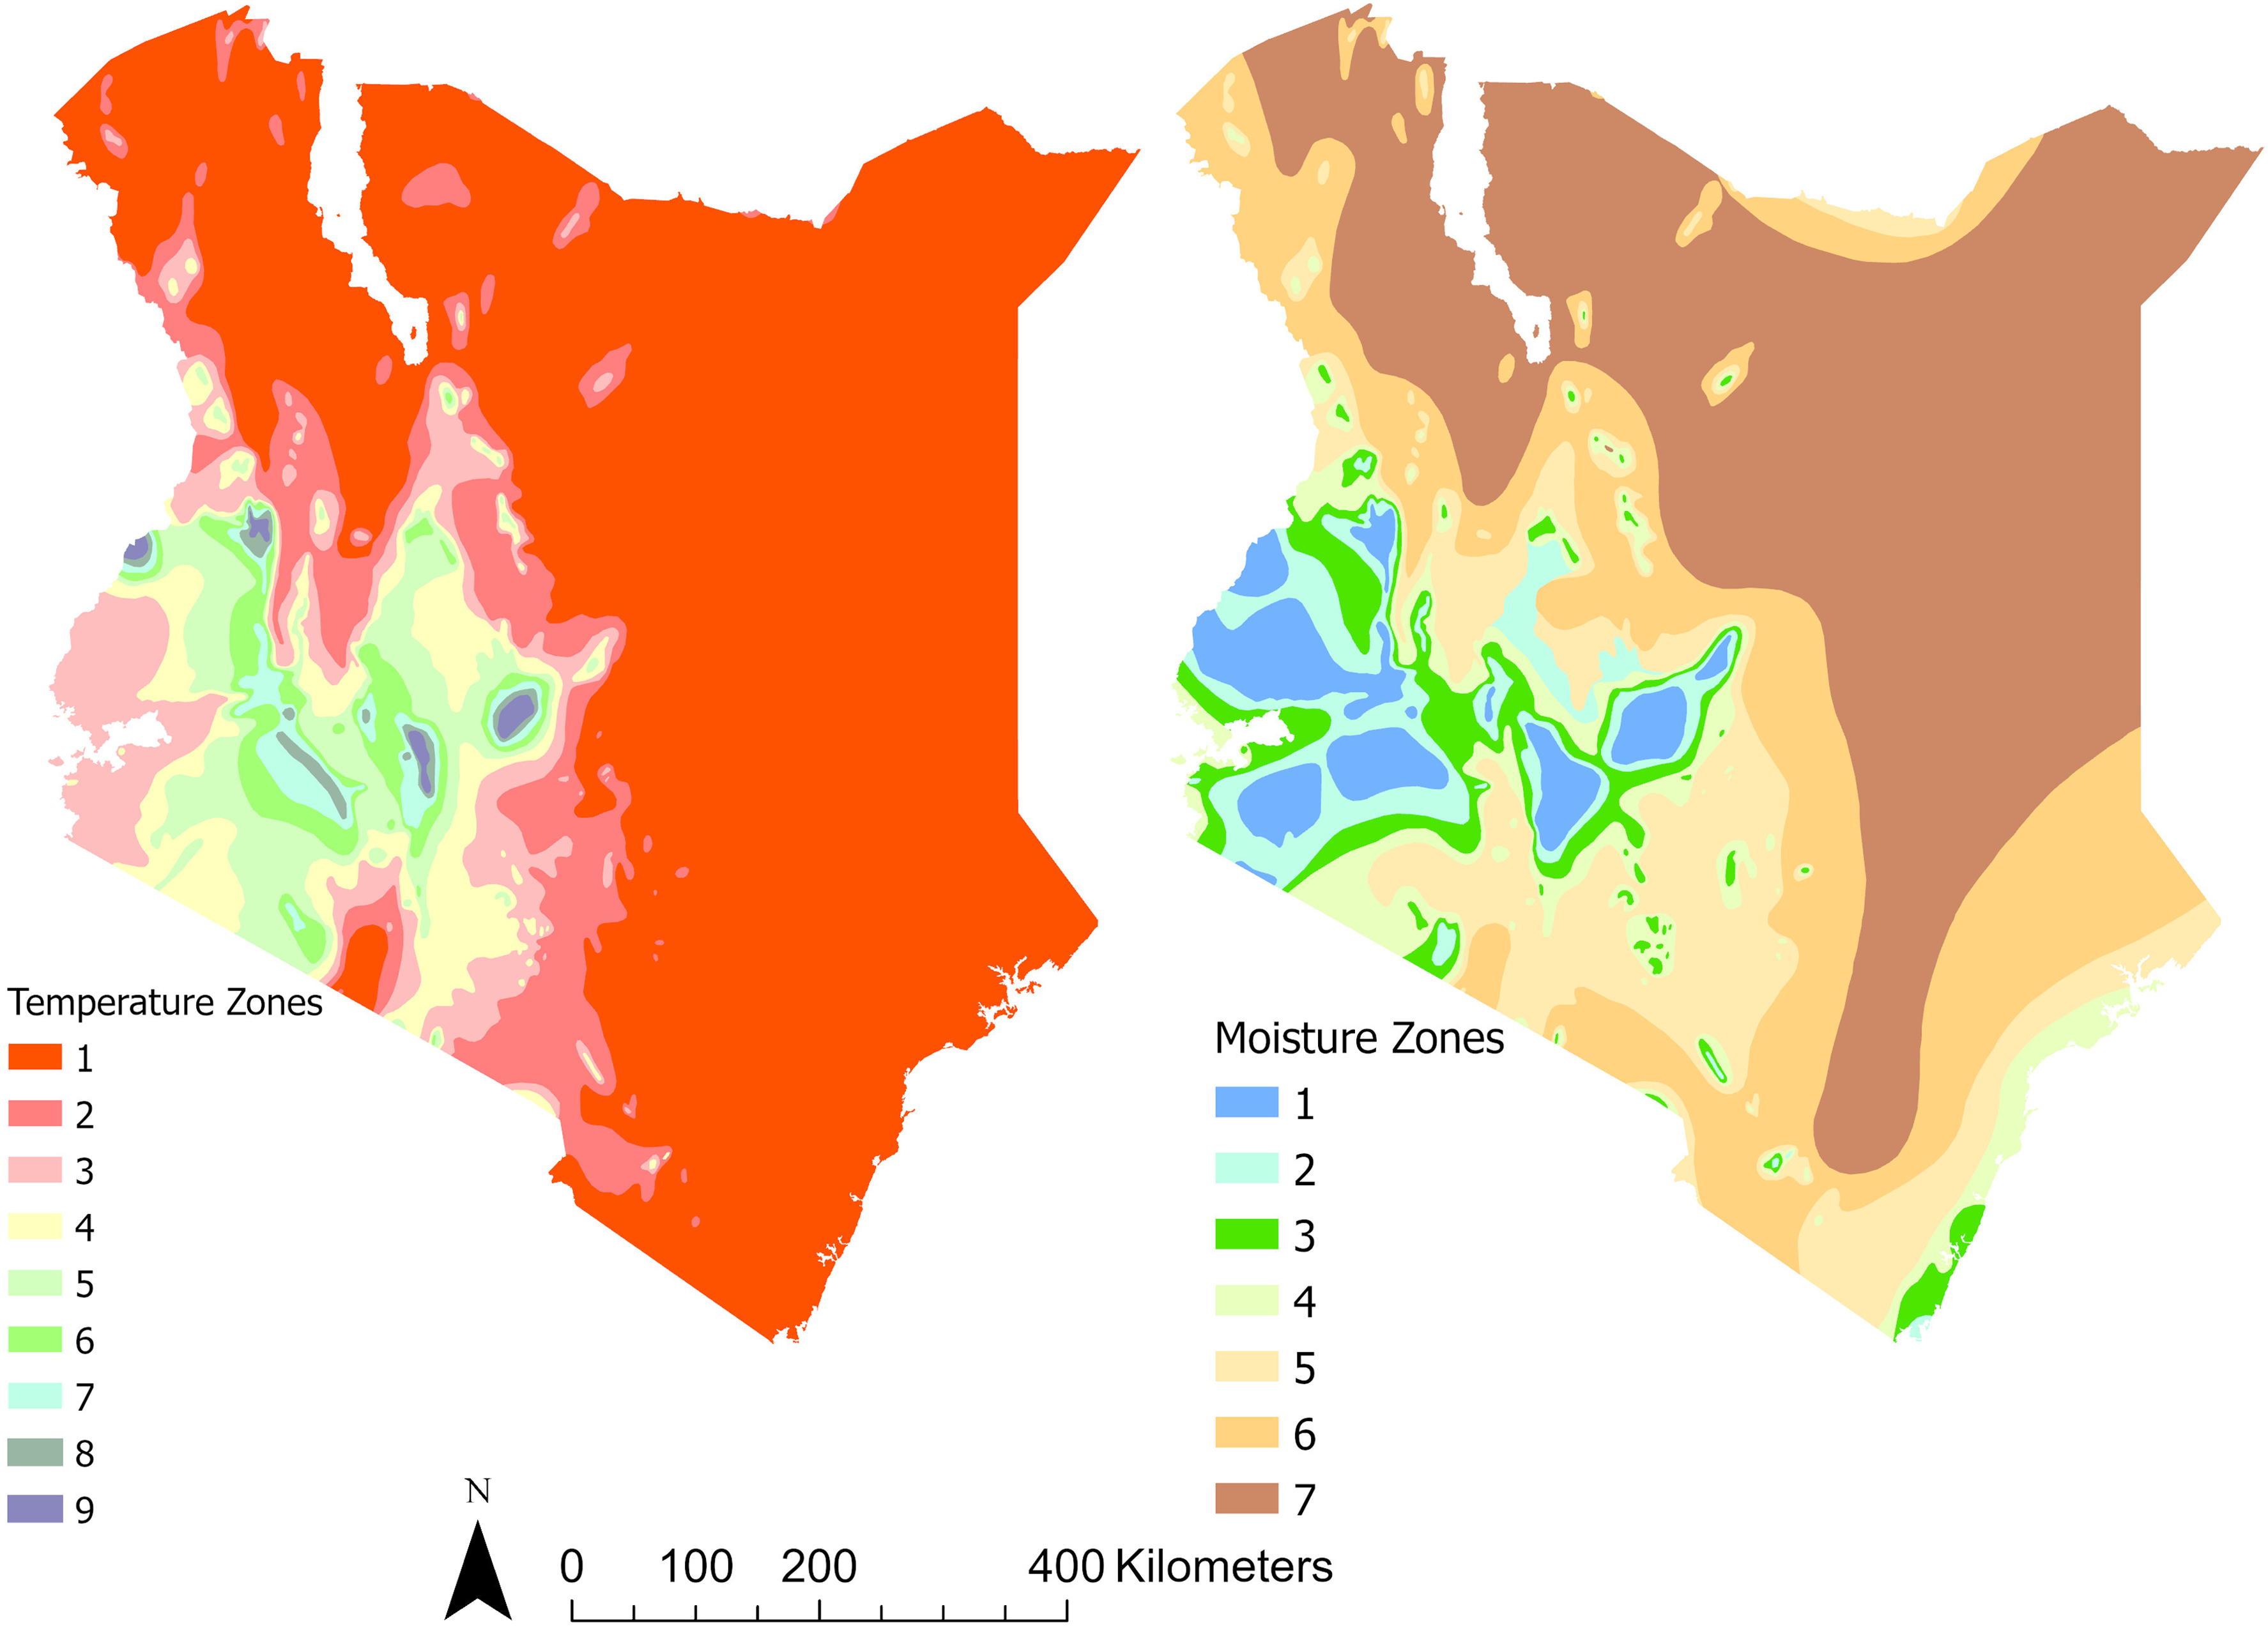
Kenya's agro-climatic zones (circa 1980). Kenya's agro-climatic zones consist of nine temperature zones (left) and seven moisture zones (right). Temperature zone 1 comprises average monthly temperatures above 25 °C, while zone 9 is below 10 °C. Moisture zone 1 comprises average monthly precipitation above 103 mm, while zone 7 is below 25 mm. The temperature and moisture zones combine to make total of 41 agro-climatic zones.
Data collection and description
Data utilized in this study included: (1) georeferenced average monthly temperature and precipitation across Kenya with a 5 km resolution during 1976–1980, 1996–2000, and 2016–2020 from the TerraClimate dataset (Abatzoglou et al., 2018), which was accessed through Google Earth Engine (GEE: Gorelick et al., 2017); (2) a digitized version of the georeferenced boundaries of the Kenyan ACZs that were documented in 1982, which was obtained from the IGAD Climate Prediction and Applications Centre Portal (ICPAC, 2022); (3) georeferenced boundaries of counties in Kenya circa 1980, 2000, and 2020; (4) temperature, precipitation, and ACZ requirements for crops, dairying, ranching, and pastoralism from Kenya's Ministry of Agriculture (Sombroek et al. 1982); and (5) Kenyan county-level agricultural and population censuses (KNBS, 1980, 2000, 2020). Our data collection and analysis focused on the years of 1980, 2000, and 2020 because the ACZs were established in 1980 and the 20-year increments were tractable time periods while also exhibiting changes in suitability and establishing a long-term trend.
Mapping temperature and precipitation patterns in Kenya
We created climate reference maps of Kenya for approximately 1980, 2000, and 2020 (Appendix A) in GEE using raster images representing precipitation patterns in each year and raster images representing temperature patterns in each year based on the TerraClimate dataset. Due to high inter-annual rainfall variability in Kenya, the raster images representing precipitation patterns were created by calculating the median pixel values of monthly precipitation over the 4 years preceding and including 1980, 2000, and 2020. With little inter-annual variability in temperature, the raster images representing temperature patterns were created by calculating the median pixel values of monthly temperature within 1980, 2000, and 2020.
Assessing temperature and precipitation patterns within Kenya's ACZs
Using the 1980 climate reference maps (Appendix A) overlaid with the ACZs (Figure 2), we assessed temperature patterns within each temperature zone and precipitation patterns within each moisture zone of the Kenyan ACZs via ArcGIS Pro 2.9.2 (ESRI, 2022). Next, we assessed the distribution (mean and standard deviation) of temperature and precipitation within each respective temperature and moisture zone. We compared the distributions to similar information from the Sombroek et al. (1982) ACZ map and developed discrete average ranges of both climate variables within each zone to represent the temperature and precipitation zones (Appendix B: Lawrence et al., 2023).
Creating and assessing classified maps of temperature and precipitation zones
We created classified maps representing temperature and precipitation zones in 1980, 2000, and 2020. First, overlaying the agro-climatic temperature and moisture zones (Figure 2) on the 1980 climate (temperature and precipitation) reference maps (Appendix A), we sampled temperature and precipitation in 1980 across the full spatial extent of each zone following our previously designated ranges developed in the section “Assessing temperature and precipitation patterns within Kenya's ACZs” with at least the recommended minimum number of 50 samples per zone (Chuvieco, 2016), and each sample included multiple pixels for both climate variables. Next, the samples were used to train three classification algorithms: maximum likelihood; support vector machine; and random forest in ArcGIS Pro 2.9.2 (Appendix C: Rana and Venkata Suryanarayana, 2020; ESRI, 2022). Specifically, the algorithms were trained to classify pixels into one of the nine temperature zones and one of the seven precipitation zones based on the training samples acquired within each climate zone of the 1980 climate reference maps. Applying each classification algorithm to the data from the 1980 climate reference maps, we then created classified maps of temperature and precipitation zones in 1980, similar to Figure 2. Thus, the output of the classification was a map of precipitation zones and a map of temperature zones in 1980.
Following the supervised classification process and based on Olofsson et al. (2014), we assessed each classification between the coarse-scale, multi-pixel model and the 1980 climate reference maps at a finer, pixel-level resolution, and excluded the training sample areas to measure the level of agreement using ArcGIS Pro and Python scripting in Google Colab. We designated 100 random assessment points for each zone because it is twice the recommended minimum number of training samples (50 per zone) to obtain a reliable estimation of error (Chuvieco 2016). We evaluated the assessments using error matrices, an overall assessment score, confidence intervals, and kappa statistic (Appendix D). Finally, and based on the assessment results, we applied the trained support vector machine algorithm to the 2000 and 2020 climate raster images to create classified maps of temperature and precipitation zones in those years (Appendix E: Lawrence et al., 2023). Assessments of the support vector machine algorithm's performance were also conducted on the 2000 and 2020 classified maps in comparison to the 2000 and 2020 climate reference maps.
Creating and assessing agro-climatic suitability maps
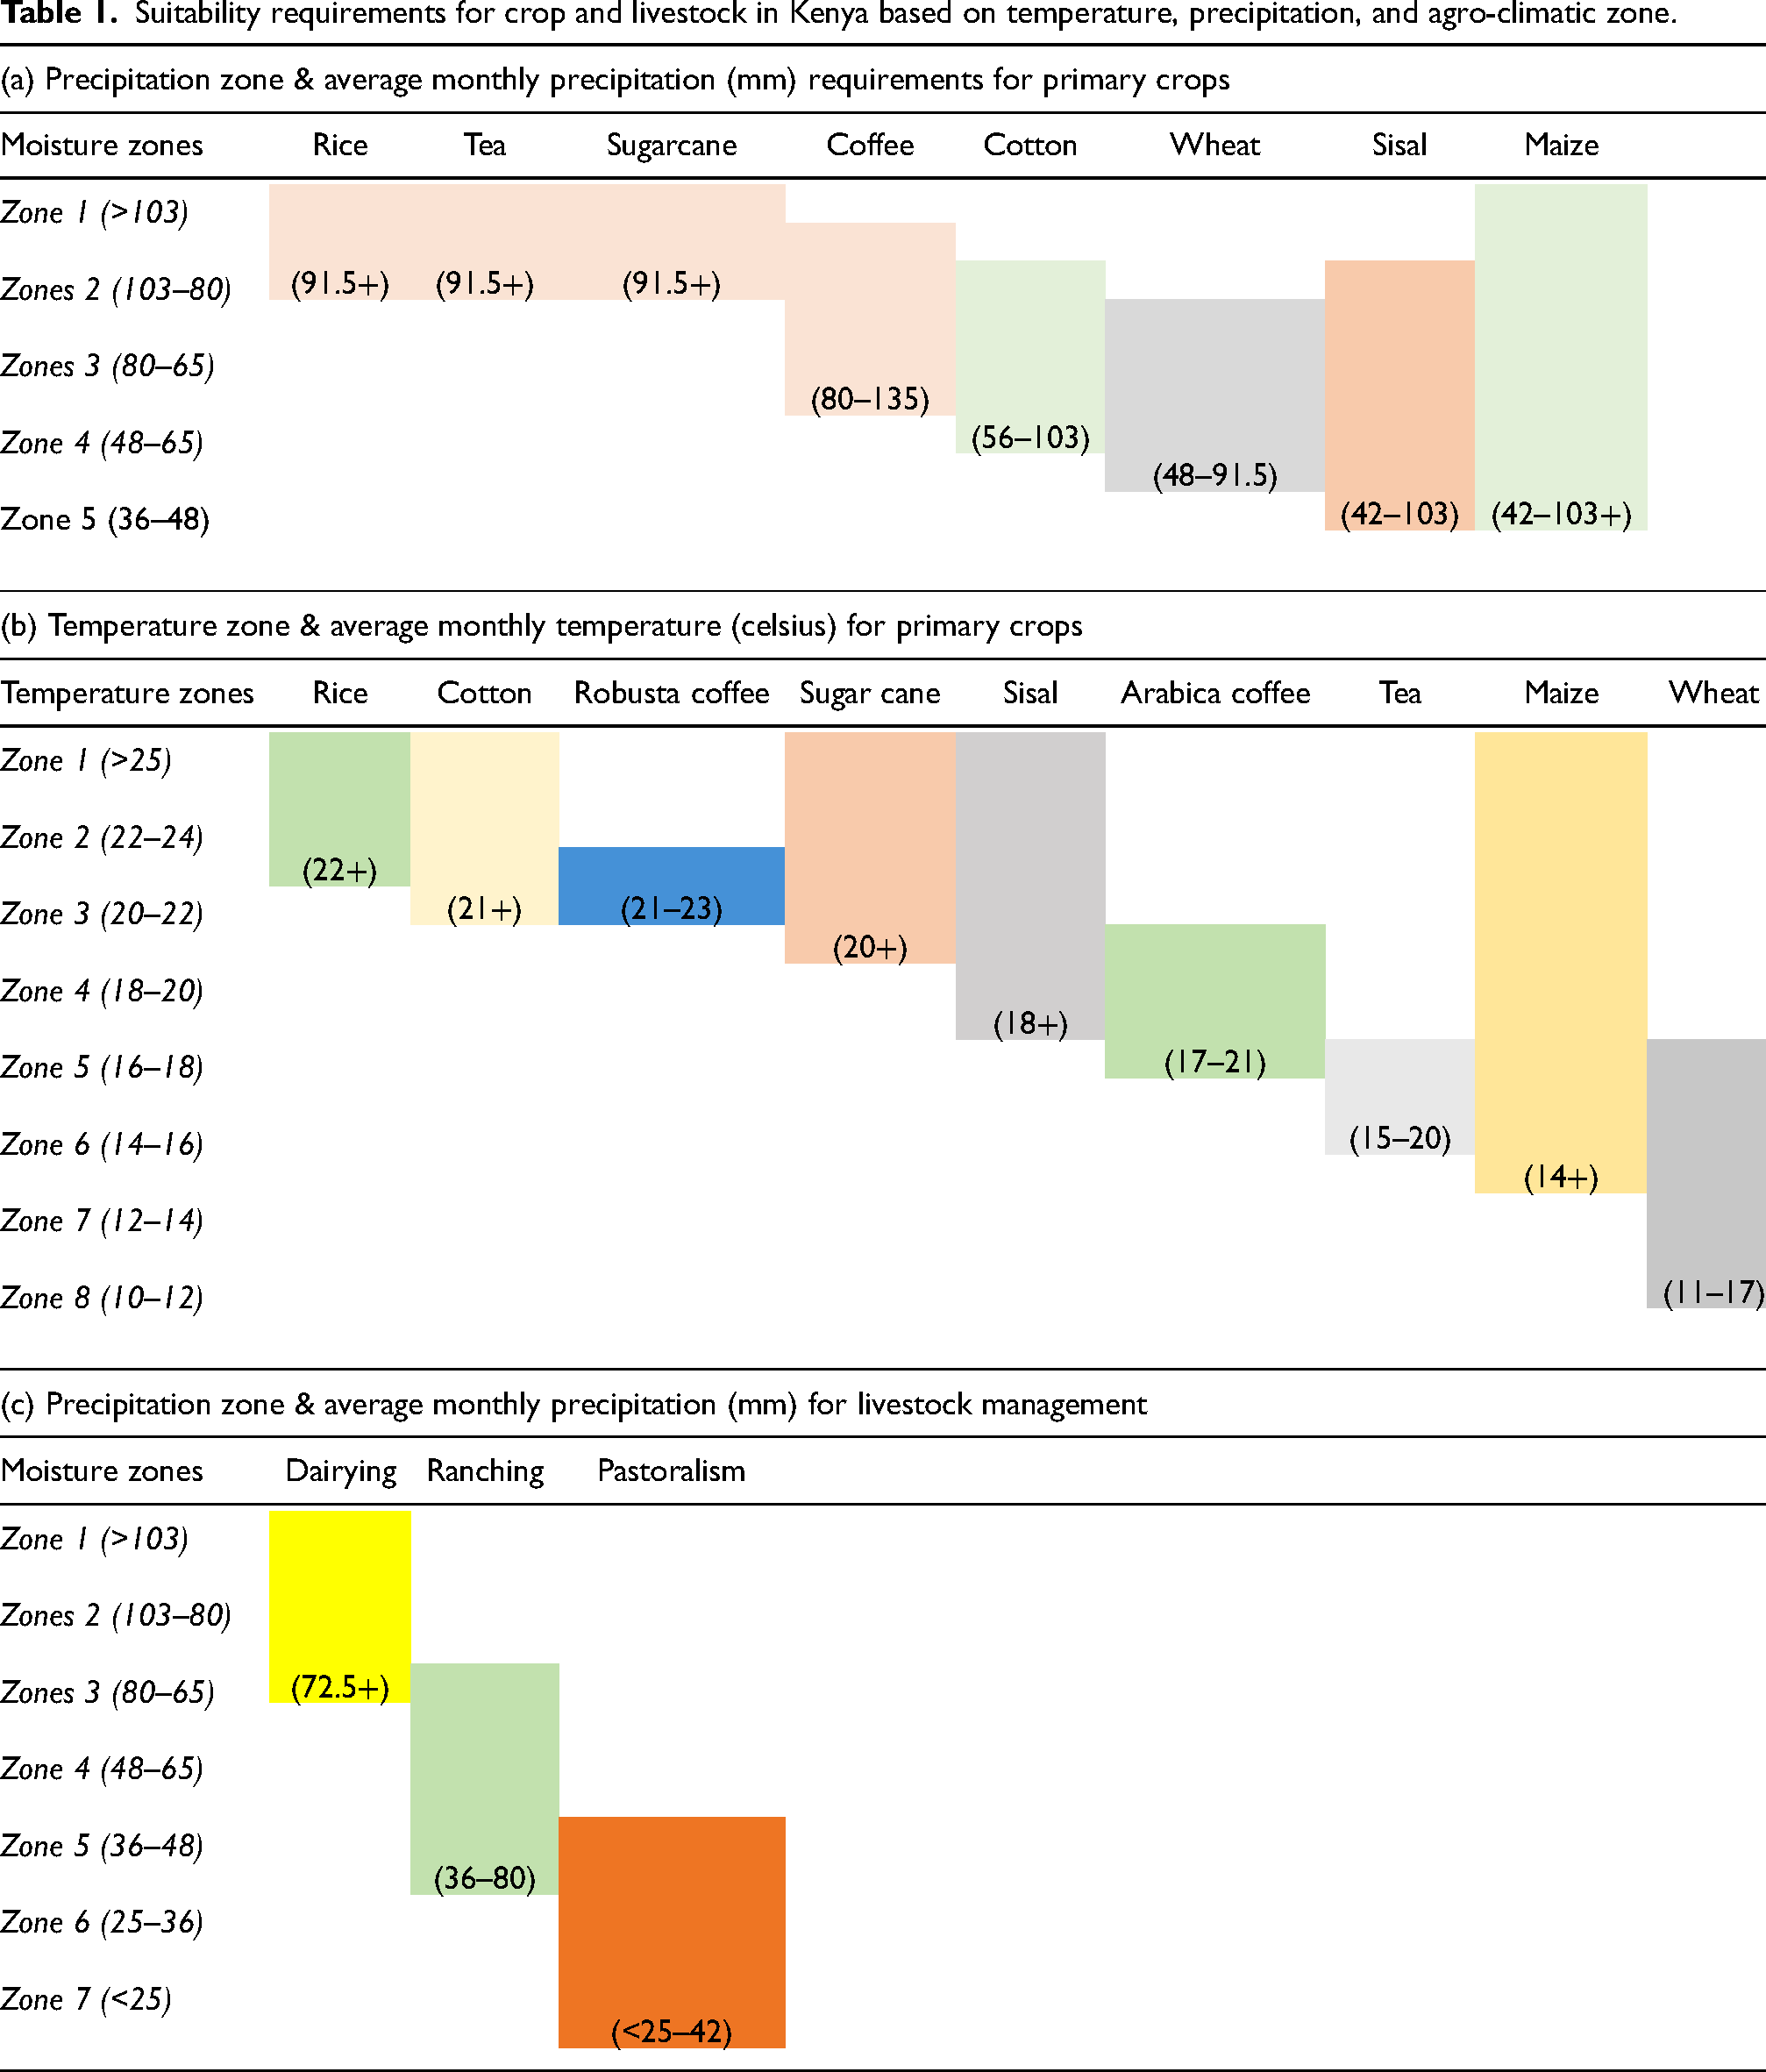
We created agro-climatic suitability maps representing areas that reflect the specific temperature, precipitation, and ACZ requirements for primary crops and livestock in 1980, 2000, and 2020 (Table 1). We extracted the geographic areas for each primary crop and livestock (Appendix F) from the classified temperature and precipitation zone maps in each year (Appendix E) based on: first, the temperature and precipitation requirements; second, the geographic overlap between temperature and precipitation requirements; and third, the geographic overlap of the ACZ requirement. Also, we overlapped the agro-climatic suitability maps of primary crops with the county-level crop productivity map (Figure 1) and extracted the suitable areas according to high, moderate, and low productive counties.
Suitability requirements for crop and livestock in Kenya based on temperature, precipitation, and agro-climatic zone.
Estimating changes to agropastoral suitability and availability over time
We demonstrate the geographic changes to areas of climatic suitability for primary crop and livestock over time. We conducted a comparison of the climatic suitability for primary crop and livestock to detect and estimate geographic shifts over time. Based on the agro-climatic suitability maps developed in the section “Creating and assessing agro-climatic suitability maps,” we calculated changes in the climatic suitability of all primary crops, pastoralism, dairying, ranching, mixed crop and dairying, and mixed crop and ranching. Absolute and percentage changes in the climatic suitability for each primary crop and livestock were calculated between 1980, 2000, and 2020. Also, we mapped and calculated the change in population density relative to climate-suitable areas for primary crops and livestock. Further, we calculated climate-suitable areas for primary crops and population per climate-suitable areas for primary crops according to high, moderate, and low county productivity of crops.
Results
Agro-climatic suitability shifted across Kenya throughout this study period. Particularly, climatic suitability of all primary cropland comprised 30% of Kenya in 1980 and decreased to 22% in 2020, while climatic suitability of pastoral land comprised 67% of the total area in 1980 and increased to 75% (Figure 3). Pastoral land expansion was primarily in the southeast region of Kenya along its coast. Little spatial change was exhibited in crop lands along the western region where crops have been predominately grown.
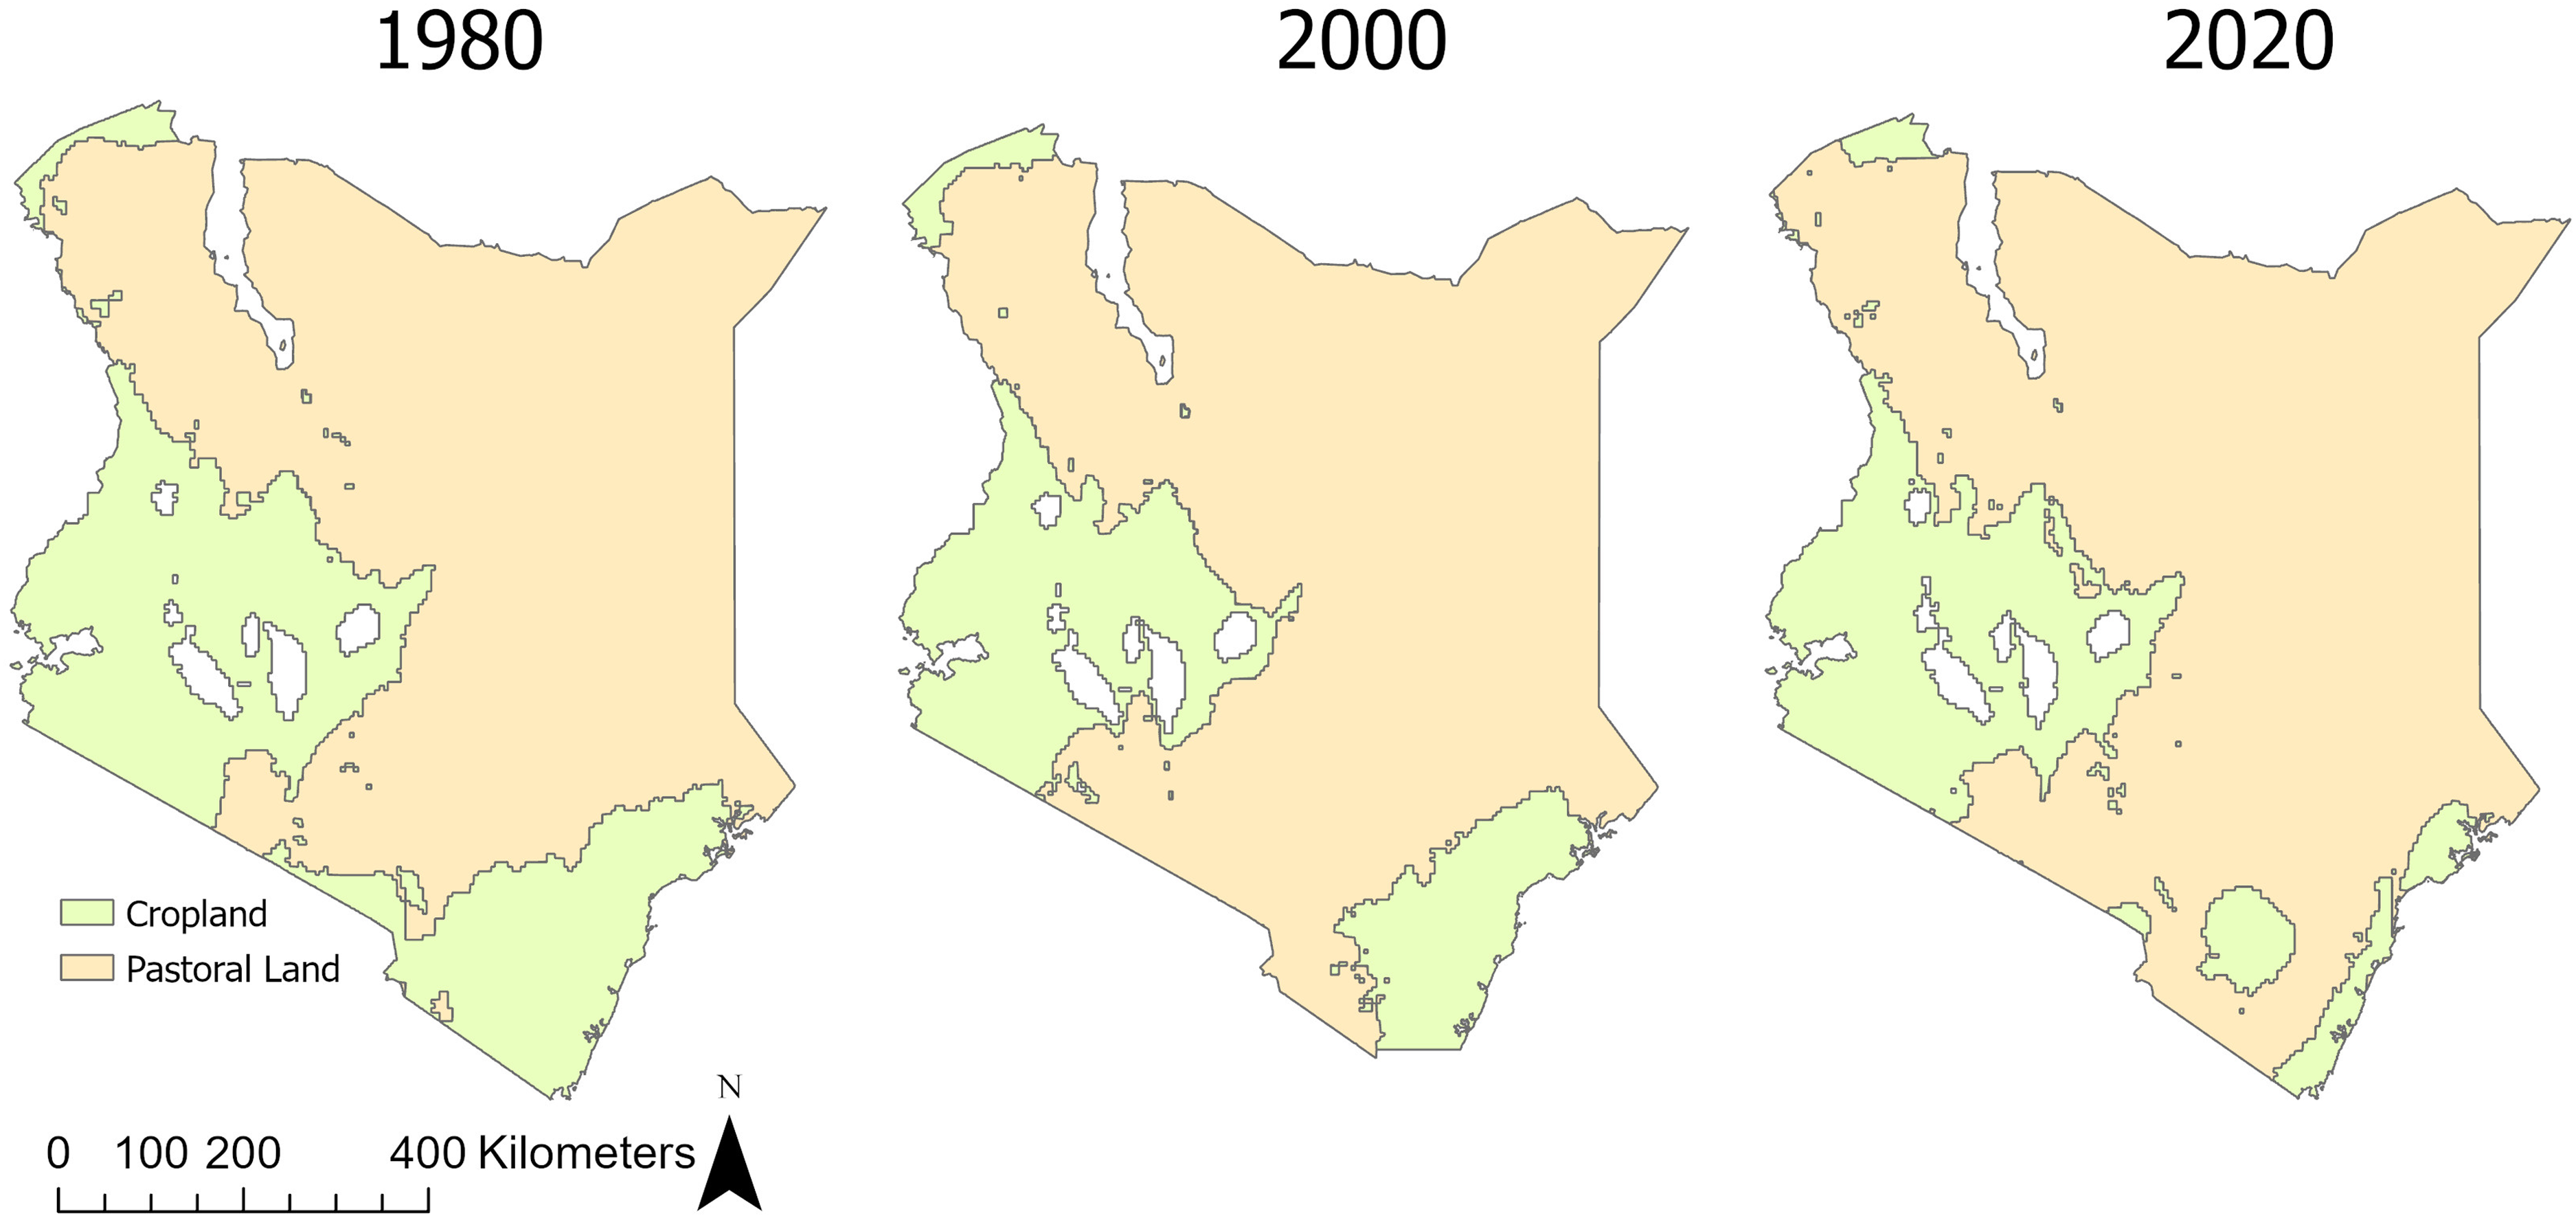
Climatic suitability of crop and pastoral lands in Kenya between 1980 and 2020. Shifts in climatic suitability, away from crop lands and to pastoral lands, are primarily exhibited in the most southern region of Kenya.
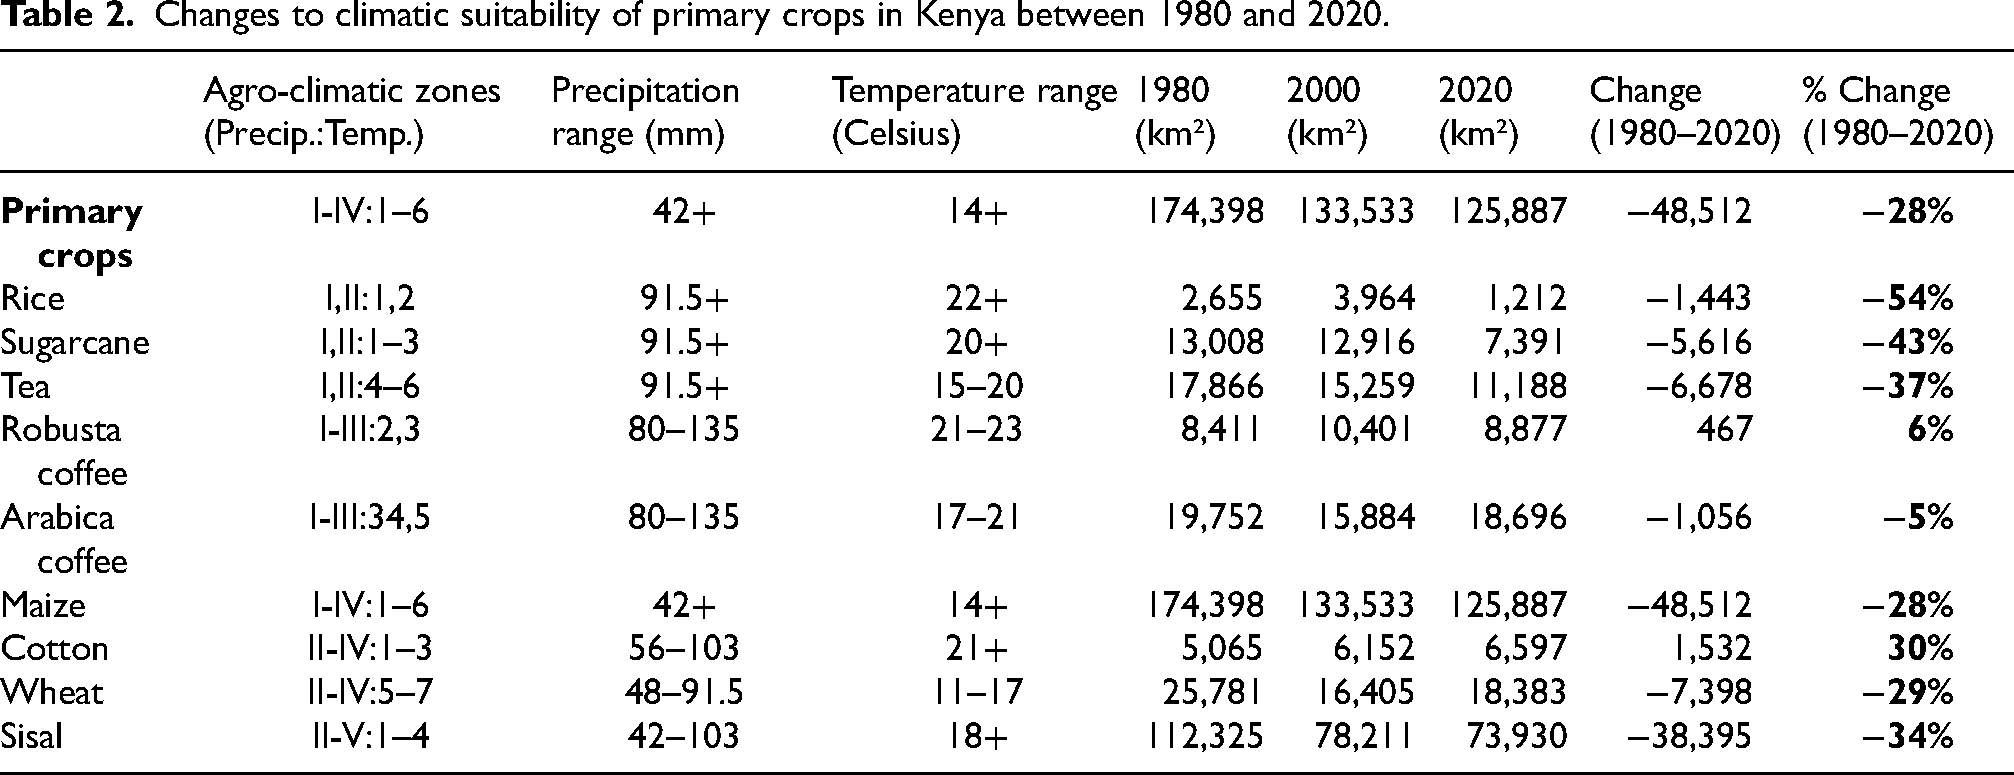
Climate-suitable areas for all primary crops decreased 28% between 1980 and 2020 (Figure 4) with the climate-suitable areas for seven of the nine primary crops decreasing between 5 and 54%. Rice exhibited the largest decrease (−54%) in climate-suitable areas followed by sugarcane (−43%), tea (−37%), sisal (−34%), wheat (−29%), maize (−28%), and Arabica coffee (−5%). Conversely, climate-suitable areas for Robusta coffee increased 6% and cotton increased 30%. Although rice exhibited the largest decrease, its spatial extent is the smallest among all the climate-suitable primary crop lands (Table 2). Specifically, climate-suitable areas for rice decreased 1443 km2; from 2655 km2 in 1980 to 1212 km2 in 2020. Climate-suitable areas for maize exhibited the largest change in total area (−48,512 km2), which was equivalent to the climatic suitability of all primary crops. Climate-suitable areas for sisal exhibited the second largest change in total area (−38,395 km2), followed by wheat, tea, sugarcane, cotton, rice, Arabica and Robusta coffee.
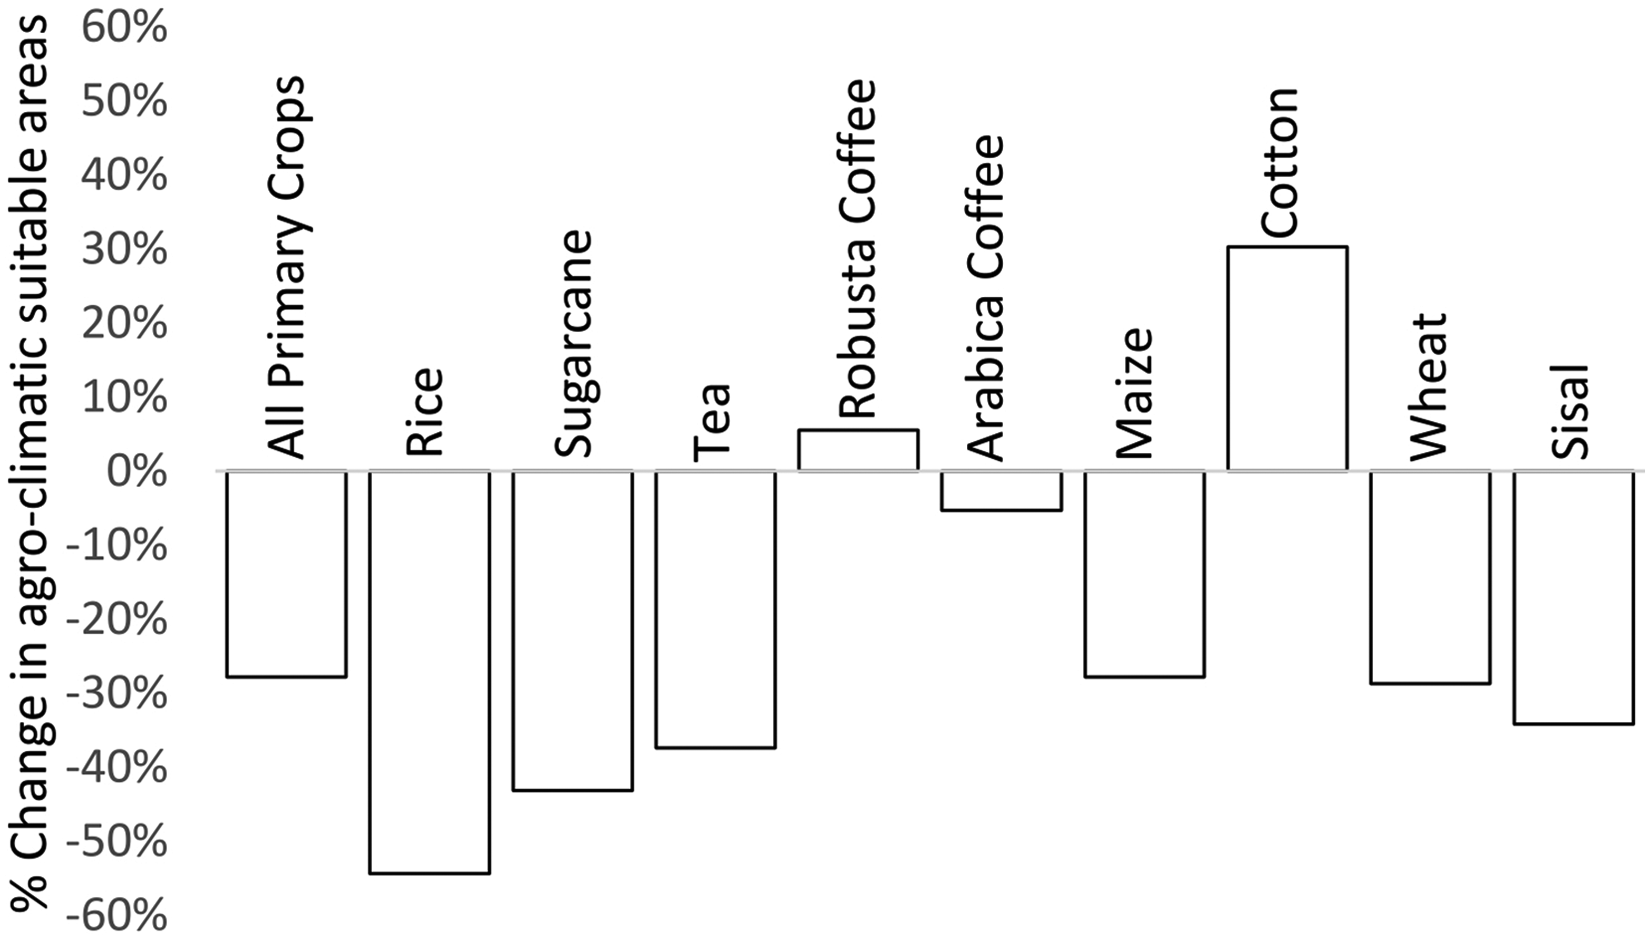
Percent change in climate-suitable areas of primary crops in Kenya between 1980 and 2020. The climate-suitable areas for all primary crops decreased nearly 30% with the climate-suitable areas for seven of the nine crops decreasing slightly over 50%. The climate-suitable areas for two crops increased up to 6% and 30%.
Changes to climatic suitability of primary crops in Kenya between 1980 and 2020.
Climate-suitable areas for primary crops in highly productive counties increased 3% (from 40,724 to 41,963 km2) over the study period, decreased 25% (from 89,095 to 66,954 km2) in moderately productive counties over the first 20 years and then remained relatively constant in 2020 (67,112 km2), and decreased 62% (from 44,579 to 16,812 km2) in low productive counties over the 40 years (Figure 5). The relatively stable highly productive counties were primarily located in the south western region of Kenya, while the substantially decreasing low productive counties were primarily located in the south eastern region of the country. The moderately productive counties bordered the highly productive and low productivity counties.
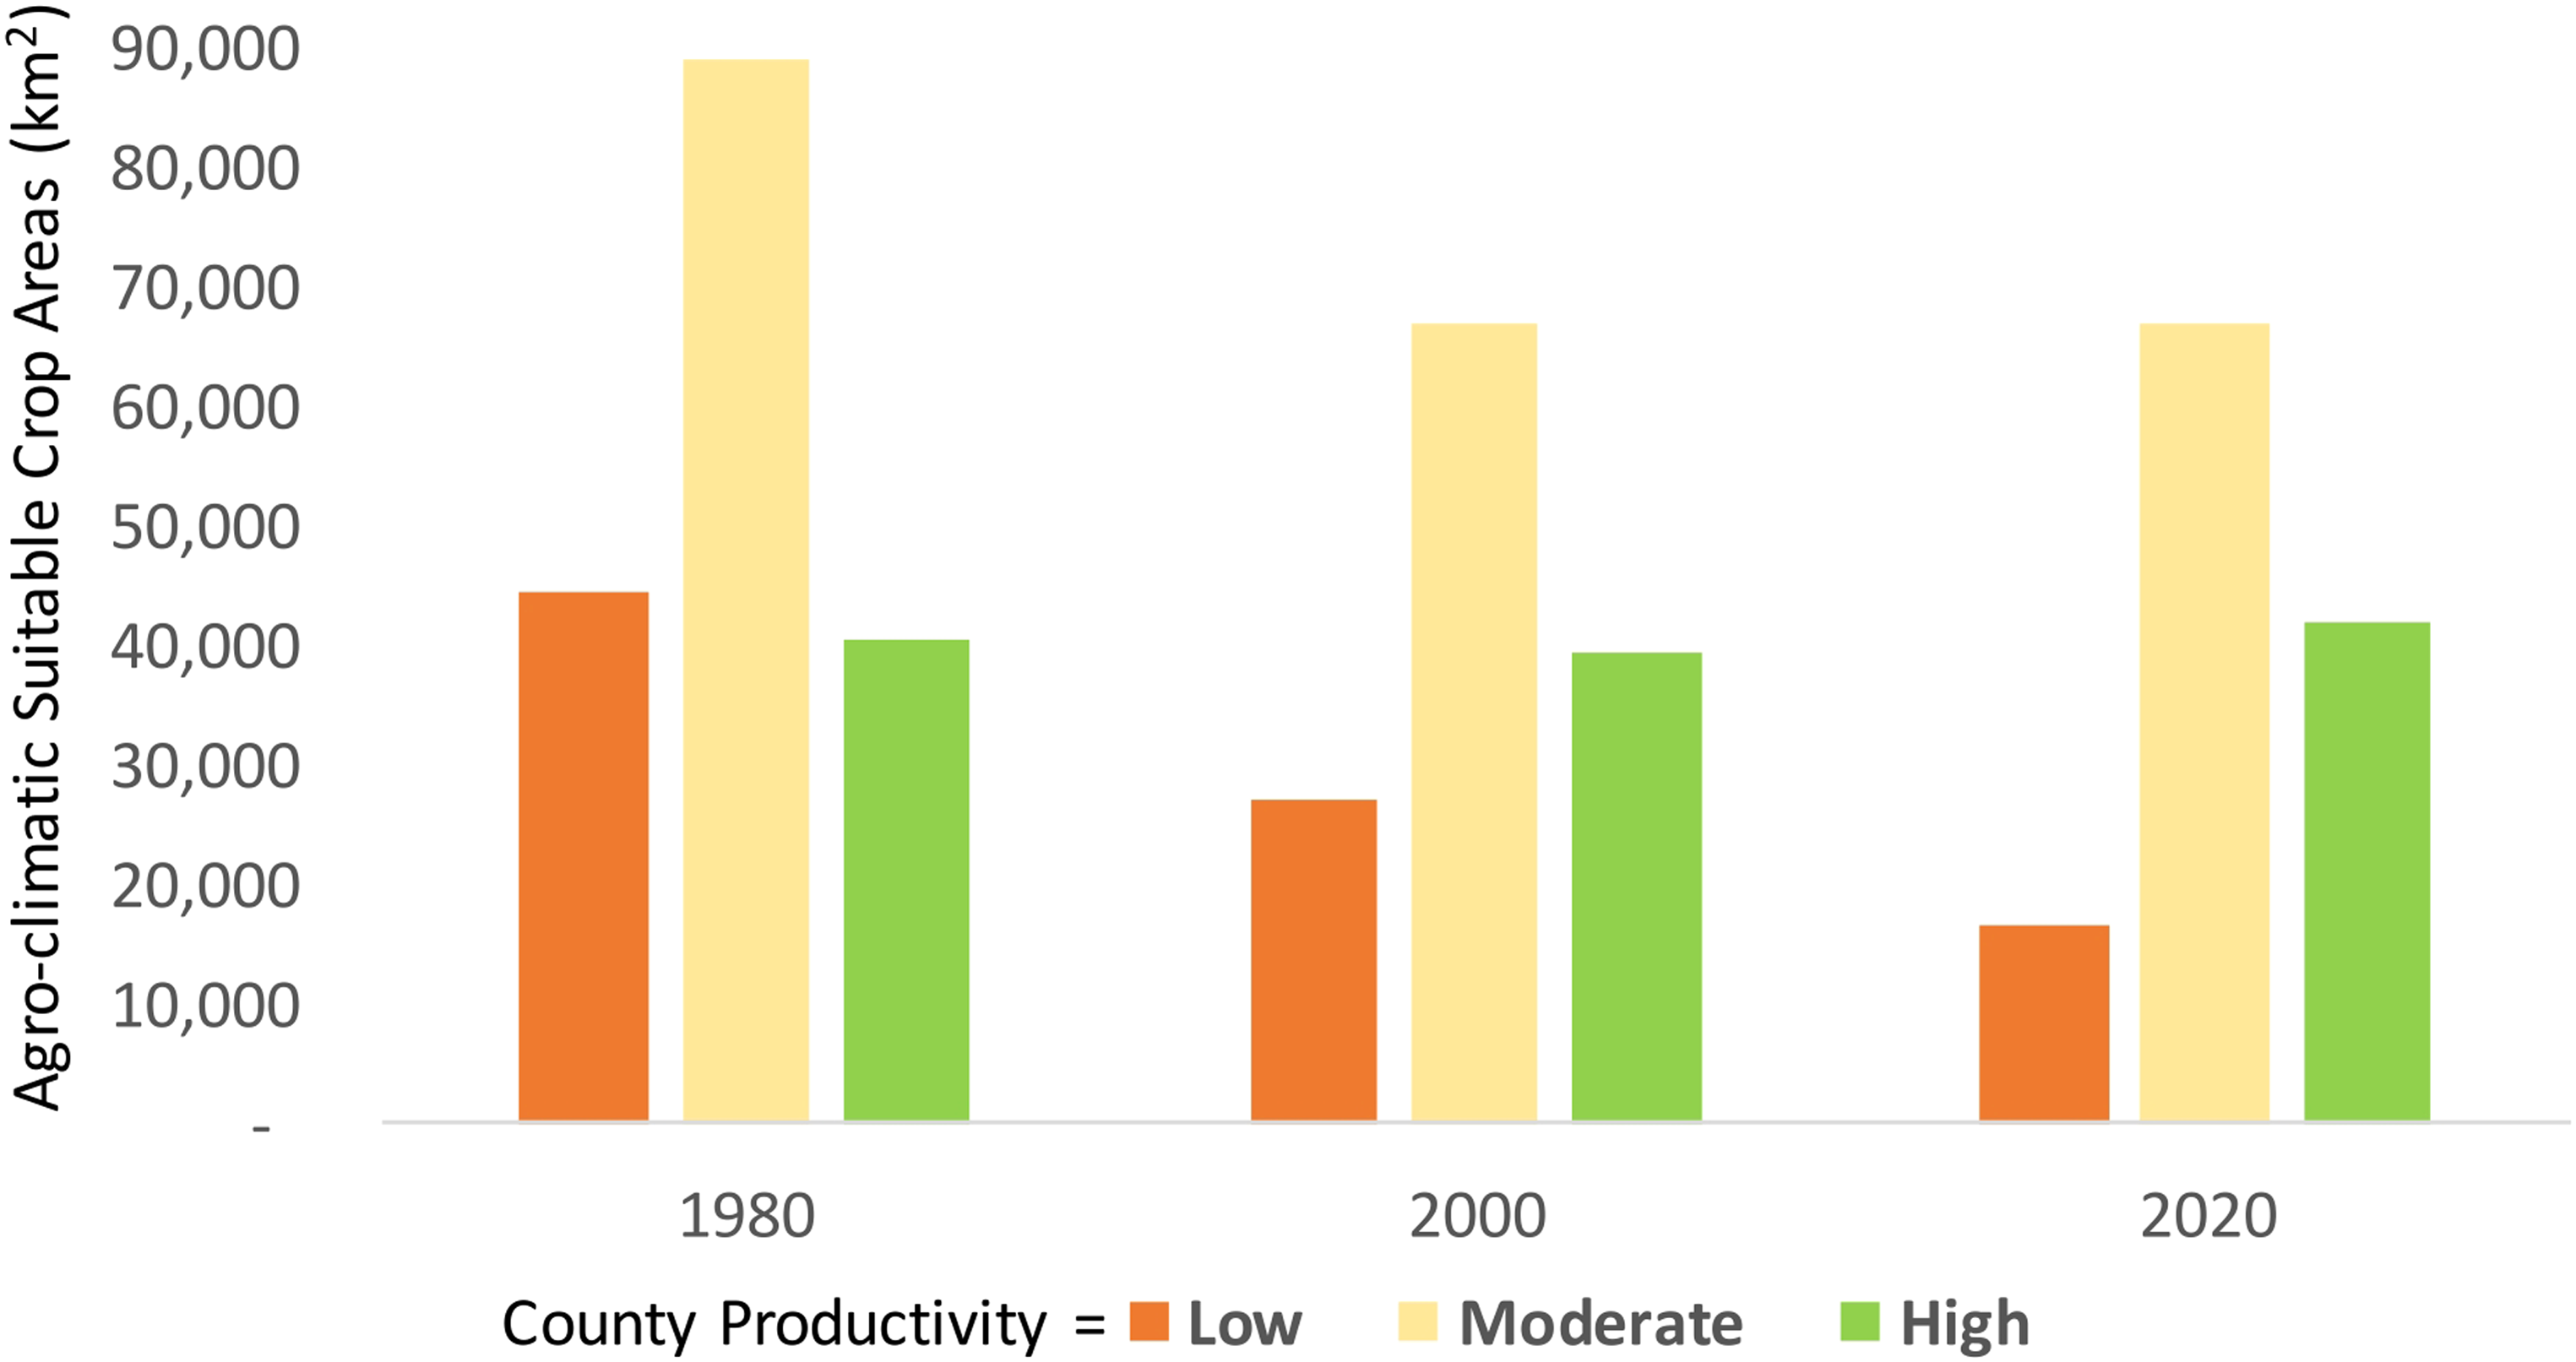
Changes to the amount of climate-suitable areas for primary crops in counties with low, moderate, and high crop productivity. The agro-climatic suitability in highly productive counties remained relatively unchanged between 1980 and 2020. The agro-climatic suitability in moderately productive counties decreased (roughly 22,000 km2) between 1980 and 2020 and remained relatively unchanged in 2020. The agro-climatic suitability in low productive counties decreased (nearly 28,000 km2) between 1980 and 2020.
Climatic-suitable areas for dairying were mostly located in Kenya's southwest region and overlapped with the climate-suitable areas for crops (Figure 6). Climatic suitability for ranching was primarily located in the central and southern regions of Kenya. However, climatic suitability for ranching in the southern coastal region has transitioned to agro-climatic suitability for pastoralism. Thus, the expansion of climate-suitable pastoral land is primarily replacing climate-suitable crop land or ranching land or both.
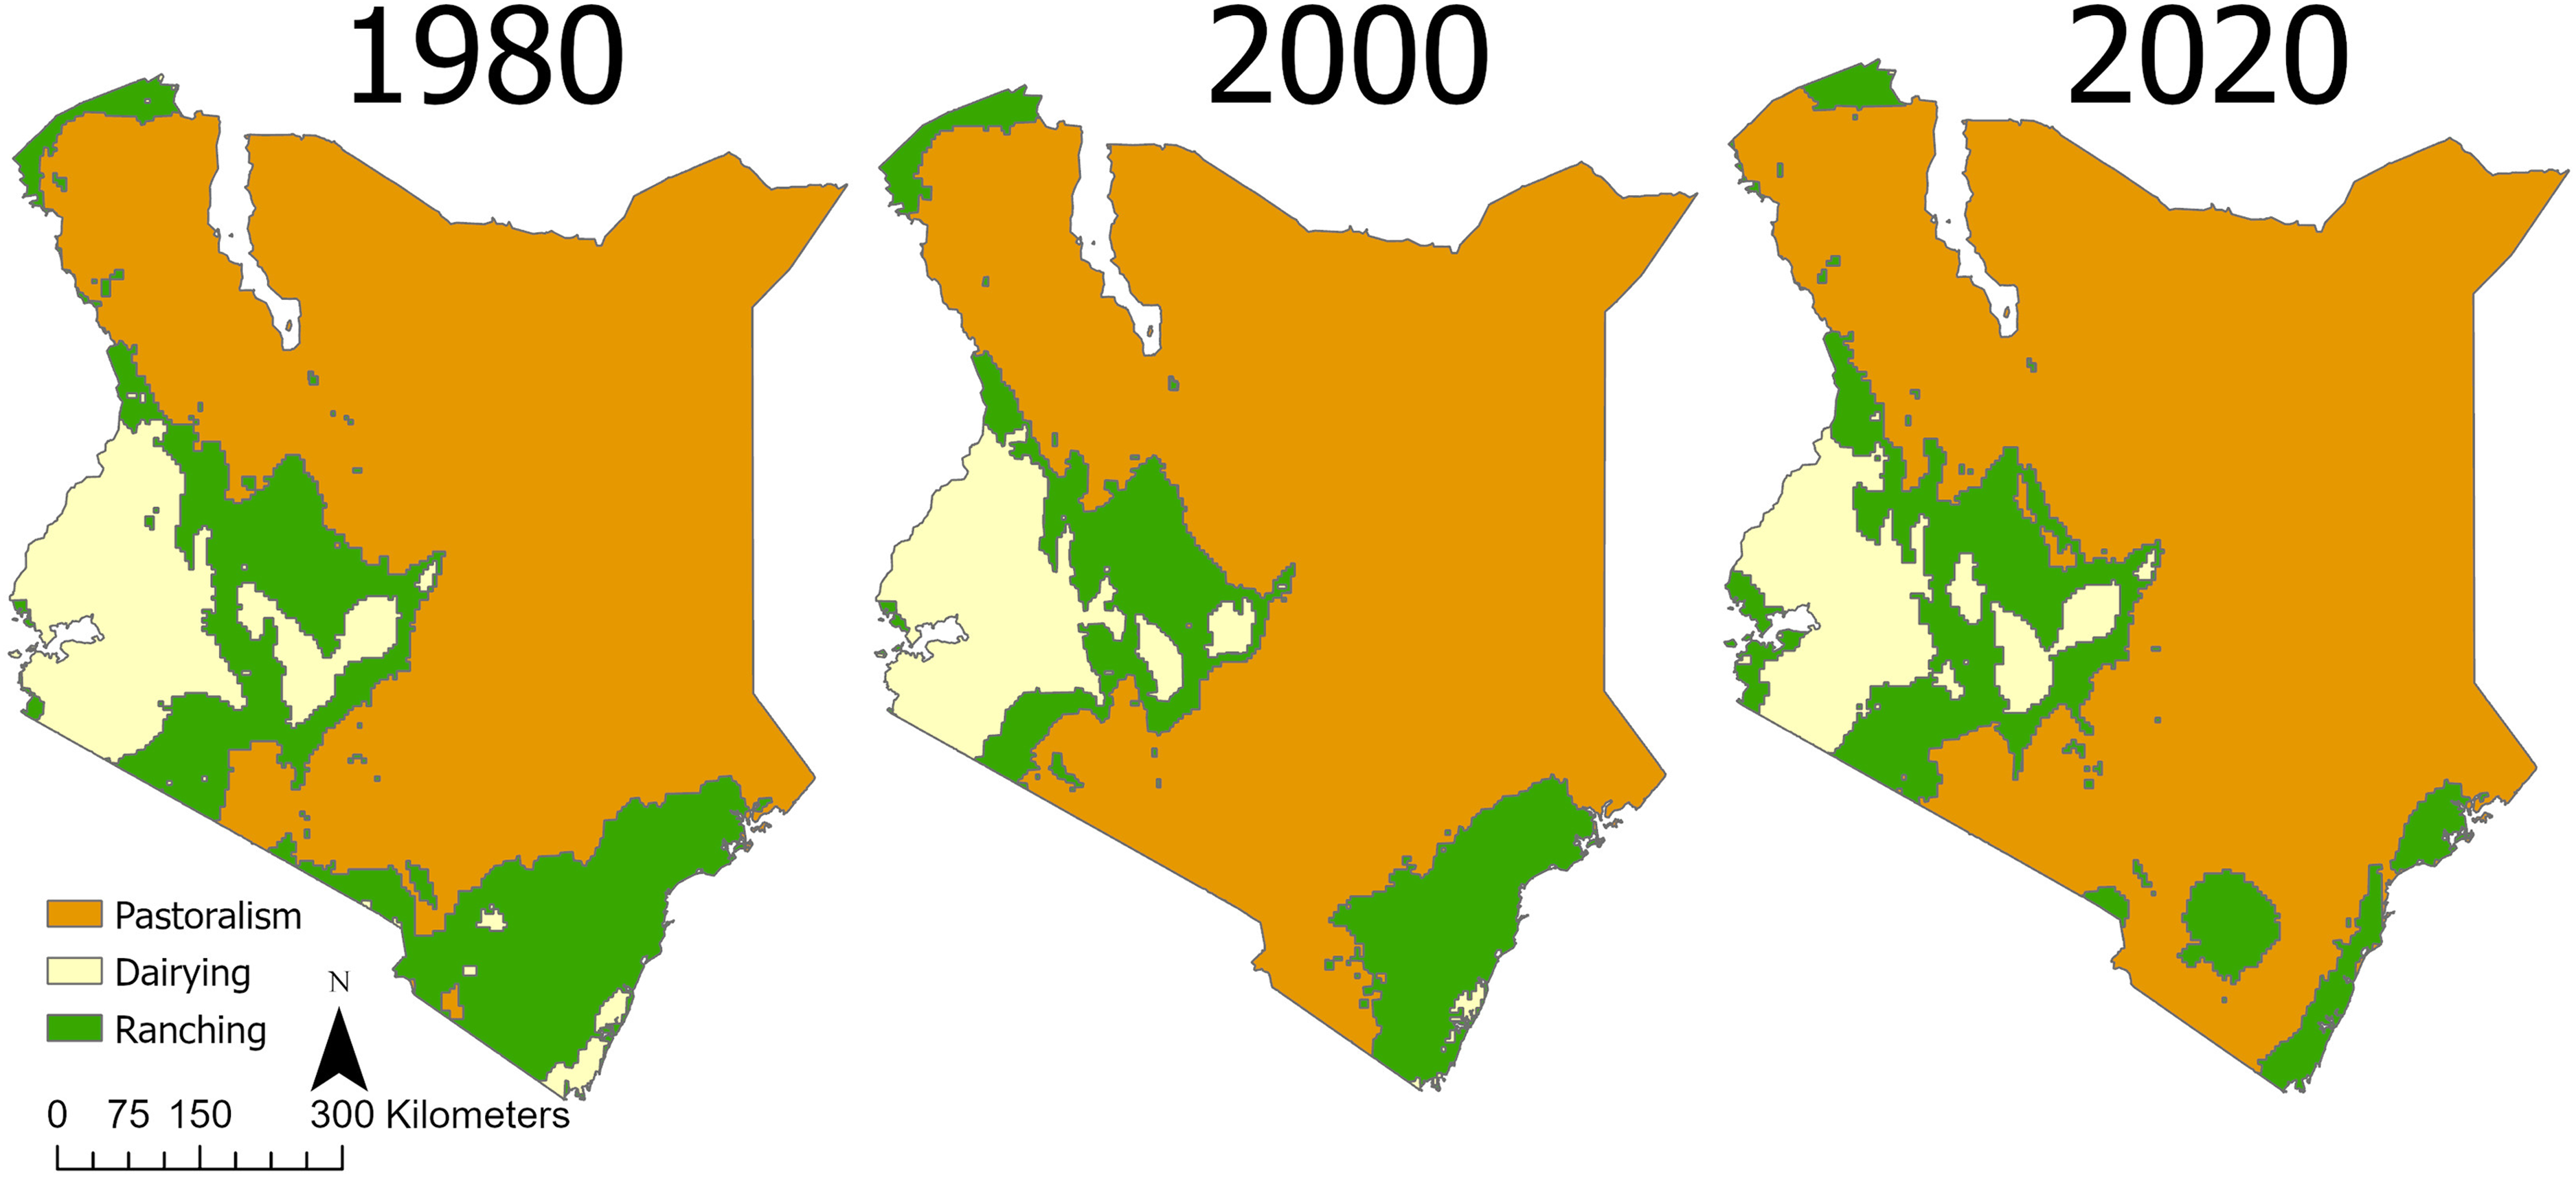
Climatic suitability of livestock systems in Kenya between 1980 and 2020. Climatic suitability for dairying were mostly located in Kenya's southwest region and overlapped with the climate-suitable areas for crops. Climatic suitability for ranching were primarily located in the central and southern regions of Kenya. However, climatic suitability for ranching in the southern coastal region has transitioned to agro-climatic suitability for pastoralism.
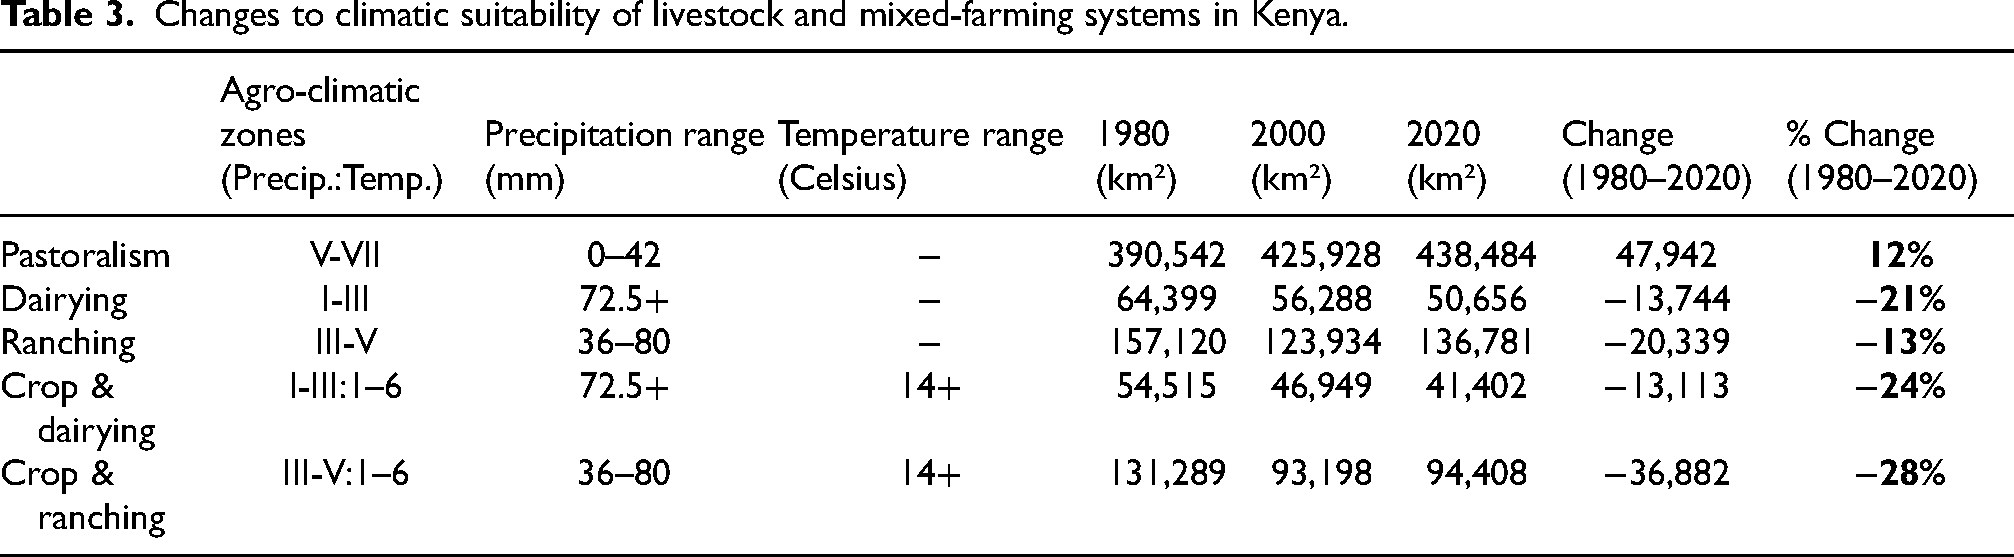
The climate-suitable areas for dairying decreased 21% between 1980 and 2020 (Figure 7) and the total area of decrease in dairying was 13,744 km2 (Table 3). Climate-suitable areas for combined crops and dairying decreased about the same amount of area for dairying alone. The climate-suitable areas for ranching decreased 13%, a total area of 20,339 km2, between 1980 and 2020. Also, there was a total area decrease (36,882 km2) in crop and ranching combined in 2020. Climate-suitable areas for crops was 17,279 km2 larger than ranching in 1980, but was 10,895 km2 smaller than ranching in 2020. The climate-suitable areas for pastoralism increased 12% between 1980 and 2020. The total area of increase in pastoralism was 47,942 km2, which is roughly the same amount of area decrease for all primary crops. In addition to climate-suitable areas having shifted away from crop and toward pastoral areas, the climate conditions within the pastoral areas became harsher with hotter (average temperature increased roughly 0.60 °C) and drier (average precipitation decreased roughly 2.6 mm) between 1980 and 2020.
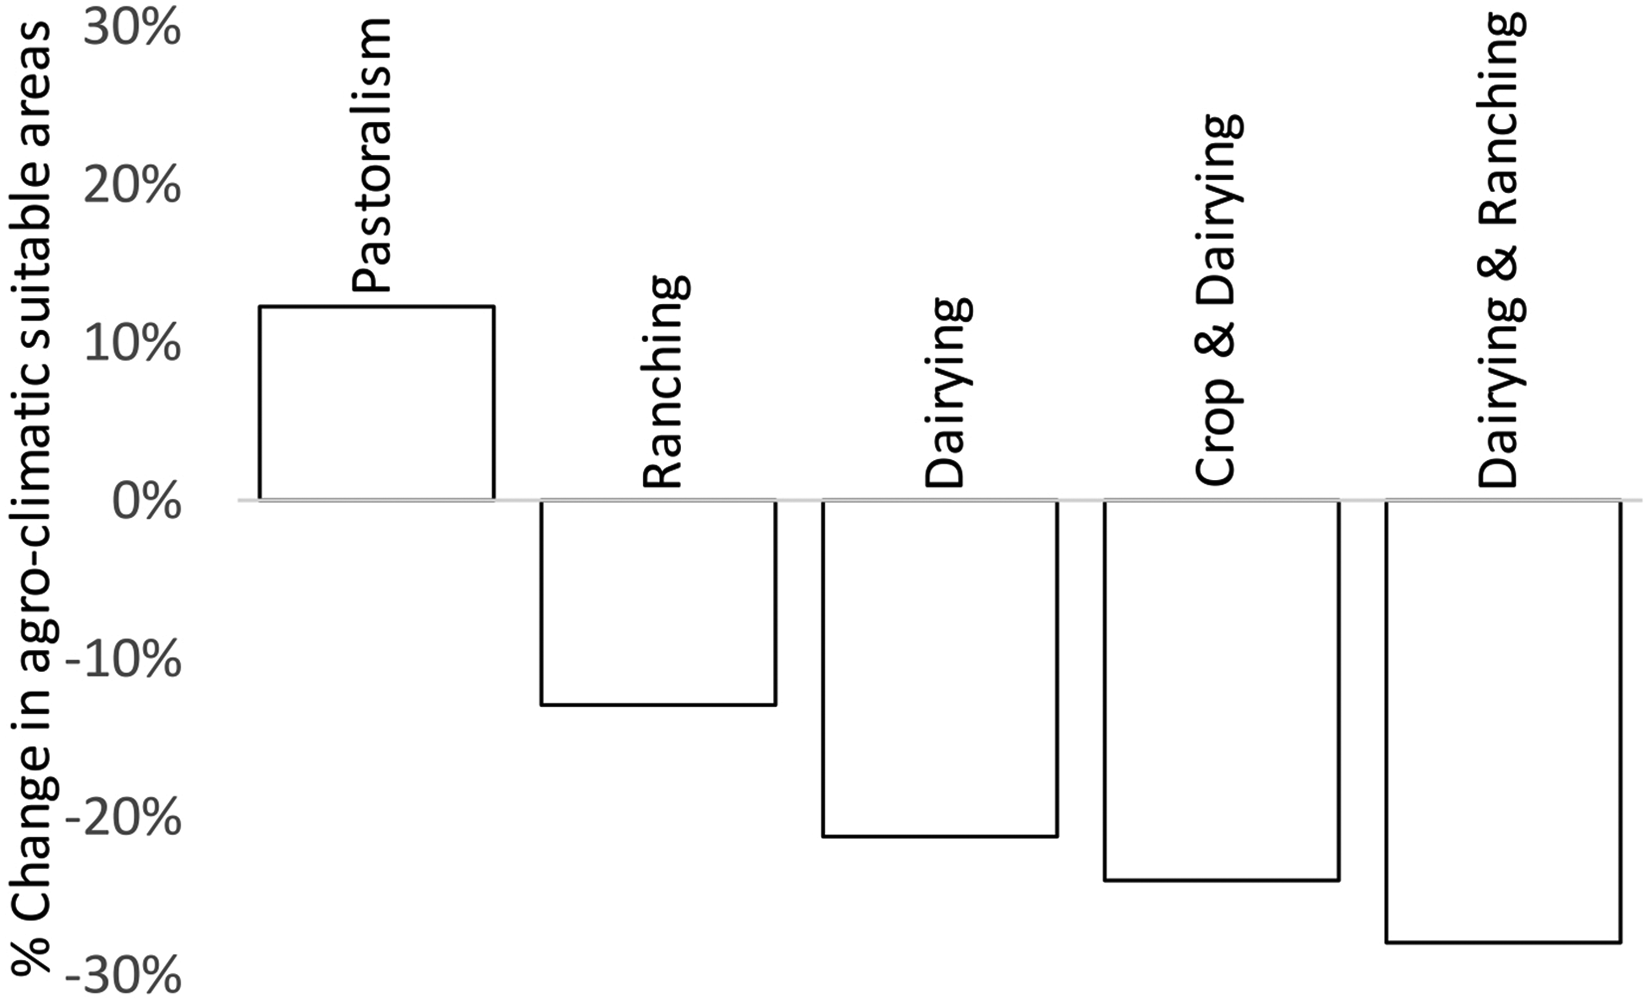
Changes to the climatic suitability of livestock and mixed-farming systems in Kenya between 1980 and 2020. Climatic suitability increased 12% for pastoralism, decreased 13% for ranching, decreased 21% for dairying, decreased 24% for mixed crop and dairying, and decreased 28% for mixed crop and ranching.
Changes to climatic suitability of livestock and mixed-farming systems in Kenya.
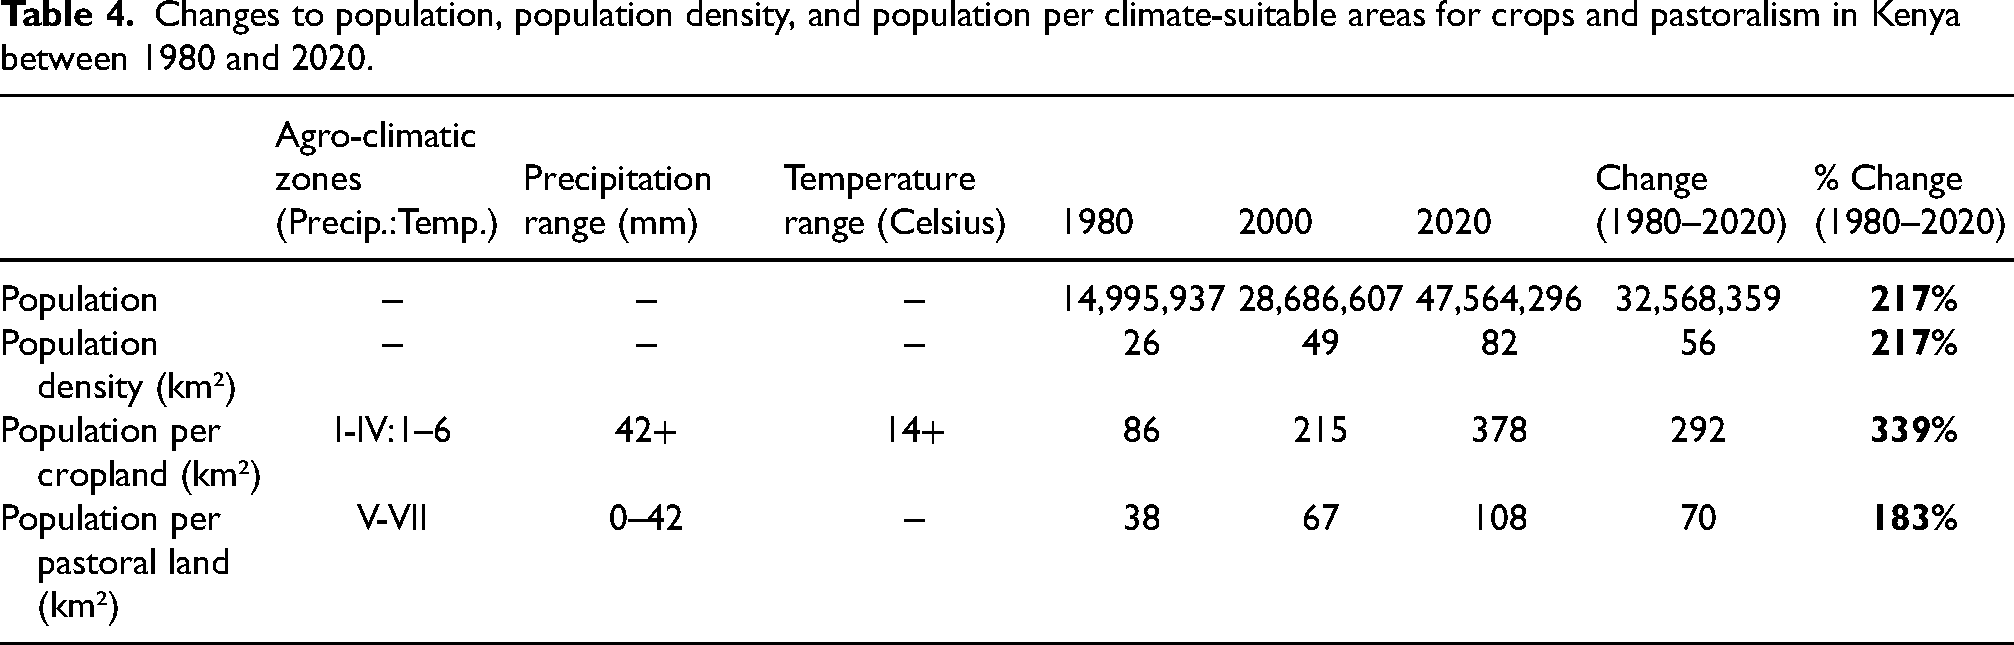
Population across Kenya more than tripled between 1980 and 2020 (Table 4). Kenya's population was largely concentrated on climate-suitable areas for cropland, as well as dairying and ranching (Figure 8). In particular, population per square kilometer was two to three and a half times higher on climate-suitable areas for cropland than it was for pastoralism. Further, the increase in population per square kilometer was largest on climate-suitable areas for crops. Population per square kilometer more than doubled across all types of climate-suitable areas. Population density primarily increased on areas that had limited and competing climate-suitable areas for primary crops, dairying, and ranching.
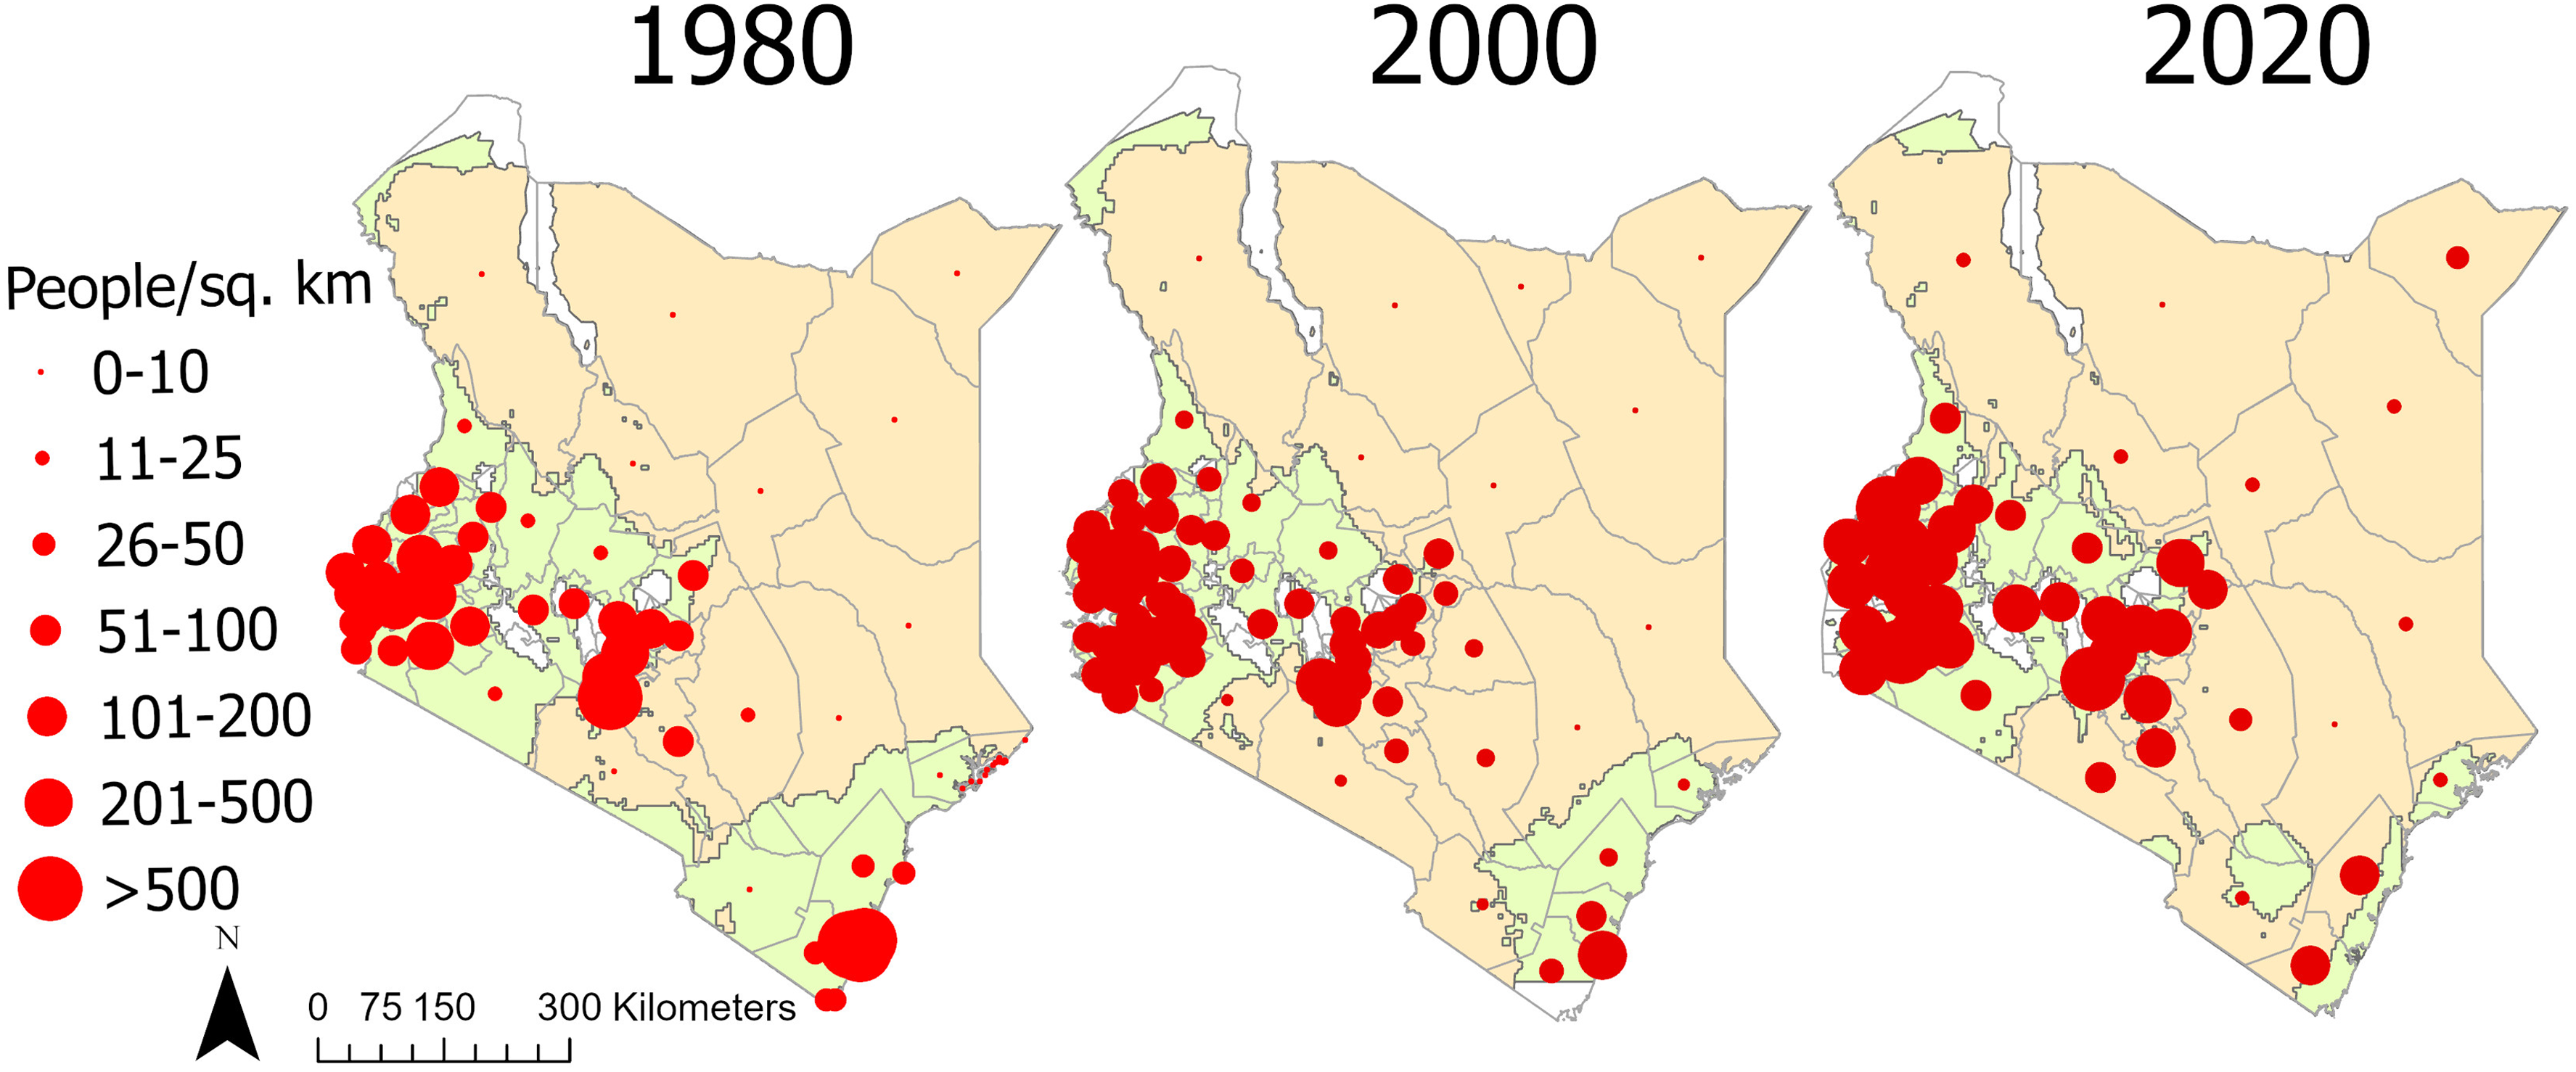
Population density by county overlaid on the climatic suitability of primary cropland and pastoral land in Kenya between 1980 and 2020. Population density (people/km2) is highest in climate-suitable areas for crops, as well as dairying and ranching. Population became more concentrated in cropland areas over time.
Changes to population, population density, and population per climate-suitable areas for crops and pastoralism in Kenya between 1980 and 2020.
Population relative to available climate-suitable areas increased across all counties (Figure 9). Population relative to available climate-suitable areas for crops more than doubled (from 204 to 529 people/km2) in highly productive counties, increased more than fourfold (from 62 to 270 people/km2) in moderately productive counties, and was nearly 15 times higher (from 25 to 371 people/km2) in low productive counties. Although population grew across all levels of productive counties, it is notable that the population relative to available climate-suitable areas in counties with low productivity became the second highest level in 2020.
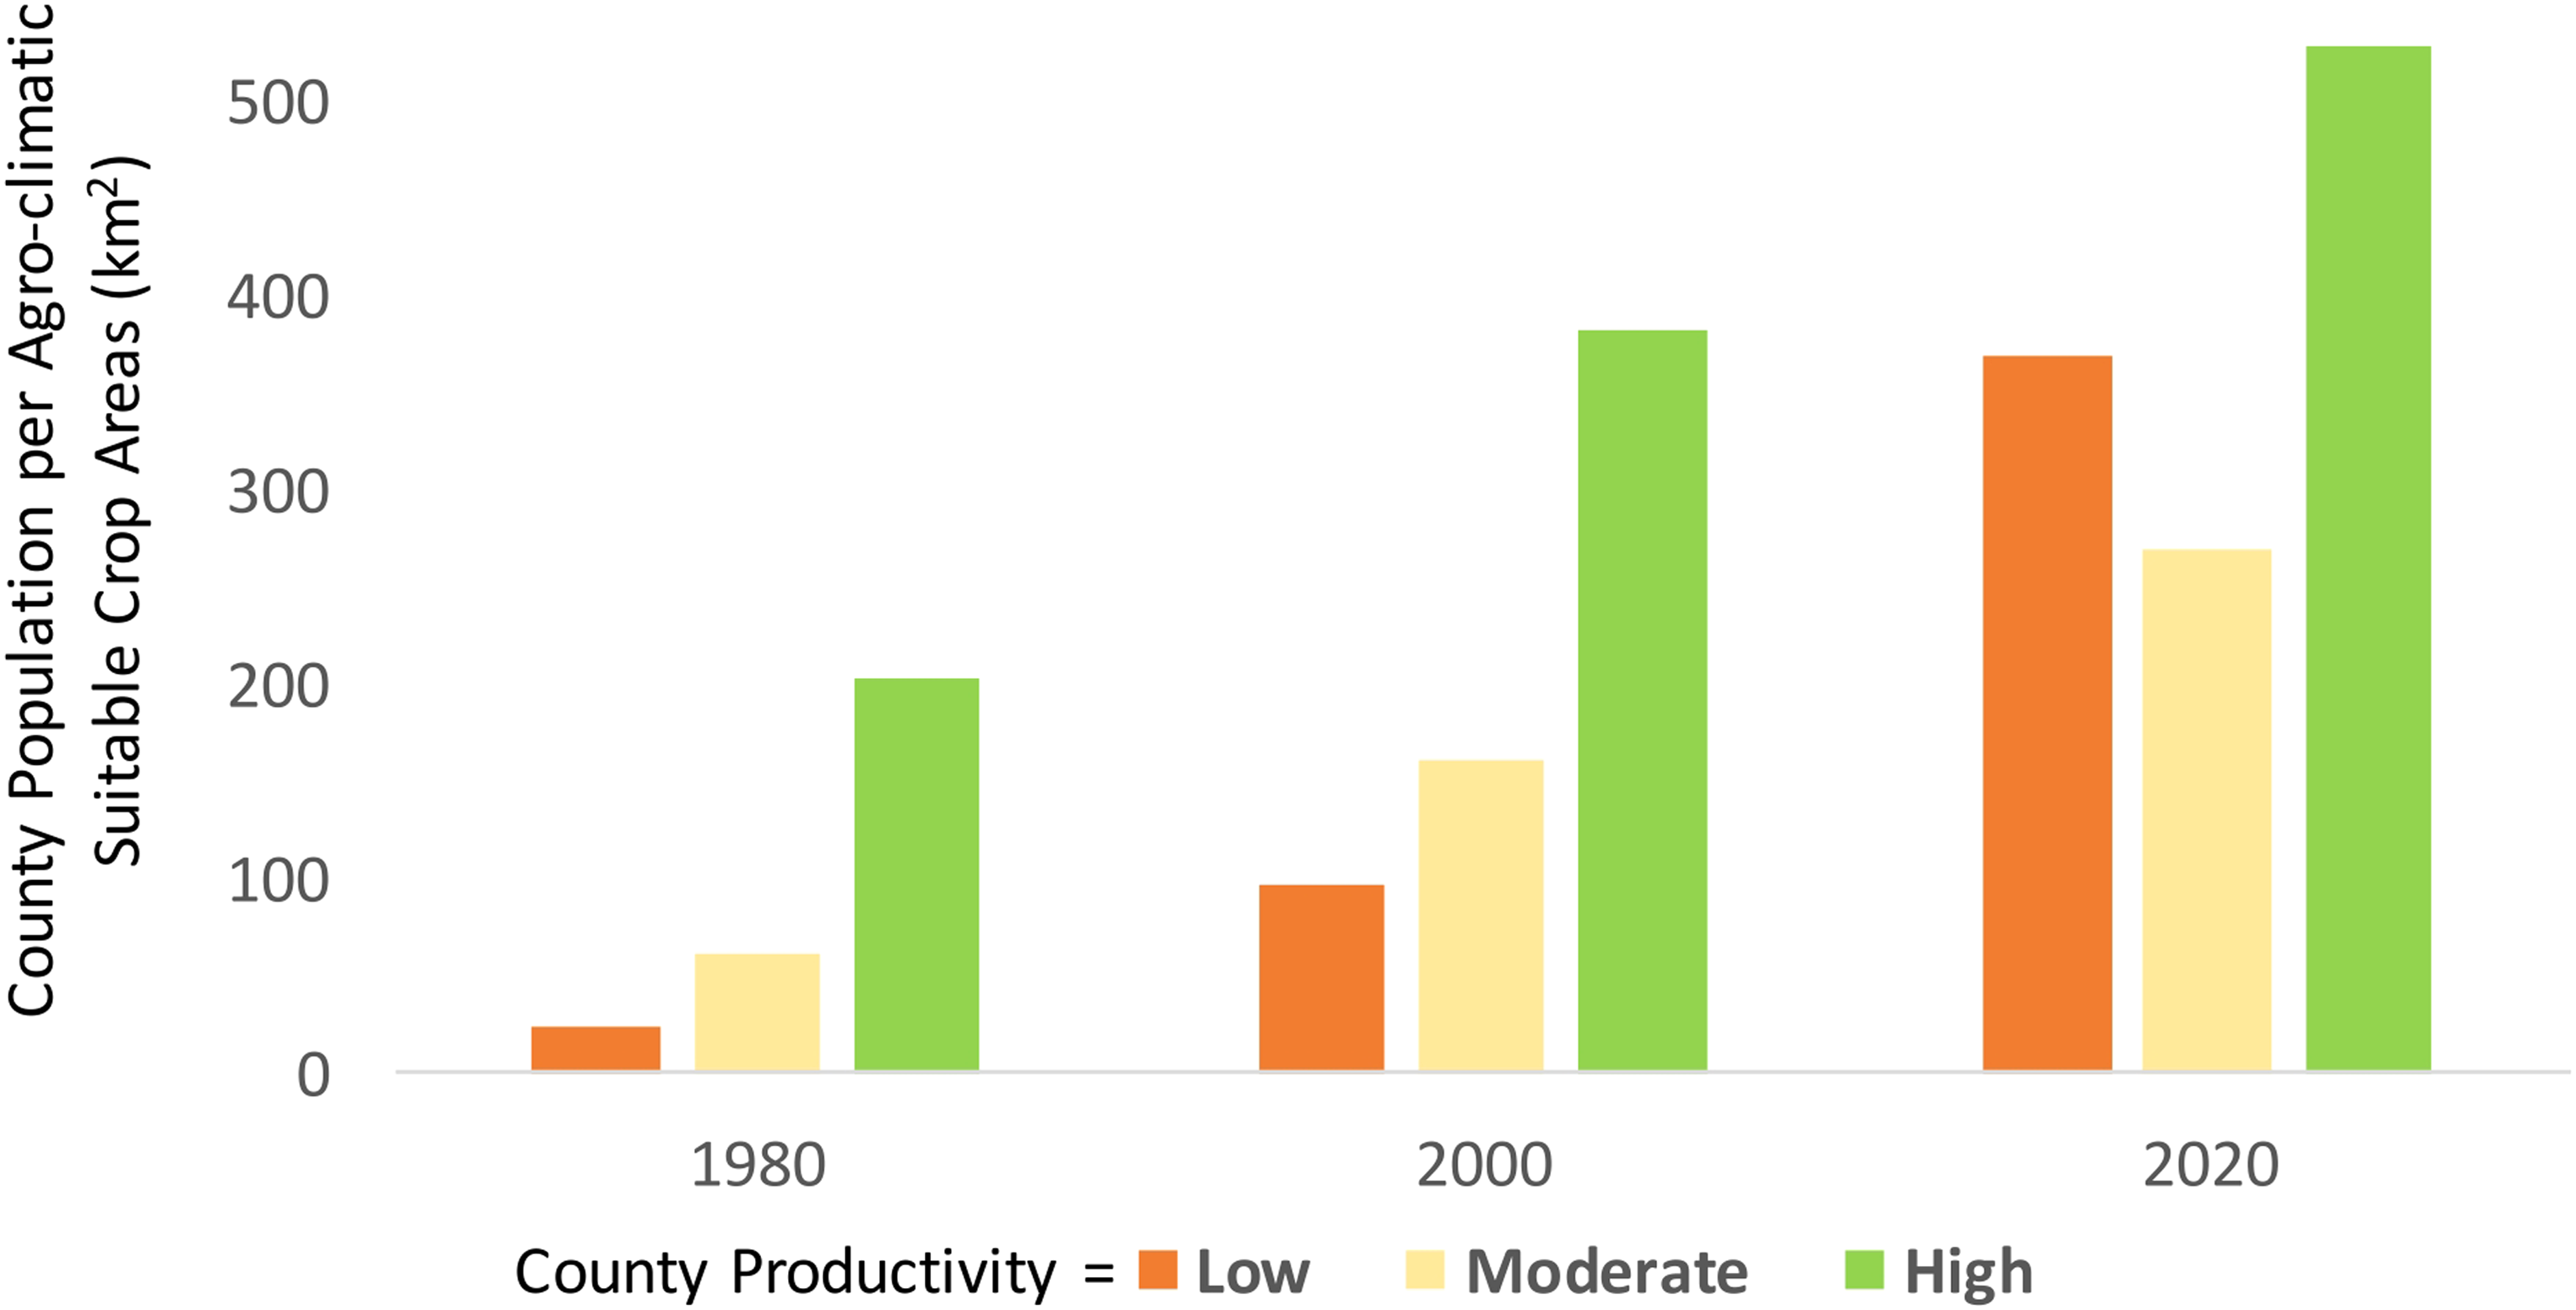
Changes to population relative to available climate-suitable areas for primary crops in Kenyan counties with low, moderate, and high crop productivity. Population relative to available climate-suitable areas increased across all counties. Population relative to available climate-suitable areas in counties with low productivity became the second highest in 2020.
Discussion
Agropastoral areas in Kenya are under increased pressure from the combined impacts of climate change and population growth. Substantial changes were exhibited to the climatic suitability of agropastoral areas across Kenya since 1980, and that may impact food and livelihood security, health and well-being, and ecosystem and wildlife conservation. Particularly, there was a substantial (roughly 48,000 km2) shift from climate-suitable areas for crops to climate-suitable areas for pastoralism. This represents an equivalent of nearly 10% of the total area of the entire country shifting. The shift in climatic suitability will primarily impact areas of Kenya with only moderate to low crop productivity, but communities in these areas tend to be more economically marginalized and have poor access to social services and infrastructure (Kariuki et al., 2021). Further, the changes away from climatic suitability for crops in these moderate to low productive areas make it more challenging for pastoralists to diversify their livelihoods through agropastoralism or transition to more crop-based livelihoods (Yurco, 2017). A shift away from cattle and towards camels for livestock rearing is also increasing as pastoralists attempt to cope with the harsher climate-related conditions (Deem 2019), which brings concomitant land use, economic, and socio-cultural changes and is fraught with challenges, such as costly initial investments, acquisition of multiple forms of new knowledge, and tradeoffs in household labor (Volpato and King, 2019). Additionally, climate-suitable areas for ranching have displaced some climate-suitable areas for primary crops, which makes it more challenging for mixed crop and ranching systems to co-exist. The decline in climate-suitable areas for dairying is also concerning given that milk is an important dietary component (Silvestri et al., 2012) and will doubtlessly, as for other commodities, lead to a more complex dairy value chain evolving to ensure demand is met (Kiambi et al., 2020). Primarily, the changes to the climatic suitability of agropastoral areas have further separated and concentrated crops in highly productive counties and livestock-oriented livelihoods in moderate to low crop productive counties.
Combined with the changes to climate-suitable areas are declines in the availability of suitable agropastoral areas due to population growth and increasing population density. The population growth and increasing population density can have multiple social and ecological impacts related to suitability and availability of agropastoral areas. For example, higher population density is associated with smaller farm sizes, greater demand for inorganic fertilizer, and decreasing farm income per hectare (Josephson et al., 2014). The disparity between climate-suitable areas for crops and population density in those same areas in Kenya raises doubt about how millions of smallholder farm households will feed themselves, and how the food system can generate enough surplus to feed the non-agricultural population. Such disparities between growth in human population and climate-suitable areas for crops likely present challenges for farm-household crop production and income more broadly across sub-Saharan Africa.
Agriculture remains critical to Kenya's development as it provides food security for the residents, and contributes towards improving livelihoods, overall economic activity, and employment (Kogo et al., 2021; The World Bank, 2019). However, climate systems and food security are strongly linked because food production is particularly sensitive to temperature and precipitation levels, while population growth is a key determinant of food availability (Stavi et al., 2021). Further, climate change forecasts in East Africa, and in particular Kenya, show an increase in temperatures and regular climate shocks, such as droughts and floods (Haile et al., 2020). Climate change together with the growing population in Kenya creates a risk of famine (Waaswa et al., 2022). Such a situation is complicated by the fact that climate change alters the distribution of ACZs and shift land suitability for crop production leading to increased production in primarily high-altitude areas (Kogo et al., 2021). Similarly, climate change impacts livestock production through its effect on the basic natural resources required for keeping animals, such as fodder and water (Stavi et al., 2021). The consequences resulting from climate change are likely to include altered rangeland productivity, effects on livestock parasites and infectious and non-infectious diseases, and increased competition for both land and water.
Climate-suitable areas for growing maize have far exceeded the climate-suitable areas of any other primary crop. As a result, maize constitutes the staple crop in Kenya and East Africa, especially in response to a changing climate. However, our results show that climate-suitable areas for maize are also declining substantially. In response, sorghum has been promoted as a climate resilient crop and adaptation strategy to supplement declines in climate-suitable areas of maize (Mumo et al., 2021). Despite the focus on sorghum as an adaptation strategy there is a lack of knowledge about the response of sorghum to future climate change. Thus, further research is needed to better understand sorghum as one potential climate adaptation strategy. This is especially important because significant changes in maize harvest volumes in the country and region will likely have social impacts; Kenya's annual per capita maize consumption is between 95 and 110 kg (Barmao Kiptanui Tarus, 2019), and changes in access to the commodity in a growing population will impact food prices, food security, and the balance of trade.
Agropastoral systems worldwide are undergoing unprecedented changes (Seré et al., 2020). Particularly, declines in the suitability and availability of agricultural areas are a global societal challenge and the declines are especially acute in tropical countries, such as Kenya (Chemura et al., 2020). Here, we quantified changes in a Kenyan context, cognizant of the fact that, at least, Kenya's diverse geography acts as a buffer to some of the changes we highlight, and that communities in other neighboring countries in East Africa and the Horn of Africa are doubtlessly feeling these long-term changes more acutely. Climate change and human population growth impacts agriculture, ecosystems, and livelihoods worldwide and the major shifts in the areas suitable for growing some of Kenya's major crops, such as wheat and maize, are projected elsewhere (Hannah et al., 2017; Venter et al., 2016). However, analysis of climatic suitability and availability of agropastoral areas can play an important role in assessing progress toward the UN SDGs at a country-specific level. Specifically, such information can be used to examine the interrelated goals of: achieving food security and sustainable agriculture; ensuring healthy lives; and promoting well-being. Country-level and regional modeling efforts are crucial to understanding the cumulative effects of climate change and population growth on agricultural and ecological sectors across a region and for providing context to national and local impact studies; as well as policies and programs for food security, agriculture, climate change, and biodiversity conservation (Hannah et al., 2017).
Conclusion
Agriculture is a key sector in Kenya due to its significant contribution to the economy, livelihoods, and food security (Kogo et al., 2021). Our study showed how climate change and population growth has impacted the climatic suitability and availability of agropastoral areas across Kenya. Despite the importance of climate change and population growth data to land use assessments, there has been a limited inclusion of such data in the application of agricultural suitability analysis (Akpoti et al., 2019) and studies have often been done on a broader regional basis, rather than country-specific scales (Kogo et al., 2021). Further, population growth drives landscape degradation due to increasing agricultural demand (Rukundo et al., 2018), while the availability of cultivatable land is more constrained due to dense population patterns (Nakawuka et al., 2018). Thus, our analysis of climate change and population growth impacts on agricultural suitability and availability is important to develop policy and management strategies to reach the UN SDGs and to inform policies and programs in Kenya and elsewhere for food and livelihood security, health and well-being, agriculture, climate change, and biodiversity conservation.
Supplemental Material
sj-docx-1-oag-10.1177_00307270231176577 - Supplemental material for Spatial changes to climatic suitability and availability of agropastoral farming systems across Kenya (1980–2020)
Supplemental material, sj-docx-1-oag-10.1177_00307270231176577 for Spatial changes to climatic suitability and availability of agropastoral farming systems across Kenya (1980–2020) by Ted J Lawrence, Justin M Vilbig, Geoffrey Kangogo and Eric M Fèvre, Sharon L Deem, Ilona Gluecks, Vasit Sagan, Enbal Shacham in Outlook on Agriculture
Footnotes
Data availability statement
Data associated with this article will be made available upon request to the lead author.
Declaration of conflicting interests
The author(s) declared no potential conflicts of interest with respect to the research, authorship, and/or publication of this article.
Funding
The author(s) disclosed receipt of the following financial support for the research, authorship, and/or publication of this article: This work was supported in part by the Taylor Geospatial Institute and a seed research grant from the Living Earth Collaborative at Washington University in St. Louis. Furthermore, this research was also supported in part by the UK Biotechnology and Biological Sciences Research Council, the Department for International Development, the Economic & Social Research Council, the Medical Research Council, the Natural Environment Research Council, and the Defence Science & Technology Laboratory, under the Zoonoses and Emerging Livestock Systems (ZELS) programme, grant reference BB/L019019/1. This study also received support from the CGIAR One Health initiative “Protecting Human Health Through a One Health Approach,” which was supported by contributors to the CGIAR Trust Fund (https://www.cgiar.org/funders/). We thank the University of Liverpool’s Open Access team for support of the CC-BY open access license for this article.
Supplemental material
Supplemental material for this article is available online.
References
Supplementary Material
Please find the following supplemental material available below.
For Open Access articles published under a Creative Commons License, all supplemental material carries the same license as the article it is associated with.
For non-Open Access articles published, all supplemental material carries a non-exclusive license, and permission requests for re-use of supplemental material or any part of supplemental material shall be sent directly to the copyright owner as specified in the copyright notice associated with the article.