
Abstract
UK farming is at a crossroads. Its continued dependency on decoupled direct payments, shortage of investment finance, difficulties in changing cost structure and the reduced scope to differentiate and diversity sources of farm revenue, exacerbated by the unprecedented increases in the price of key inputs, means farmers face stark choices with fewer remaining effective management options. This study reviews two previous crossroads moments in UK agriculture and considers how the current crossroads moment is different from those. It then provides an estimate of the impacts of the current challenges on the size of the future farming population, based on the methodology used by McInerney. The inter-farm distribution of assets, debts and earnings, differences in farm specialisation, availability of finance and farm-succession arrangements mean it is not easy to identify which individual farms are most likely to fail. Nevertheless, upland grazing, lowland grazing and mixed farm-types seem to be the most vulnerable. Assuming low but realistic returns to fixed and working capital and income/farm, the future farming population is estimated to be 138,000: a 23% reduction from the number of 2019 farming population. The population falls to 15,000 if all subsidies paid in 2021 are removed from the calculation. The actual fall will be smaller than this because farmers will develop new revenue streams and farming systems. But a reduction even approaching 23% is likely to result in more generous assistance being made available, and perhaps even a reversal of some key elements of the new policies.
Keywords
Introduction
UK farming is currently at a crossroads. The crossroads metaphor has been used by McInerney (1998) to refer to the options available to farmers at times of substantial hardship and change. Since joining the European Union (EU) in 1973, the agriculture sector has experienced two such crossroads moments. The first, in the late 1980s, was caused by an unbalanced financial structure (Harrison and Tranter, 1989). The second, in the late 1990s, was caused by a precipitous fall in Total Income From Farming (TIFF) (McInerney (1998), Harvey (2001)).
The current crossroads moment is caused by the once-in-a-generation policy changes introduced after the decision of the UK to leave the EU. Outlined in The path to sustainable farming: an agriculture transition plan 2021 to 2024 (Defra, 2020b), these new policies aim to create farms that are “profitable and economically sustainable without subsidy” (p 7). They include the phased withdrawal of area-based Basic Payment Scheme (BPS) payments, a gradual lowering and elimination of import taxes (tariffs) on imported food, and grants for farmers who invest in productivity improving equipment and buildings. A new agri-environment scheme (AES) is being designed to incentivise farmers to produce public and social goods (such as biodiversity and enhanced animal welfare). Farmers who wish to quit have the option of taking a one-off “lump-sum” payment. The challenges created by these new policies have been exacerbated by an unprecedented increase in the price of key inputs, diesel, oil, fertiliser and pesticides.
This study reviews the two previous crossroads moments, focusing on their causes and options recommended to and taken by farmers. It then moves to the current situation, which is considered from the point of view of its causes and the relevance of the advice given to farmers during the two previous pivotal moments. This is followed by a rough estimate of the number of farmers the sector may be able to support after all direct payments are withdrawn. Finally, it considers what additional selective support government might wish to offer to those farmers who are not able to survive the current unprecedented combination of challenges.
First crossroads moment
Harrison and Tranter (1989) attributed the causes of the 1980s crossroads moment to the fall in TIFF, historically high levels of liabilities and rising interest rates. The level and year-to-year variability in TIFF reflects how the sector has managed the underlying economic signals associated with changing market prices, agricultural policy and new technologies. Figure 1 shows the precipitous fall in TIFF in the 1980s. This occurred at a time when the sector's liabilities were at an historical high and interest rates were rising. Moreover, the sector's terms of trade were deteriorating (Figure 2) just as farming was becoming more dependent on purchased inputs. 1
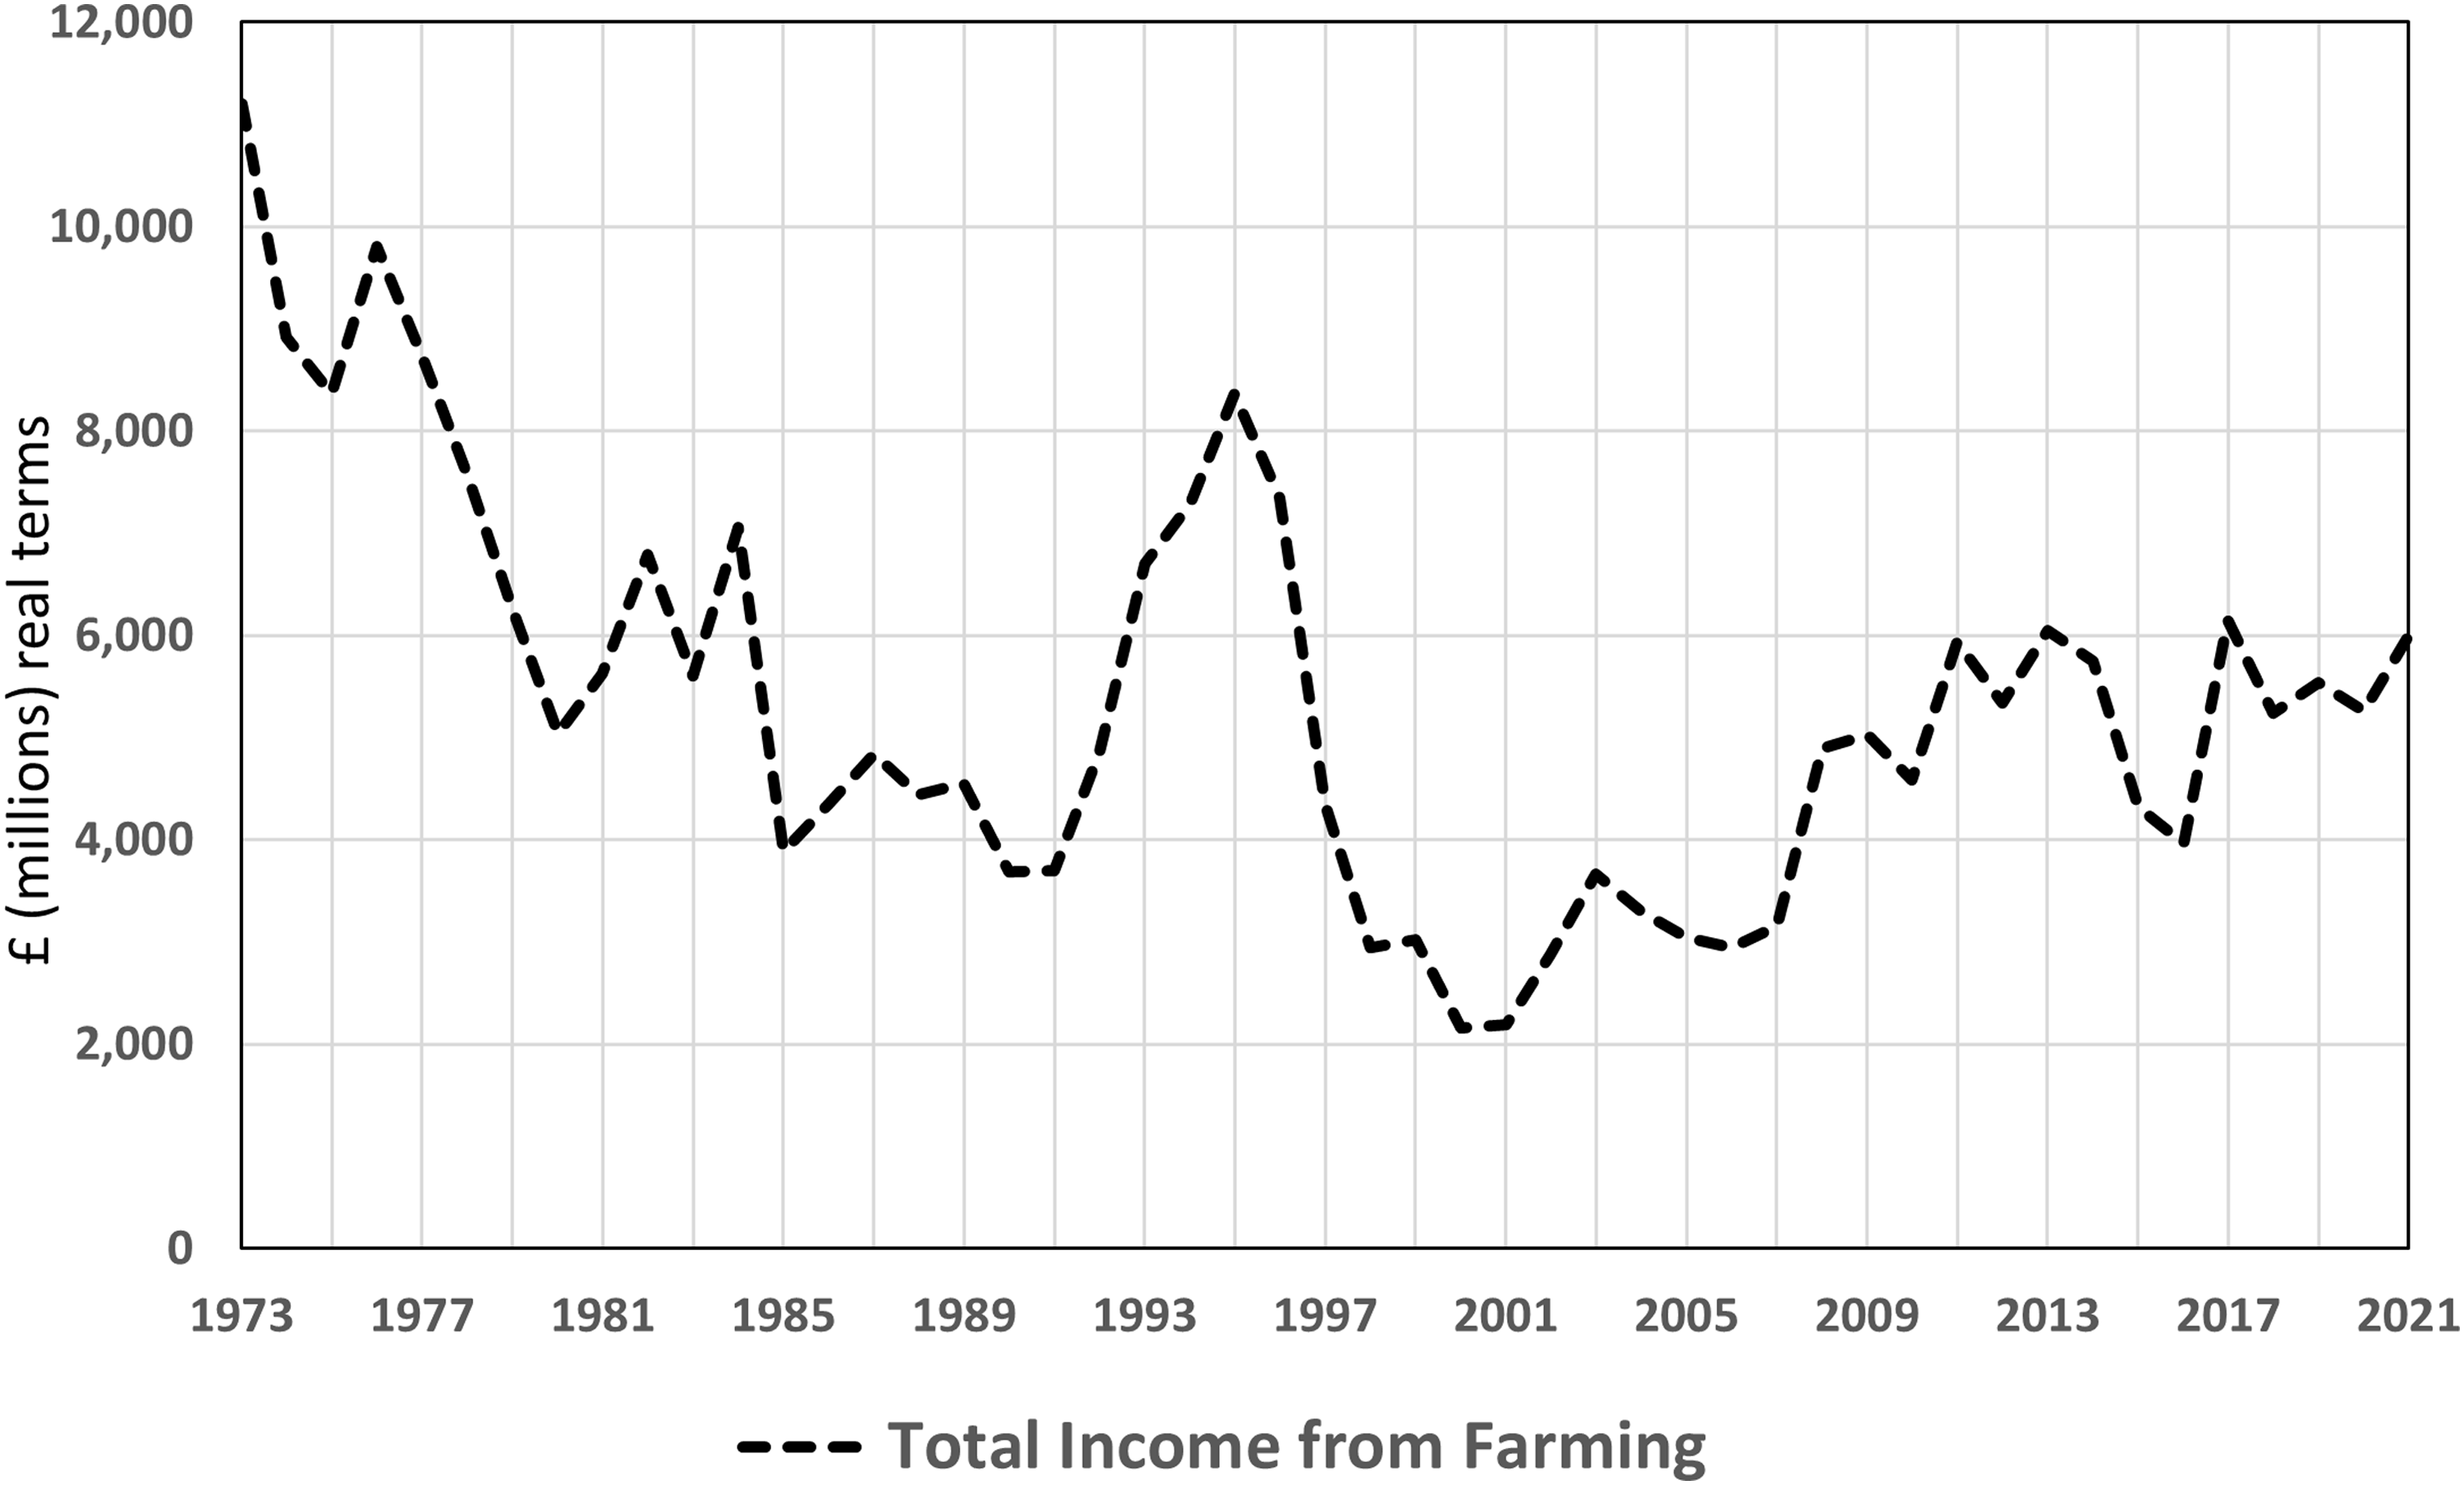
Total income from farming in the UK (£ million, adjusted for inflation (2021 prices)) (source: (Defra, 2022a)).
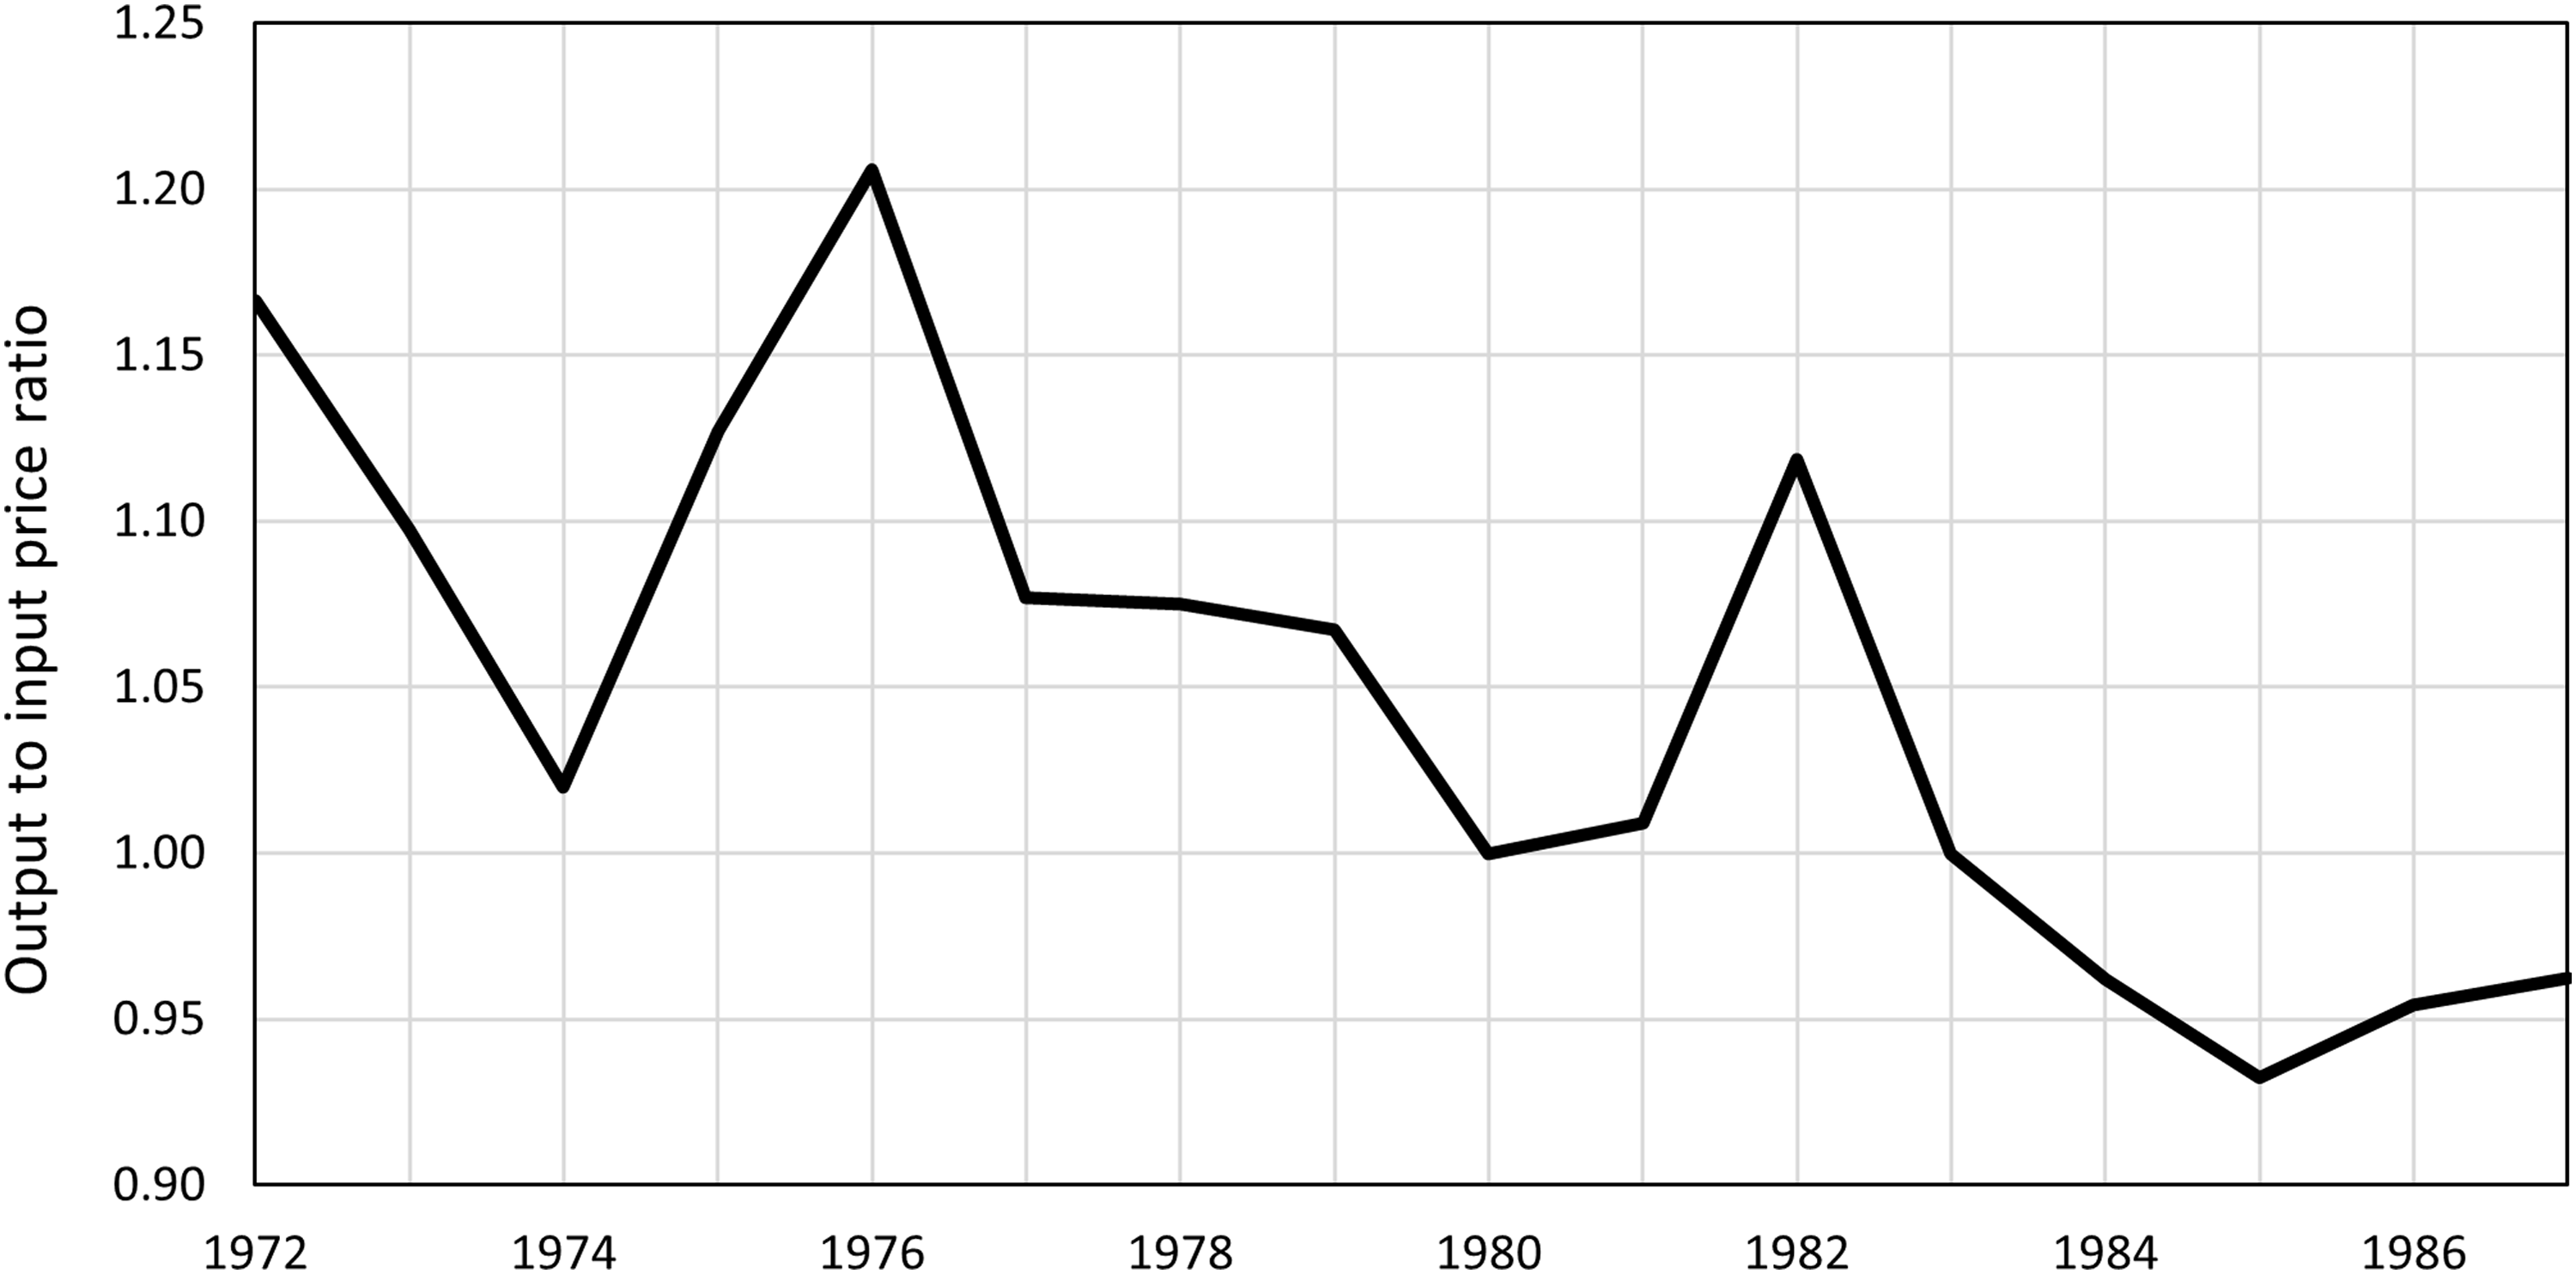
The ratio of the agricultural output prices index to the agricultural input prices index for UK farming (19721987), (Burrell et al., 1990; Harrison and Tranter, 1989).
Figure 3 summarises the financial pressures on farming during this period. The debt to asset ratio (gearing) increased in the late 1980s because farm asset values decreased more sharply than the fall in liabilities (Figure 4). Conversely, the stronger increase in asset values after 1992 allowed gearing to return towards its long-term level.
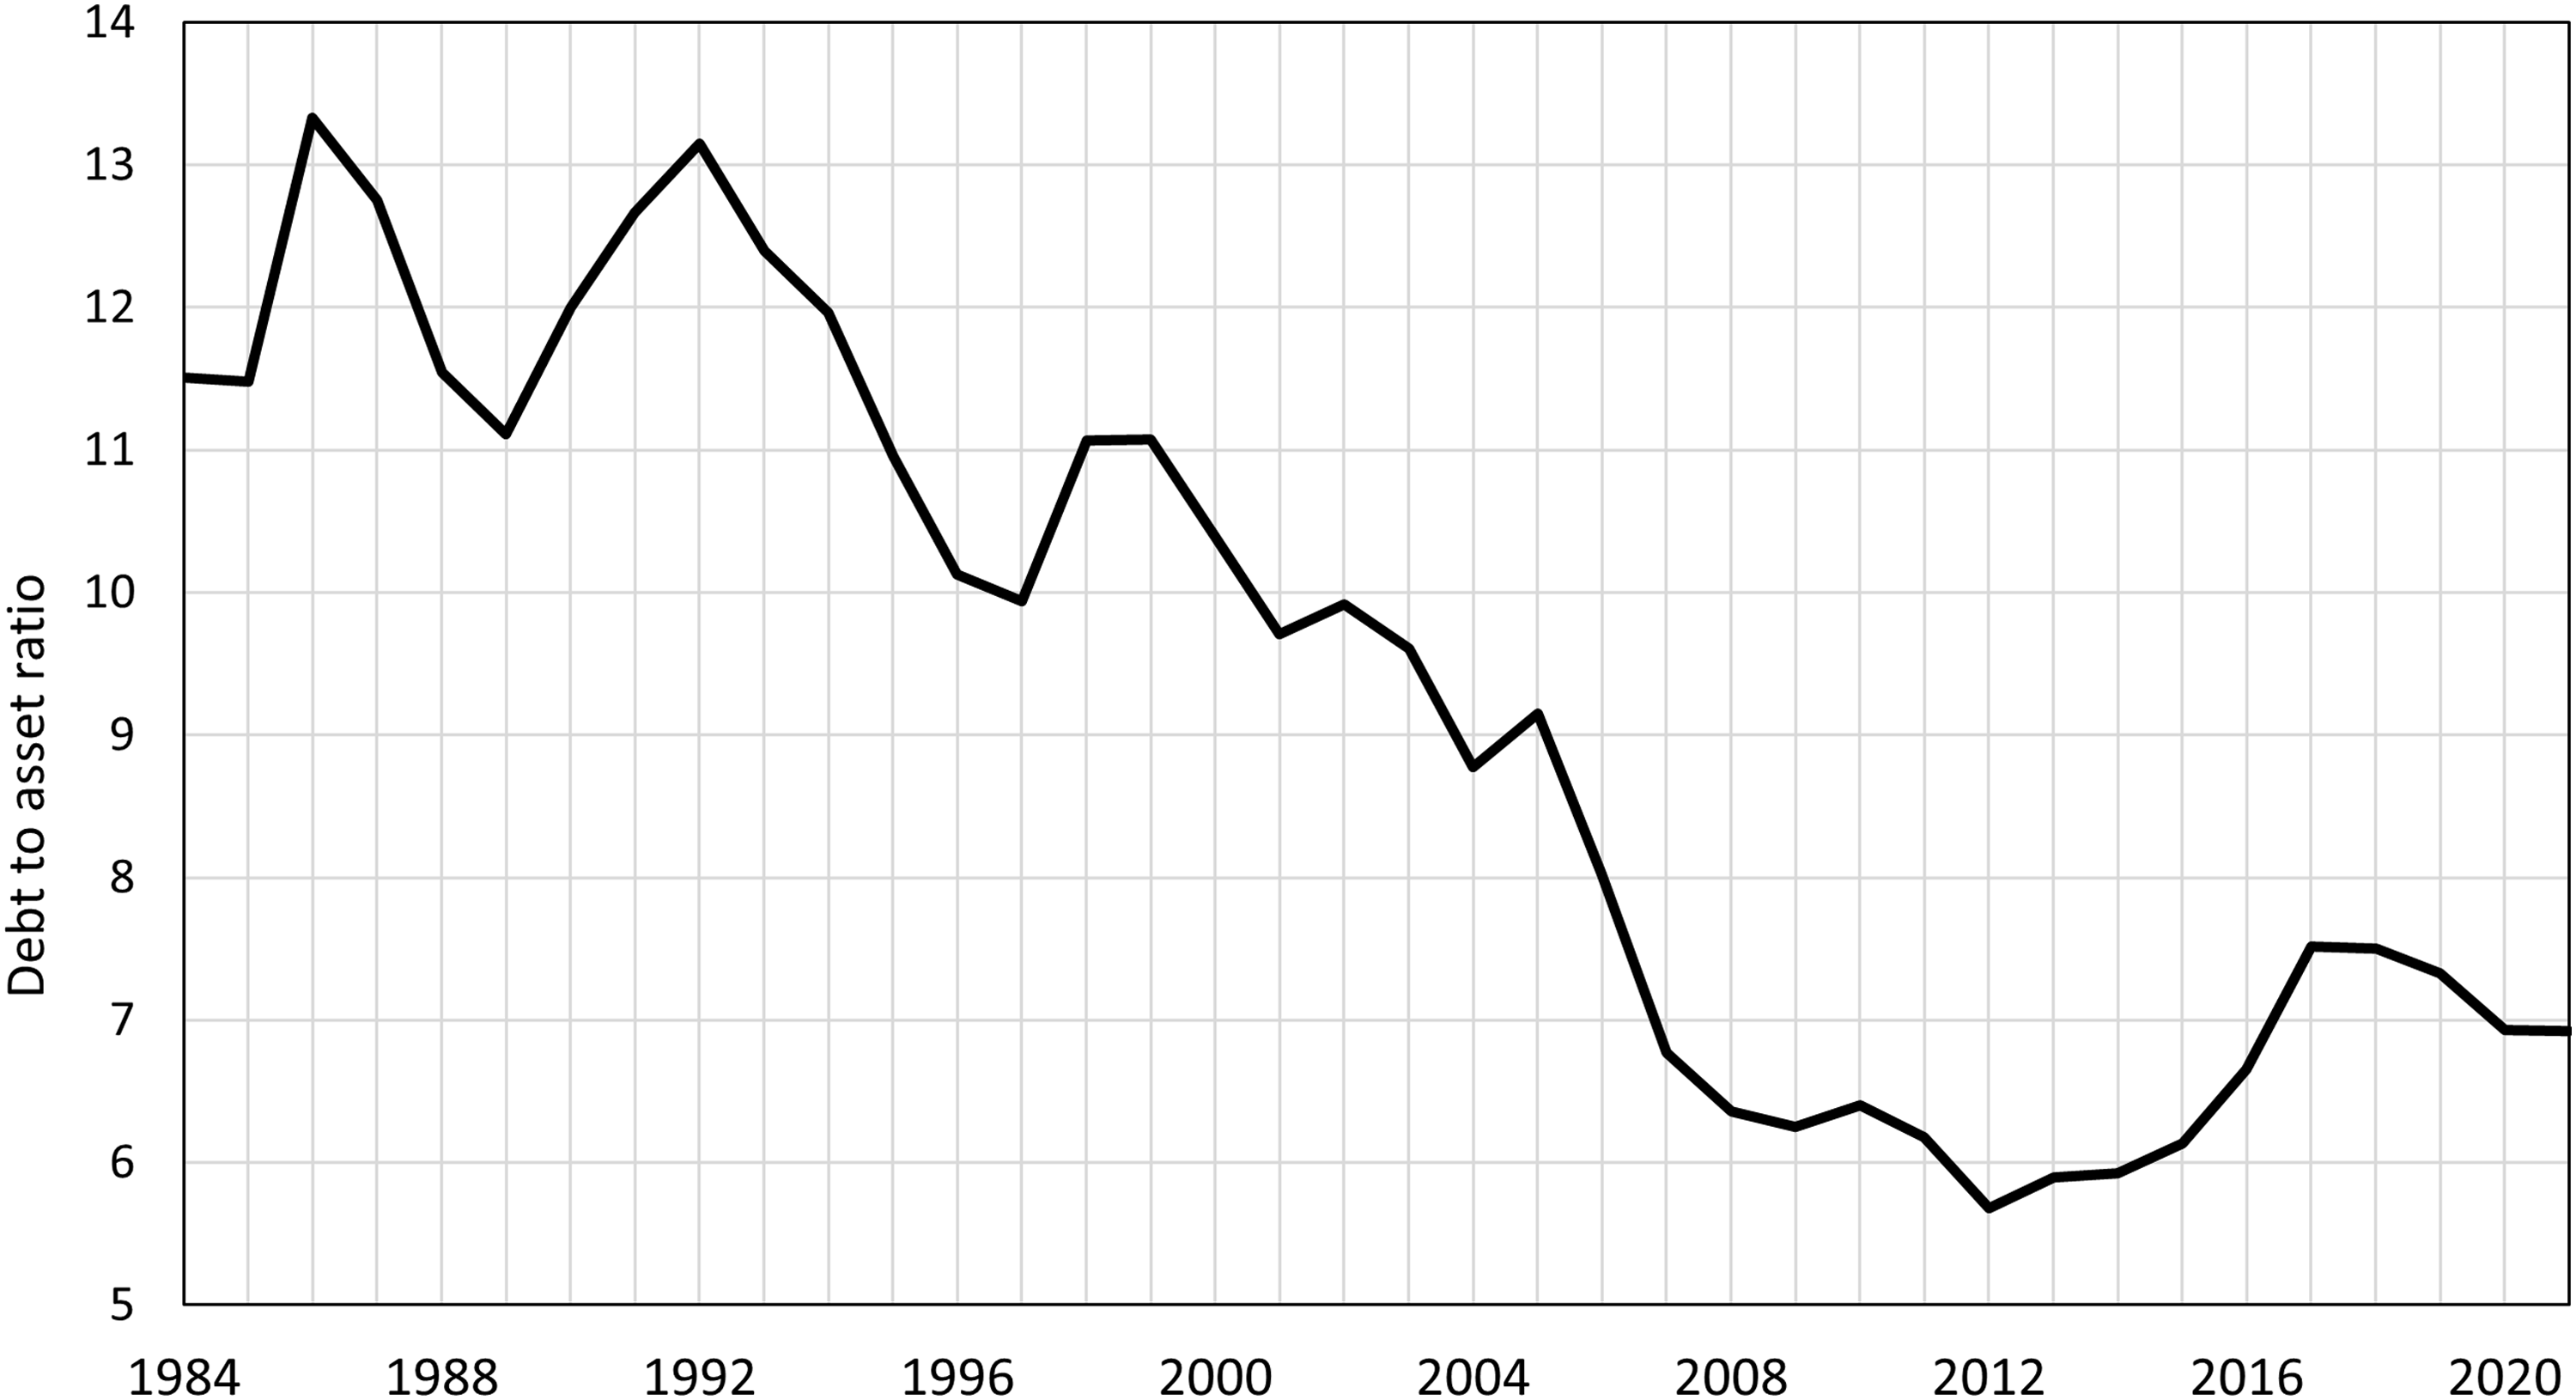
Debt to asset ratio for UK farming (1984 to 2021) (source: table 4.4 and 4.5, Aggregate balance sheet for the agricultural industry (Defra, 2022a).
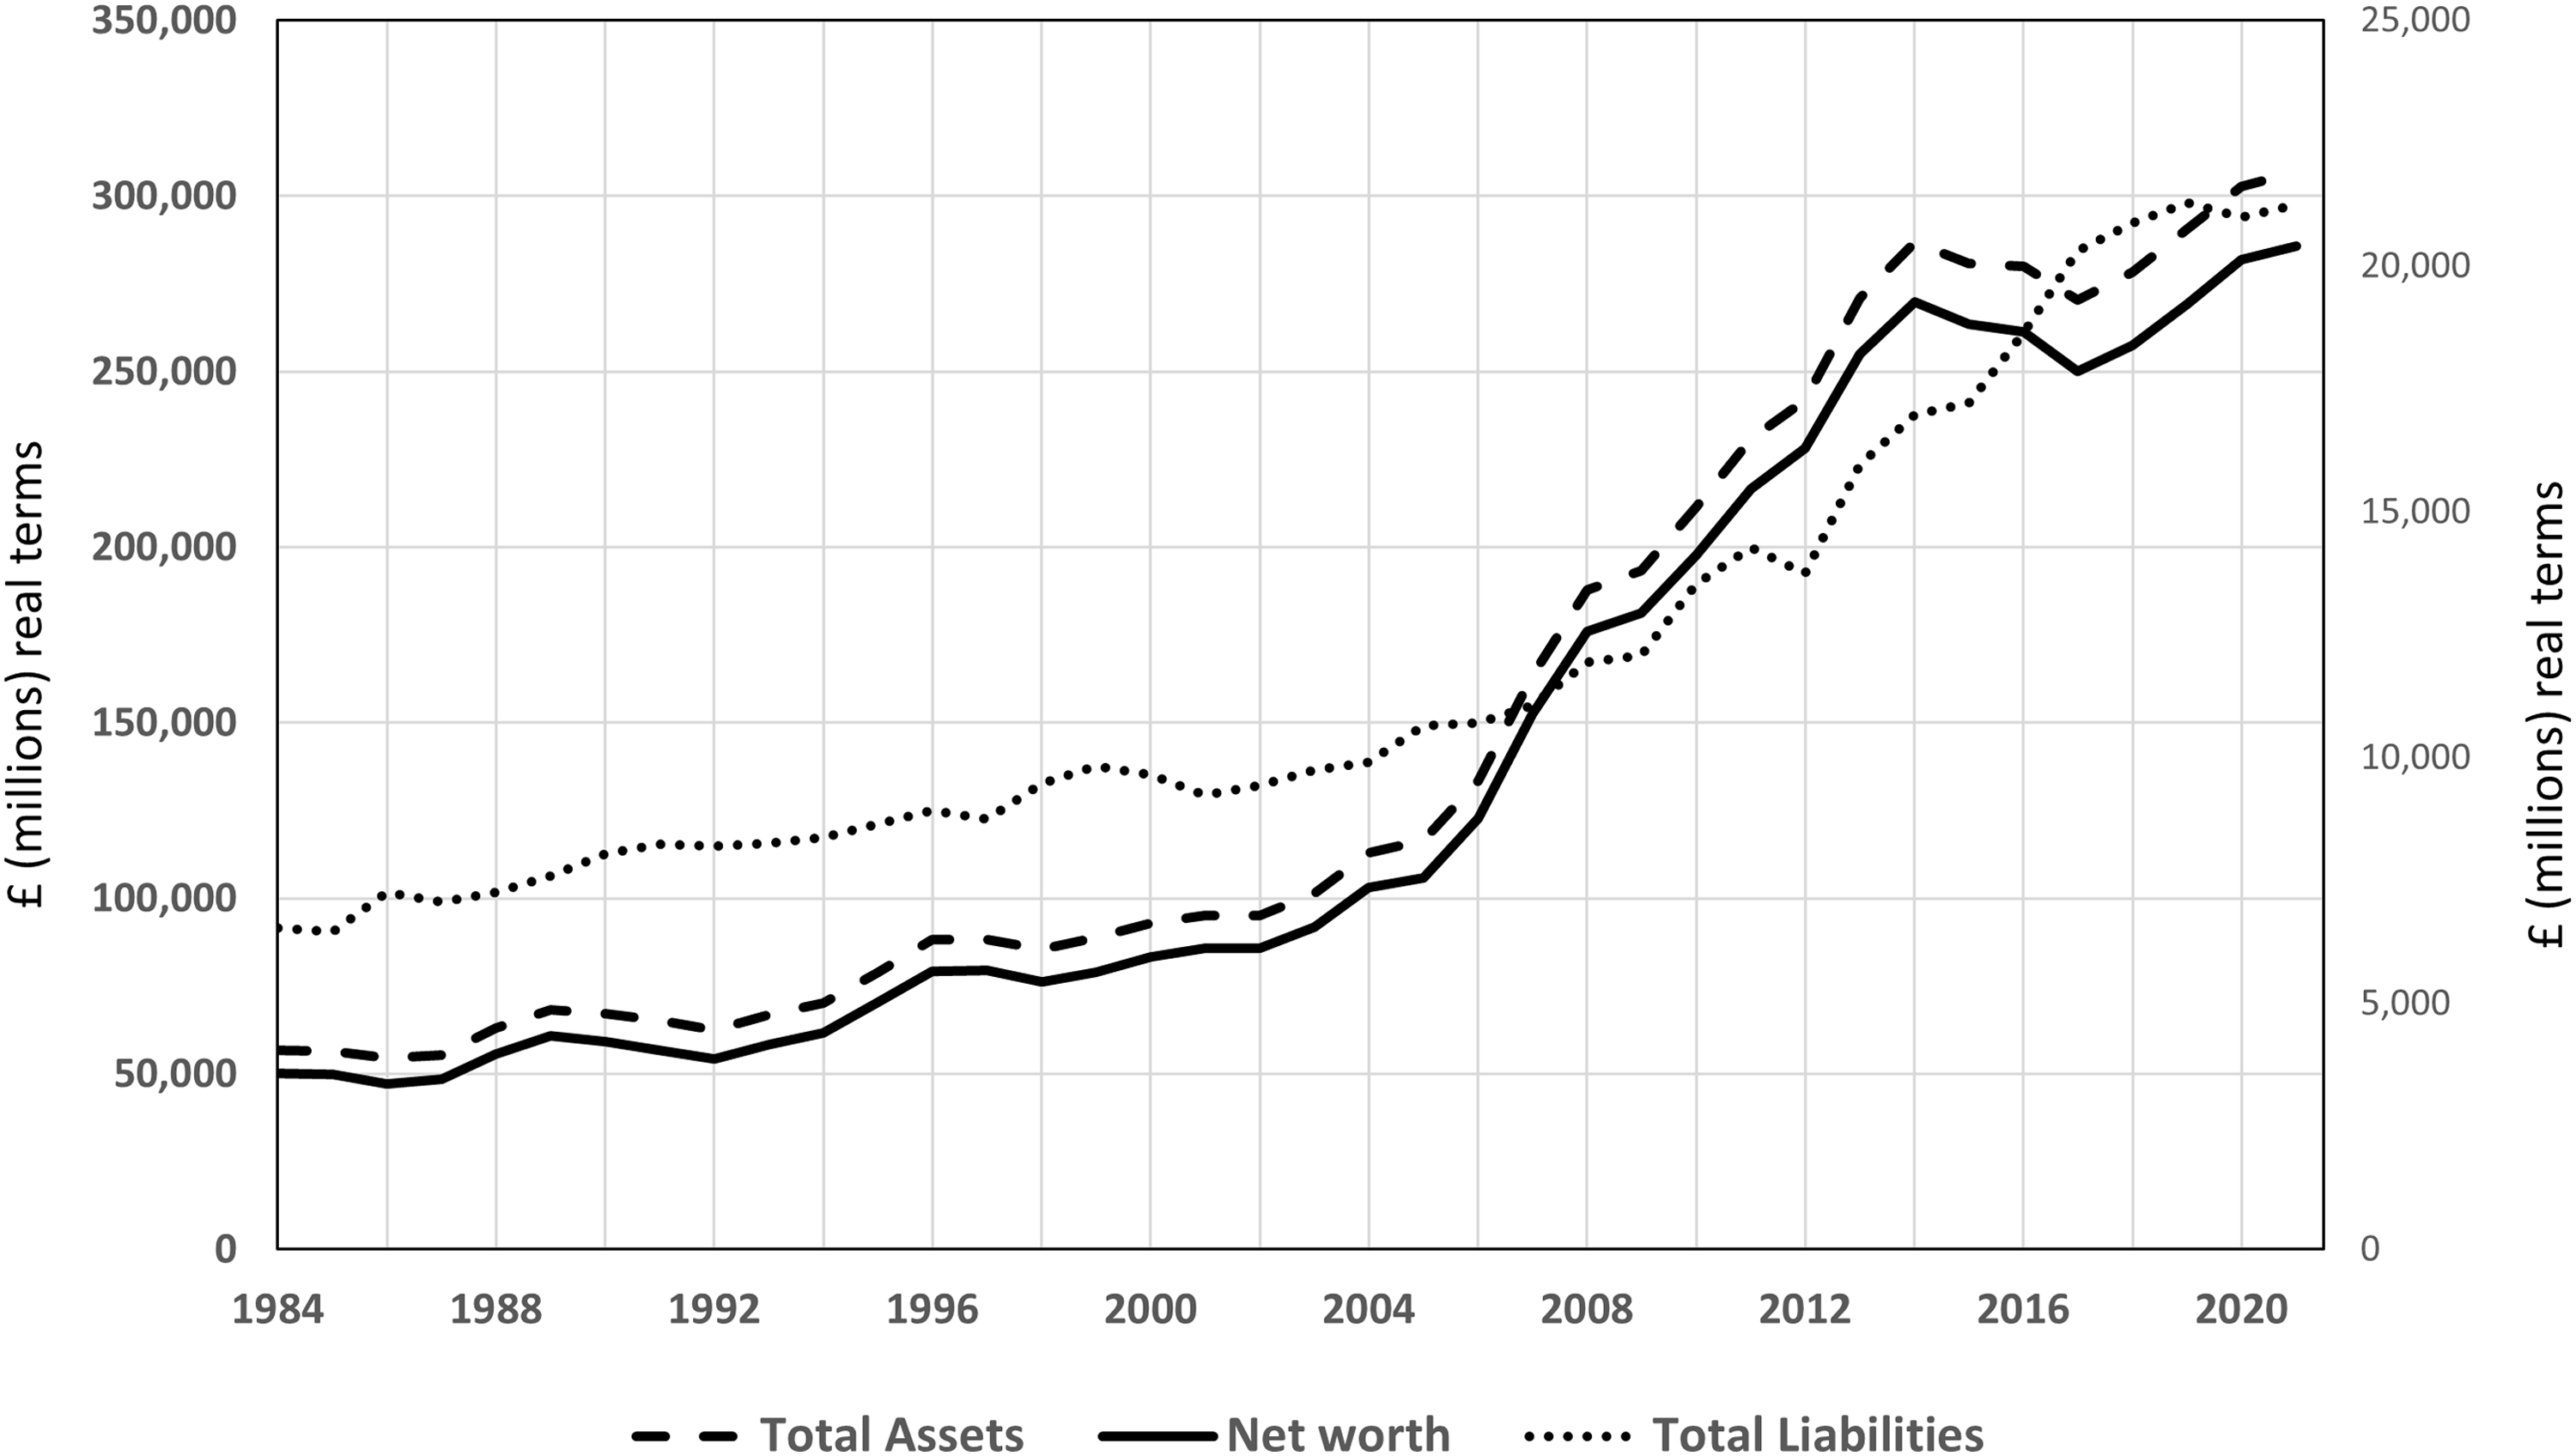
Total assets, total liabilities and net worth for UK farming (£ million, adjusted for inflation at 2021 prices) (ource: table 4.4 and 4.5: Aggregate balance sheet for the agricultural industry (Defra, 2022a)).
Harrison and Tranter (1989) surveyed farmers to investigate the principal farm business survival strategies they intended to use to meet these challenges. These included,
cutting costs, including reducing investment in machinery, using depreciation cash inflow to cover general farm costs and personal and family consumption rather than to reinvest in the business, switching from less to more profitable crops, reducing longer-term debt by substituting equity for debt and where necessary by selling assets, and increasing holdings of higher yielding and more liquid current assets.
One consequence of the long-term increase in dependency of farms on purchased inputs was that cost saving strategy of substituting hired labour with low-cost family labour—the traditional belt tightening exercise associated with family farming—was no longer an option on many farms. Moreover, only those farmers who had previously invested in depreciating capital items had the option of using the cash inflow this notionally gives rise to for covering general farm costs or personal and family consumption.
The farmer survey also revealed that only 15% of farmers had actually introduced new more profitable enterprises, and only 22% had cut out an unprofitable one: at the time of the survey over 60% of farmers made no changes to their choice of enterprises. In addition, few farmers had undertaken any large-scale financial restructuring of their business (Harrison and Tranter, 1989: 71). Only 3% of respondents planned to retire for financial reasons—which is similar to the number who might be expected to retire annually anyway (p 67). These responses suggest that despite the overall economic pressures on the sector many farms were not under serious financial stress.
Although Harrison and Tranter (1989) identified younger farmers on larger farms with “more diversified capital arrays” (p 67) as making more substantial positive adjustments and older farmers, especially those on smaller units, as making minimal changes, they concluded it was not easy to identify which individual farm businesses would survive, principally because of the uneven distribution of assets, liabilities and net worth between farm businesses, and the fact that the majority of respondents were not totally dependent on income from farming alone (p 72).
Second crossroads moment
McInerney (1998) identified a second crossroads moment towards the end of the 1990s caused by a precipitous fall in TIFF at the same time as the sector faced
2
a reduced emphasis on food self-sufficiency as indicated by
◦ lower EU commodity intervention support prices, and ◦ a reduction in import tariffs due to a move towards free trade. a continuing increase in the dependency of farms on purchased inputs when agricultural terms of trade were once again falling, “fundamental, continual, unavoidable, progressive and clearly discernible economic pressures” (p 2).
The advice that McInerney (1998, 2002) and Harvey (2001) offered to farmers had a more strategic flavour than the business adjustment strategies discussed in Harrison and Tranter (1989). McInerney (1998) argued that years of agricultural support had prevented the sector from responding to
Therefore, he expected the forthcoming reforms to result in subsidy payments making up a smaller proportion of total farm revenue and concluded that, with regret, “there is no escaping the reality that the number of farm businesses will be forced to go” (McInerney, 1998: 20).
He argued that farmers who wished to still be farming in 20 years would need to adjust to this new reality, but accepted that responses to these challenges would vary between farmers. In his view, a proportion of farms would remain competitive at world prices, and another proportion would be able to add value to their produce by marketing and selling it as, for example, “farm produced”, “farm assured” and “guaranteed traceable”. To farmers unable to follow either strategy, McInerney offered three broad strategies,
to produce alternative commercial crops for industrial use (e.g., drugs, pharmaceuticals, cosmetics, specialist oils), energy crops and bio fuels, timber, turf, Christmas trees etc., to use traditional agricultural assets and resources in non-traditional agricultural activities, such as, for example, letting holiday cottages, campsites and nature trails, and to participate in agri-environment schemes to produce “public goods” (e.g., environmental) and “social goods” (e.g., rural growth).
McInerney (1998) was clear that many of these possible adjustment strategies would not be available to every farmer. For example, options such as setting up a share-farming partnership, investing in diversified activities, or taking land in-hand would be restricted to those who had fairly substantial areas under their control and/or capital available to invest Even the possibility of off-farm employment depends on farmer's skills and the availability of local employment. However, he predicted that the structural impact of each farmer's adjustments would be fewer, bigger farms and more part-time farmers.
In the event the substantial policy changes did not materialise. Pressure from farming unions across Europe, and difficulties in agreeing a world trade agreement, resulted in the so-called Agenda 2000 reforms continuing rather than altering the direction of change in the policy reforms introduced by MacSharry in 1994. As a result, in the immediate years after the Agenda 2000 reforms subsidies actually increased as a share of total revenue (Figure 5). This indicator started falling only after the more radical Fischler reforms in 2005 that greatly reduced intervention support prices, introduced decoupled land-based Arable Area Payments, and put a ceiling on the EU agricultural budget (Franks, 2010).
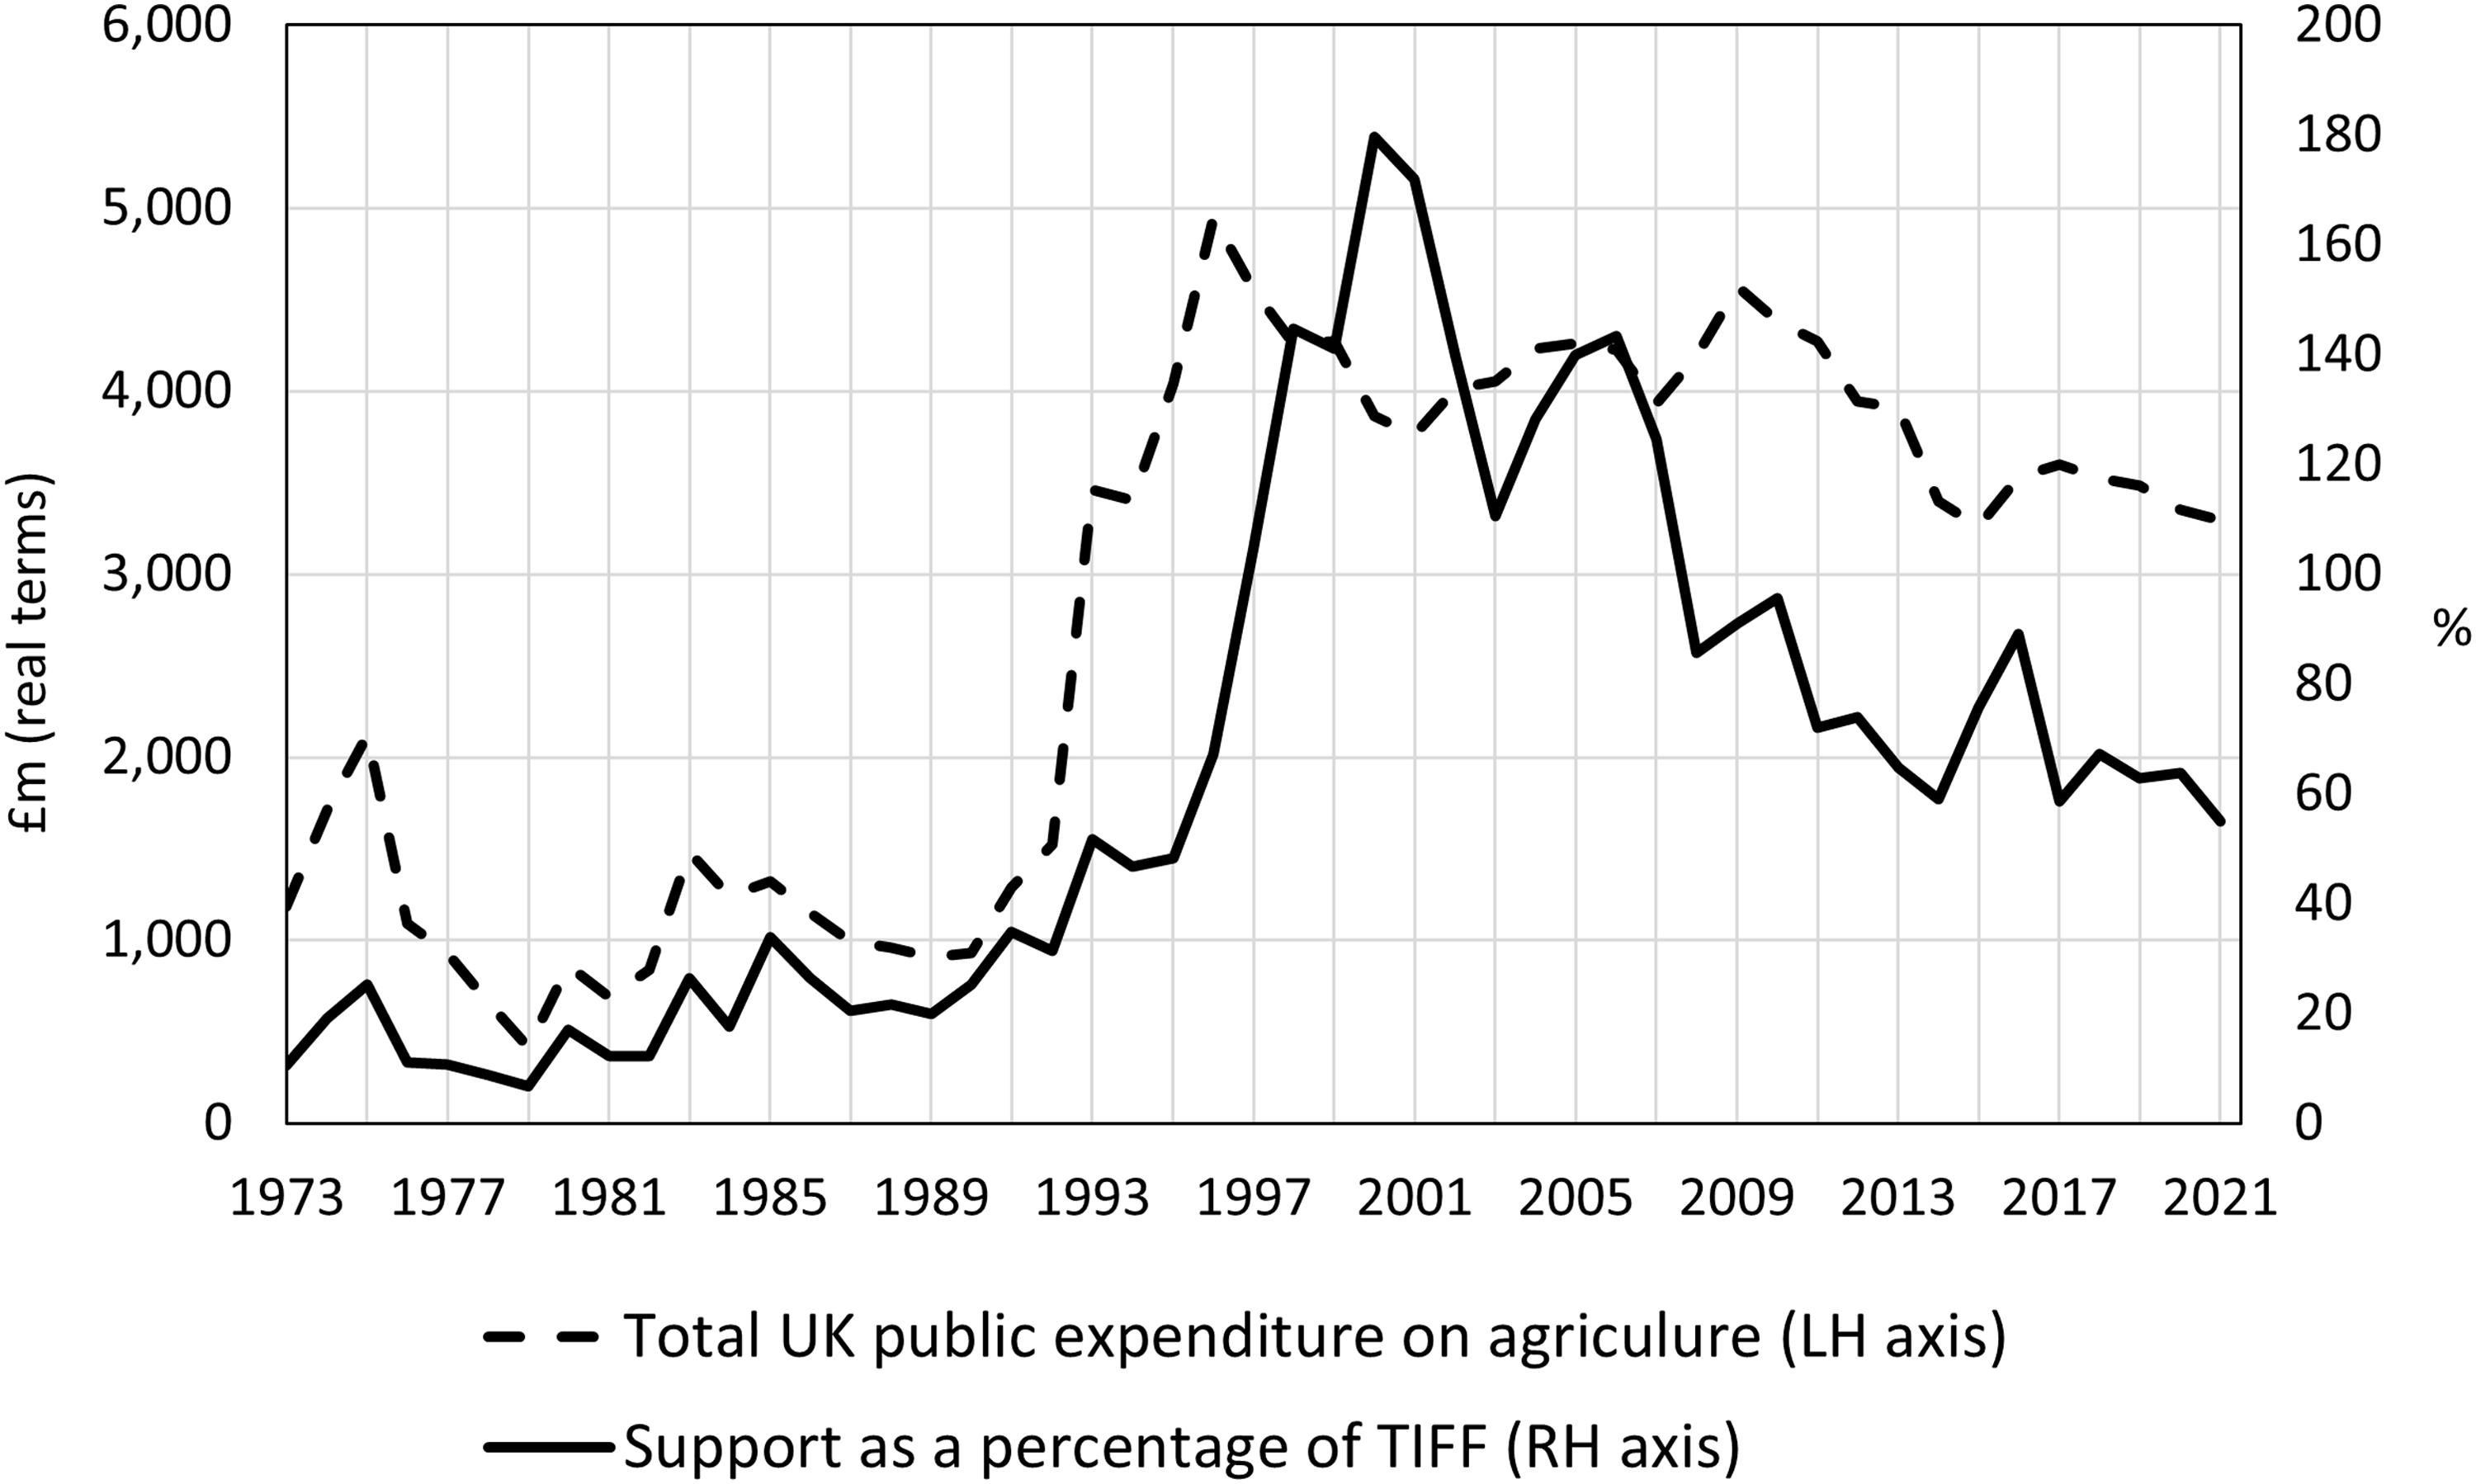
Agriculture support expenditure (£ million adjusted for inflation (2021 prices)) and expenditure as a percentage of total farm output for the UK (Defra, 2022a).
However, McInerney (1998) did correctly predict an increasing role of agricultural policy in incentivising the provision of “public” and “social” goods from land. As public and social goods are economic but not commercial goods governments need to step in when there are market failures. Of further relevance to today's challenges is McInerney's observation that there is little point focusing on increasing the proportion of home-grown food without also protecting access to inputs, such as fertiliser, pesticides, fuel and oils, which are essential for food production, and which are largely imported.
Another important aspect of Agenda 2000—which has also helped create the conditions leading to today's crossroads moment—was to continue the transfer of the costs of agriculture support from consumers to tax payers. Harvey (2001) argued that the increased transparency would sooner or later lead to the size of the EU's agriculture budget becoming noticed, and that, at some point, this would lead to these payments being limited or even eliminated. He also cautioned that a withdrawal of support payments would result in a fall in the value of farming assets, as indeed happened in New Zealand after their 1984 agricultural policy reforms when farmland prices fell by 10% for sheep and beef farmland, and by 25% on dairy farmland, by the time they bottomed out in 1987 (Lattimore, 2006). He warned that because farm asset represented their “pension fund” (p 753) UK farmers would fight for appropriate compensation, which he believed, should take the form of a lump-sum (p 753).
The current crossroads moment
The origin of the current crossroads moment lies in the need for the UK government to develop its own agriculture policy after leaving the EU. The approach chosen follows that advocated in 2005 in A vision for the common agriculture policy (HM Treasury, 2005). Key policy changes include,
the removal of all direct support payments, the lowing and eventual elimination of import tariffs on agricultural commodities, using public money to incentivise farmers to produce public and social goods, and the introduction of equipment and building grants aimed at improving the sector's productivity.
The challenges these change create have been exacerbated by high price of key inputs, (fertilisers, pesticides, fuel and oil) which, being largely imported, are subject to availability and to exchange rates. Several additional challenges—including the reduced slaughterhouse capacity leading to backlogs of finished animals on farms, and labour shortages—have in the most part been addressed through government intervention.
As many of these policy changes are being phased in, it is the unprecedented increase in agricultural input prices (Figure 5) that pose the most immediate threat to farm businesses. The index of agricultural input prices has increased by 155% since 2015. In the twelve months to April 2022 it increased by 28.4%: fertiliser prices by 150%, energy and lubricants by 60%, and straight animal feeds by 30% (ONS, 2022b). However, as Figure 6 shows the price index for agricultural outputs has also increased by a similar amount since April 2015, and by 15.7% in the twelve months to April 2022.
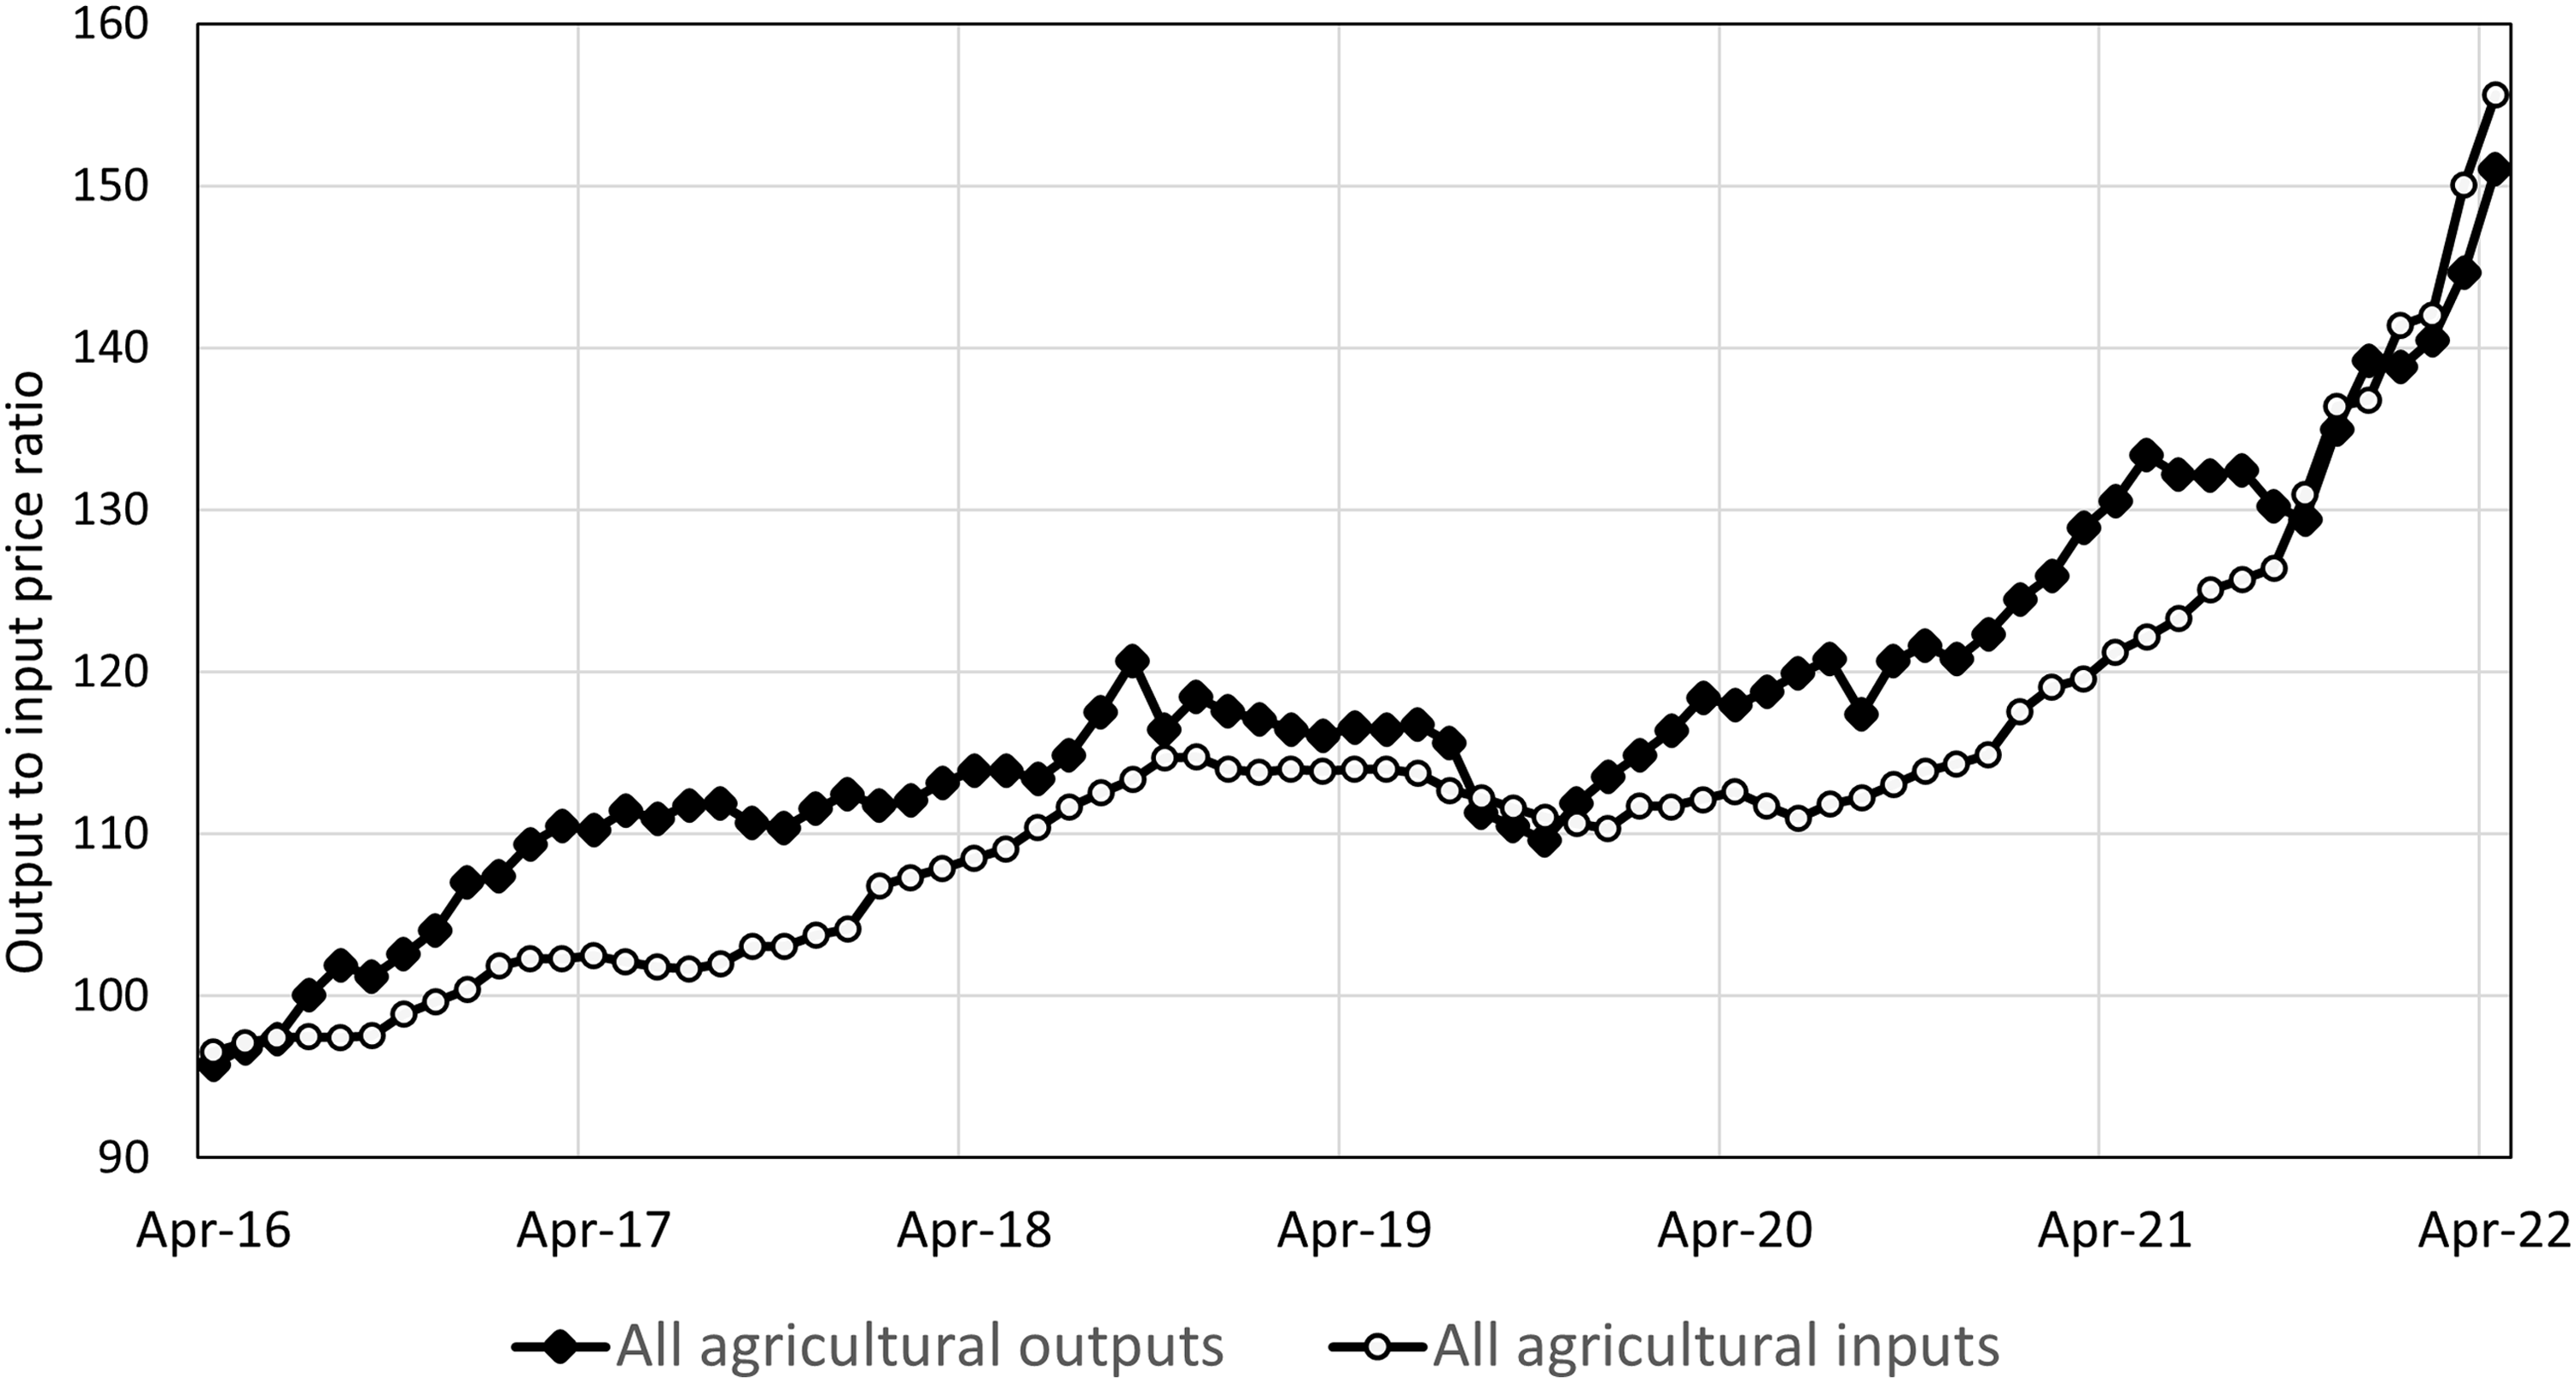
Annual average price indices for agricultural outputs and inputs for the UK to April 2022 (2015 = 100) (source: ONS (2022b)).
By contrast, the phased withdrawal of BPS over eight years poses an increasing rather than immediate threat. It is something novel and revolutionary, and has left many farmers confused. The first of the phased BPS reductions was made in the 2021 claim year, the final payment will be made in 2027. The rate at which payments are withdrawn will depend on the size of the farm's historical annual payment—“the reference amount” (Rural Payment Agency, 2020): farms with larger “reference amounts” lose a higher percentage of their BPS each year. Farmers have the option (in 2022) to exchange their remaining outstanding annual BPS payments for a single lump sum payment—up to the value of £99,875/farm 3 —in return for exiting farming (HM Government, 2022).
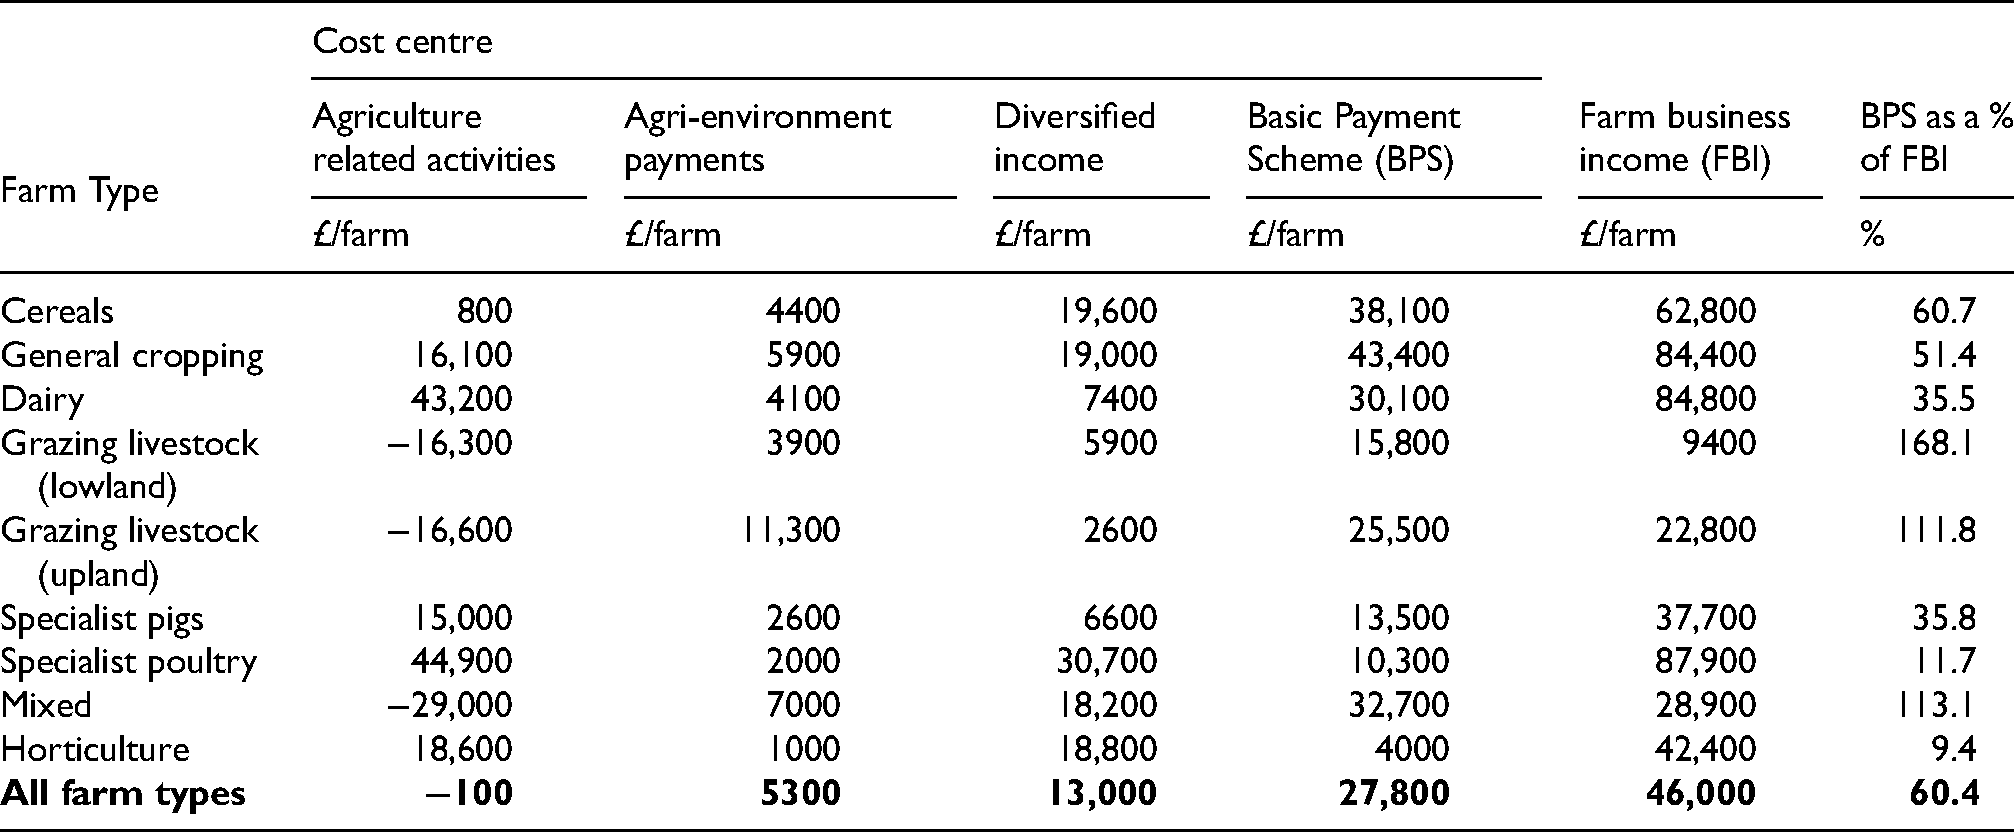
The importance of the BPS to the current viability of farm businesses is shown in Table 1. In 2019/20 the BPS accounted for 60.4% (£27,800/farm) of Farm Business Income (FBI), but this level of dependency is not equally distributed between farm types. BPS payments account for 11% of FBI on poultry farms, but for more than 100% of FBI on grazing livestock (lowland and upland) and on “mixed” (livestock and arable) farm types.
Farm business income (FBI) by cost centre 2019/20 (£/farm and BPS payments as a percentage of farm business income), England. (Source: Defra (2020a)).
On leaving the EU the UK lost its right to export agricultural produce tariff free into Europe and the UK government needed to renegotiate existing trade agreements. In 2021 it concluded a deal with Australia (DfIT, 2021) to allow the phased increase in the tonnage of duty-free (so called “within tariff quota”) beef to 110,000 tonnes/year over ten years, after which all tariffs will be eliminated. A similar arrangement applies to Australian sheep meat: a duty-free tonnage rising to 75,000 tonnes/year after 10 years, at which time all these remaining tariffs will also be eliminated. The agreement also eliminates all tariffs on dairy products in equal instalments over five years, and increases the duty-free tonnages of sugar to 220,000 tonnes over eight years. In 2022 the UK concluded a trade agreement with New Zealand along similar lines: all tariffs on butter and cheese will be removed after five years, on beef after ten years, and on sheep meat after fifteen years (DfIT, 2022).
The UK government has guaranteed the agriculture budget until the end of this parliament (which could be 2024) (HM Treasury, 2021). It will use the money withdrawn from BPS to incentivise the provision of public goods. Countryside Stewardship AES payments have been increased, and will be replaced by a new AES, Environmental Land Management Schemes (ELMS) which is planned to be rolled out across the UK in 2024 (Defra, 2022c). However, the delays in the roll out timetable has created a “funding gap” as farmers are not yet able to switch to or enter ELMS but have already lost a proportion of their BPS payment.
Moreover, in 2020 some 1.9 million hectares in England were already enrolled into AES (JNCC, 2022). This suggests farmers who wish to participate in such schemes have already done so. Therefore, to help recycle lost BPS payments, government has introduced a regionally targeted environment scheme “Farming in Protected Landscapes” (Defra, 2022f) which is not a formal AES. It is designed to support nature recovery, to mitigate the impacts of climate change, and to appeal to farmers who have no wish to participate in AES.
Farm adjustment strategies: facing the immediate pressures
The level of TIFF (Figure 1) and of gearing (Figure 3) in the years before the current crossroads moment suggests the sector as a whole is under less severe financial pressure than it was in the 1980s and late 1990s. However the current policy changes are far-reaching and though similar to those anticipated and discussed by McInerney (1998, 2002) and Harvey (2001), it is the strategies discussed by Harrison and Tranter (1989, 1994, 1995) which will be of most help in surviving the immediate challenges caused by high input prices.
Addressing cash flow problems
Some farmers will be able manage the most pressing cash flow problems by selling any unsold 2021 harvest at the current high prices (Figure 5). The survivability of many farmers will depend on for how long output prices remain high. Farmers who have recently invested in depreciable assets may be able to use the cash inflow this gives rise to pay for general farm costs and household consumption. Though as Harrison and Tranter (1989) pointed out, this can only be a short-term strategy, as higher repair costs and increased downtime reduce productivity and efficiency, and therefore competitiveness. Other farmers will draw on savings or restructure debts. Or negotiate a bridging loan to finance working capital. Or reduce money spent on inputs. Or substitute lower for higher cost inputs. Or switch from less to new more profitable enterprises.
A proportion of farmers can reduce costs by switching to use techniques commonly associated with “regenerative agriculture” (Giller et al., 2021; Magistrali et al., 2022) and “agroecology” (Benton and Harwatt, 2022). For example, direct drilling cereal crops reduces fuel and labour costs, and introducing cover and catch crops into rotations reduces expenditure on purchased fertilisers. By changing from set to rotational grazing livestock farmers can increase grassland productivity. However, there are substantial barriers to the use of these regenerative agriculture techniques including, variously, farm location, soil type and climate; the financial risk of investing in new equipment; and a lack of knowledge of managing these activities (Magistrali et al., 2022). As a result, these strategies are not available or appropriate for every farm, and there will be a learning period for many farmers who adopt these changes. As it can be expected that switching to these techniques will incur a short-term drop in yield (Giller et al., 2021), it can be challenging to reduce costs by more than any loss in the value of output (AHDB, 2022). This makes careful record keeping essential, but studies show relatively few farmers keep management accounts adequate for this purpose (Defra, 2018).
Managing debt levels and interest repayments
Although Figure 3 shows gearing at 6 to 8% is about half the level of the 1980s, total liabilities are currently higher than in the 1980s, and the uneven distribution of liabilities and net worth across farms, noted by Harrison and Tranter (1989), remains. Farm business data for England in 2020/21 shows that 20% of farms had gearing above 20% (Defra, 2022b: their figure 3.3), that 17% of farms owed more than £400,000 (Defra, 2022b: their Figure 1.5), and 15% of farms had a net interest payment above 20% of their Farm Business Income (FBI) 4 (Defra, 2022b: their Figure 5.3)—which can only be considered potentially dangerous levels.
Although current interest rates remain historically low, they have already increased six times in 2022,
5
increases that add to costs of these indebted businesses at a time when the withdrawal of BPS will reduce revenue. Therefore, for these heavily indebted farms the advice offered by Harrison and Tranter (1989: p 74) remains pertinent, “In general terms, with falling incomes and rising real interest costs, the need to move to higher equity financing is inescapable” (p 74).
However, farmers are reluctant to sell farm assets, especially land, so the extent to which many farmers will be able to restructure their liabilities when loss making replaces profitability will depend on “the attitudes, readiness to co-operate and room for manoeuvre of lenders” (Harrison and Tranter, 1989: 74).
Now, as then, these are factors beyond the farmer's and indeed often beyond the lender's control.
Farming's asset values
Gearing has fallen because of the farm asset values have increased faster than liabilities. But asset values appear to have plateaued with some evidence of a decline in real terms (Figure 3). This reduction was predicted by Harvey (2001) and observed in New Zealand (Lattimore, 2006; Sandrey and Reynolds, 1990). In Moving away from direct payments Defra (2018) argued that a proportion of the cost reductions farmers would need to make following the withdrawal of BPS would come from a reduction in farmland rents because, “as Direct Payments have led to an increase in rents, their withdrawal will see the reversal of this impact” (Defra, 2018: 28).
Rents for full agricultural tenancies negotiated between 2019 and 2020 have dropped by 2.1% in real terms, and newly negotiated Farm Business Tenancy rents have increased by less than 1% in real terms (Defra, 2022e). These reductions may assist some tenant farmers, but they also place additional financial pressure on heavily indebted farm businesses which have taken out variable interest rate loans secured against farming assets.
Farm differentiation and diversification strategies
McInerney (1998) argued that withdrawal of support would incentivise farmers to re-orientate their businesses towards value adding activities and off-farm income. Harvey (2001: 754) agreed that farmers would need to “differentiate and diversify” by “harnessing their distinctive capacities … to produce genuine products- rare, inimitable, distinctive, original” (p 767).
For example, by finding different uses for farm buildings and other traditional farming assets. Many farmers have followed their advice: it is estimated that 66% of farms now earn revenue from diversified activities (Defra, 2022d: their table 2.1, p. 24), including an estimated 10% who “process/retail farm produce”. However, these percentages have remained unchanged in recent years (Defra, 2022d: their figure 2.1, p. 22) 6 suggesting that “differentiation and diversification” markets are already highly competitive and perhaps even saturated. If, as seems likely, the majority of readily accessible markets have already been supplied and the “easy” diversification options are exhausted, then farmers who have not yet entered these markets have perhaps less incentive to do so now.
Identifying the most vulnerable farm businesses
The many key variables which vary across farms (including their existing level of dependency on BPS payments, farm debt, the diversity and value of assets owned, ability for the farm to expand where economies of scale are available, flexibility of the farm's cost structure, trajectory of profit and cash flow, past investments in the farm business, opportunities to “differentiate and diversify”, and current and potential off-farm income) make it no simple task to identify which individual farms are most vulnerable and therefore most likely to cease trading. Moreover, farmers differ in their willingness to adjust to changing market prices, policies and new technologies. However, the business's dependency on direct payments is a key guide because the majority of UK subsidy payments were decoupled from production in the 2005 Fischler reforms. This means that farmers have had over seventeen years to develop their farming system to remove any dependency on government subsidies. Table 1 shows that many farmers have not been able to do this. It is the farmers who failed to heed McInerney (1998) advice that, “[farmers must break the] habit of believing that government must be involved in influencing agricultural resource use and of accepting ‘support’ for farmers as being something quite normal” (p. 1).
These farms are also most threatened by the removal of tariffs as the costs of production of Australian and New Zealand beef and lamb are lower than in the UK (Forshaw et al., 2021). However, the phasing in of these tariff reductions creates some additional breathing space. Moreover, Australia and New Zealand currently export into closer and more lucrative markets than the UK, so it is likely that in the near future their sales to UK markets will increase only in high production years, or should access to the existing markets become difficult (Forshaw et al., 2021). However, having established a timetable for zero tariffs, it is easier for future governments to bring forward the zero tariff tonnage, which it may do if the high prices persist, to reduce food cost to UK consumers.
This paper has not considered the climate emergency to be a cause of the current crossroads moment. As the net zero carbon target is set for 2050 (HM Government, 2021) and the sector has no intermediate mitigation targets, this will only become a more pressing concern for farms which survive the more immediate challenges. However, some dairy and livestock farm types do face supply chain pressures to monitor and reduce emissions, and changes in consumer demand for meat even approaching the 30% reduction in per head consumption recommended by Henry Dimbleby (the UK food tsar) (Horton and Harvey, 2022), or the 71% reduction recommended by Greenpeace (2020), or the 81% reduction recommended by the EAT-Lancet Commission (Willet et al., 2019) would clearly exacerbate the adjustment challenges faced by livestock farmers. It would also have considerable knock-on impacts for farmers who grow crops for animal feed.
To help farmers to boost agricultural productivity and efficiency, the reforms include co-funded equipment and building grants, The Farming Investment Fund. It consists of two parts, the Farming Equipment and Technology fund (grants between £2000 and £25,000) and The Farming Transformation Fund (grants between £35,000 and £500,000). However, the average liabilities on upland and lowland grazing farms amounts to some £100,000 and 17% of these farms have gearing over 20%. Moreover, 13% of upland grazing, 15% of lowland grazing and 19% of mixed farm types have net interest payments in excess of 20% of FBI (Defra, 2022b). Therefore, it is exactly the farmers who are most in need of these new technologies and buildings who are also least able to finance the co-funding the Farming Investment Fund requires.
Impact of reforms on the population of farmers
Harrison and Tranter, McInerney and Harvey agree that the withdrawal of subsidies and border protection will result in a smaller population of farmers and larger farms. Indeed, closure of the poorest performing farms to allow the more productive to expand is perhaps the most direct and quickest way to raise sector productivity and efficiency—key aims of the policy reforms outlined in The Agriculture Transition Plan (Defra, 2020b). In a rough and ready, static calculation of how many farms may go out of business, Defra (2018) used 2014/15 to 2016/17 farm returns to calculate the effect of removing all direct payments in a single year. They estimated that 42% of farms would have made a loss. However, they suggested that if farmers used the cash inflow generated from depreciation to pay for general farm costs and consumption rather than to replace equipment it notionally gave rise to, then “only 19% of farmers would fail to cover their costs”
(Defra, 2018: 23, emphasis added).
While 19% is less than 42%, it is an interesting use of the word only. It is perhaps this estimate that resulted in the decision to phase in the withdrawal of direct payments to give farmers additional time to make the adjustments necessary to secure their businesses.
McInerney (1998) offered an alternative methodology for estimating the number of farmers the farming sector could support, assuming income parity with the rest of the economy, by dividing TIFF by the mean level of UK household income (£35,200). Applied to 2021 data, this would result in a population of 169,900 notional
However, TIFF represents the “return to all assets and working capital and to farmers’ management and labour”. Therefore some adjustment to McInerney's approach is needed to allow for returns to farming assets. To do this, land rent payments (£589m) and interest payments (£481m) are added back to TIFF to give an “adjusted TIFF” for 2021 of £6,938m. Table 2 shows the estimated notional number of
Estimation of the UK farming population assuming average household income in 2021, an adjusted TIFF, and including and excluding 2021 subsidies (at the given rates of return and assuming ratio of 1.06 full time to every part time farmer).
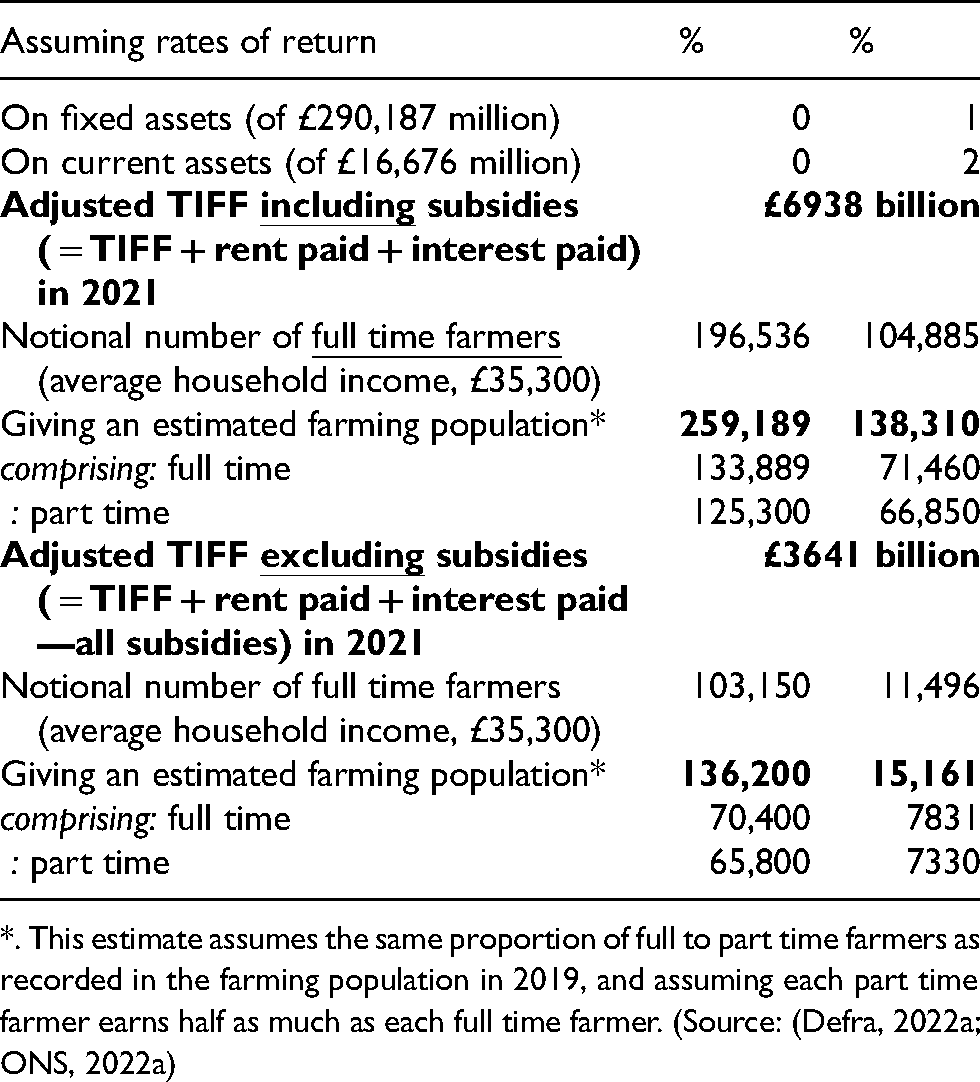
*. This estimate assumes the same proportion of full to part time farmers as recorded in the farming population in 2019, and assuming each part time farmer earns half as much as each full time farmer. (Source: (Defra, 2022a; ONS, 2022a)
If the farming sector accepted zero return on assets (that is, in effect, all land is owned and no interest is paid), and assuming each farmer earns the UK average income, the sector can support a notional number of 196,539
This calculus can be explored further. In 2021 subsidies accounted for 48% of TIFF. Table 2 shows estimates of the farming population assuming all subsidies are removed
Table 2 shows that the higher the return to assets farmers require the smaller the farming population that can be supported for any given level of TIFF. Defra's estimate of the rate of return to farming in 2019 was minus 0.2% (Defra, 2022b). Therefore, it appears that farmers who fully own their assets have developed an alternative belt-tightening exercise, rather than reducing expenditure on inputs, they are able, albeit perhaps unwillingly, to accept a zero return on their assets. Farmers who need to service debts cannot adopt this business survival strategy because they need to generate a positive return to pay the interest on their loan and repay the loan itself.
The further role of government
The future farming population will not fall to anything close to 15,161 because although BPS is being withdrawn the existing agriculture budget will be made available to farmers who wish to produce public goods, farmers will develop alternative income sources and develop innovative farming systems, which rebalance the value of output with its costs of production, and farm household income is not fully dependent on farm income. Moreover, inheritance and capital gains tax considerations will, as it does now, encourage many farmers to legally retain their farmer occupation, for example through contract farming agreements.
Nevertheless, a reduction in the farming population even approaching 23% is likely to affect the way the agricultural budget is recycled. For example, the UK Government might consider either expanding the existing “lump sum” exit scheme, which currently is only financially attractive to farms smaller than 200 ha and to farmers who wish to exit. Or it might adopt a policy used by the New Zealand government in 1984. Farms which were deemed to be commercially viable (i.e., likely to return to profitability) were offered financial appraisals and advice, and help to restructure their debt with subsidised interest rate. The government also supported farmers of commercial farms it assessed as having no hope of recovering by offering an exit package that included writing off debts and a relocation grant. As a consequence, only about 5% of commercial farmers exited farming between 1985 and 1989 as many opted to become part time (Lattimore, 2006).
Provision of additional, more directed and targeted support—or pausing or reversing the announced policy changes—has become more likely since the Agriculture Bill was passed because food security has risen up the government's agenda. The current long-standing food security policy relies on combining a strong food production base and access to global markets (Defra, 2010). However, the Ukraine-Russian war has created three threats to this strategy. It has
reduced the availability of food as exports from both waring countries have fallen, resulted in a number of other countries imposing export restrictions, which Glauber et al. (2022) estimate, have effected 16% of the global trade (in calories), and restricted the global supply of fertilizer (for which the UK was a net importer of $764m in 2019 (Statista, 2021)) and fuel, both essential inputs to UK agriculture. “In the UK, international trade has always been an important dimension of our food security, however, successful domestic production is what gives us national resilience in an uncertain world” (Defra, 2022g: 5).
Defra (2021) also recognises that difficulties securing food from global markets will be exacerbated by the increase in global demand from the predicted increase in global population from 7.7 billion to 8.5 billion in 2030. At a time when the availability of food is increasingly being affected by climate change and climate variability, and with the overexploitation of natural capital resources, including fish stocks and water resources, these global trends have made a food security policy based on purchase of food from global markets and on securing the agricultural inputs necessary to produce home grown food less sustainable. The Government Food Strategy (Defra, 2022g) suggests these factors may lead to a change in food security policy,
It would appear that a more integrated land use policy is required to ensure sufficient land is used to supply an adequate level of home-produced nutrition whilst leaving the environment in a better state year by year. This may take the form advocated by Benton and Harwatt (2022), based on a resilient agroecological system that does not offshore environmental impacts or rely heavily on manufactured imported inputs.
Conclusions
The policy changes sweeping through the farming sector are novel and revolutionary. Whilst it is self-evident that business survival depends on the ability to generate income and control costs, many farmers have been left confused and uncertain how to survive the immediate cash flow pressures caused by high input prices and loss of BPS payments. Clearly farmers will need to redirect their farm resources to more profitable use in response to changing input and output market prices, technical opportunities, and government policies. However, adjusting and restructuring businesses is costly, so farmers need to prioritise their responses by adjusting their business to meet the immediate short-term input price shocks and using the time available from the phasing in of the policy changes to prepare for the effects on their business from the underlying, relentlessly persistent economic forces that the policy reforms are likely to unleash.
The adjustments will vary with each farm. Many farmers will switch to new farming enterprises and practices. Others will explore diversification activities but may find them already well served. Others may lower costs by replacing purchased inputs with new approaches to soil cultivation and fertility building crops, their difficulty will be to do this without reducing the value of outputs by a greater amount than the reduction in expenditure. This is not always easy, and as it requires detailed farming records, for many it will not be possible. Farmers who have recently invested in depreciable assets may be able to use the cash inflows generated to support the farm and farming family. However, this can only be a short-term strategy. The long-term increasing dependency on purchased inputs and increased farm business specialisation means fewer businesses are now able to substitute family for hired labour. However, it appears this strategy has been replaced by a willingness to accept low returns to owned assets on farms with little or no debt to service.
Many commentators, and indeed Defra's estimates, suggest not all farmers will survive these challenges, and expect a new farm structure of fewer, larger farms, with more part-time farmers to emerge. Given the many factors that determine whether a farm will survive it is not easy to identify the individual farms which are most vulnerable. But after some seventeen years of decoupled payments those farms that are still heavily dependent on BPS payments seem the most vulnerable. These are largely but not exclusively upland and lowland livestock farms and grazing farms. The advent of low cost Australian and New Zealand food imports and any significant reduction in consumer demand for meat products will only add to the economic pressure these businesses already face.
Footnotes
Declaration of conflicting interests
The author(s) declared no potential conflicts of interest with respect to the research, authorship, and/or publication of this article.
Funding
The author(s) received no financial support for the research, authorship, and/or publication of this article