
Abstract
This paper examines the learning process by which farmers come to a decision to use newly introduced seeds which were promoted through demonstration plots in midwestern and eastern regions of Uganda. Framed as social and material interactions, we investigated the learning process of the demonstration plots using data from focus group discussions, interviews and a survey amongst 983 individuals. The results reveal several constraints that impede learning, resulting in an overall low awareness and adoption of the introduced seeds. Some of the most prominent constraints resulted from the selection of location and demonstration plot host, the distance of agro-dealers, at district headquarters, limited interactions amongst farmers and irregular involvement of farmers in the demonstrations. Moreover, the prominent role of agro-dealers at field days suggests that informing farmers about where to buy seeds was considered more important than explaining farmers how to grow these seeds profitably. This commercial focus of field days and demonstrations plots had negative consequences for the social learning. This paper contributes to the learning and adoption literature by showing that interactions amongst actors can improve or reduce the balance between didactic, social and environmental learning.
Keywords
Introduction
There is a continuing effort amongst donors to stimulate adoption of improved varieties amongst African farmers through information dissemination and seed distribution. Improved varieties are key to increased yields, higher income and sustainable food security. Despite efforts to disseminate information about the benefits of improved seeds, overall adoption rates of introduced seeds remain low (Bold et al., 2017; Duflo et al., 2011). For adoption to take place, awareness of a new technology, in particular its potential benefits, is an important condition (Foster and Rosenzweig, 1995; Shikuku et al., 2019). To overcome information constraints, extension is crucial (Anderson and Feder, 2007; Davis, 2008; Pan et al., 2018). Development initiatives such as the Alliance for a Green Revolution in Africa (AGRA), national governments and researchers apply a variety of approaches to disseminate information to bridge the information gaps (Lambrecht et al., 2014). Most projects employ a combination of demonstration plots for on-farm experiments, direct communication between project staff and farmers, and mass media, in recent years increasingly focused on mobile phone applications. Employing a variety of channels for information distribution is based on a linear reasoning about the way information leads to awareness, learning and adoption. The overall assumption is that producers of a technology, public breeding institutes and seed companies in the case of improved seeds, is the primary source of information. Awareness about new seeds is, in such linear reasoning, the most important trigger for learning and adoption by farmers. In this paper we challenge this assumption and have a closer look at learning in a seed distribution project in Uganda.
The importance of learning is widely acknowledged in the literature on agricultural extension, and most studies include social interactions as a key component. Moser and Barrett (2006) observe that learing effects from extension agents and other farmers both substantially influence adoption decisions. Adegbola and Gardebroek (2007) show that these influences are not the same: farmers informed by other farmers make different adoption and modification decisions than farmers informed by extension agents. Other studies show that the effectiveness of training depends on the specific nature of the relationship between trainer and trainee. Buck and Alwang, 2011 demonstrate that formal training is more effective for farmers who have more trust in agricultural technicians. Relatedly, BenYishay and Mobarak, 2019 conclude that farmers find information from other farmers more compelling if they share a group identity with them or face common agricultural conditions. In sum, people seek out others like themselves who have already adopted an innovation to overcome the uncertainties related to adoption (BenYishay and Mobarak, 2019; Buck and Alwang, 2011; Rogers, 2003; Stone, 2007). However, few studies specify the full variety of social actors and the different learning dynamics this implies.
The common understanding of learning is the processing of information into new knowledge, increased skill or changed routines. Social learning implies that interaction is a rich source of information from which learning evolves. Stone (2016) identifies three types of interactions in agricultural development contexts. The first are interactions between farmers resulting in social learning. Important social dynamics by which farmers learn from each other are a sense of being part of the group, leading to copying peers, and a sense of hierarchy, leading to copying prestigious individuals in the group. The second type of interaction is didactic learning, the processes by which external agents transfer information to farmers. The main categories of didacts are government (extension) agencies, commercial companies and non-governmental organisations, each in their own way ‘acting primarily out of their own interests while claiming to act in the farmer's interests’ (Stone, 2016, 10). Didactic learning thus aims for particular outcomes and a variety of methods can be employed to persuade farmers to inform themselves and try things out in their fields. The third type of interaction, environmental learning, is about farmers acquiring information from their fields. Through observation and interpretation of what happens to the crop in a field, farmers attribute certain observed effects to particular crop varieties, leading to a follow-up decision for the next growing season. Contrary to the linear reasoning mentioned above, Stone's framework does not attribute an a priori value to the various sources of information. For most technology introductions, all forms of learning take place in some way and which interactions, as sources of information, dominate in the learning process, and if and how that leads to adoption, are empirical questions. In other words, the distinction between learning types is an analytical lens that provides a better view on the roles and positions of development actors, farmers and the crops as material actors (Glover et al., 2017).
Many studies on seed distribution and adoption apply statistical tools and models to analyse factors leading to adoption or rejection quantitatively (Beaman et al., 2018; BenYishay and Mobarak, 2019; Dimara and Skuras, 2003; Ghimire and Huang, 2016; Khonje et al., 2015; Manda et al., 2018; Shikuku et al., 2019). These quantitative studies provide useful insight in distribution patterns and correlations between the distribution of an innovation and other indicators, for example household characteristics, farm assets or selected agro-ecological factors (Beaman et al., 2018; BenYishay and Mobarak, 2019; Shikuku et al., 2019). While results are highly context specific, generally higher human, natural and physical capital is associated with higher adoption rates. Qualitative studies provide relevant additional insight in the underlying interaction processes and local dynamics by which farmers include, adjust or reject the innovation offered to them (Almekinders et al., 2019; Glover et al., 2016; Westengen et al., 2019). These interactions and local dynamics are important because they constitute a major part of farmers’ learning process, resulting in locally specific adoption patterns. The overall picture emerging from these studies is that the adoption process is not straightforward and complex to understand (Glover et al., 2016). In addition, the demand for seed is context-specific and influenced by the nature of the farming system and the importance of the crop/variety in this system, a farmer's social position, market linkages and agro-ecological conditions (Almekinders et al., 2019; Westengen et al., 2019).
The main question addressed in this paper is how learning processes shape the uptake of improved seeds. We use Stone's conceptualisation of the learning process to provide an explanation for the overall low adoption rates in the case of a seed promotion project in Uganda. We combine results from a large quantitative survey about the distribution of the newly introduced seed varieties with results from a qualitative analysis of the way the seeds were introduced, tried and used by farmers. In the project, demonstration plots were the nodal point of the learning process. A demonstration plot is usually set up by external agencies (didacts) to make farmers see ‘with their own eyes’ what a new technology can do to increase yield or other pursued benefits. Although in principle a farmer can visit a demonstration plot at any moment, most projects set and announce specific moments, called field days in the presented case, at which farmers, input traders, extension officers and other relevant experts are expected to come together. A well-organised field day can be an effective instrument for didactic, social and environmental learning. However, there are limits to what can be learned when farmers visit demonstration plots. Demonstration plots thus anticipate a follow-up of social learning between farmers and additional environmental learning in the farmers’ fields.
Materials and methods
Study area and project studied
The study was conducted in four districts in Uganda, Tororo and Iganga in the eastern region, and Masindi and Hoima districts in the midwestern region. Funded by AGRA through the Tegemeo Institute of Agricultural Policy and Development, a local seed company conducted a seed promotion program in this area. From each of the four districts, two sub-counties were randomly selected for setting up demonstration plots to promote new seed varieties of maize and common beans in combination with improved crop management practices. Within each of these eight selected sub-counties, two demonstration sites were set up, based on geographical spreading. The demonstration plots targeted to reach households within a radius of 30 km. Field days were conducted at the demonstration sites during harvest season in two consecutive cropping years (2014/15 and 2015/16).
The seed company, demonstration plot hosts, and agro-dealers were key actors in establishing the demonstration plots and making the seeds available. Agro-dealers, seed company staff, extension agents and farmers were invited to participate in the field days. Demonstration plots hosts had a role to invite farmers to the field days. In addition, radio announcements were made to inform farmers about the field days, its location and time to take place. The seed varieties promoted were the maize variety PH5052 (hybrid) and the common bean variety NABE15 (open pollinated). According to the seed company, these varieties have high-yield potential, are drought tolerant, and have a short maturity period. PH5052 is resistant to northern leaf blight and maize streak virus, and tolerant to grey leaf spot. NABE15 suits all regions, is resistant to Anthracnose, bean rust and halo blight and tolerant to root rot, common bean blight and angular leaf report. The variety has higher levels of micronutrients and shorter cooking time.
Research approach
We used an explanatory sequential mixed-methods approach, combining collection and analysis of qualitative and quantitative data. Quantitative data collection and analysis preceded the qualitative data collection, and we used the latter to trace the ‘stories behind the figures.’ The quantitative and qualitative phases are connected through an intermediate stage in which the results of the quantitative data analysis guided the data collection in the second phase. The selection of the participants for the qualitative follow-up analysis and the qualitative data collection protocols were grounded in the results from the quantitative phase.
Quantitative data
We collected quantitative data to assess the success of the seed promotion project in terms of awareness of the activities, participation, and awareness and knowledge of the promoted technologies. We extracted data on the number of demonstration plots established and field day attendance from technical project reports. These reports were written by project staff after each round of field days. In addition, we executed a panel survey amongst households who lived within 30 km of a demonstration plot. From each sub-county with demonstration plots, 7 villages were randomly selected, and from each of these villages, 10 households were randomly selected for interviews. These households were approached on three different occasions: in October 2014, just before the start of the project, October 2015, and January 2017. When households refused to participate, were not available or ceased to exist, replacement households were selected. The number of households interviewed is: 1069 in the first year, 1078 in the second year and 1022 in the third year. A total of 983 households were reached in all the 3 years, resulting in an attrition rate of 11.8%.
Trained enumerators used the same structured questionnaire for the interviews during each survey round (see (Kamau et al., 2018) for the full questionnaire). In most cases, enumerators interviewed both the household head and their spouse. If there was no spouse, a second adult male/female involved in making decisions in the household was interviewed, if present. The household head was interviewed about household composition, crop production, livestock production, income (farm and off-farm), assets and credit. Data on crops cultivated, promoted varieties and area allocated were collected for the previous 12 months (two growing seasons). Questions covered project awareness and participation, awareness and knowledge of the varieties promoted by the project totalling to 1366 observations in the first survey, 1644 in the second survey and 1821 in the third survey.
Awareness questions focused on demonstration plot, field days, improved maize and bean varieties. If they respond positively to the question about awareness of the demonstration plots or field days organised by the seed company, farmers were asked whether they visited the demonstration plot or attended the field day. If they were aware of any improved seeds, they were asked to name the varieties. Further questions were then asked about each promoted seed and the instructions about crop management given at field days. Answers given indicated awareness and retention of promoted seed details. Data on varieties planted was captured on the crop production data for each plot and season.
Qualitative data
The qualitative data were derived from 16 focus group discussions (FGD), 13 farmer interviews, 16 interviews with demonstration plot hosts and 18 expert interviews. The FGD and farmer/host interviews were held in the villages hosting a demonstration plot. The interviews and FGDs were conducted by the first author with assistance of a local research assistant from each district. The interviews were held individually. Data were recorded in audio and detailed notes.
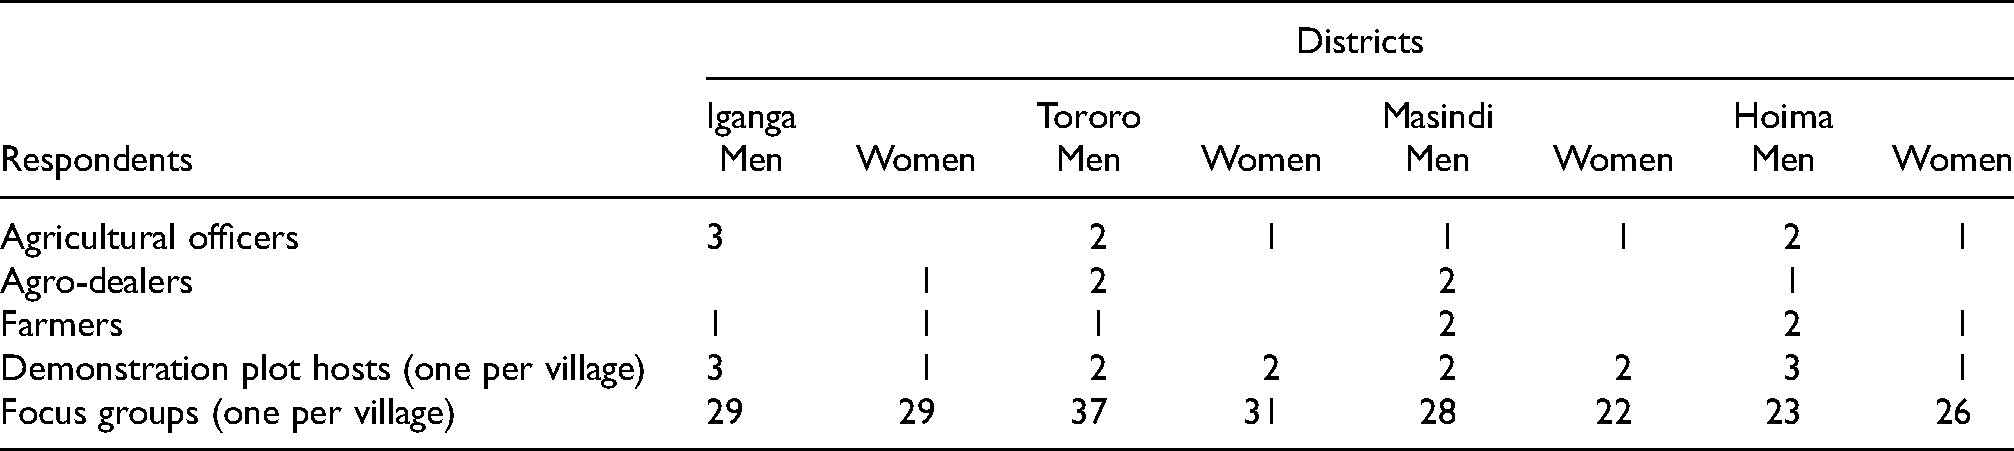
One FGD was held in each village with a demonstration plot. We planned to invite 8–12 participants per village. However, in practice the number ranged from 8 to 25 participants. Invitations to participate in a FGD were sent through the village elder. The village elder was asked to include an equal number of men and women, as well as people under the age of 35 years (Table 1). A central location was selected to hold the FGD where the participants could easily gather and interact. Using an interview schedule, the conversation was prompted by asking questions to the group. Generally, the conversations flowed naturally, and no participants dominated the discussion. Follow-up questions were posed depending on the answers given by the participants. The questions covered involvement in the creating awareness of improved seeds, selection of the farmer hosting the demonstration plots, visits of the demonstration plots during ‘field days’, what was observed in the demonstration plots, and what was taken from the plots to the farmers’ fields. We also inquired about what hindered farmers from visiting demonstration plots, attending field days, and sowing the new varieties. The full FGD schedules are available in the appendix.
Number of interviewees by category.
We selected a subsample of 13 farmers for in-depth interviews from those farmers that, in the quantitative database, showed awareness of the demonstration plots, field days and promoted seeds. In addition, we interviewed all 16 demonstration plot hosts. Farmers and the demonstration plot hosts were asked about their involvement in the demonstration plots and field days, their perception of demonstration plots/field days, the performance of the distributed varieties and other relevant qualities of the varieties.
Expert interviews consisted of seed company staff, agro-dealers, and agricultural extension officers both at district and sub-county levels. However, very few agricultural extension officers were involved in the implementation of demonstration plots and field days (Table 1). The selected seed company staff was responsible for establishment and maintenance of the demonstration plots. The interviewed agro-dealers were asked about their interactions with farmers, their involvement in selecting demonstration plot hosts and establishment of demonstration plots. All interview schedules are available in the appendix.
Data analysis
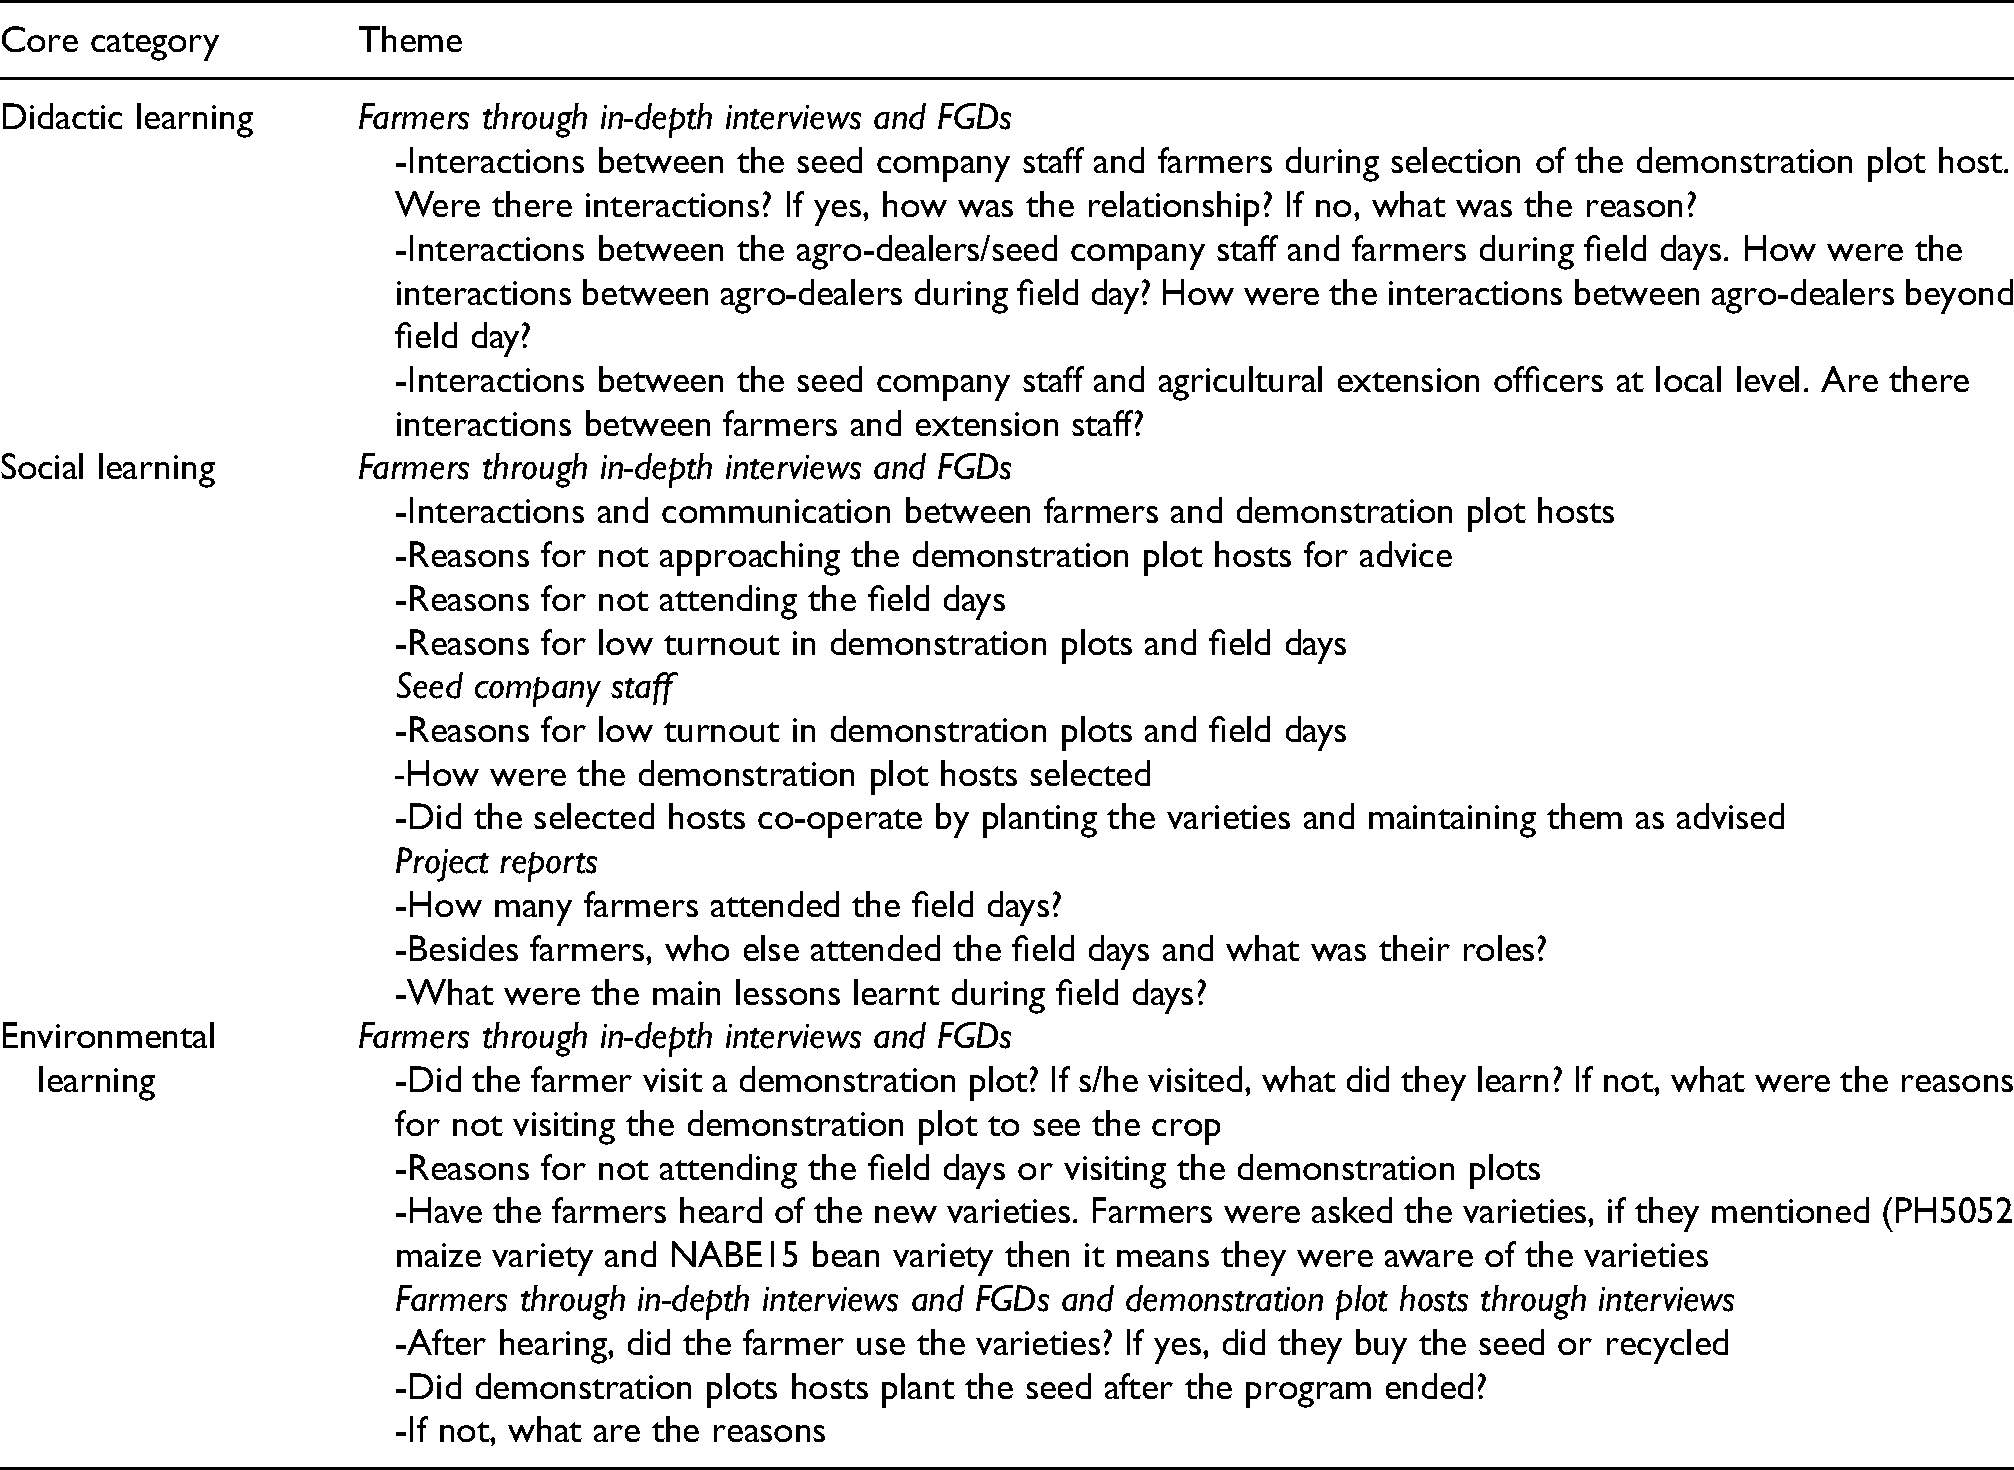
Survey data were analysed by calculating the percentage of farmers who visited demonstration plots, were aware of the plots or the promoted varieties and adopted the promoted seeds. In addition, we calculated the average number of knowledge questions about the promoted varieties that farmers with awareness could answer correctly. We calculated the project-related indicator for the second and third survey rounds, which covered the first and the second project years. The technology-related indicators were calculated for all three rounds so that we could assess progress over time and compare knowledge and awareness pre-, during- and post-project. Qualitative data were coded manually and in Atlas.ti, and analysed along the themes in Table 2. Descriptive or topic coding was applied to transcriptions from the FGDs and interviews.
Themes in the data.
Characteristics of the farmers in the study
A general overview of the main farm activities is provided in Table 3. Besides these farm activities, other income generating activities were mentioned, for example, motorbike taxi services, beer brewing, small businesses/trading and wage labour. Main decisions about crop production were made by the household head, who could be a man or a woman. Men were more involved in maize production, a crop usually planted for sale, whereas women were more engaged with bean production, a crop mainly planted for home consumption. The farmers employed both monocropping and intercropping on their fields. Maize was mostly intercropped with pulses (e.g. common beans, cowpeas, groundnuts or soybeans). Pulses were also intercropped with cassava and sugarcane.
Involvement of farmers in crop and livestock production.
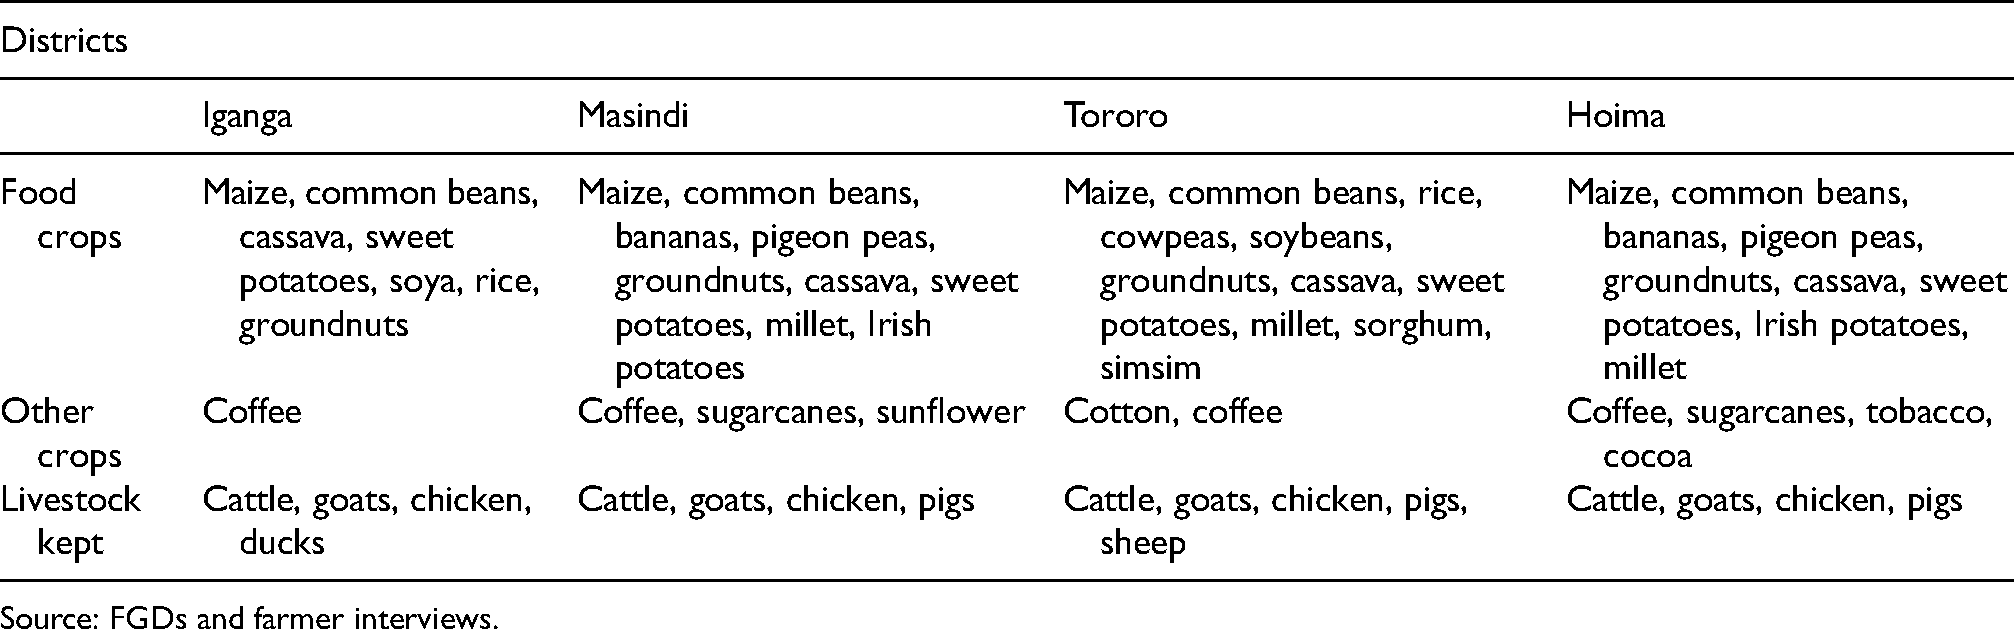
Source: FGDs and farmer interviews.
Results
The organisation of the didactic learning process: The implementation of the demonstration plots
The didacts in the program were seed company staff, extension officers and agro-dealers with the seed company taking a leading role. The seed company was responsible for selection and training of the demonstration plot hosts, establishing and monitoring the plots, and providing inputs. In 2014, they identified potential demonstration plots based on suitability, identified and approached the landowner, and drew a list of those willing to host. The final hosts were then randomly selected from the list. Demonstration plot hosts were asked to set aside 1 acre of their land for demonstration plots, 0.5 acre for the new maize variety (PH5052) and 0.5 acre for a new bean variety (NABE15).
The seed company provided the demonstration plot hosts with 5kgs of seed of PH5052 and NABE15 each and fertiliser (e.g. 25kgs of DAP, 25kgs of UREA for maize and 25kgs of NPK171717 for common beans). The seed company staff trained demonstration plot hosts in land preparation, plant spacing and fertiliser application. They returned a month after planting to monitor the crop performance and deliver the top-dressing fertiliser (Table 4). The return visit was also used to train demonstration plot hosts on weeding, top dressing and pest control. To increase the awareness of the demonstration plot and the variety on the plot, a signpost was erected on each demonstration site indicating the variety planted, recommended spacing, maturity period and expected yield.
Seasonal calendar for the demonstration plots and field days as planned.
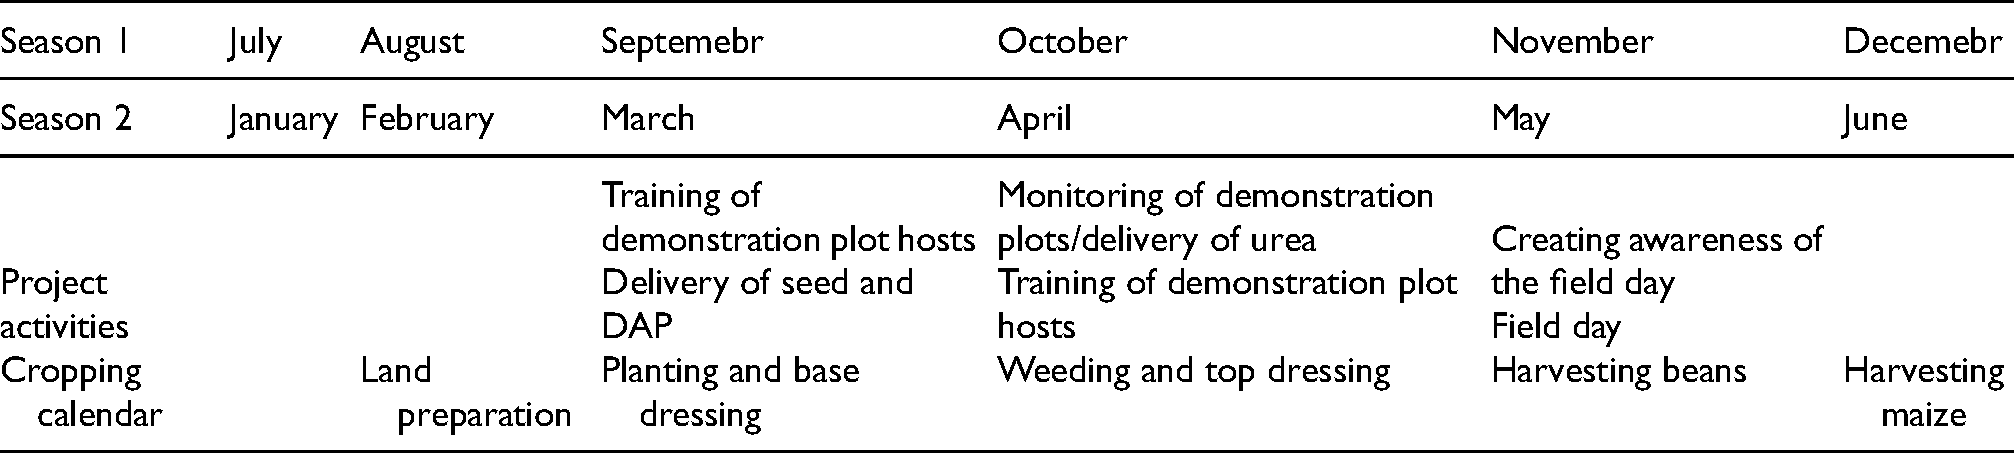
The demonstration plot hosts were responsible for organising enough labour for land preparation, planting, fertiliser application, weeding, pesticide application and harvesting. The demonstration plot host could take the harvest for sale or consumption. It was assumed that the demonstration plot hosts would inform and instruct other farmers, in particular, but not only, during field days.
Demonstration plots were expected to be operational in four consecutive seasons. In the first project season (second growing season of 2014), demonstration plots were established in 12 out of 16 villages. In the remaining four villages (e.g. Village 2 and Village 4 in Hoima district, Village 6 in Masindi district and Village 15 in Iganga district), the selected demo hosts were ultimately not willing to collaborate. Four new hosts were selected and in the early 2015 season, all 16 villages had a demonstration plot. In following seasons, two demonstration hosts did not plant; the one in Village 4 in Hoima district and the one in Village 14 in Iganga district. As one of the extension officers expressed: ‘When identifying a farmer to host the demonstration plot, choose a farmer who is well prepared to grow that crop in that season. A farmer may be willing to offer land but not prepared to grow and take care of the crop. Therefore, he will not take care of the garden e.g. weeding on time or chasing away the animals. He should also be willing to teach other farmers.’
To train farmers on the promoted seeds, field days were held at the demonstration plots/sites when the maize crop reached maturity (see Table 4 for a full calendar of cropping and project activity). Field days were only conducted in successful demonstration sites. According to the project reports, the number of field days conducted is as follows: 9 in season 2 2014, 7 in season 1 2015, 5 in season 2 2015 and 10 in season 1 2016. This means that in none of the seasons, field days were held in all demonstration plots. The demonstration plot hosts were instructed to mobilise farmers to attend the field day. In addition, announcements were made through the radio 1 week prior to the field day. All farmers within a radius of about 30 km of a demonstration plot were supposed to receive information about its location and invitation to visit.
During field days, seed company staff, agro-dealers and extension officers attended the plots. The seed company staff offered instructions on the varieties, seed rate, fertiliser application and spacing for planting. One particular element of the instructions was to identify improved seeds from fake copies. Official seed packages had a scratch card and included details on the seed type, quantity, expiry date and the name of the company. Scratching the card revealed a 12-digit number that farmers could enter as an SMS text message to a given phone number. An automated return message would indicate if the seed was original or fake.
Seed company officials also probed farmers’ perception of the new seed varieties through a question and answer session. Agro-dealers, based in the main district town, gave the retail price of the new seed and explained the location of their shops to the farmers. The agro-dealers were responsible for having new seed varieties in stock for farmers who wanted to buy for their own fields. The seed company handed out leaflets with information in English and the local language (Lunyoro in Masindi and Hoima districts, Lusoga in Iganga district and Japadhola in Tororo district) to farmers. Finally, government extension officers helped the seed company officials and agro dealers in providing information to the farmers. They were also available to farmers for advice at a later stage.
To sum up, the demonstration plots aimed to convince farmers in buying and adopting the improved seed varieties. The main didacts were the seed company officials, agro dealers and government extension officers, providing instructions to the demonstration plot host and information to the farmers attending the field days. Extension officers and agro-dealers could provide follow-up guidance for farmers who were willing to buy the seeds. In the next section we further analyse how this didactic learning was connected to social and environmental learning.
Opportunities for social and environmental learning: Farmers’ involvement in demonstration plots and attendance to field days
There were several challenges in running the demonstration plot plots that inhibited learning. Two of the selected demonstration plot hosts in Hoima districts were not willing to continue with the demonstration plot after the first seasons. Other demonstration plots were not well maintained, for example, late weeding or not applying the provided fertiliser. As a result, these demonstration plots looked very much like what the farmers were used to. Some plots were destroyed by animals. There were also demonstration plot hosts who did little or nothing to share information with other farmers. On the other hand, demonstration plot hosts in Village 1 and Village 3 in Hoima district were member of a farmer group, in which case group members were involved in the maintenance of the demonstration plot and received part of the harvest (FGD, Village 1 and Village 3, 2017). By working on the demonstration garden as a group, the group members were in a position to learn about the new seeds and management practices resulting in social and environmental learning in these specific villages.
Data retrieved from project reports show that there was low turnout during the field days ranging from 45 to 87 farmers per field day (Table 5) and 5% of the farmers in our survey (Table 6). In addition, only one field day was conducted per successful demonstration plot per season, and field days were cancelled when the crops did not look well in the demonstration plot. As indicated before, field days were held when the maize crop reached maturity. By then, the bean crop had already been harvested. Farmers expressed their unease with this timing during the FGDs and suggested that field days should be carried out the beginning and end of the growing phase for both maize and beans. This will facilitate the farmers to see the promoted seeds at different stages of growth.
Number of farmers that attended field days.
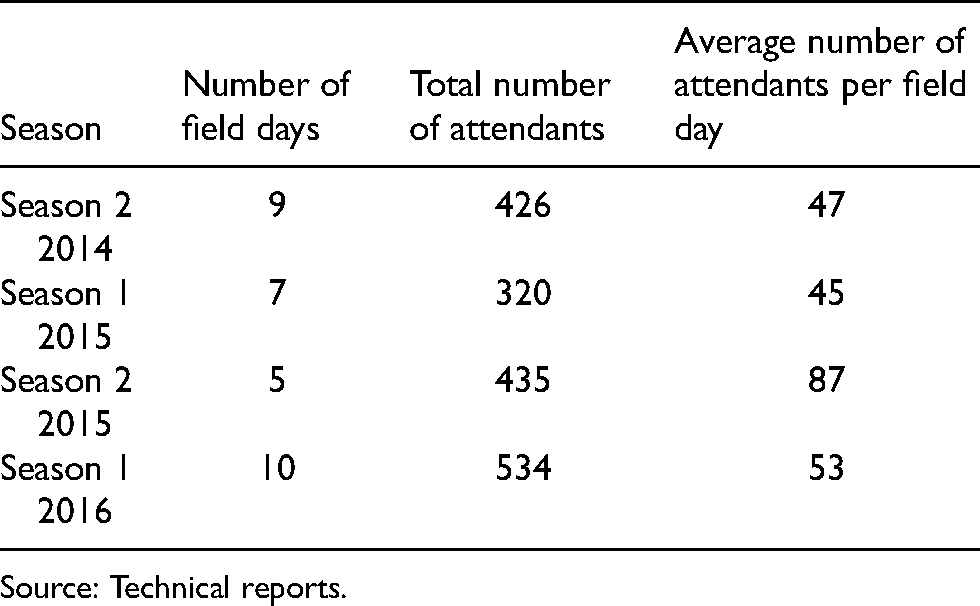
Source: Technical reports.
Percentage of survey farmersa that attended field days.
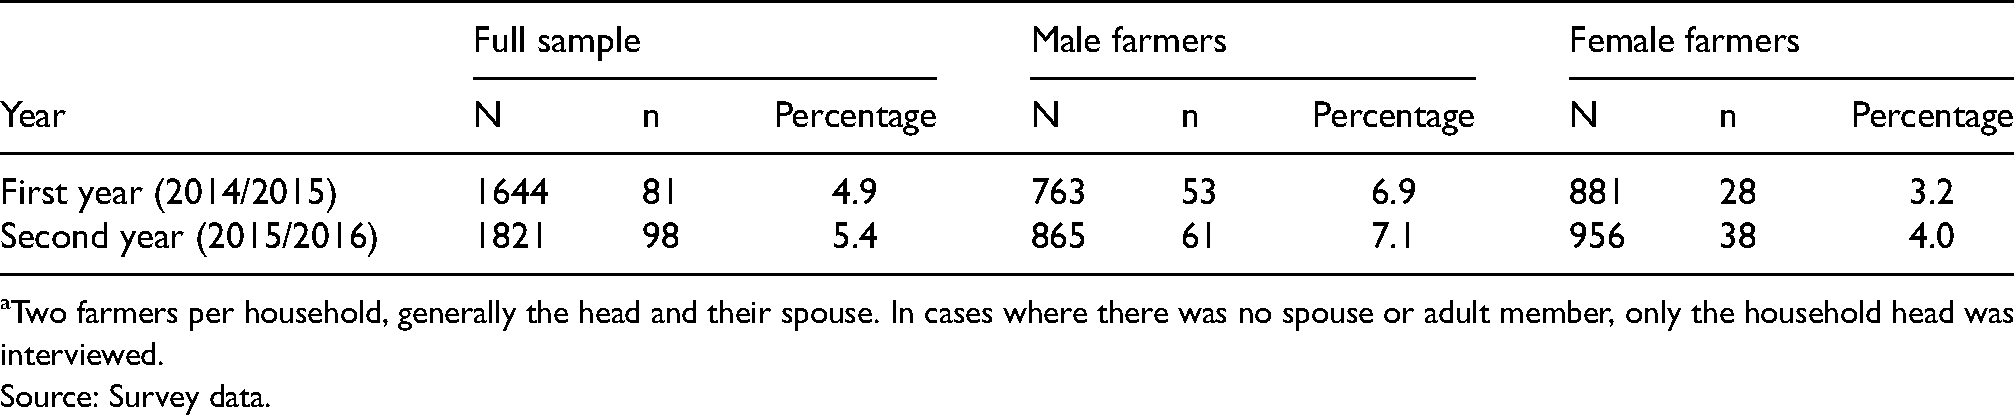
Two farmers per household, generally the head and their spouse. In cases where there was no spouse or adult member, only the household head was interviewed.
Source: Survey data.
Attendance was highest in Tororo district (see detailed analysis at village level in Tables A1 A2 in the Appendix). Results from Table A2 show that 11% of farmers participated in demonstration plots and field days with 14% for males and 8% for females in the first year in Tororo district. The percentage dropped to 7% for the overall sample, 9% for men and 6% for women. Masindi district came second and Iganga was third in attendance. Hoima district had the lowest attendance in both years. The attendance in Masindi and Iganga districts increased in the second year, compared to Hoima and Tororo districts where there was a decrease. At village level, more than half of the interviewed farmers reported to have visited the demonstration plots or field days in the second year in Village 9 in Tororo district (see Table A1 in the Appendix). Qualitative data from the farmers in the FGD indicates that most farmers who went there did this because they had a good relationship with the demonstration plot host. The effect of pre-existing relationships on learning appears as an important element of social learning, something the project seemed to have overlooked entirely.
While demonstration plot hosts were also expected to mobilise farmers within a 30km radius using word of mouth, this was often limited to the farmers they already knew. Hence, farmers who lived far from the demonstration plots were particularly vulnerable to exclusion. One of the demonstration plot hosts said, ‘I mobilised other farmers in the whole village to attend the field day’ (interview Tororo district 2017). In another FGD, no one attended a field day or just took time to find out what was going on at the demonstration plot. ‘We appreciated the variety performance from far’ FGD, Village 14 in Iganga district, 2017. One of the farmers from Village 13 in Iganga district said that there were several demonstration plots in the area, but he just passed them ‘because he is never invited.’ FGDs results showed that in some villages such as Village 6 and Village 15 respondents could not identify who the demonstration plot host was or were unaware of the demonstration garden in their village.
Whereas more could have been done to announce the field days, the lack of information as such appeared not the only trigger of low attendance rates. Farmers indicated several factors that help explain the low turnout. Some farmers expressed they did not attend demonstration plots because they were not involved in selection of the demonstration plot host As one farmer put it: ‘The field days are successful if the seed company involves the farmers’ association or groups. If the seed company deals with a farmer who is not favoured by other farmers, then there is low turnout,’ (farmer interview, Village 9). Another farmer expressed: ‘Some demonstration plot hosts were favoured by the seed company because they were selected multiple times to host the demonstration plots even prior to the promotion of PH5052 and NABE15. There are many farmers to choose from but the host is selected multiple times so I cannot go,’ (FGD, Village 13). This factor was confirmed by seed company staff, explaining that some villagers were not always happy with the allocation of demonstration plots. Another farmer said that ‘The organizers come late and most farmers leave earlier’, FGD, village 11. A farmer in FGD Village 9 had similar opinion, ‘the organizers turn up late when farmers have waited and went back to their homes’. How precarious the balance between curiosity and trust can be is expressed by one farmer saying that: ‘We used to see signposts along the way but did not have prior information about the demonstration plot. We were afraid to go to the farm because the owner may accuse you if anything goes wrong in his farm.’ These findings show that demonstration plots and field days are not neutral devices for information exchange. Social learning is not just triggered by organising a field day and providing information but also by existing connections and patterns of social interaction. A demonstration plot thus intervenes in the pre-existing social situation and can imply, for certain farmers, exclusion from the social and environmental learning intended by the demonstration plots and field days.
The outcome of the learning process: Connections between demonstration plots and farmers’ fields
The survey data show an overall low awareness of the PH5052 and NABE15 varieties, though awareness slightly increased in subsequent years (Table 7). One per cent of the survey respondent was aware of PH5052 and NABE15 pre-intervention, 2.7% after the first intervention year and 2.9% after the second year. Note that this is even less than the share of respondents who participated in the field days, indicating that even for participating farmers, learning was far from perfect. Of those who participated, awareness was 17% in the first year of the intervention and only 9% in the second year for PH5052, while 10% were aware in the first year of the intervention and 6.1% for the second year for NABE15. As implicit in the definition of learning, awareness can either mean having received the information and memorising it, processing the information into knowledge, or turning the new knowledge into a changed course of action. The latter, in the form of using the improved seed varieties instead of any other, was the intended learning outcome of the didacts. The low adoption rates reveal that this happened in very few cases.
Awareness and knowledge of the varieties PH5052 (maize) and NABE15 (beans) amongst survey farmers by field day participation and gender.
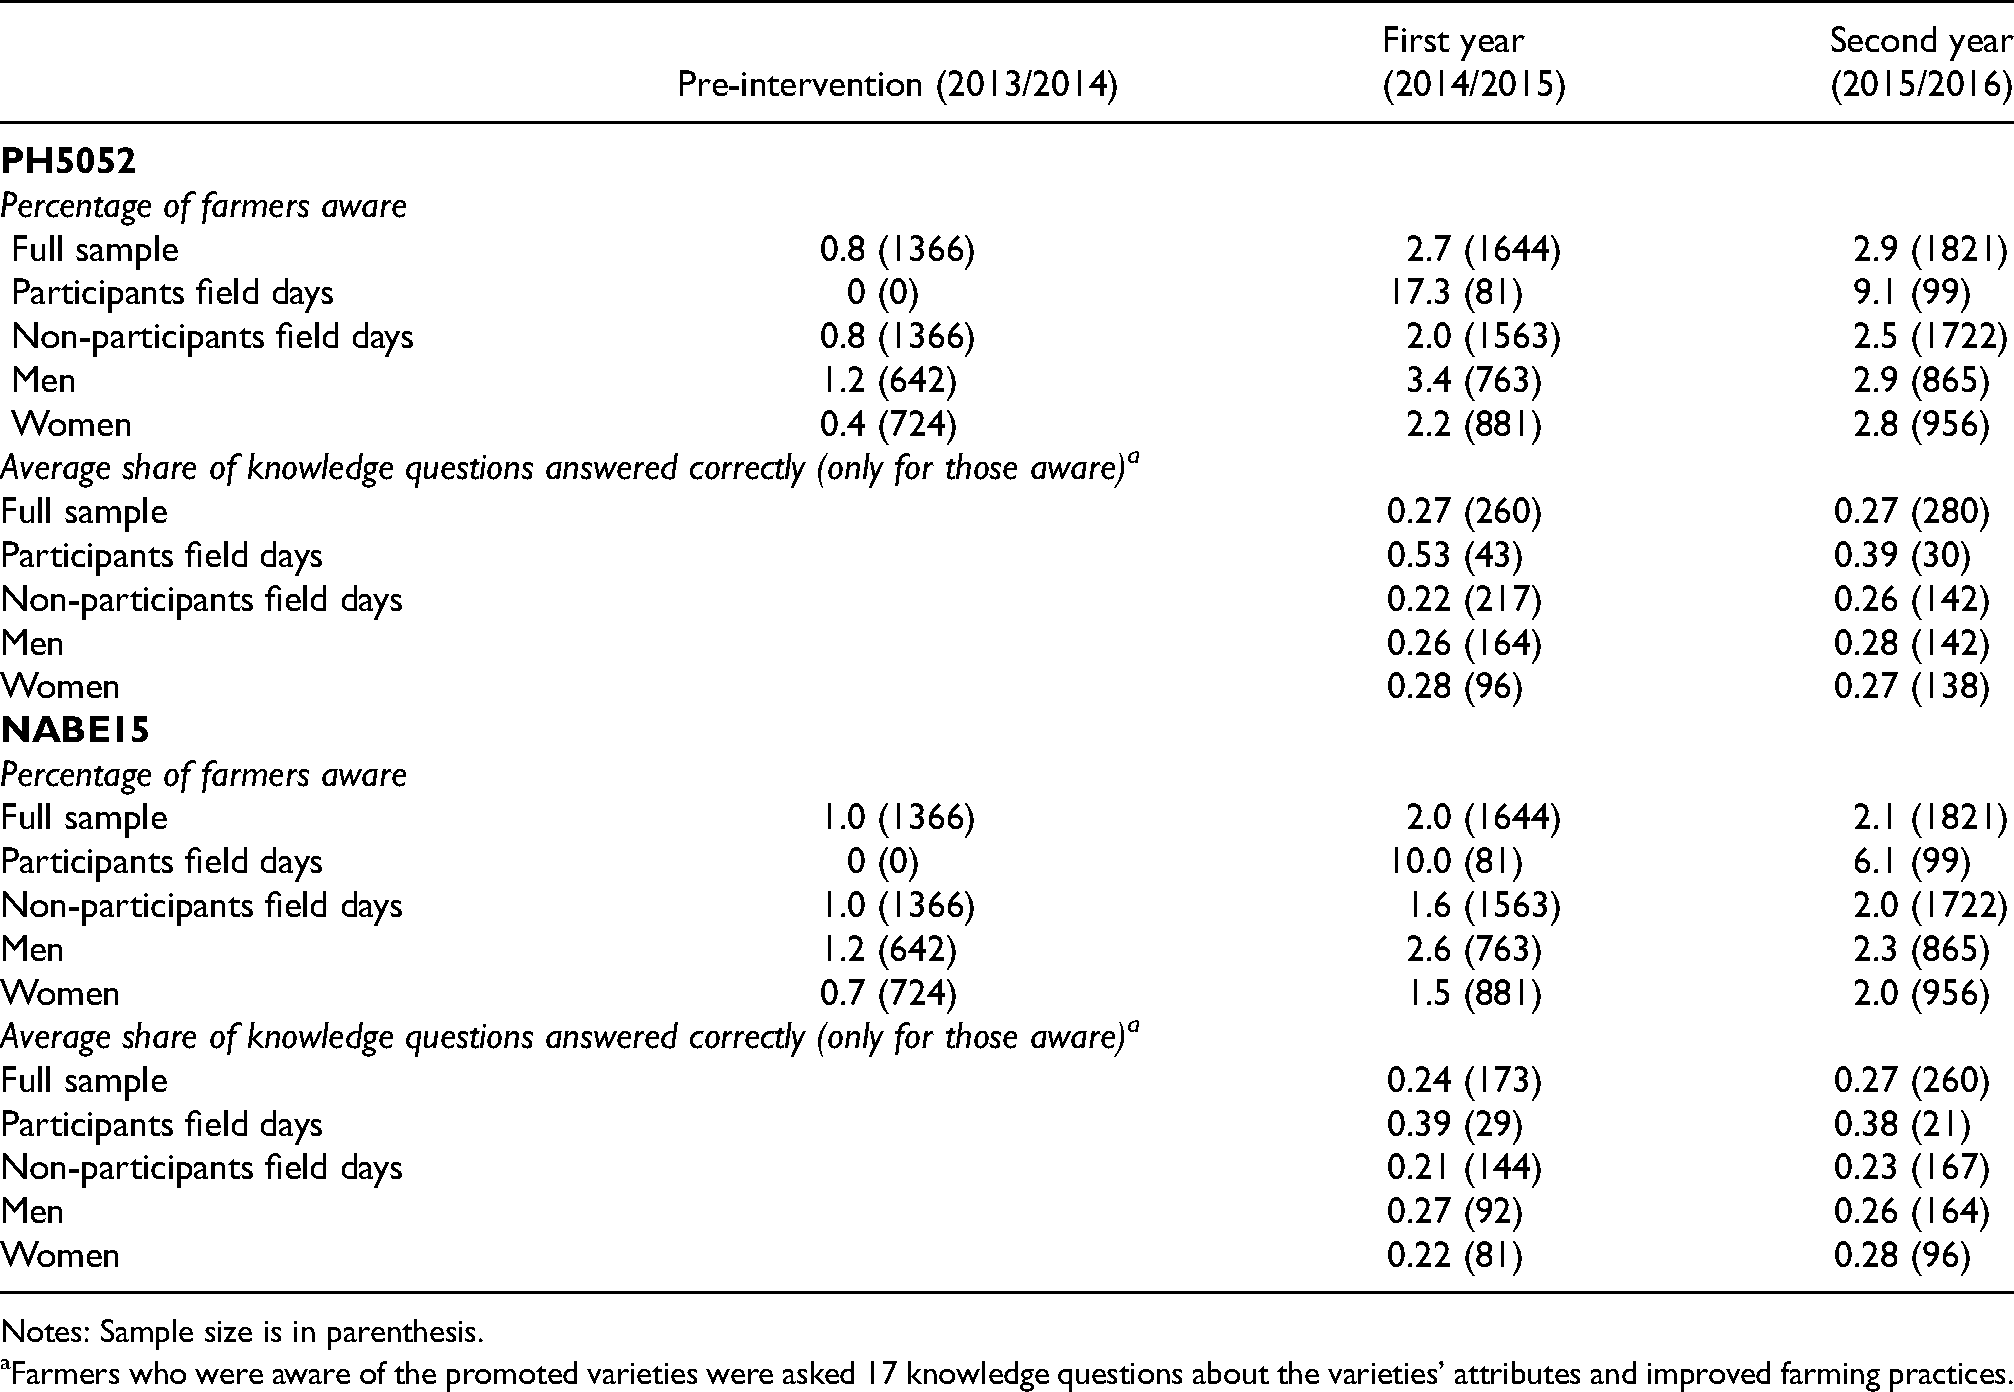
Notes: Sample size is in parenthesis.
Farmers who were aware of the promoted varieties were asked 17 knowledge questions about the varieties’ attributes and improved farming practices.
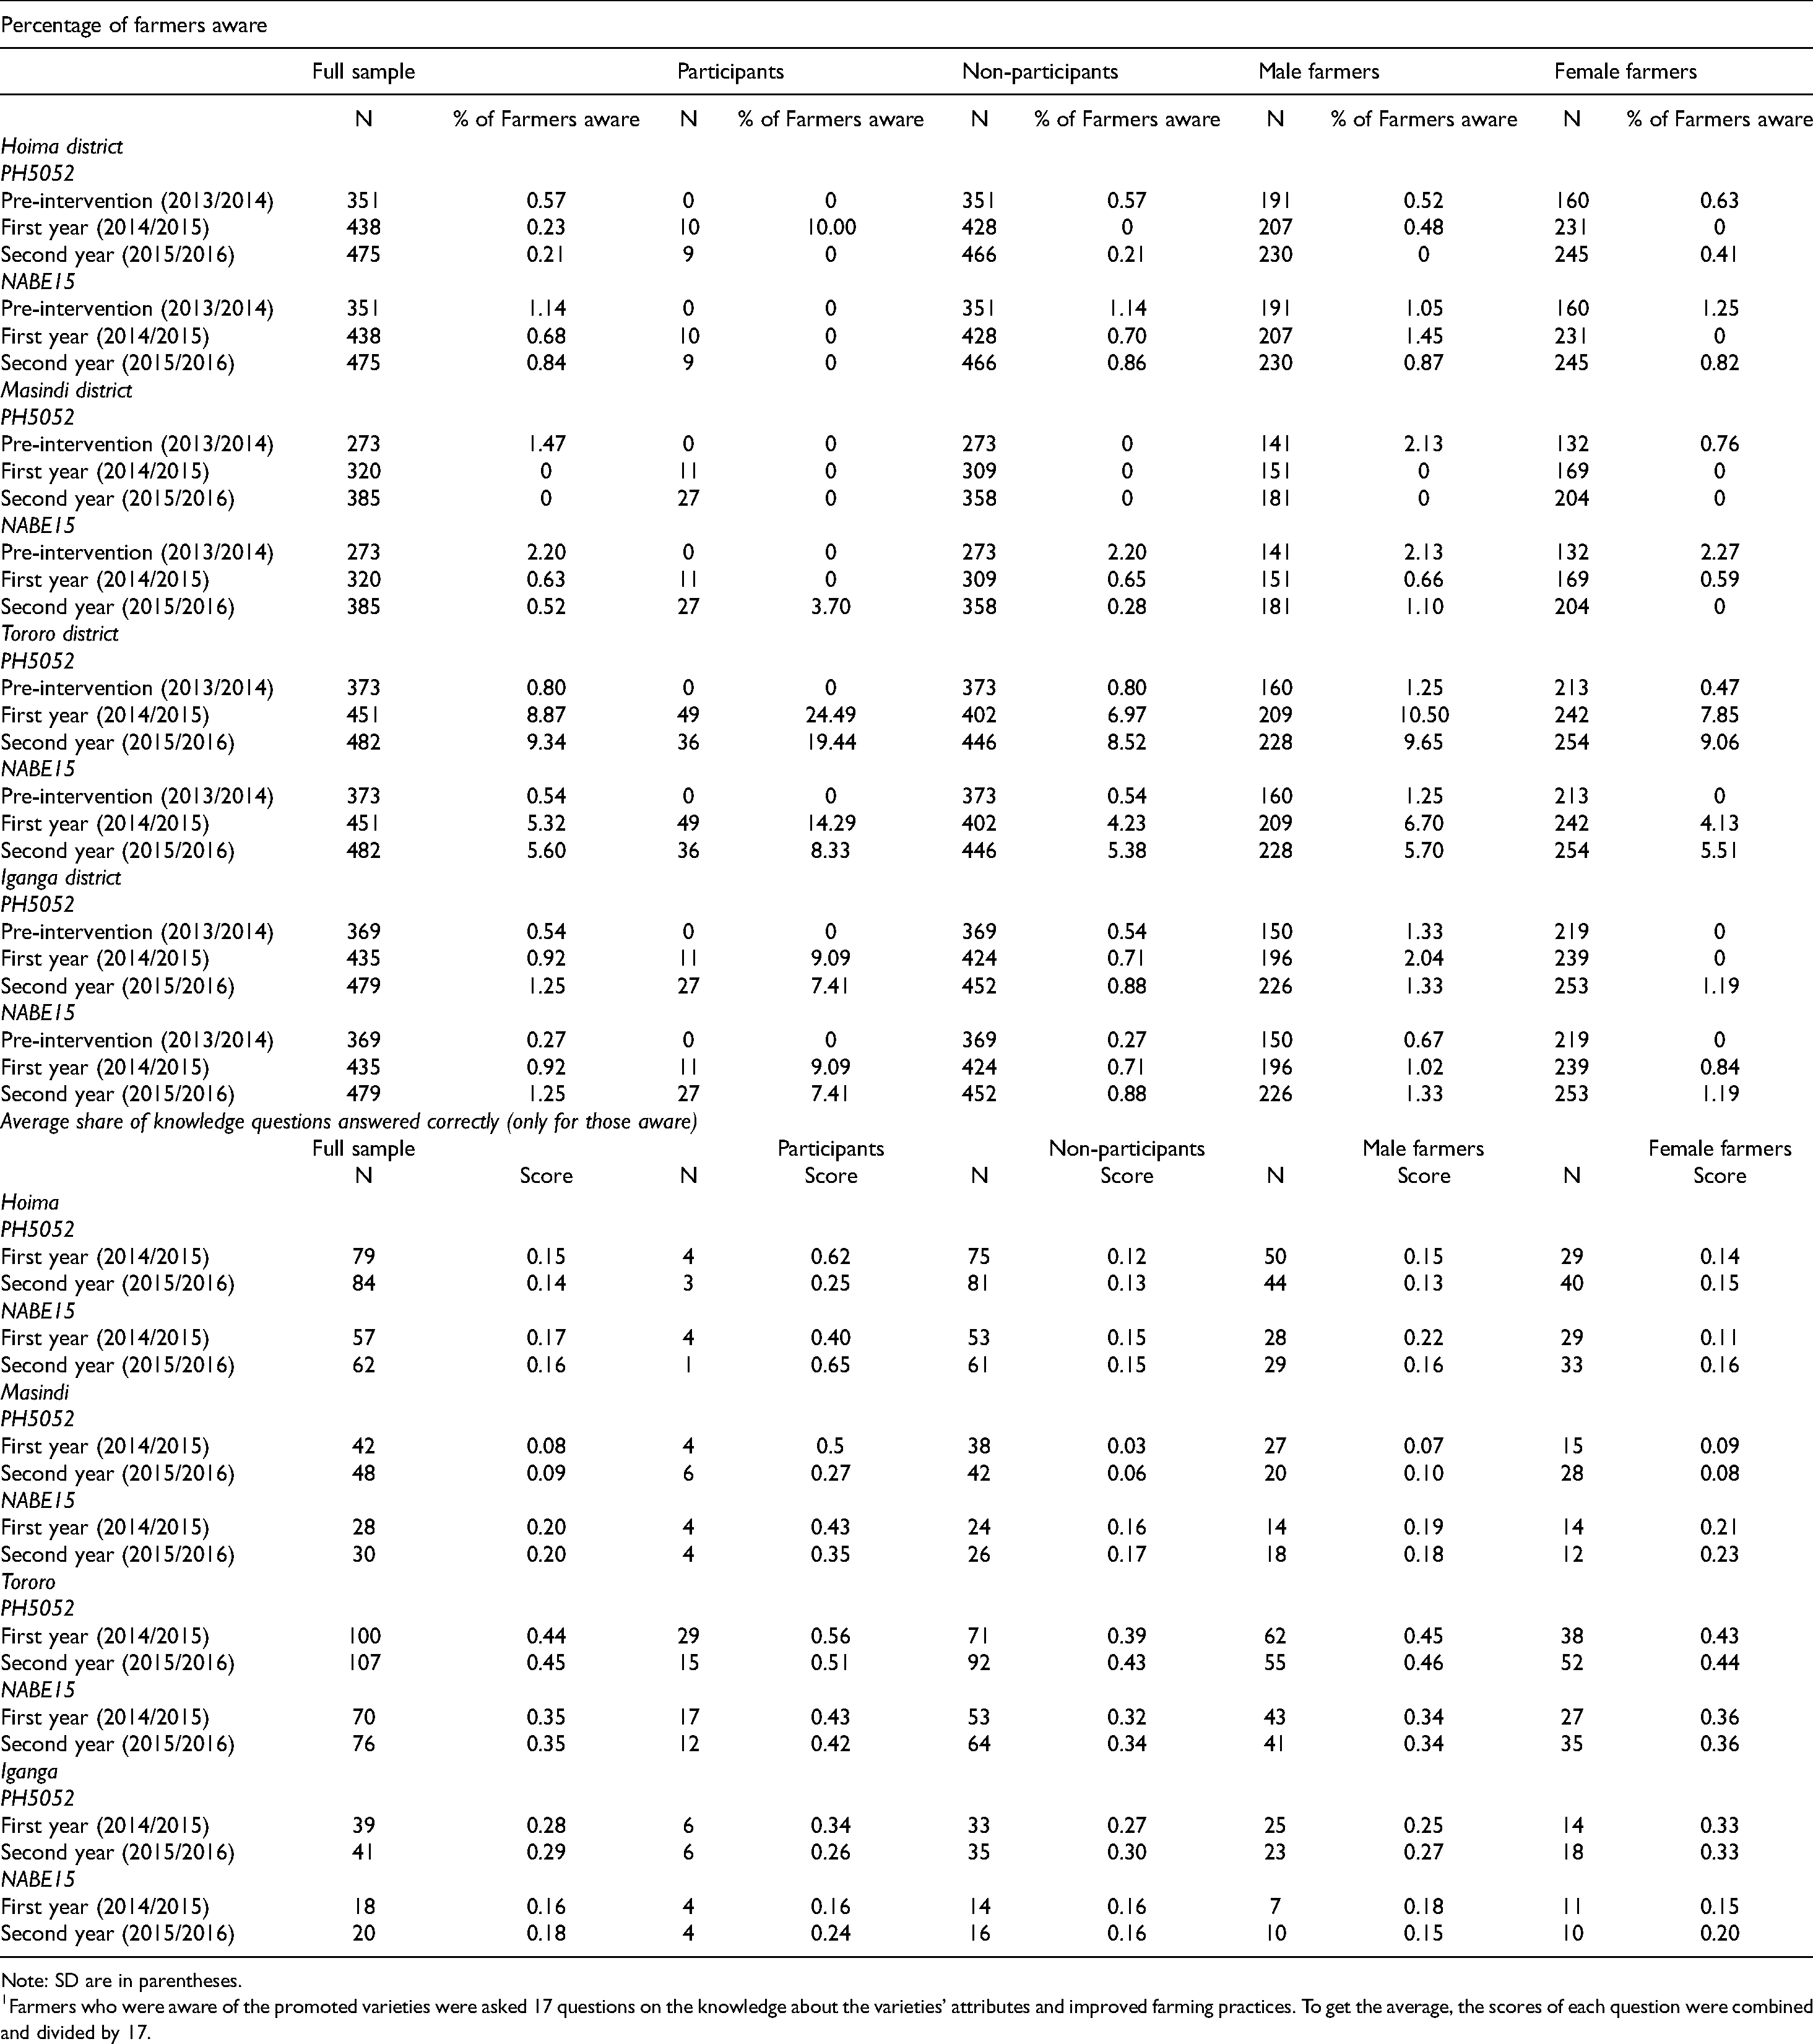
Detailed analysis of the awareness of the promoted varieties at the district and village level is presented in Tables A3, A4 and A5. Learning is affected by some issues such as illiteracy as one farmer put it, ‘What is done on the demo caters for literates only especially the signposts. The seed companies should put signposts with the local language for many people to understand. The demonstration plot host planted late, the performance was not good,’ FGD Village 7 in Masindi district. Another farmer in FGD in village 1 expressed the same opinion and suggested that ‘the company should deliver the inputs early enough especially the March season.’
At district level, the awareness of PH5052 and NABE15 varieties in both years was highest in Tororo district (Table A5). About 9% of the surveyed farmers were aware of PH5052 in both years and 5% in the first year and 5.6% in the second year for NABE15. At village level, Village 9 in Tororo district had the highest awareness; above 30% for both varieties (Tables A3 A4). This is consistent with participation in demonstration plots/field days, which was high in this village.
The knowledge level for those aware of the varieties remained largely the same in first and second years of the project (Table 7). On average, farmers gave correct answers to about 25% of the knowledge questions about the promoted varieties, and this did not change between years. This score was substantially higher for those that participated in the field days: 38%–53%. Gender differences are small. Detailed analysis per district is presented in Table A5.
Awareness and knowledge of the promoted varieties was high amongst the farmers who participated in the FGDs, especially amongst members of farmer groups, e.g. Village 1 and Village 3 (Table 8). It may be that the village elders selected farmers for the FGDs who had actively participated in the project. Many farmers in the FGDs said they had tried the new seeds in their fields. They mentioned clear differences in performance of the varieties compared to the crop from traditional varieties. These related to clearly observable differences, for example more cobs per plant, grain colour and shape (the white, big grains preferred by buyers) and short maturation period (110 days). For the bean variety, FGD participants mentioned that it had high yields, cooked very fast, and pest and disease resistant (FGD, Village 9). These results may suggest that the learning process, at least for these farmers, had positive outcomes. However, few farmers participating in the FGDs really were growing the introduced varieties, although adoption rates differed substantially between villages (Table 10).
Awareness of promoted seeds amongst focus group discussion (FGD) participants.
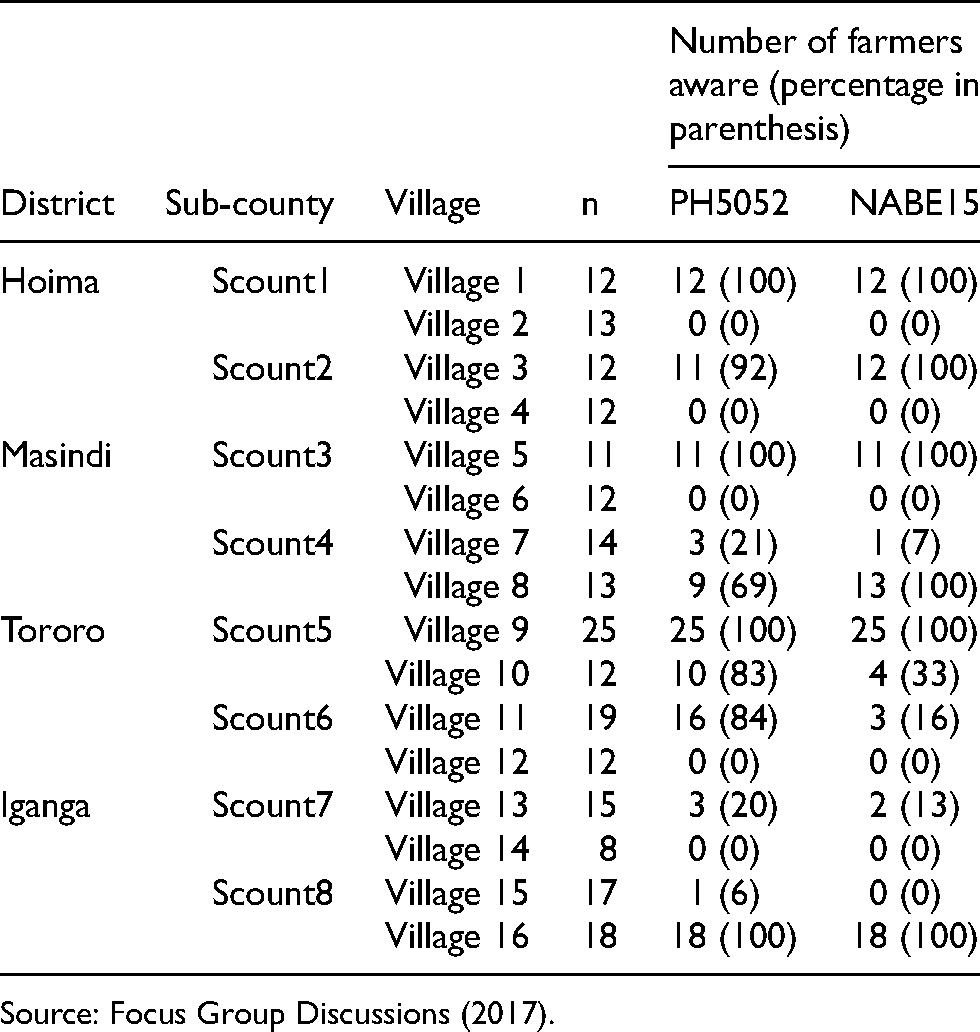
Source: Focus Group Discussions (2017).
Number and percentage of focus group discussion (FGD) participants who planted the promoted seeds (for villages with awareness).
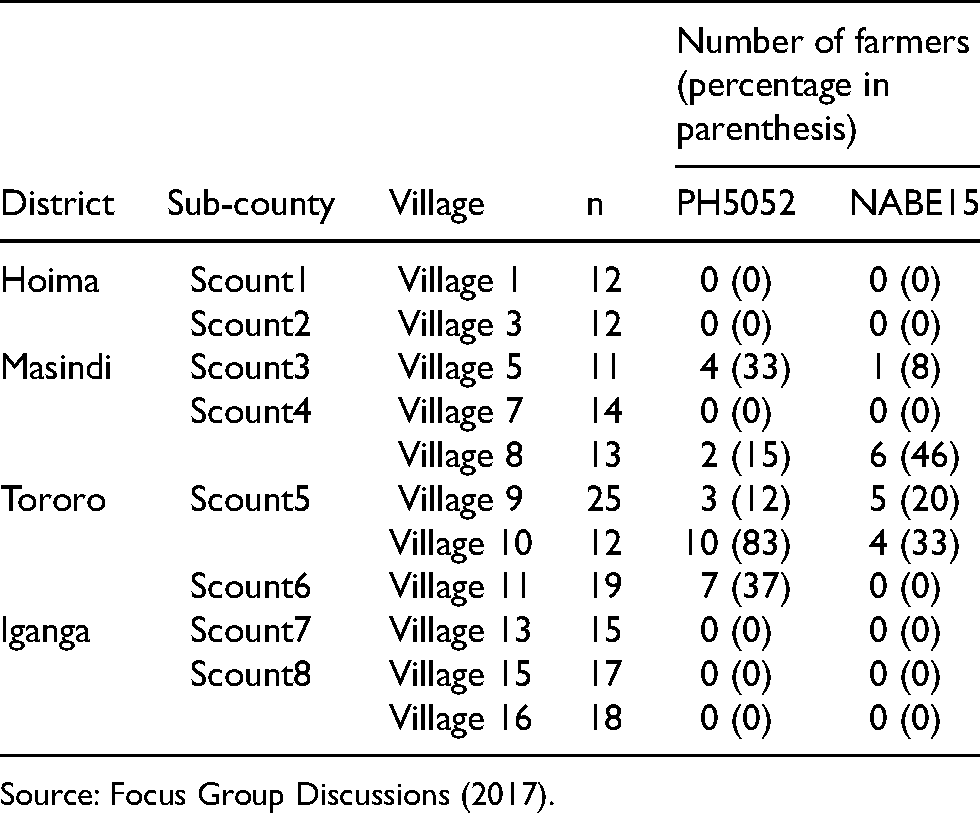
Source: Focus Group Discussions (2017).
Overall, less than 1% of the survey respondents reported planting PH5052 or NABE15 across the 2 years, resulting in a low acreage with the promoted seeds (Table 9). Interestingly, adoption rates were low even amongst the demonstration plot hosts. From the interviews, it became clear that from the 16 hosts, only 6 continued planting PH5052 maize and 3 NABE15 after the project. Two demonstration plot hosts who planted PH5052 took seed from the previous harvest while the remaining four bought certified seed. All the demonstration plot hosts who planted NABE15 took seed from their own stock.
Percentage of households who planted PH5052 and NABE15 and acreage under these crops (n = 983).
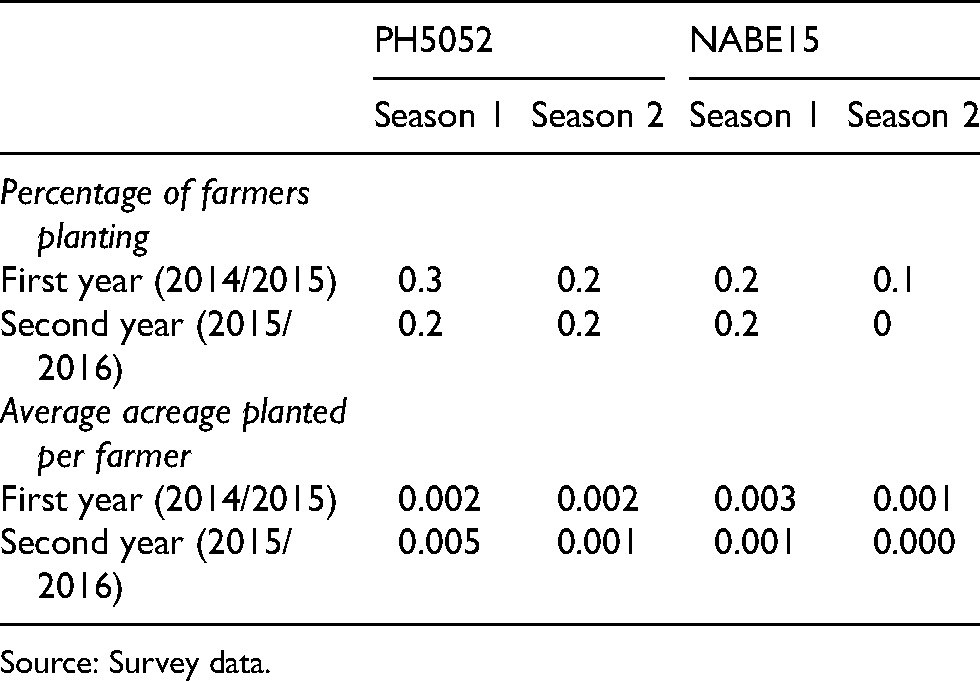
Source: Survey data.
Results from FGDs show that some farmers who attended the demonstrations said they did not buy the varieties but are practising the advised row planting and weeding on other maize varieties. These are low-cost adjustments that mainly require additional labour but no financial investments. But also, labour is a scarce resource, and many of the interviewed farmers expressed that they found the recommended crop management too labour intensive. One farmer said that ‘it is expensive to practice what is done on the demonstration plot. It is easy to handle a demonstration plot because it is smaller than a big farm’ (FGD, Village 9). Labour in agriculture is seasonal, making it scarce during planting through to harvesting time. This may lead to high labour costs and reduced yield especially if the planting, weeding and fertiliser application is not done at the right time. As one farmer put it, ‘the row planting and weeding requires a lot of manpower and time. I have high yields, but the labour cost is high’ (farmer interview, Village 9). However, some farmers helped each other. Sharing labour was mentioned in interviews from Villages 3, 9 and 10. ‘We pull together and offer labour to each other through farm labour pooling, both animal and labour groups,’ (interview Village 9) and sometimes such labour sharing was done with financial compensation. As a farmer from Village 3 stated, “we also offer labour for payment to farmer not in the support group.”
Farmers who planted PH5052 mentioned that they got good yields and generated additional income (FGDs and farmer interviews, 2017). Farmers who did not plant the new varieties mentioned that agro-dealers were located in town centres far away from the villages, making accessibility difficult. Farmers who took the effort to buy the seed sometimes found no seeds at the shop. Agro-dealers confirmed that seeds were not always available due to delayed delivery, in particular in the first season. Some farmers also explained that they did not plant the new seeds due to the high seed price and poor seed quality in the market. The cost of the PH5052 maize seed was 6500–7000 UGX/kg compared to open-pollinated varieties (OPVs) which sold at 2000–3000 UGX/kg. These details are crucial as the hybrid maize varieties only have lasting benefits when seeds can be reliably sold each season, and availability of fertiliser and labour is also continued. There were similar complications in the adoption of the improved bean variety, primarily the limited marketing options. One of the demonstration plot host in Village 3 mentioned, open pollinated varieties I tried selling the bean harvest to the neighbours, who refused because they preferred their own varieties.’ The majority of farmers preferred home-saved bean seed to certified bean seed bought at agro-dealers shops. The observations about limited and irregular availability of seeds show the close connection between experimental learning and social learning. An agro-dealer that does not deliver on time creates a negative social learning experience and obstructs the farmer from further environmental learning.
Discussion and conclusion
Our examination of learning effects through the implementation of demonstration plots complemented with field days to promote new maize and bean varieties introduced confirms the importance of social interactions, including interactions with material inputs and the agro-ecological environment. The project implementation had limited success: our survey shows low awareness and adoption rates. The qualitative study, that was set up in addition to survey results, reveals important insights about the interaction dynamics between the different actors involved in the seed distribution process. It appeared that the project setup with a strong focus on the demonstration plots constrained many crucial interactions that would generate a learning process. Our findings are not unique and confirm findings from other studies on the limited effects of demonstration plots (Kondylis and Mueller, 2013).
The framework from Stone (2016) about the learning process underlying the introduction of improved seeds as a combination of didactic, social and environmental learning sheds interesting light on the above findings. Didactic learning formed the core of the intervention and it was implicitly assumed that either this in itself was enough or would trigger sufficient social and environmental learning to induce adoption. Neither appeared to be the case: the knowledge spread was very limited and adoption rates were low. The setup of the didactic learning process can explain this lack of success at least partly.
Our analysis indicates that the didacts did not really consider the position and needs of the local farmers. The promoted seeds were supposed to be accessible, but the distance between farmers and agro-dealers was large, seeds were not always available and seed prices were high. In addition, contrary to farmers’ needs, they organised only one field day per season. Perhaps most importantly, farmers were not involved in the selection of the demonstration plot hosts. The didacts wrongly assumed that spontaneous mouth-to-mouth promotion, signposts at the demonstration plots, and limited radio announcements would be sufficient promotion for the demonstration plots. In reality, the information dissemination process is complex and is mediated by the social position of demonstration plot hosts and existing interactions patterns. This is confirmed by our finding that in situations where demonstration plot hosts were part of an existing farmer group, participation in field days and seed adoption rates were higher. Other studies confirm the importance of prior existing networks and farmer groups (Ainembabazi et al., 2017; BenYishay and Mobarak, 2019; Kroma, 2006).
It is somewhat remarkable that the project spent so little effort in stimulating social learning effects. There are many examples in the literature that show increased effects when farmers are more involved in the establishment, lay-out and management of demonstration plots (Dar et al., 2019; Fliert et al., 2010). This also relates to the frequency of interactions: regular involvement of farmers in demonstrations and on-farm experiments increase learning (Flor et al., 2017).
The didacts active in the demonstration plots are primarily commercial actors. The one-off field days and presence of agro-dealers suggests that informing farmers about where to buy seeds was considered more important than explaining farmers how to grow these seeds profitably. The commercial nature of the field days and demonstrations plots was not unnoticed by the farmers and had negative consequences for the social and environmental learning. Our interviews with farmers revealed that some farmers avoided contact with the demonstration plot hosts as they suspected favouritism rather than genuine sharing of information. Financial benefits are common but our findings confirm other studies emphasising that benefits need to be distributed equally amongst participants (BenYishay and Mobarak, 2019; Shikuku et al., 2019; Taylor and Bhasme, 2018). Moreover, our findings suggest that the commercial interests of the didacts were primarily focused on selling seeds of a bean variety which was not preferred by buyers. This comes out most clearly from the way the bean variety was incorporated in the farming practices. Introducing a bean variety with the assumption that both improved seeds and harvest can be sold indiscriminately underestimates the importance of qualities and social ties affecting the value attached to a particular variety, making the promoted bean variety more an anti-commodity than a commodity (Hazareesingh and Maat, 2016).
The restricted focus on commercialisation of seeds of improved varieties in the didactic learning process and the limited attention given to the social and environmental learning explains the limited awareness and adoption rates of the introduced seed varieties. Demonstration plots can either be successful or unsuccessful in disseminating information to create awareness on improved technologies. Examples of successful stories are shown in Kondylis and Mueller (2013), Kondylis et al. (2017) and Matsumoto et al. (2013). However, we do not suggest that adoption rates would have been higher with more attention for a better balance between didactic, social and environmental learning. The main conclusion from our study is that the imbalance between different types of learning obstructs learning outcomes at both ends. The flawed design and implementation of demonstration fields as well as the lack of follow-up in terms of guiding and monitoring the emulation reduces the number of farmers that could have experimented with the new seeds and related crop management practices. It also thwarts the options for project managers and implementers to learn from farmers’ learning.
In conclusion, the process of implementing demonstration plots has shown to have both enabling and constraining effects on technology change. This allows for complexities of technological changes to arise which are often the gaps in impact and technology adoption studies. For example, we see that learning may not take place due to constraining factors such as choice of a host and management of demonstration plots. After learning, farmers may not adopt a technology due to factors such as labour and marketability. Broader approaches that provide enabling conditions around learning and adoption of new technologies is likely to enhance farmers learning. Institutional arrangements amongst actors in the introduction of new technologies will enable understanding of the farmers’ needs and follow guidelines to effectively disseminate both information and technology.
Footnotes
Acknowledgement
This work was undertaken as part of a 3ie funded project carried out by Tegemeo Institute of Agricultural Policy and Development. Special thanks to the Director of Tegemeo Institute and Dr Mercy Kamau for the facilitation and support provided during the study period. We acknowledge the support received from Dr Fredrick Bagamba, Makerere University Uganda for his assistance during the fieldwork in Uganda. We also acknowledge the assistance received from the local leaders during data collection. We also acknowledge the dedication of research assistants and enumerators. We wish to thank the respondents who provided data used in this paper. This work benefited from comments received from the reviewer, guest editor and Erwin Bulte.
Declaration of conflicting interests
The author(s) declared no potential conflicts of interest with respect to the research, authorship and/or publication of this article.
Funding
The author(s) disclosed receipt of the following financial support for the research, authorship and/or publication of this article. This work was supported by the 3ie (grant number TW4/1010). The seed promotion program was financially supported by the Alliance for a Green Revolution in Africa (AGRA).
Appendix
Awareness and knowledge of the promoted seeds amongst survey farmers.
| Percentage of farmers aware | ||||||||||
|---|---|---|---|---|---|---|---|---|---|---|
| Full sample | Participants | Non-participants | Male farmers | Female farmers | ||||||
| N | % of Farmers aware | N | % of Farmers aware | N | % of Farmers aware | N | % of Farmers aware | N | % of Farmers aware | |
| Hoima district | ||||||||||
| PH5052 | ||||||||||
| Pre-intervention (2013/2014) | 351 | 0.57 | 0 | 0 | 351 | 0.57 | 191 | 0.52 | 160 | 0.63 |
| First year (2014/2015) | 438 | 0.23 | 10 | 10.00 | 428 | 0 | 207 | 0.48 | 231 | 0 |
| Second year (2015/2016) | 475 | 0.21 | 9 | 0 | 466 | 0.21 | 230 | 0 | 245 | 0.41 |
| NABE15 | ||||||||||
| Pre-intervention (2013/2014) | 351 | 1.14 | 0 | 0 | 351 | 1.14 | 191 | 1.05 | 160 | 1.25 |
| First year (2014/2015) | 438 | 0.68 | 10 | 0 | 428 | 0.70 | 207 | 1.45 | 231 | 0 |
| Second year (2015/2016) | 475 | 0.84 | 9 | 0 | 466 | 0.86 | 230 | 0.87 | 245 | 0.82 |
| Masindi district | ||||||||||
| PH5052 | ||||||||||
| Pre-intervention (2013/2014) | 273 | 1.47 | 0 | 0 | 273 | 0 | 141 | 2.13 | 132 | 0.76 |
| First year (2014/2015) | 320 | 0 | 11 | 0 | 309 | 0 | 151 | 0 | 169 | 0 |
| Second year (2015/2016) | 385 | 0 | 27 | 0 | 358 | 0 | 181 | 0 | 204 | 0 |
| NABE15 | ||||||||||
| Pre-intervention (2013/2014) | 273 | 2.20 | 0 | 0 | 273 | 2.20 | 141 | 2.13 | 132 | 2.27 |
| First year (2014/2015) | 320 | 0.63 | 11 | 0 | 309 | 0.65 | 151 | 0.66 | 169 | 0.59 |
| Second year (2015/2016) | 385 | 0.52 | 27 | 3.70 | 358 | 0.28 | 181 | 1.10 | 204 | 0 |
| Tororo district | ||||||||||
| PH5052 | ||||||||||
| Pre-intervention (2013/2014) | 373 | 0.80 | 0 | 0 | 373 | 0.80 | 160 | 1.25 | 213 | 0.47 |
| First year (2014/2015) | 451 | 8.87 | 49 | 24.49 | 402 | 6.97 | 209 | 10.50 | 242 | 7.85 |
| Second year (2015/2016) | 482 | 9.34 | 36 | 19.44 | 446 | 8.52 | 228 | 9.65 | 254 | 9.06 |
| NABE15 | ||||||||||
| Pre-intervention (2013/2014) | 373 | 0.54 | 0 | 0 | 373 | 0.54 | 160 | 1.25 | 213 | 0 |
| First year (2014/2015) | 451 | 5.32 | 49 | 14.29 | 402 | 4.23 | 209 | 6.70 | 242 | 4.13 |
| Second year (2015/2016) | 482 | 5.60 | 36 | 8.33 | 446 | 5.38 | 228 | 5.70 | 254 | 5.51 |
| Iganga district | ||||||||||
| PH5052 | ||||||||||
| Pre-intervention (2013/2014) | 369 | 0.54 | 0 | 0 | 369 | 0.54 | 150 | 1.33 | 219 | 0 |
| First year (2014/2015) | 435 | 0.92 | 11 | 9.09 | 424 | 0.71 | 196 | 2.04 | 239 | 0 |
| Second year (2015/2016) | 479 | 1.25 | 27 | 7.41 | 452 | 0.88 | 226 | 1.33 | 253 | 1.19 |
| NABE15 | ||||||||||
| Pre-intervention (2013/2014) | 369 | 0.27 | 0 | 0 | 369 | 0.27 | 150 | 0.67 | 219 | 0 |
| First year (2014/2015) | 435 | 0.92 | 11 | 9.09 | 424 | 0.71 | 196 | 1.02 | 239 | 0.84 |
| Second year (2015/2016) | 479 | 1.25 | 27 | 7.41 | 452 | 0.88 | 226 | 1.33 | 253 | 1.19 |
| Average share of knowledge questions answered correctly (only for those aware) | ||||||||||
| Full sample | Participants | Non-participants | Male farmers | Female farmers | ||||||
| N | Score | N | Score | N | Score | N | Score | N | Score | |
| Hoima | ||||||||||
| PH5052 | ||||||||||
| First year (2014/2015) | 79 | 0.15 | 4 | 0.62 | 75 | 0.12 | 50 | 0.15 | 29 | 0.14 |
| Second year (2015/2016) | 84 | 0.14 | 3 | 0.25 | 81 | 0.13 | 44 | 0.13 | 40 | 0.15 |
| NABE15 | ||||||||||
| First year (2014/2015) | 57 | 0.17 | 4 | 0.40 | 53 | 0.15 | 28 | 0.22 | 29 | 0.11 |
| Second year (2015/2016) | 62 | 0.16 | 1 | 0.65 | 61 | 0.15 | 29 | 0.16 | 33 | 0.16 |
| Masindi | ||||||||||
| PH5052 | ||||||||||
| First year (2014/2015) | 42 | 0.08 | 4 | 0.5 | 38 | 0.03 | 27 | 0.07 | 15 | 0.09 |
| Second year (2015/2016) | 48 | 0.09 | 6 | 0.27 | 42 | 0.06 | 20 | 0.10 | 28 | 0.08 |
| NABE15 | ||||||||||
| First year (2014/2015) | 28 | 0.20 | 4 | 0.43 | 24 | 0.16 | 14 | 0.19 | 14 | 0.21 |
| Second year (2015/2016) | 30 | 0.20 | 4 | 0.35 | 26 | 0.17 | 18 | 0.18 | 12 | 0.23 |
| Tororo | ||||||||||
| PH5052 | ||||||||||
| First year (2014/2015) | 100 | 0.44 | 29 | 0.56 | 71 | 0.39 | 62 | 0.45 | 38 | 0.43 |
| Second year (2015/2016) | 107 | 0.45 | 15 | 0.51 | 92 | 0.43 | 55 | 0.46 | 52 | 0.44 |
| NABE15 | ||||||||||
| First year (2014/2015) | 70 | 0.35 | 17 | 0.43 | 53 | 0.32 | 43 | 0.34 | 27 | 0.36 |
| Second year (2015/2016) | 76 | 0.35 | 12 | 0.42 | 64 | 0.34 | 41 | 0.34 | 35 | 0.36 |
| Iganga | ||||||||||
| PH5052 | ||||||||||
| First year (2014/2015) | 39 | 0.28 | 6 | 0.34 | 33 | 0.27 | 25 | 0.25 | 14 | 0.33 |
| Second year (2015/2016) | 41 | 0.29 | 6 | 0.26 | 35 | 0.30 | 23 | 0.27 | 18 | 0.33 |
| NABE15 | ||||||||||
| First year (2014/2015) | 18 | 0.16 | 4 | 0.16 | 14 | 0.16 | 7 | 0.18 | 11 | 0.15 |
| Second year (2015/2016) | 20 | 0.18 | 4 | 0.24 | 16 | 0.16 | 10 | 0.15 | 10 | 0.20 |
Note: SD are in parentheses.
1Farmers who were aware of the promoted varieties were asked 17 questions on the knowledge about the varieties’ attributes and improved farming practices. To get the average, the scores of each question were combined and divided by 17.
Appendix 6: Survey questionnaire
IDENTIFIERS
Household Name______________________________________________
ASK THIS SECTION BOTH THE HEAD AND SPOUSE/(FE)MALE RESPONDENT RESPONSIBLE FOR MAKING DECISION IN THE HOUSEHOLD; the same questions were asked the male spouse/male respondent
Demo plots, Field days and Mass Media.
a) Are you aware of any demonstration plot set up for improved seed varieties? DEMAWAREF………………. 1 (yes) 2 (No) b) If yes to QUIZ 1a, have you visited any demonstration plot in the last 12 months? DEMVISITF………………. 1 (yes) 2 (No) c) Are you aware of any improved seed varieties demonstration plot set up by Pearl Seed Company? DEMSETF………………. 1 (yes) 2 (No)
(Enumerator: Ask treatment households only)
d) If yes to 1c have you visited any improved seed varieties demonstration plot set up by Pearl Seed Company in the last 12 months? (Enumerator: Ask treatment households only) DEMPEARLF ………………. 1 (yes) 2 (No) a) Are you aware of any field day organised for improved seed varieties? FIELDAWAREF………………. 1 (yes) 2 (No) b) If yes to QUIZ 2a, have you attended any Field day in the last 12 months? FIELDVISITF………………. 1 (yes) 2 (No) c) Are you aware of any field day on improved seed varieties organised by Pearl Seed Company? (Enumerator: Ask treatment households only) FIELDSETF………………. 1 (yes) 2 (No) d) Have you attended any Field day organised by Pearl Seed Company in the last 12 months? (Enumerator: Ask treatment households only) FIELDPEARLF ………………. 1 (yes) 2 (No)
AWARENESS AND KNOWLEDGE ABOUT VARIETIES
Ask only those who have indicated they are aware about the new variety being promoted: (Enumerator use the local names by which farmers know the varieties)
Ask only those who have indicated they are aware about the new variety
Maize_PH5052_F
Beans_NABE15_F
Appendix 7: Focus group discussion (FGD) schedule
Introduction to the study
Background information
Date of interview Village profile (Name, GPS) Village economic situation Do farmers have a role in the development process of improved seeds? Do farmers have a role in the creating awareness of improved seeds? If yes, how do farmers work together with the seed company who develop and come up with the improved seeds or create awareness? Were you involved in Pearl Seed Companies setting up of demos and field days?
If yes, how were you involved
Which seeds were promoted? How many have planted? If no, what are the reasons? How should you be involved in the future? How can the seed company improve in working with farmers? What are the benefits of working with farmers? What are the disadvantages of not working with farmers? What are the companies involved in the promotion of new varieties in the area? You have listed a number of channels through which you got to know about the new varieties How would you score each of the channels (1: best, 5: least) How do you perceive the methods used to promote the varieties? How do you perceive the demos and field days conducted in your area? What would you want improved as far as the organisation and management of the demos and field days?
Farmer involvement in the development and dissemination process
Promotion methods
Check whether all the questions are well answered and covered.
Thank the respondents for their participation.
Appendix 8: Key informant schedule
Introduction to the study
General information
Name of respondent Sex of respondent Organisation Position in organisation Working experience (No. of years) with organisation Role of the respondent in the organisation Background information (Probe before and after the project)
What does your work entail in this organisation?Let them explain as you listen and write For agrovets: Who supplies the inputs that you sell? What is your relationship with the suppliers? Methods of promoting new seed
Demonstration plots
What are your favourite aspects of the demonstration plots? Why do you prefer it? What are your least favourite aspects of the demonstration plots? Why do you least prefer it? What do you think of its effectiveness? Do you think the information given is relevant? Why do you think it is relevant? Is there anything else you’d like to say about demonstration plots? Were you involved in establishing PSL demonstration plots?
If yes, explain Field days
What are your favourite aspects of field days? Why do you prefer it? What are your least favourite aspects of field days? Why do you least prefer it? What do you think of its effectiveness? Do you think the information given is relevant? Why do you think it is relevant? Did you attend the PSL field days? If yes, explain
Besides demos, and field days, which other methods are used to promote seed in the area
In your view which is the best method of promoting the seeds
Collaboration and interactions
Level of collaboration (seed company, extension services, input dealer).
Do agro-vets/input dealers have collaboration with seed traders at parish level? How do you target the smallholder farmers especially in rural areas? If located in town, do you have networks in the villages or at parish level? Interaction with farmers (levels of interaction, impact on farmers, and impact on community)
Appendix 9: Farmer in-depth interview schedule
Introduction to the study
General information
Name of the respondent
Main occupation of the respondent
Residence of the respondent
Farm characteristics and crop production
■ Crop production system. ■ What was the size of your farm? ■ What enterprises do you engage in? ■ Who decided on which enterprise/crop to engage in? Promotion methods
Demonstration plots
• Have you attended demonstration plot(s)? If yes, (what did you learn, where was the demonstration plot located, when did you attend, who organised, reasons for attending)? • How did you learn about the location of demo-plot? • What do you think of its effectiveness? • Do you think the information given was relevant? • What are your favourite aspects of the demonstration plots? • What are your least favourite aspects of the demonstration plots? • What influences whether you attend demonstration plots? • What influences whether your friends attend demonstration plots? • Is there anything else you’d like to say about demonstration plots? • Have you shared the information learnt with anyone? If yes who? Field days
• Have you attended a field day(s)? If yes, (what did you learn, where was the field day located, when did you attend, who organised, reasons for attending)? • How did you learn about the location of field day? • What do you think of its effectiveness? • Do you think the information given was relevant? • What are your favourite aspects of the field day? • What are your least favourite aspects of the field day? • What influences whether you attend field days? • What influences whether your friends attend field days? • Have you shared the information learnt with anyone? If yes who? • Is there anything else you’d like to say about field days?
Which of the methods do you prefer and why?
3. Besides the mentioned sources of information, where else do you get information about improved seeds and good crop husbandry? Do you find this method effective? If yes, why? 4. Do you pass this information to other farmers? If yes, how do you pass this information? 5. What are the most important improved varieties qualities of maize and bean? (Taste, marketability, seasonality, pest tolerance, drought tolerance) 6. If you plant local, what are the most important local varieties features in maize and bean? (Taste, marketability, seasonality, pest tolerance, drought tolerance) 7. Have you heard about PH5052 and NABE15? Have you planted? If yes, in your view, what do you see as improvements/benefits of new seed varieties (PH5052 and NABE15). What are the labour requirements?
Check whether all the questions are well answered and covered.
Thank the respondent for their participation.