
Abstract
When evaluating Quality of Science (QoS) in the context of development initiatives, it is essential to define adequate criteria. The objective of this perspective paper is to show how altmetric and bibliometric indicators have been used to support the evaluation of QoS in the 2020 Review of the Phase 2-CGIAR Research Programs (CRPs, 2017–2022), where, for the first time, the Quality of Research for Development (QoR4D) frame of reference has been utilized across the entire CGIAR CRP portfolio. Overall, the CRP review showed a significant output of scientific publications during the period 2017–2020, with 4,872 articles, 220,101 references, and 7.1 citations per article. Additionally, wider interest in scientific publications is demonstrated by good to high altmetrics, with average attention scores ranging from 70.8 to 806.9 with an average of 425.1. The use of selected bibliometrics was shown to be an adequate tool, for use together with other qualitative indicators to evaluate the QoS in the 12 CRPs. The CRP review process clearly demonstrated that standardized, harmonized and consistent data on research output is paramount to provide high-quality quantitative instruments and should be a priority throughout the transition toward One CGIAR. Therefore, we conclude that the QoR4D framework should be augmented by standardized bibliometric indicators embedded in measurement frameworks within the new One CGIAR. Finally, its practical utilization in monitoring and evaluation should be supported with clear guidelines.
Keywords
Introduction
Bibliometrics is the quantitative method of citation and content analysis for scholarly journals, books, and researchers. 1 Bibliometric indicators based on citation indexes, are widely used in the evaluation of research. The use of bibliometrics, however, has important limitations and there is a growing concern about their potential misuse or use in wrong contexts. Aksnes et al. (2019) conclude that citations reflect aspects related to scientific impact 2 and relevance, while citation-based indicators cannot provide sufficiently nuanced or robust measures of quality when used in isolation.
The use of bibliometric indicators is even more challenging when evaluating research oriented toward societal goals: when it is necessary to assess multiple dimensions of research quality, and evaluation should support qualitative experts’ assessment as advocated in the Leiden Manifesto (Hicks et al., 2015).
Evaluating Quality of Science (QoS) in the context of development initiatives, requires defining adequate criteria. Notably, in light of more recent bibliometric approaches and rather traditional peer-review processes and bibliometric analyses, QoS frameworks have been elaborated, trying to establish holistic means to assess both scientific rigor and development significance.
In the context of transdisciplinary research (TDR), which seeks both to generate knowledge and to contribute to real-world solutions with strong emphasis on context and social engagement, the following main principles have been defined: relevance, credibility, legitimacy and effectiveness using a quality assessment framework, organized as an evaluation rubric (Belcher et al., 2016).
Another example is that of the Research Quality Plus (RQ+) approach developed by the International Development Research Centre (IDRC), defining four research quality dimensions: research integrity, legitimacy and importance as well as positioning for use (Ofir et al., 2016). As in the previous case, the focus of the assessment is based on qualitative criteria, without any structured use of bibliometric analyses. This paper will discuss the use of bibliometrics as a part of the QoS assessment using the recent CGIAR-internal Research Program review as a case study.
The CGIAR is a global research partnership dedicated to reducing poverty, enhancing food and nutrition security and improving natural resources and ecosystem services. It is comprised of 15 international agricultural research centers 3 that share a common vision and strategy and implement research for development through CGIAR Research Programs (CRPs) and platforms. 4
The CGIAR has a long history of evaluation and other mechanisms of accountability, which evolved in a context of reforms (Immonen and Cooksy, 2019). Quality and relevance of science were, among many other, standard evaluation criteria of CGIAR Centers, making use of simple bibliometric indicators such as the number of peer-reviewed publications in refereed scientific journals per researcher. 5 Since the 2010 CGIAR Reform, evaluations shifted their focus from Centers to Programs (CRPs), posing several evaluation challenges, arising from a highly-networked matrix management environment.
With the establishment of the Independent Evaluation Arrangement (IEA) in 2011, a broad framework for evaluating QoS was adopted that involved assessing inputs, processes and outputs. 6 As a key guiding document, the 2012 external evaluation policy 7 reflected the previous set of principles and criteria of the OECD-DAC evaluation network, 8 the United Nations Evaluation Group (UNEG) and good practices in evaluation among international organizations at that time. The policy considered the specific characteristics of agricultural research for development and the architecture of the CGIAR. For the evaluation of the Phase 1 9 -CRPs, IEA used a framework looking at quality of inputs, quality of research management and quality of outputs (including research publications and non-publications outputs), including a number of indicators to support the assessment of quality of science (Roth and Zimm, 2016). QoS was assessed with a mixed methods approach, making use of some bibliometric indicators (i.e., h-Index analysis, total publications, journal impact factors, and citation analysis), calculated ad-hoc for each CRP.
In 2017, the CGIAR Independent Science and Partnership Council (ISPC) facilitated a system-wide agreement on the nature and assessment of Quality of Research for Development (QoR4D), and a working group on QoR4D was established in 2016 under the ISPC chairmanship. The consultative process led to a consensus that in the CGIAR context, QoR4D should be viewed as an integrated whole of four key elements: relevance, scientific credibility, legitimacy and effectiveness, to be used as the basis for a common frame of reference across the system (ISPC, 2017). 10
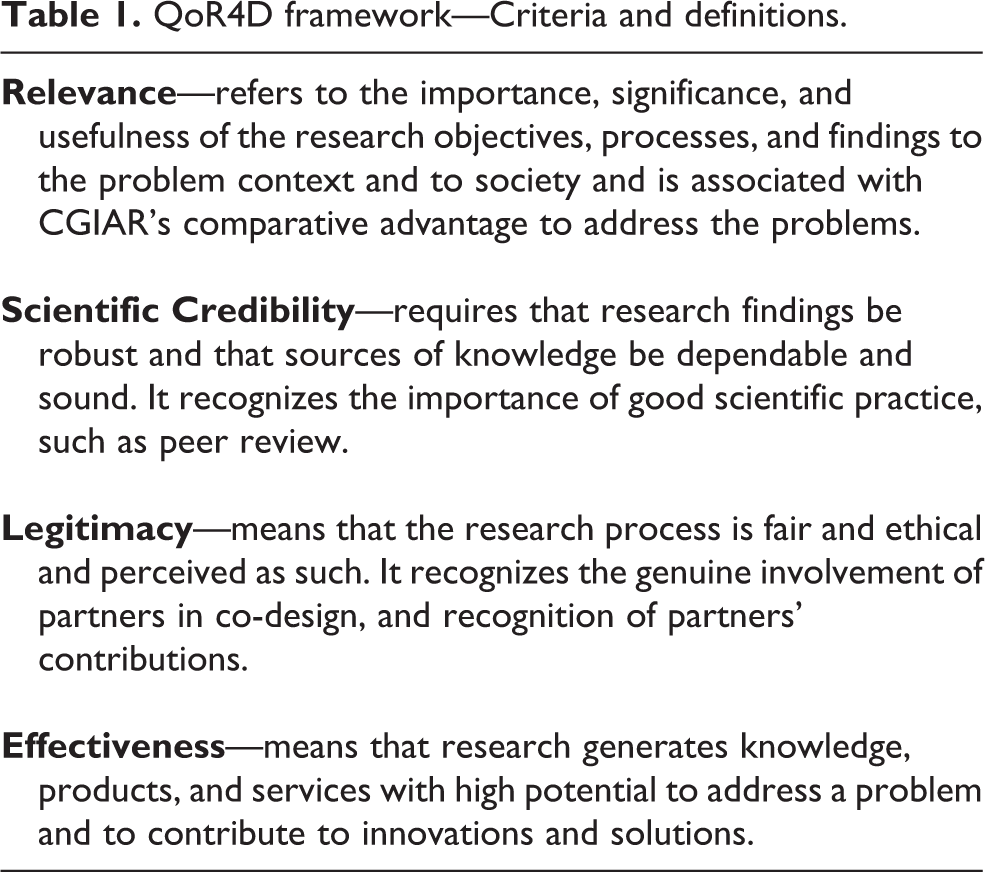
The ISPC successor, CGIAR Independent Science for Development Council (ISDC), confirmed in 2020, with some adaptations, the QoR4D frame of reference to guide the assessment of quality of research for development in the context of CGIAR centers and programs, 11 with the following elements: relevance, scientific credibility, legitimacy and effectiveness presented in Table 1 (ISDC, 2020). 12
QoR4D framework—Criteria and definitions.
This perspective paper aims to provide an overview of methods, that have been used to evaluate QoS in the 2020 evaluative reviews of the Phase 2-CRPs (Figure 1), 13 with a focus on bibliometric analyses, to formulate recommendations for streamlined processes around the handling and use of bibliometric data to enable future QoS assessments in a comparable and standardized ways. In the 2020 evaluative reviews, for the first time, the QoR4D frame of reference was utilized across the CGIAR CRP portfolio 2017–2021. 14 The CGIAR Research Portfolio has been structured around two linked clusters of challenge-led research.
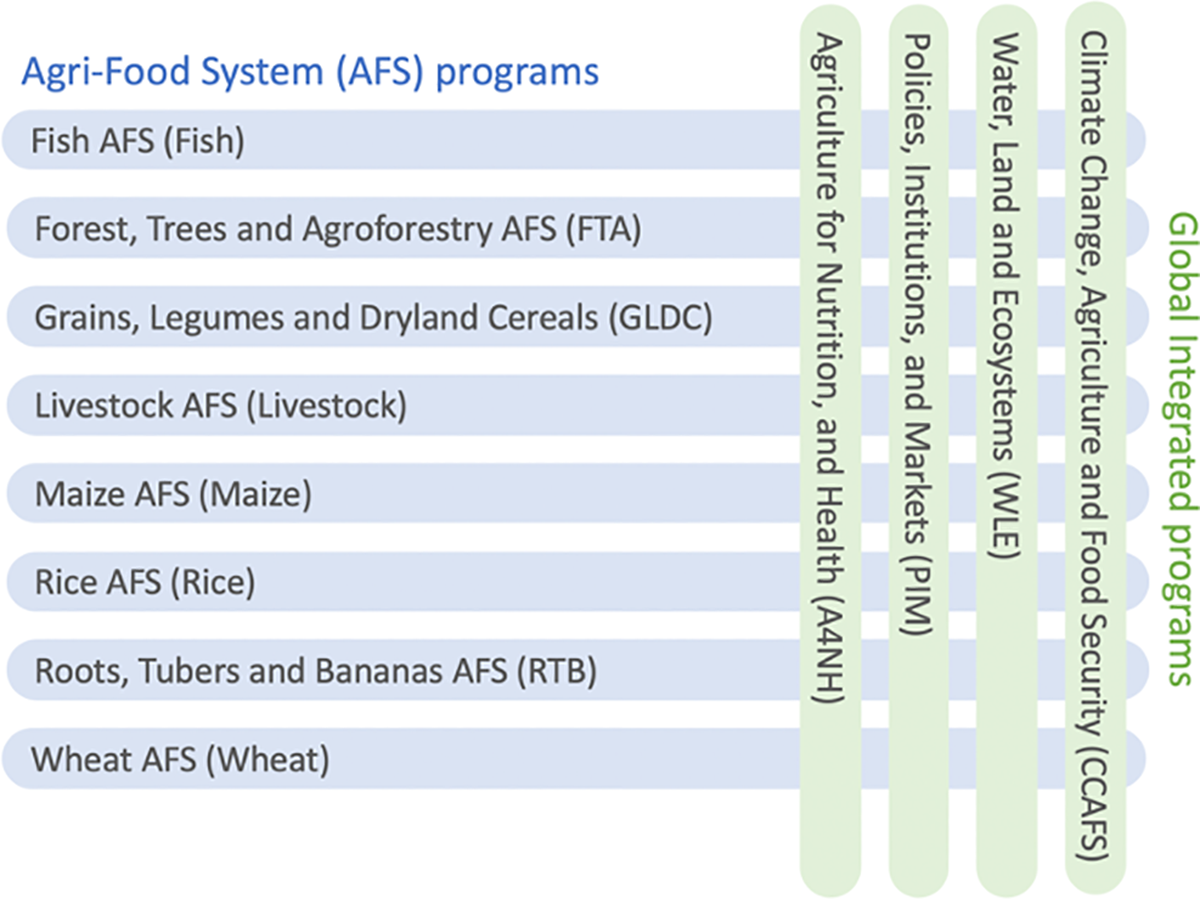
Portfolio of CGIAR research programs (CRPs)—Phase 2 (2017–2021) (https://www.cgiar.org/research/research-portfolio/Research support platforms were out of scope of the CRP reviews).
By design, the 2020 CRP reviews adopted a lean approach with the use of only two evaluation criteria: quality of science and effectiveness. 15
– For evaluating the effectiveness of the CRPs, the OECD-DAC definition was adopted.
– For evaluating quality of science (QoS), only two out of four elements of the QoR4D were considered, scientific credibility and legitimacy. The two elements have been assessed looking across research inputs, processes, and outputs, using a mixed methods approach, that encourages the use of both quantitative and qualitative assessment strategies.
This paper focuses on presenting the quantitative analysis (i.e., bibliometric and altmetric indicators) that has been carried out as part of a mixed-method evaluation.
Therefore, the objective of this perspective paper is not to discuss the advantages or disadvantages of using bibliometrics for evaluating QoS. Although the on-going debate on the merits of using the journal Impact Factor to measure the quality of papers is acknowledged, better indicators for the evaluation of recently published papers have yet to be identified (Slafer, 2008; Tregoning, 2018). Using the quality of the journal as a proxy for the likely impact of a paper has been found acceptable when evaluating recently published work (Slafer and Savin, 2020).
Methodology
This perspective paper outlines the methodology adopted for the 2020 CRP reviews, which was unique in using a suite of bibliometrics in a standardized and semi-automated way from a single data source. The Web of Science 16 Core Collection database was used in combination with the R package Bibliometrix 17 to systematically utilize both descriptive statistics and graphic visualizations of network analyses, including collaborations and author keywords across all CRPs. To do so, all CGIAR publications were downloaded from the CGIAR results dashboard (i.e., the underlying dataverse repository). Then, all non-ISI (i.e. Institute for Scientific Information) publications as well as all duplicates were eliminated for each CRP. Notably, a publication’s Digital Object Identifier (DOI) was used as a unique identifier. Given that CRPs collaborate on publications, and each CRP reports their publication in the annual report, duplicates on the CGIAR level were tolerated compared to CRP-level duplicates, which were eliminated. Finally, for each CRP, the unique ISI DOIs were checked in Web of Science and downloaded for analysis. Whenever an ISI article was missing a DOI, a title-based query was performed to assign. In addition, we have relied on altmetrics, 18 to enrich the bibliometric indicators with metrics on the use of scientific publications beyond indexed publications.
It should be noted, that the quantitative instruments we provided to measure and evaluate legitimacy and scientific credibility are considered as parameters (i.e., proxies) rather than criteria within the realm of bibliometrics and altmetrics; they are partly described throughout this section. Furthermore, all elements of assessing QoS, including altmetrics and bibliometrics, are not field-normalized by funding and funding source, i.e. pooled CGIAR funding or bilateral donors funding specific projects aligned to the CRPs.
It is important to emphasize that comparisons should not be made between CRPs, due to presentation of non-field normalized figures: there are important differences in terms of total budgets and allocation of indirect research costs, host centers research infrastructures, and numbers of scientists associated with the performance of individual CRP.
Legitimacy
Network graphs allow visualizing dependencies and interdependencies of subjects under analysis. In the realm of bibliometrics, these can visually depict the frequency and depths of collaborations between countries, based on author affiliation (compare Figure 3 and Figure 6).
The collaboration across countries based on author affiliations is visualized by the fact that the size of each node reflects the amount of publications by a particular country (that is, the researchers affiliated with an institution or organization from that country) while each link is an authorship. This is a graphic representation of the relationships between collaborating organizations and institutions across countries.
Scientific credibility
The following research outputs were analyzed throughout the descriptive statistical analysis: the ratio of publications that counted more than 10 citations, as well as the percentage of publications that was published in indexed publications, i.e. publications indexed by the Web of Science (Core Collection).
The aim of the author keyword analysis is to draw the conceptual structure of a framework using a word co-occurrence network to map and cluster terms extracted from author keywords in a bibliographic collection. This qualitative and quantitative analysis is performed on the type of research focusing on the content of publishing, and is used to quantitatively verify the focus area of publications based the keywords used.
Assessing legitimacy and scientific credibility with bibliometrics—Findings
In Tables 2 to 5 below, among the myriad bibliometric and altmetric outputs, we highlight indicators and showcase a few graphic visualizations and parameters in the areas of legitimacy and scientific credibility, followed by discussion in the next section of this paper. These quantitative indicators have been used in combination with qualitative indicators (i.e., a narrative based on expert analysis was presented in the CRP reports). Overall, the CRP reviews show a significant output of scientific publications with 4,872 articles, 220,101 references, and 7.1 citations per article (Table 1). The ranged across different CRPs and indicators is depicted in Table 3, including the lowest and highest values for 15 indicators.
Key bibliometric data, by types of indicators and information on scope of analysis.a
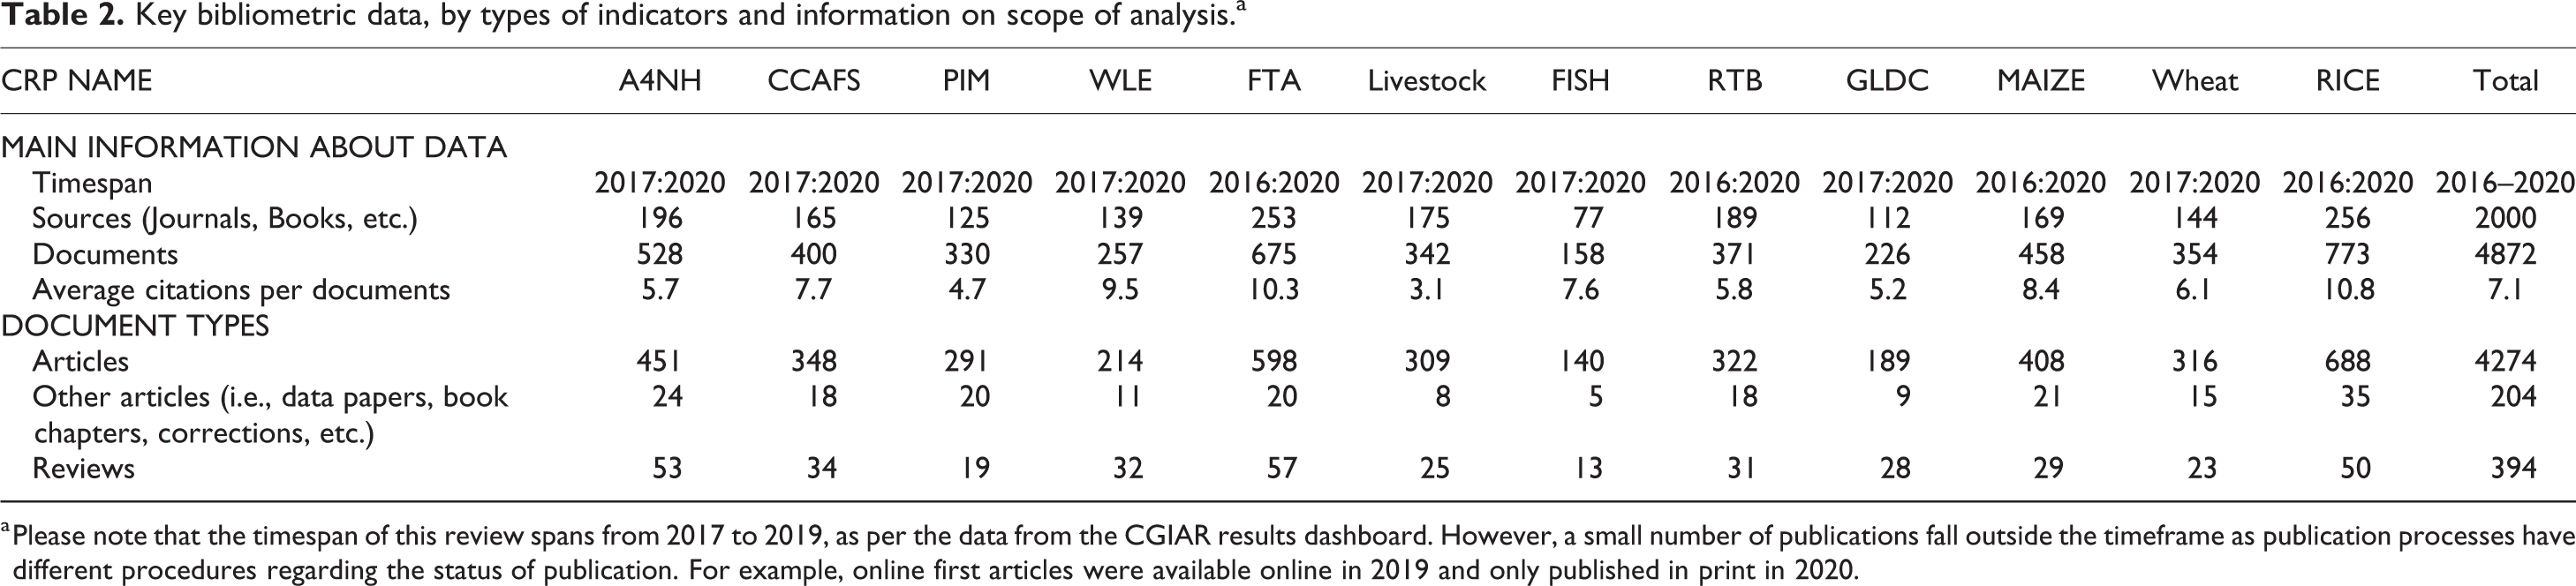
a Please note that the timespan of this review spans from 2017 to 2019, as per the data from the CGIAR results dashboard. However, a small number of publications fall outside the timeframe as publication processes have different procedures regarding the status of publication. For example, online first articles were available online in 2019 and only published in print in 2020.
Overview bibliometric data, including authors and author collaboration.a
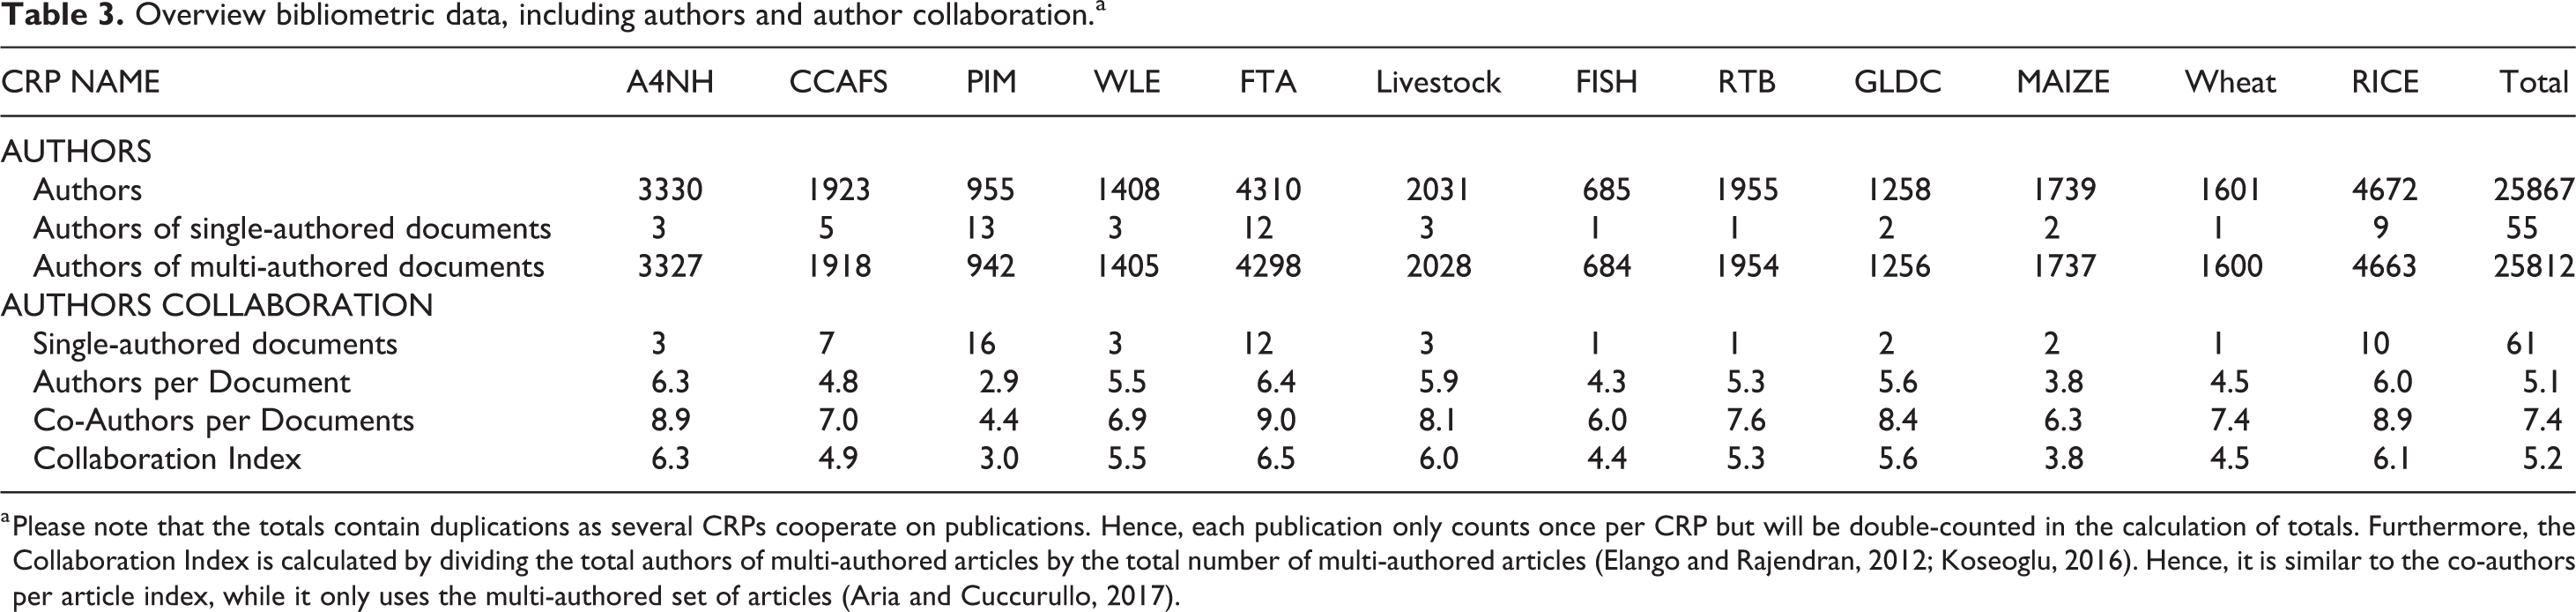
a Please note that the totals contain duplications as several CRPs cooperate on publications. Hence, each publication only counts once per CRP but will be double-counted in the calculation of totals. Furthermore, the Collaboration Index is calculated by dividing the total authors of multi-authored articles by the total number of multi-authored articles (Elango and Rajendran, 2012; Koseoglu, 2016). Hence, it is similar to the co-authors per article index, while it only uses the multi-authored set of articles (Aria and Cuccurullo, 2017).
Overview of impact factor and journal citation report (JCR) quartile data.a
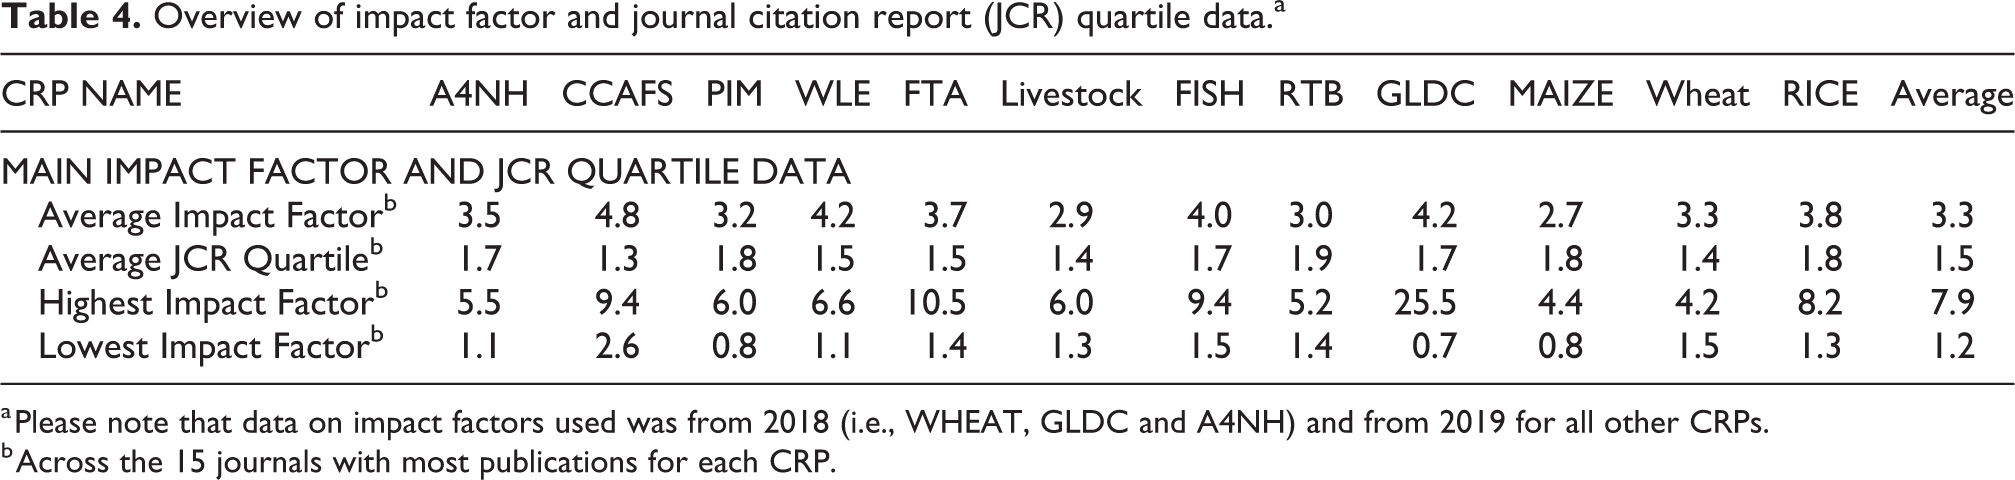
a Please note that data on impact factors used was from 2018 (i.e., WHEAT, GLDC and A4NH) and from 2019 for all other CRPs.
b Across the 15 journals with most publications for each CRP.
Overview of altmetric data, including attention and individual scores.a
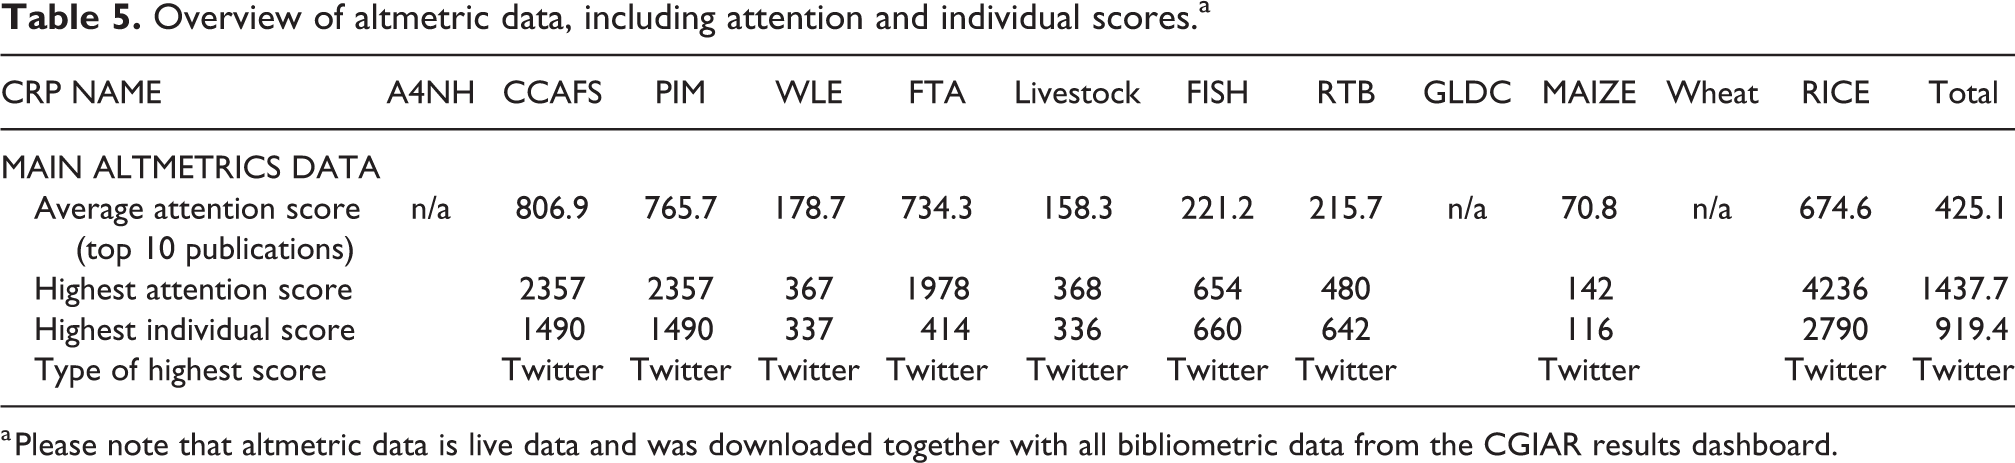
a Please note that altmetric data is live data and was downloaded together with all bibliometric data from the CGIAR results dashboard.
Legitimacy
As a parameter for legitimacy, we have identified the country collaboration network, which could be used to assess the geographical scope of the CRP’s research networks. On the CGIAR-level, the diversity and scope of CRP level collaboration can be visualized well in Figure 2.
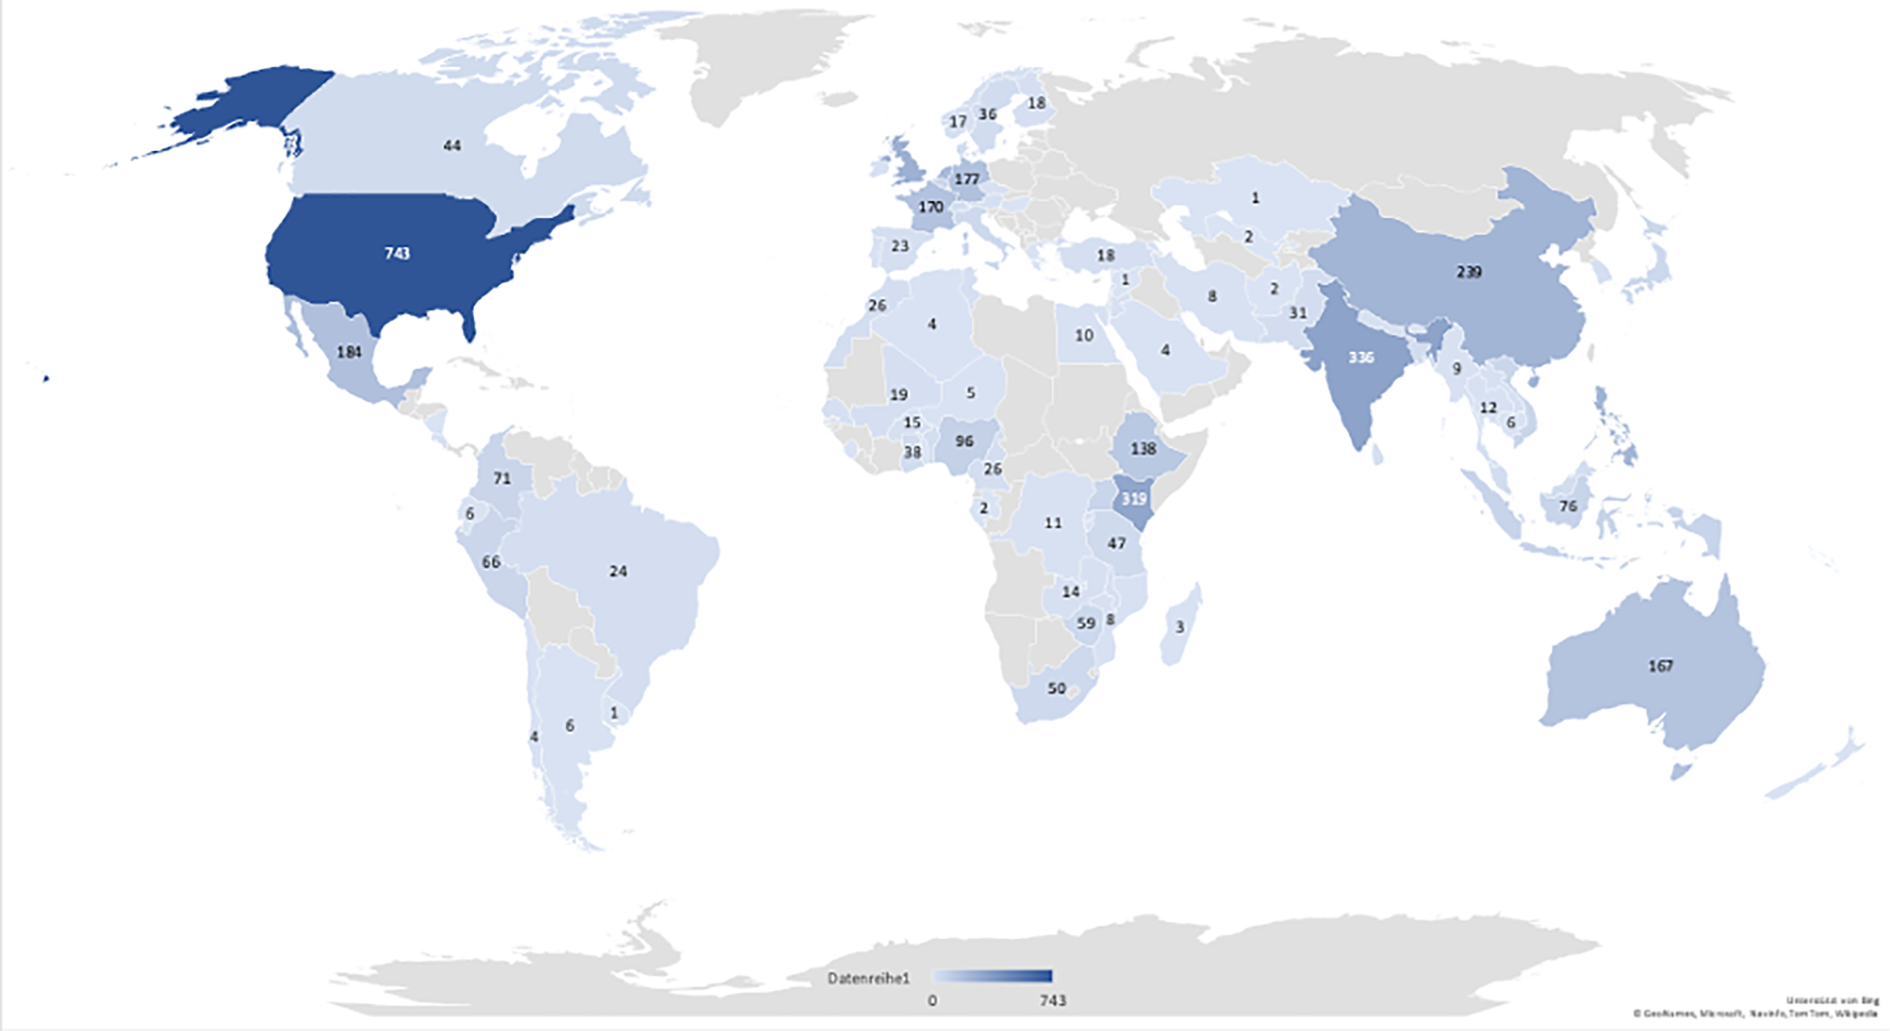
Number of publications by CGIAR research programs across the world (2016–2020).
While it is evident, that the US hosts most university affiliations with 743 publications, a closer look at Figure 2 shows a somewhat equal distribution of publications across the Americas (24%), Europe (24%), Africa (22%) and Asia (26%), with a significantly lower percentage of publications stemming from Australia and Oceania (4%)
For extra nuancing the below presentation, we note an opportunity to dwell into exploration of gender diversity in authors. Bibliometrics data of CRPs do not easily breakdown by gender, however it would have been possible to use the given name and surname of each author to determine the probability of the author being a man or a woman. A similar approach was proven highly accurate for U.S. authors, enabling the computation of robust indicators at highly disaggregated levels (Science-Metrix, 2018). While the United States of America can also be compared with other leading countries at a more aggregated level, the CRPs spanning across 15 centers globally would make such an exercise challenging. With regard to the notion of gender bias in citations, Andersen et al. (2019) showed some studies supporting and rejecting this idea.
On the CRP-level, legitimacy can best be described with a country collaboration network. The network is a visual representation of the occurrence and co-occurrence of joint authorships. That means, that the size of a node indicates the number of publications from a given country as per the affiliation of the authors, and the strength of the connection indicates the relative frequency of publications between two countries, indicating collaborative realities, including north-south or south-south collaborations, etc. CRP research functions through partnerships. Recognition of the contribution of these partners to the research process and outputs is central to strong mutually beneficial partnerships and a key part of legitimacy. For example, the Country Collaboration Network of the Grain Legumes and Dryland Cereals (GLDC) CRP (Figure 3) clearly illustrates the multiplicity of bilateral connections between countries.
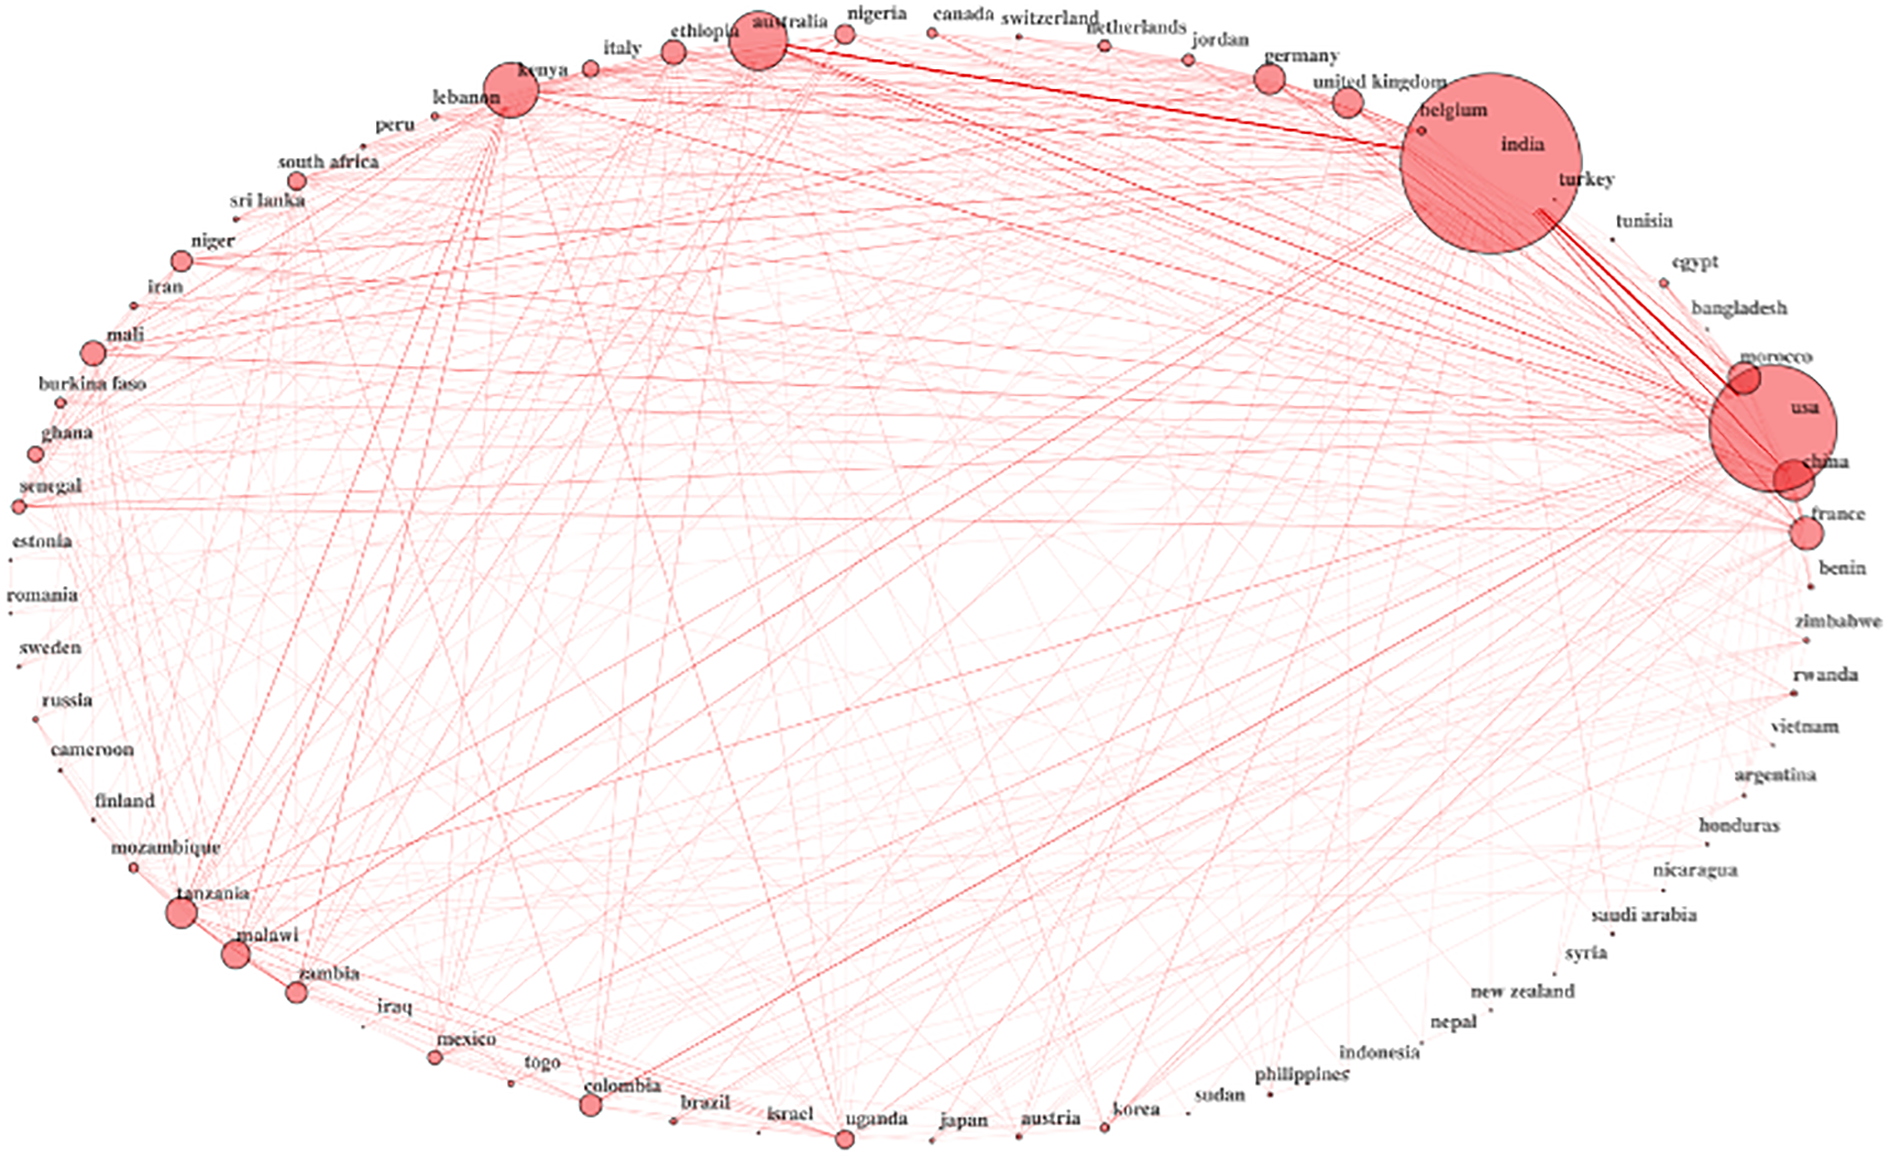
GLDC country collaboration network.
Interestingly, countries with bigger nodes are either those falling within the growing areas of GLDC crops, or host countries of the CGIAR centers participating in GLDC, or countries hosting advanced research organizations working on GLDC crops. The graphical representation of the country collaborations through the country collaboration network, serves as a good visual illustration of the qualitative assessments of partnerships, which, according to the methodology of the 2020 CRP Reviews, has been carried out through document analysis (i.e., reports, journal articles, technical reports, etc.) and interviews with key informants. There are, however, two limitations to Country Collaboration Networks based on the affiliation of authors: (1) the author’s affiliated institution’s nationality may differ from the country where the research was carried out or the data was collected. Also, (2) a CRP may have offices across different countries, which may count toward a multi-country publication while actually being a CRP-internal publication.
The degree of collaboration of a given CRP can be summarized using the Multi-Country Publication Ratio (MCPR): the percentage of publications per CRP where at least one author is affiliated with an institution located in a different country. Across the 12 analyzed CRPS, 84.8% are multi-country publications. This average is higher than other International Collaboration Rates (ICR) stated in the literature (Pinheiro et al., 2020). Pinheiro et al. (2020) show that 29,349 publications by International Agricultural Research Centers across the world have an average ICR of 78%. Notably, the MCPR is eight percentage points higher for Agri-Food System CRPs (87.1%) than of integrating programs (79.7%) (Figures 1 and 4). Among the high overall ratios, the Forests, Trees and Agroforestry (FTA) CRP MCPR showed to be the highest while the Policies, Institutions, and Markets (PIM) ratio was at the lower end of the spectrum (Figure 4).
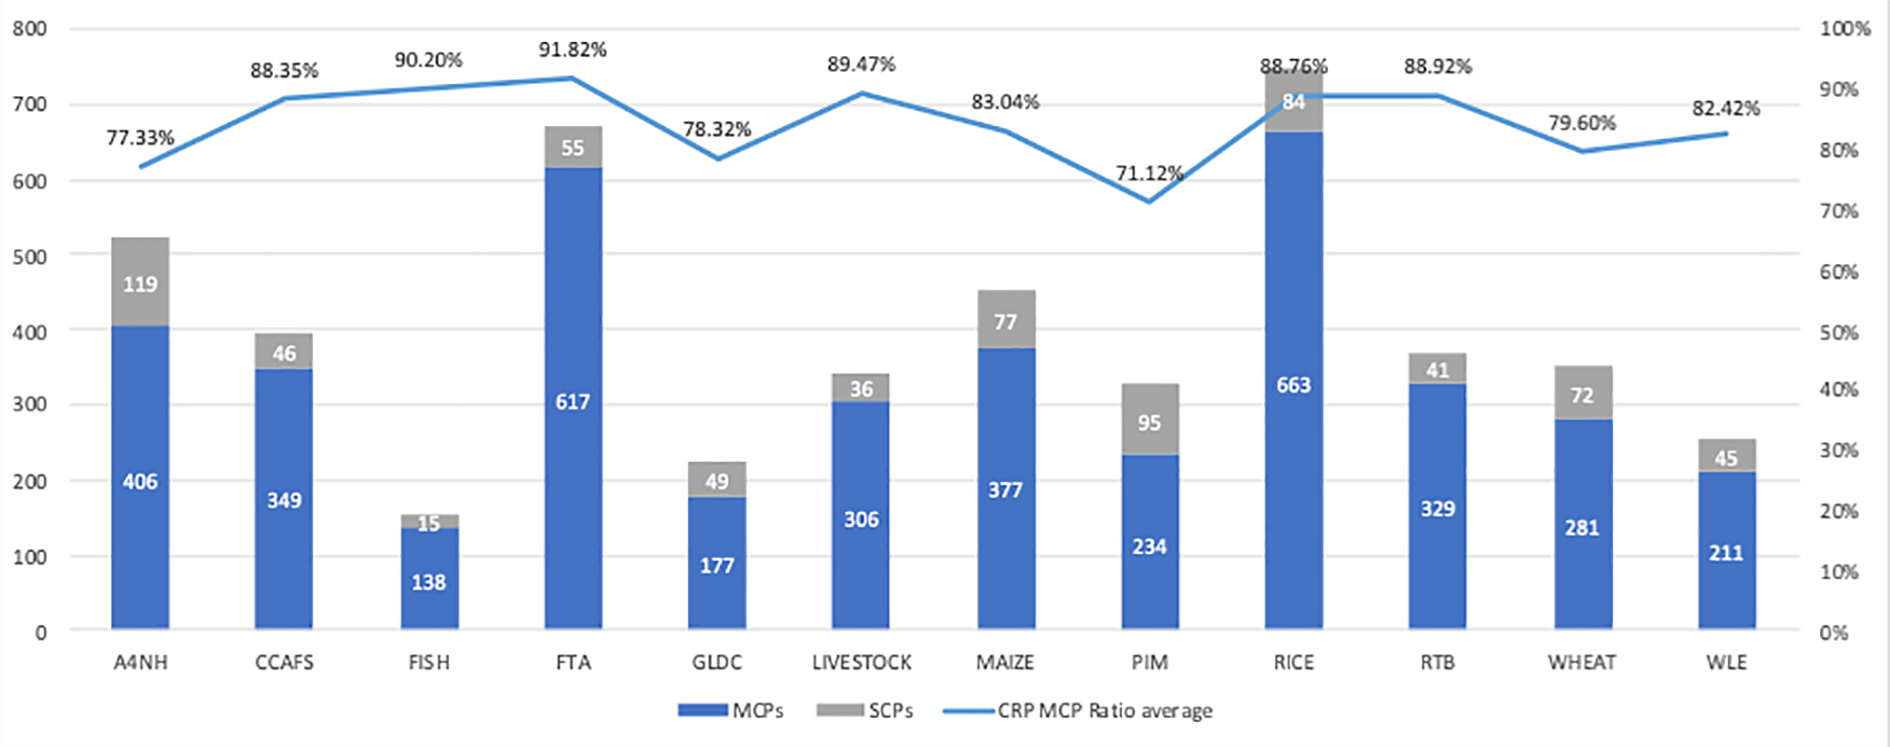
Multi-, single-country publications and multi-country publication ratio per CRP.
Scientific credibility
Conventional indicators for scientific credibility are presented in Table 3. Across the 15 journals with most publications for each CRP, we saw strong average impact factors (IF) and rankings. The former ranges from 2.7 to 4.8 with an average of 3.3, while the average journal ranking (JCR) ranges from 1.3 to 1.8 with an average of 1.5. It is important to note that different disciplines vary in the number of scientists active in the field, e.g. fish versus crop sciences. As the number of citations determine Ifs, those have to be considered in the context of JCRs.
Furthermore, as parameters for scientific credibility, we chose a combination of descriptive statistics depicted in Figure 5 and a form of network analysis (i.e., keyword analysis, Figure 6). Figure 5 shows both the ratios of publications that received more than 10 citations as well as the percentage of indexed (ISI) publications per CRP. Overall, the Agriculture for Nutrition and Health (A4NH) CRP shows the highest ratio of ISI publications with 92.4% while FTA shows the lowest ratio with 69.7%. Eight of the CRPs show less than 15% of non-ISI publications. As for the ratio of publications with more than 10 citations: FTA shows the highest percentage with 168 out of 678 (25%) and PIM, the lowest, with 29 out of 330 (9%).
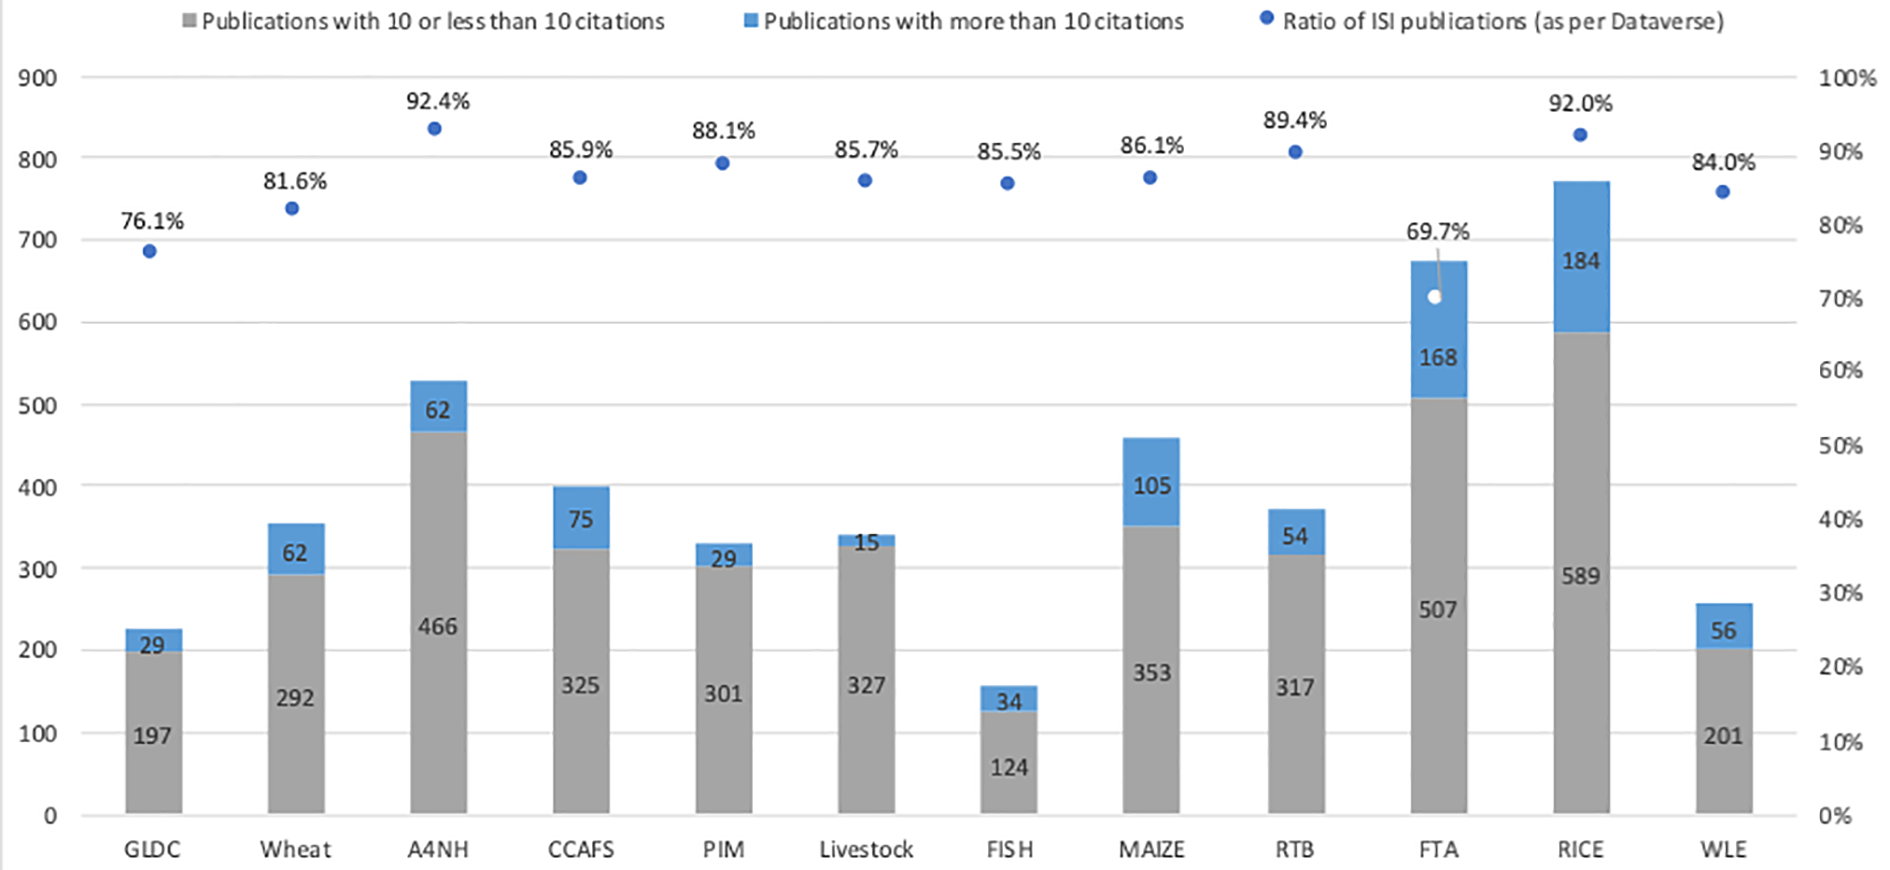
Publications with 10 and less/more citations and the ratio of ISI publications per CRP. Please note that Dataverse refers to the data repository underlying the CGIAR results dashboard, as outlined in the methodology section.
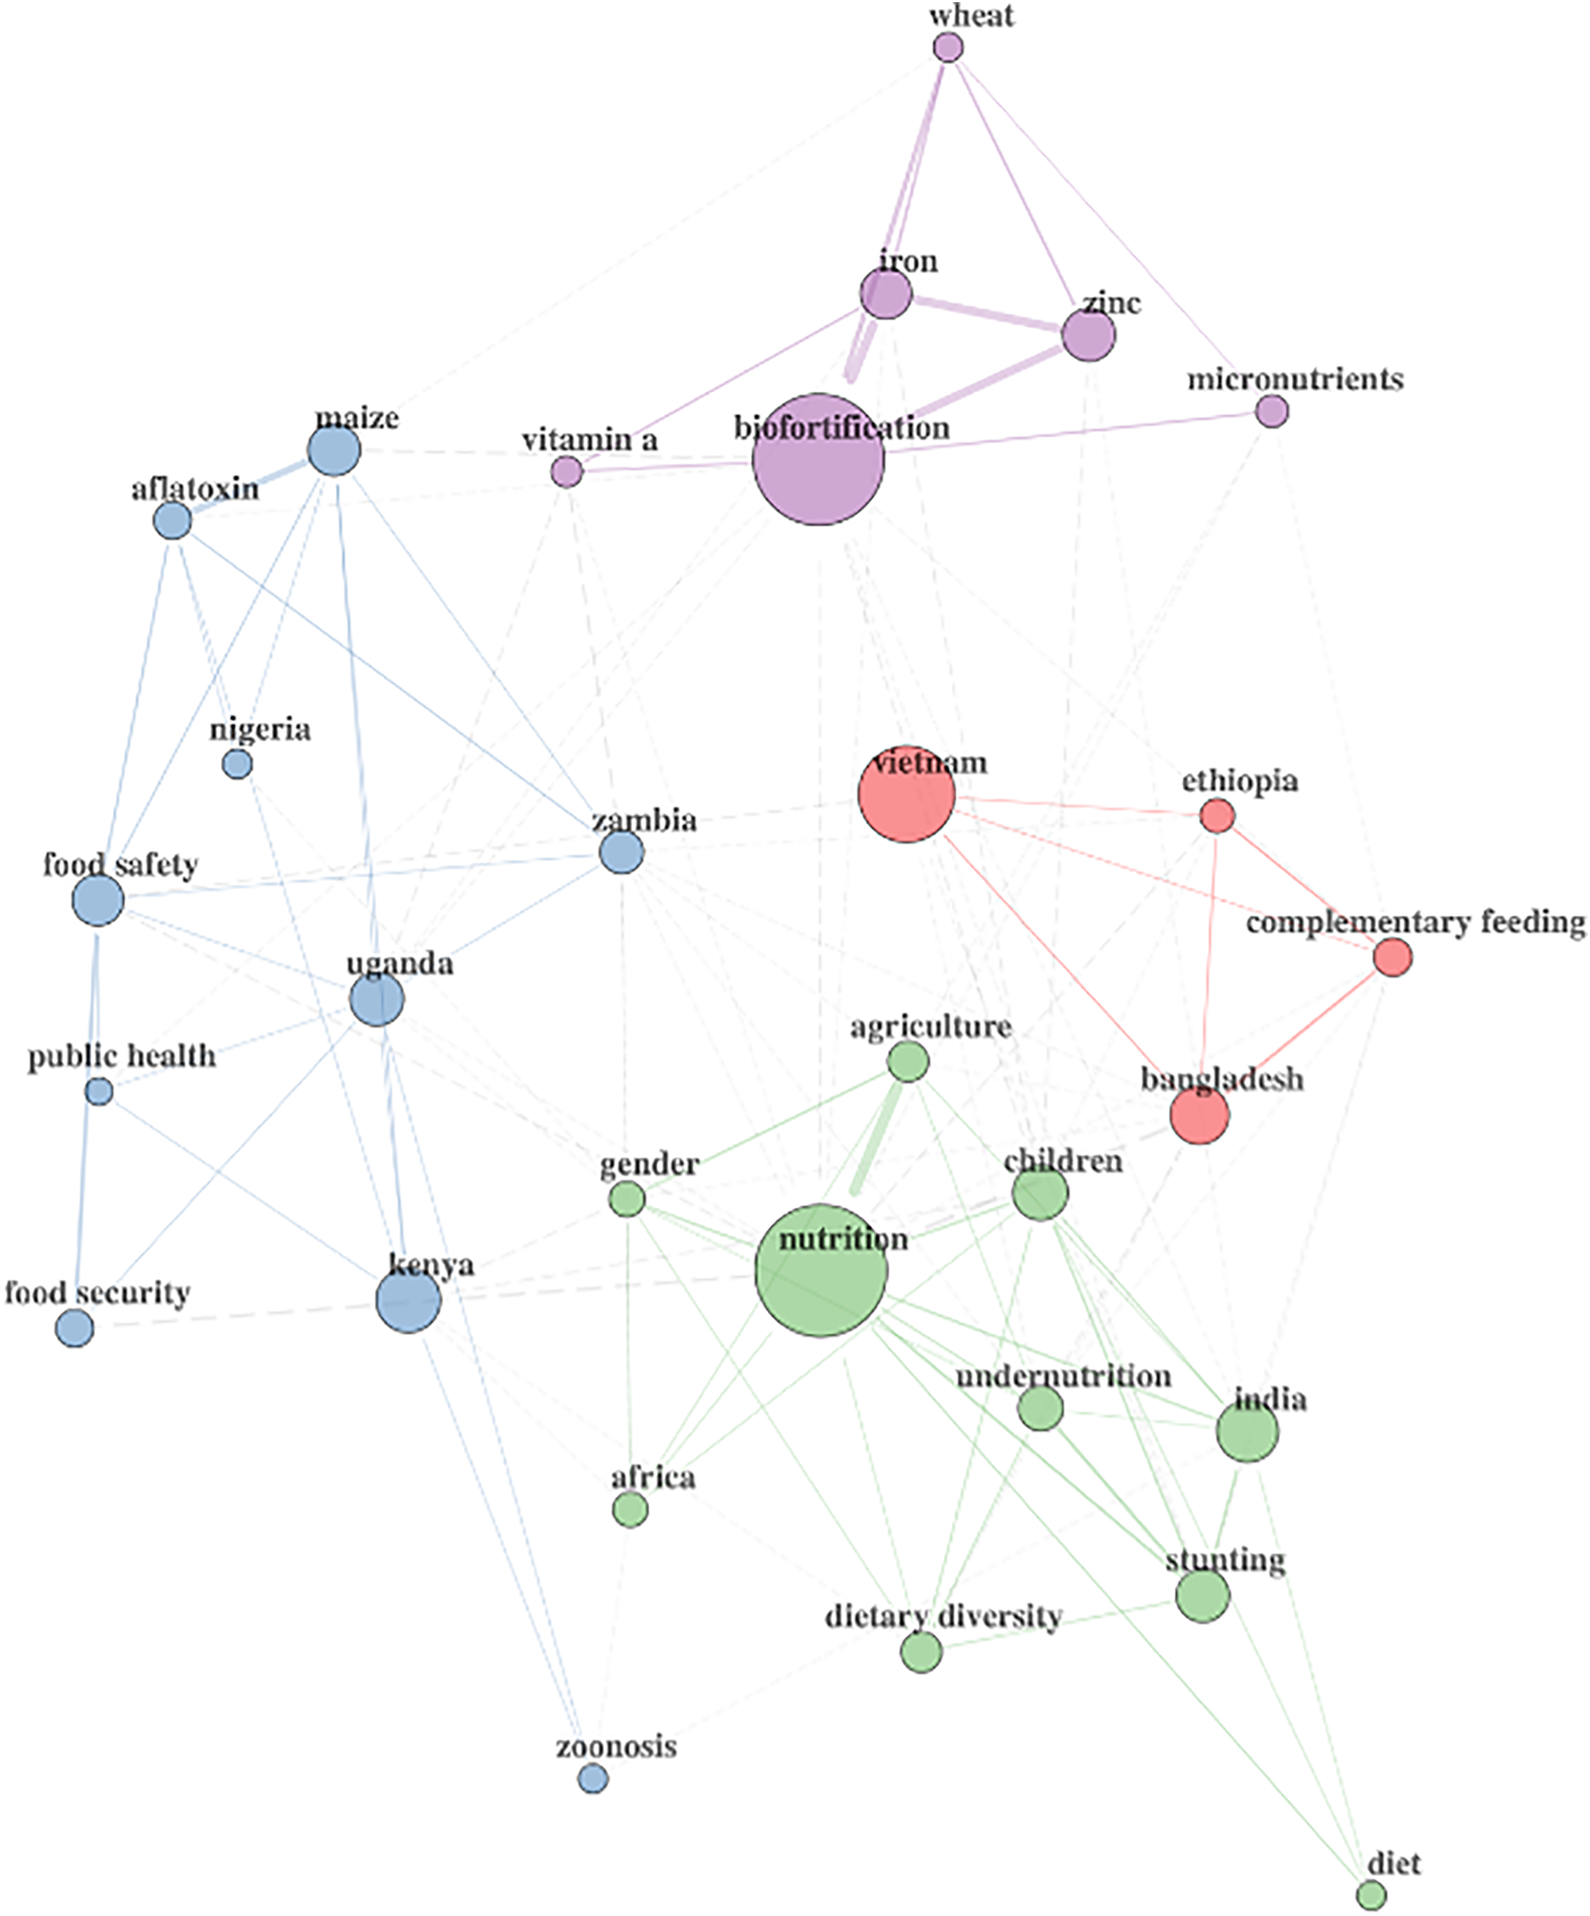
Author keyword co-occurrences for Agriculture for Nutrition and Health (A4NH) CRP.
Figure 6 for A4NH below shows another potential parameter for assessing the scientific credibility, namely an author keyword analysis of the publications from the A4NH CRP. The map presents a snapshot about the CRP main research domains: the size of the nodes shows the relative author keyword occurrence importance within the CRP, while the depth of the lines connecting more than two circles show the patterns of co-occurrences. Network analyses within the Bibliometrix-suite, as the author keyword co-occurrences displayed below, make use of the Louvain community detection algorithm for clustering (Aria and Cuccurullo, 2017).
Figure 6 shows four distinct author keyword co-occurrences clusters: Nutrition, diet, dietary diversity, stunting, children, undernutrition, agriculture, gender, India, and Africa (in green) Biofortification, micronutrients, vitamin A, zinc, iron, and wheat (in purple) Public Health, food security, food safety, aflatoxin, maize, zoonosis, Nigeria, Zambia, Uganda, and Kenya (in blue) Complementary feeding, Vietnam, Bangladesh, and Ethiopia (in orange)
These clusters seem not well interconnected, which could be interpreted as the different research domains are siloed within the CRP. It is also possible to identify research patterns by interpreting the keyword co-occurrences. Two examples of such patterns are: “aflatoxins in maize in Zambia” or “food safety and public health in Uganda.”
Lessons learned
The selected bibliometric indicators have been demonstrated as an adequate tool, to be used together with qualitative indicators to evaluate the QoS in the 12 CRPs.
Scientific credibility can be considered high across all CRPs, with a significant quantity of scientific publications in ISI journals with Open Access. This is also shown by using combined impact factors and journal rankings, the latter providing context to the particular research area. Most CRPs have also sought to publish in some of the highest impact journals such as Nature and Science. Additionally, wider interest in scientific publications is demonstrated by good to high altmetrics, with average attention scores ranging from 70.8 to 806.9 with an average of 425.1 (Table 5). In particular, Twitter is the most important means of communication across all CRPs.
As CRP research is implemented through diverse and abundant partnerships, which was underscored in the 2020 Reviews, it was expected that scientific legitimacy would score well with bibliometrics. For example, the percentage of multi-authored publications from a single institute in GLDC and RTB were less than 5% respectively. Using the author collaboration index—percentage of joint publications where partnerships are given due recognition—and the multi-country assessment, recognition of the contribution of partners to the research design and outputs was clearly demonstrated through bibliometric indicators. In addition, future reviews could further enhance the MCPR by normalizing the collaboration data by institutions.
Overall, the 2020 CRP Reviews showed that the CGIAR scientific work and stakeholder partnerships and networking efforts are robust and effective. CRPs have generated a significant quantity of high-quality scientific publications which are well-recognized by peers. Scientific credibility, the 2020 Reviews argue, is therefore currently very high but is at risk due to the funding issues. Furthermore, partnerships have been essential for delivering on high quality outputs and a strong network of partners from seed companies to National Agricultural Research Systems (NARS) and advanced research institutes have been key to high quality QoS at all levels. Finally, scientific legitimacy is reported in 2020 Reviews final reports to be good, particularly for the genuine involvement of partners in co-design, and recognition of partners’ contributions. The figures presented throughout this perspective paper complement the above conclusions through graphic representations.
Moreover, having metrics allows for concrete measurement for scientific output, quality, and diversity of inputs and outputs across countries and topics with its inherent biases. These metrics has been used by the reviewers to support their qualitative analysis of inputs, processes and outputs, including journal articles, technical publications, germplasm, digital innovations, and communication products.
At the same time, the Bibliometrix package developed by Massimo Aria and his colleagues (Aria and Cuccurullo, 2017) are more comprehensive and provide additional bibliometrics that could also be used to analyze QoS, particularly relying on the package’s visualization capabilities. To date, we have only scratched the surface of the R package’s functionality by focusing on summary statistics around author productivity, country productivity based on the authors’ affiliation and the average number of co-authors. Future research should also compare altmetrics and bibliometrics to assess potential congruences and correlations between the two types of metrics.
The CRP data used to perform the bibliometric analysis was obtained in August 2020 from the CGIAR Results Dashboard, an effort by the CGIAR to showcase the quality and quantity of the CRPs’ outputs. However, preparing clean data for the reviews revealed that improvements are still needed in the quality, accuracy, coherency and accessibility of the data inputs from each CRP also affected by interoperability of underlying databases. Critical to this was obtaining the DOIs of each publication—the scientific publication’s unique identifier which enables accessing the corresponding metadata related to the publication in a standardized manner from the Web of Science. The benefits from using the Web of Science or a comparable source, such as Scopus, as a single source of information are expedient as they undergo a standardized quality assurance process and maintain a high quality of accuracy and a wide range of metadata, including the abstracts, authors, affiliations, open access policy, and author keywords. Future research could hence analyze metadata not covered in this perspective paper, including open access and the added value through different levels of open access that were not looked at during the 2020 review using bibliometric indicators.
We have also learned that the quantitative instruments provided to measure and evaluate QoS as parameters (i.e., proxies) rather than criteria within the realm of bibliometrics and altmetrics, provide a solid foundation for the mixed-method approach. Nevertheless, more research is needed to solidify the methodology for analyzing QoS using both quantitative and qualitative methods as well as the guidelines for levels of quality, e.g. numbers of citations, etc. In particular, future reviews should study how bibliometrics and altmetrics correlate, support each other, and provide a more differentiated assessment of QoS, and how altmetrics contribute to legitimacy and scientific credibility.
One main difference between the selected QoR4D framework and the other two multi-dimensional approaches to evaluating QoS that we have considered (Belcher et al., 2016; Ofir et al., 2016), is the use of mixed quantitative and qualitative indicators. Therefore, in our case, greater emphasis is given to bibliometrics, which provide robust evidence to support qualitative assessments.
The 2020 CRP review process has clearly demonstrated that standardized, harmonized and consistent data on research outputs is paramount to provide high-quality quantitative instruments and should be a learning priority in the transition toward One CGIAR. More importantly, it has also shown that the QoR4D framework, augmented by bibliometrics could have a wider use throughout the implementation of the CGIAR 2030 Research and Innovation Strategy (CGIAR, 2021). Firstly, automated, real-time bibliometric indicators could be used to identify trends in the delivery of QoS to inform decision making of project managers, governance and funders. Secondly, they could be used for guiding learning needs during project identification and design. Lastly, bibliometric indicators have the potential to identify gaps based on further disaggregation’s such as diversity and collaboration parameters, i.e. gender of authors and depth and quality of collaborations.
It can be affirmed that this approach should be considered in other contexts, namely in evaluating different dimensions of QoS while utilizing a mix-method approach, relying on large amounts of different types of quantitative and qualitative data, delivered in automated and standardized reports and visualizations and embedded in qualitative assessments. Therefore, we conclude that the QoR4D framework should be augmented by standardized bibliometric indicators embedded in monitoring and measurement frameworks within the new One CGIAR, and its utilization in monitoring and evaluations should be supported with practical guidelines.
Footnotes
Declaration of conflicting interests
The author(s) declared no potential conflicts of interest with respect to the research, authorship, and/or publication of this article.
Funding
The author(s) received no financial support for the research, authorship, and/or publication of this article.