
Abstract
Research on environmental justice has revealed that various hazards can be created by deleterious planning decisions. Multihazard exposure, or the co-location of two or more hazards in a neighborhood, has been little studied to date. We examine heat and air pollution across the census block groups (CBGs) of 55 US cities to evaluate the distribution and sources of inequities in multihazard exposure. The study combines measures of temperature from a volunteer science campaign; air pollution from remote sensing; street density and tree canopy as hazard-driving infrastructure; and demographics. On average, heat and air pollution were moderately correlated across the CBGs of a city (
Introduction
Advocates for environmental justice have repeatedly called attention to the concentration of environmental hazards in disenfranchised communities and the planning and policy decisions that create such inequities (Agyeman et al., 2016; Bullard, 1994; Mohai et al., 2009). In the United States in particular, socioeconomically and racially biased policies have exacerbated hazards in marginalized communities while insulating richer, predominantly White communities. Examples include the placement of pollution-generating infrastructure alongside Black communities in Southern states (Bullard, 1994); “redlining” communities to prevent investment, resulting in places that are some of the hottest and most polluted in their cities (Hoffman et al., 2020; Lane et al., 2022); and the relegation of communities of color to low-lying areas that suffer greater damage from hurricanes (e.g., Collins et al., 2019).
The diverse outcomes of environmental injustice have inspired researchers and practitioners to recognize the cumulative effect of exposure to multiple hazards (Callahan and Sexton, 2007; Cushing et al., 2015; Krieg and Faber, 2004). However, just because environmental injustices can generate multiple types of hazards does not ensure that these hazards reliably come together. This is because the landscape of a given city is shaped through many discrete planning decisions and policies; each one will impact some hazards in some neighborhoods, but few will exacerbate all environmental hazards or impact all marginalized communities. Nonetheless, very few studies have tested whether environmental hazards correlate across a city’s neighborhoods or whether they coincide more often in marginalized communities.
This study introduces the concept of multihazard exposure—that is, the co-location of multiple hazards in a neighborhood—and its implications for equity by analyzing the distribution of heat and air pollution within 55 U.S. cities. We first quantify the prevalence of multihazard exposure in each city, defined as the correlation between heat and air pollution across neighborhoods. We further probe how this variation arises from the infrastructure of each city, including the distribution of streets and trees. Second, we evaluate demographic inequities in multihazard exposure, positing that a greater prevalence of multihazard exposure in a city creates both an incentive and readymade mechanism for the creation of environmental injustices: richer, more powerful communities do not want to live in such spaces and are likely to make decisions that lead disenfranchised populations to live there. Before proceeding to the analysis, we develop the concept of multihazard exposure and the hypotheses that follow.
The multifaceted concerns of environmental justice
Environmental justice research and practice responds to how planning decisions can lead to disparities in environmental hazards, and thus health inequities, across communities. The field was initially inspired by the construction of toxic waste disposal facilities alongside communities of color in the American South (Bullard, 1994; Cutter, 1995). By the beginning of the 21st century, however, activists and scholars had recognized that power imbalances in decision-making could lead to disparate exposures of all kinds, including “environmental goods and bads, consumption, service provision, climate change, resource extraction, intergenerational justice, access to ‘white spaces’, and sustainability” (Agyeman et al., 2016: 328).
As the foci of environmental justice diversified, the idea that multiple hazards might have cumulative impacts on health became increasingly popular. “Cumulative risk assessment” (CRA) sought to quantify the combined effects of both chemical (e.g., air pollution) and nonchemical (e.g., heat) hazards (Callahan and Sexton, 2007). CRA was embodied in government dashboards that overlaid multiple indicators of hazards across communities. Two notable examples are CalEnviroScreen, which tracks numerous forms of pollution and their potential impacts across California’s census tracts (August et al., 2021), and the U.S. Environmental Protection Agency’s EJScreen, which combines pollution, demographics, and more for the country’s census block groups (EPA, 2023). Analysis of such dashboards has found that cumulative risk is higher in low-income communities and communities of color (Cushing et al., 2015).
CRA, however, has been somewhat limited in its application to date. First, it has almost exclusively focused on various indicators of pollution and their sources. For example, none of the most used dashboards (including the two cited above) has incorporated heat or flooding. One exception that proves the rule is a project that combined data from hundreds of cities in dozens of countries to demonstrate that the impacts of heat on medical emergencies were exacerbated by air pollution but did not reference CRA (Rai et al., 2023; Stafoggia et al., 2023). Second, CRA has primarily emphasized the colocation of hazards as exacerbating impacts on health while paying less attention to whether hazards are consistently present in the same communities or the types of planning decisions that create such situations. This gap in our understanding of the origins of disparities is critical to unraveling the legacy of environmental justice (Huang and London, 2016; Soja, 2010).
Multihazard exposure
We introduce multihazard exposure—the colocation of two or more hazards in the same community—as a crucial source of cumulative risk. Given that various hazards are often more prevalent in marginalized communities, one might assume that multihazard exposure is common in those same places. That said, because environmental hazards are the product of discrete planning decisions, there are reasons to question this assumption. To illustrate, in the 1960s Boston, MA cleared buildings in the Black neighborhood of Roxbury for the construction of a highway (Crockett, 2018), intensifying heat and air pollution in that part of the city. This did not necessarily impact other hazards (e.g., flooding) or other communities of color in the city, however. Similarly, a trash transfer station, airport, or park will impact certain hazards in certain neighborhoods but will not impact all hazards in all neighborhoods of the same demographic profile.
The best way to predict the distribution of a given hazard is by identifying its geophysical drivers and the infrastructural elements that intensify those drivers. Let us apply this to multihazard exposure with the specific example of heat and air pollution, a combination of hazards that is particularly pernicious for health (Rai et al., 2023; Stafoggia et al., 2023). For heat, these infrastructural elements include a lack of tree canopy and a density of impervious surfaces (e.g., pavement; Huang and Cadenasso, 2016; O'Brien et al., 2020). The determinants of air pollution, meanwhile, include the presence of motor vehicles in conjunction with an “urban canyon” of tall buildings and narrow streets (Soulhac et al., 2008). Some argue that tree canopy can also absorb air pollution (Tallis et al., 2011; Yang et al., 2023), though recent work has questioned the strength of this effect because trees also diminish the airflow needed to disperse pollutants (Venter et al., 2024). It would then follow that major thoroughfares can create multihazard exposure by intensifying heat through a density of pavement, and air pollution through the presence of many vehicles. In contrast, a dense tree canopy may do the opposite by absorbing both heat and pollutants.
The placements of roads and trees constitute independent planning decisions, and the extent to which major thoroughfares feature trees could play a significant role in shaping the overall intensity of multihazard exposure across a city. Preliminary evidence for this comes from the two studies we know of that have evaluated the correlation between heat and air pollution across the neighborhoods of a city. Heat and air pollution were correlated in one study (r = 0.4 in Boston; O’Brien and Mueller, 2023) but not in the other (r = 0.1 in Camden, NJ; Sabrini et al., 2020), suggesting that their correlation is not guaranteed. In Boston, the correlation was driven by the distribution of transportation corridors, highlighting the crucial role of infrastructure planning. This would be consistent with the hypothesis that in cities whose transportation corridors have little canopy coverage, heat and air pollution are more likely to become concentrated together in certain pockets, creating multihazard exposure. Similar logics might be developed for other combinations of hazards.
Multihazard exposure is a noteworthy case of how power in planning decisions leads to disparities in exposure. Cumulative risk poses a “wicked problem,” in part because the multiple drivers involved do not lend themselves to a single intervention or solution (Huang and London, 2016). Thus, in a city where multihazard exposure is already true in some neighborhoods and not others, those with resources will seek to ensure that they are insulated from these threats. This is reflected in housing prices across the United States (Bakkensen et al., 2024), as well as planning decisions that reinforce or even exacerbate disparities (Sarkar et al., 2024; Soja, 2010). As such, multihazard exposure might act as both a mechanism and incentive for environmental injustice.
Current study and hypotheses
We present an initial examination of multihazard exposure across 55 U.S. cities spanning the country’s geographic and demographic range, combining locally sensed heat data from a volunteer science campaign with remotely sensed air pollution data. We organize the study around a two-part framework that is illustrated in Figure 1. The first component of the framework regards the infrastructural elements that generate multihazard exposure. The second component regards the extent to which multihazard exposure is distributed inequitably across demographic groups. A two-part framework for the pathway from infrastructural drivers of environmental hazards to multihazard exposure to demographic inequities. For the former, we hypothesize that the co-location of infrastructural drivers of heat and of air pollution will result in more multihazard exposure in a city (H1). For the latter, we hypothesize that cities with more multihazard exposure will place these burdens more heavily on disenfranchised communities (e.g., low-income; H2). We anticipate that this latter relationship results from the concentration of hazard-driving infrastructure in disenfranchised communities (H3), which in turn drive inequities in multihazard exposure (H4).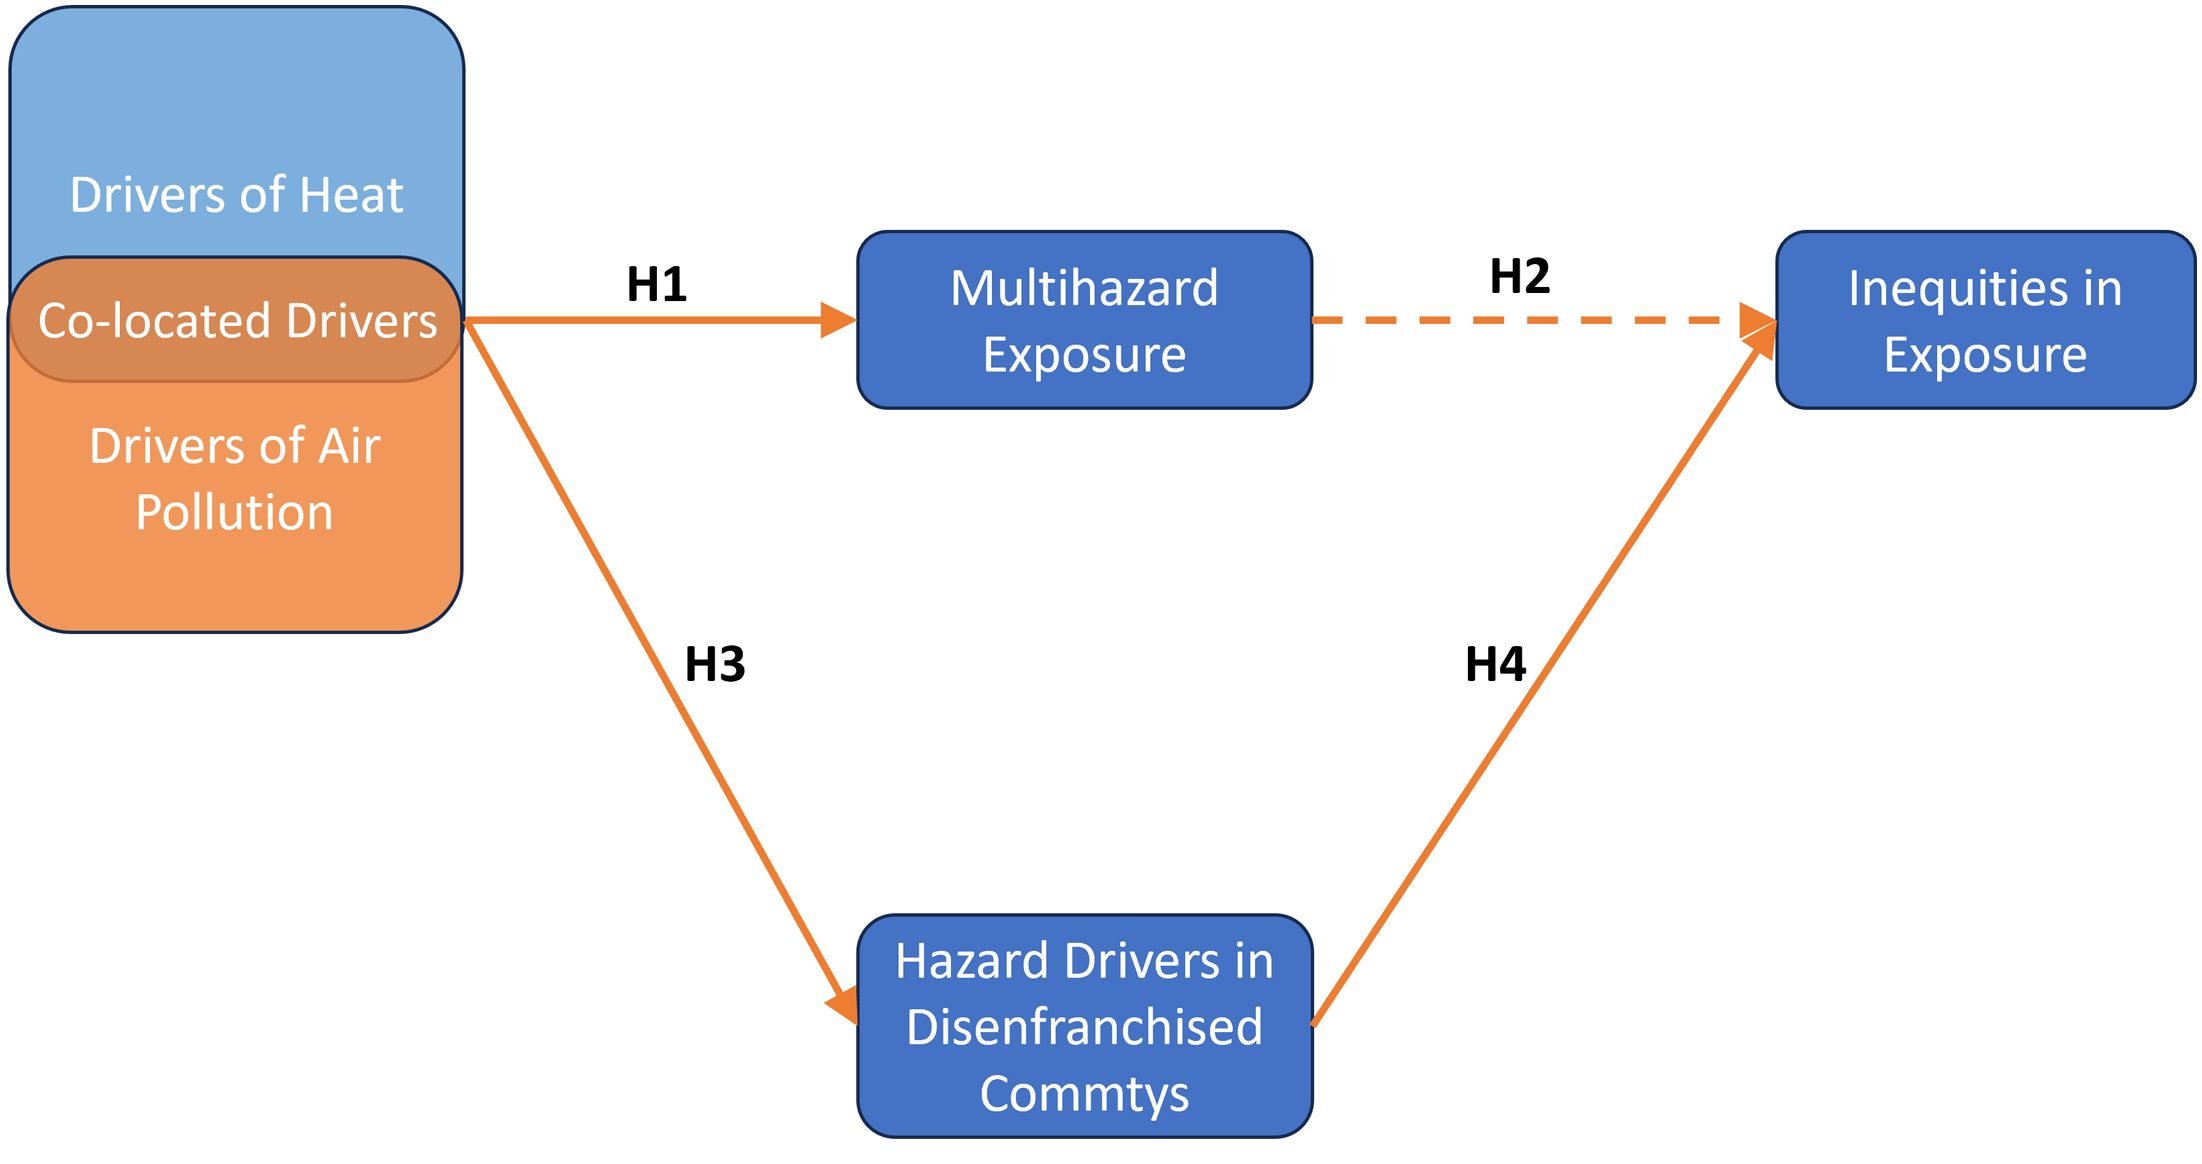
To examine the first component of the framework, we measure levels of multihazard exposure across cities as the correlation between heat and air pollution. Given current knowledge about the drivers of both heat and air pollution, we hypothesize that multihazard exposure will be most common in communities with high levels of pavement, low levels of tree canopy, or both (Hypothesis 1a). A corollary of this hypothesis is that cities will vary in their multihazard exposure, contingent on the extent to which these hazards are co-located (Hypothesis 1b). That is, multihazard exposure will be highest in cities where neighborhoods with high street density lack trees and lowest in cities where trees mitigate the hazards generated by streets. We note that the understanding of hazard drivers has become increasingly nuanced in recent years, especially regarding the ways the effects of tree canopy can be moderated by slight differences in design and maintenance (e.g., Jung et al., 2024; Yan et al., 2023). Our goal is not to advance the science of hazard drivers but to demonstrate the distribution and origins of multihazard exposure, for which traditional measures of tree canopy coverage are sufficient. Additionally, though the benefits of trees for air pollution have been questioned (Venter et al., 2024), they do seem to stand for particulate matter (Grylls and van Reeuwijk, 2022), which is what we measure here.
We examine the second component of the framework by assessing whether and how the presence of multihazard exposure in a city translates into demographic inequities, focusing on income (we replicate analyses for racial inequities in the Supplemental Online Materials; SOM). We hypothesize that in cities with more multihazard exposure, there will be greater disparities in exposure between high- and low-income neighborhoods (Hypothesis 2). Further, we hypothesize that this relationship will emerge through two relationships. First, such cities will be more likely to have poorer populations living in communities with more streets and fewer trees (Hypothesis 3). In turn, those populations will experience higher levels of multihazard exposure (Hypothesis 4).
Methods
We analyze measures of heat, air pollution, street density, canopy coverage, and demographics from a range of sources for 55 U.S. cities included in NOAA’s National Integrated Heat Health Information System, which was a volunteer science effort organized by local partners in each city. Given the non-random nature of this sample, we compared its demographic and geographic characteristics to the 75 largest U.S. cities, finding minimal, non-significant differences in socioeconomic status, median age, education levels, and racial and ethnic composition (see Supplemental Online Materials; SOM). Each data source was accessed at or aggregated to census block groups (CBGs), our geographic approximation of “neighborhoods” for within-city analyses, and then further aggregated to calculate city-level descriptors. We note that the NOAA data were collected between 2017 and 2022, whereas the air pollution, street density, and canopy coverage data were each generated for a single year during that time period. Most of these features are relatively stable year-to-year, except where there are major construction efforts, so we anticipate that these temporal discrepancies will have little impact on our results. Given the temporal flexibility provided by rolling releases by the U.S. Census, we use indicators from the American Community Survey that immediately precede the earliest of the other data sets (2012–2016 5-year estimates) to avoid any concerns of reverse causation between environment and demographics.
Data
Temperature
We used high-resolution temperature data collected through a volunteer science campaign organized by NOAA’s National Integrated Heat Health Information System and the CDC with local institutions (e.g., Boston’s Museum of Science) who signed up to lead data collection efforts in their cities. In each city, data were collected by multiple cars over the course of a single daytime hour on a single day between 2017 and 2022, ensuring comparability across measurements and relevance to human exposure. These data were previously available at https://www.heat.gov/pages/nihhis-urban-heat-island-mapping-campaign-cities, but have since been removed.
As of this analysis, 1800 volunteers had collected 5 million data points across 60 cities using sensors attached to volunteer cars. Data were then extracted with machine learning algorithms to ensure validity (Shandas et al., 2019). Data were published as rasters composed of 10 m × 10 m grid cells. We calculated the proportion of each CBG that overlapped with each grid cell, using these proportions to calculate a weighted average temperature for each CBG. We analyze 55 of the 60 cities (n = 23,806 CBGs) owing to limitations of access and data quality. We also performed a robustness check with another measure of mean summer temperatures based on satellite data from Landsat 7. These supplementary analyses are described in the SOM.
Air pollution
We estimated air pollution using annual average PM2.5 (µg/m3) values from 2017 published by Washington University of St. Louis (Hammer et al., 2020). The data were in a grid with resolution of 0.01° × 0.01° (approx. 1.1 km × 1.1 km). The calculation of air pollution for each CBG followed a similar process to temperature, though the grid cells were more comparable to size of a single CBG. Thus, the typical CBG was split between a small number of contiguous grid cells, though some were contained in a single grid cell.
Street density
Street infrastructure was queried from OpenStreetMaps using the OSMnx Python package, which allows researchers to download and model walking, driving, or biking networks at various levels of geographic granularity (Boeing, 2017). We calculated street density for every CBG in each city by tabulating the number of streets and dividing by the CBG’s total area.
Tree canopy
We calculated tree canopy density for every CBG in each city using the 30 m × 30 m National Land Cover Database (NLCD) 2021 Tree Canopy dataset from the Multi-Resolution Land Characteristics Consortium. The NLCD Tree Canopy is projected into binary format with 1 equal to tree cover for each grid cell. As with the temperature data, we identified the intersection of grid cells for each CBG and then calculated a weighted average to reflect the proportion of land covered by tree canopy. The average CBG in our sample contains 424 NLCD grid cells, resulting in a CBG-level measure of canopy coverage with sufficient variation for analysis.
Demographics
Demographic characteristics were accessed for all CBGs from the U.S. Census Bureau’s 2012–2016 American Community Survey (ACS) estimates, including median household income, percentage non-white residents, and population density. We also incorporated the percentage of residents commuting to work by car as a possible correlate of the relationship between hazards and transportation infrastructure.
City-level measures
We constructed city-level measures in three ways. First, we described citywide conditions through the population-weighted average of a city’s CBGs. Second, we estimated variation in conditions as the variance across a city’s CBGs. Third, we used the statistical relationship between two or more variables to describe a city’s composition. Most prominently, our primary indicator of the prevalence of multihazard exposure in a city was the correlation between temperature and air pollution across its CBGs. Cities with a higher correlation between these hazards had more communities suffering from both hazards more intensively than other neighborhoods in the city, which is the definition of disparities in multihazard exposure. We used a similar strategy to calculate measures for socioeconomic disparities in hazard-driving infrastructure (i.e., the association between income and the combination of street density and canopy coverage) and inequities in multihazard exposure (i.e., the association between income and above-median heat and air pollution).
Analysis
Between-city variation was analyzed using a series of Ordinary Least Squares regressions. Within-city variation was examined with multilevel models testing the extent to which infrastructure and demographics explain variations in hazards across the neighborhoods of a city. These models nested CBGs within cities and took the following form


Results
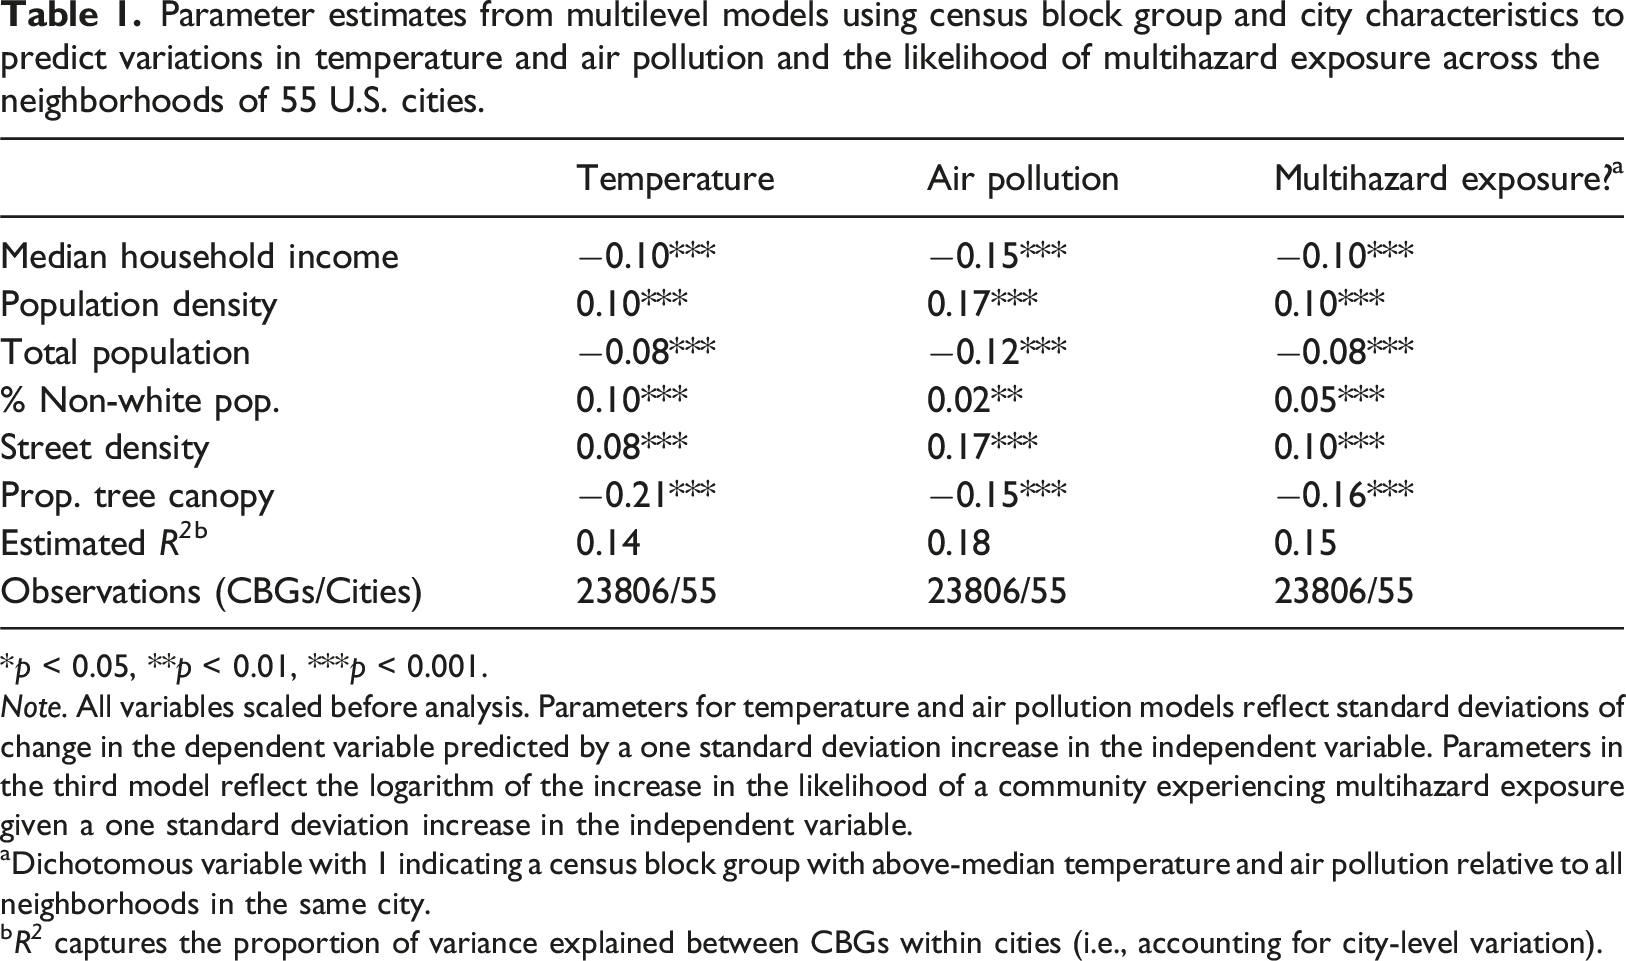
Part I: Drivers of multihazard exposure
Descriptive statistics: Multihazard exposure across cities
Heat and air pollution tended to correlate moderately across the neighborhoods within a city ( (a) The correlation between heat and air pollution across neighborhoods varied substantially across cities, though tended to be moderately high (median = .41; red line). (b) A city’s heat-air pollution correlation (i.e., prevalence of multihazard exposure) was higher in cities where street density correlated with an absence of canopy coverage (β = −0.28 in a multivariate model reported in Table 2).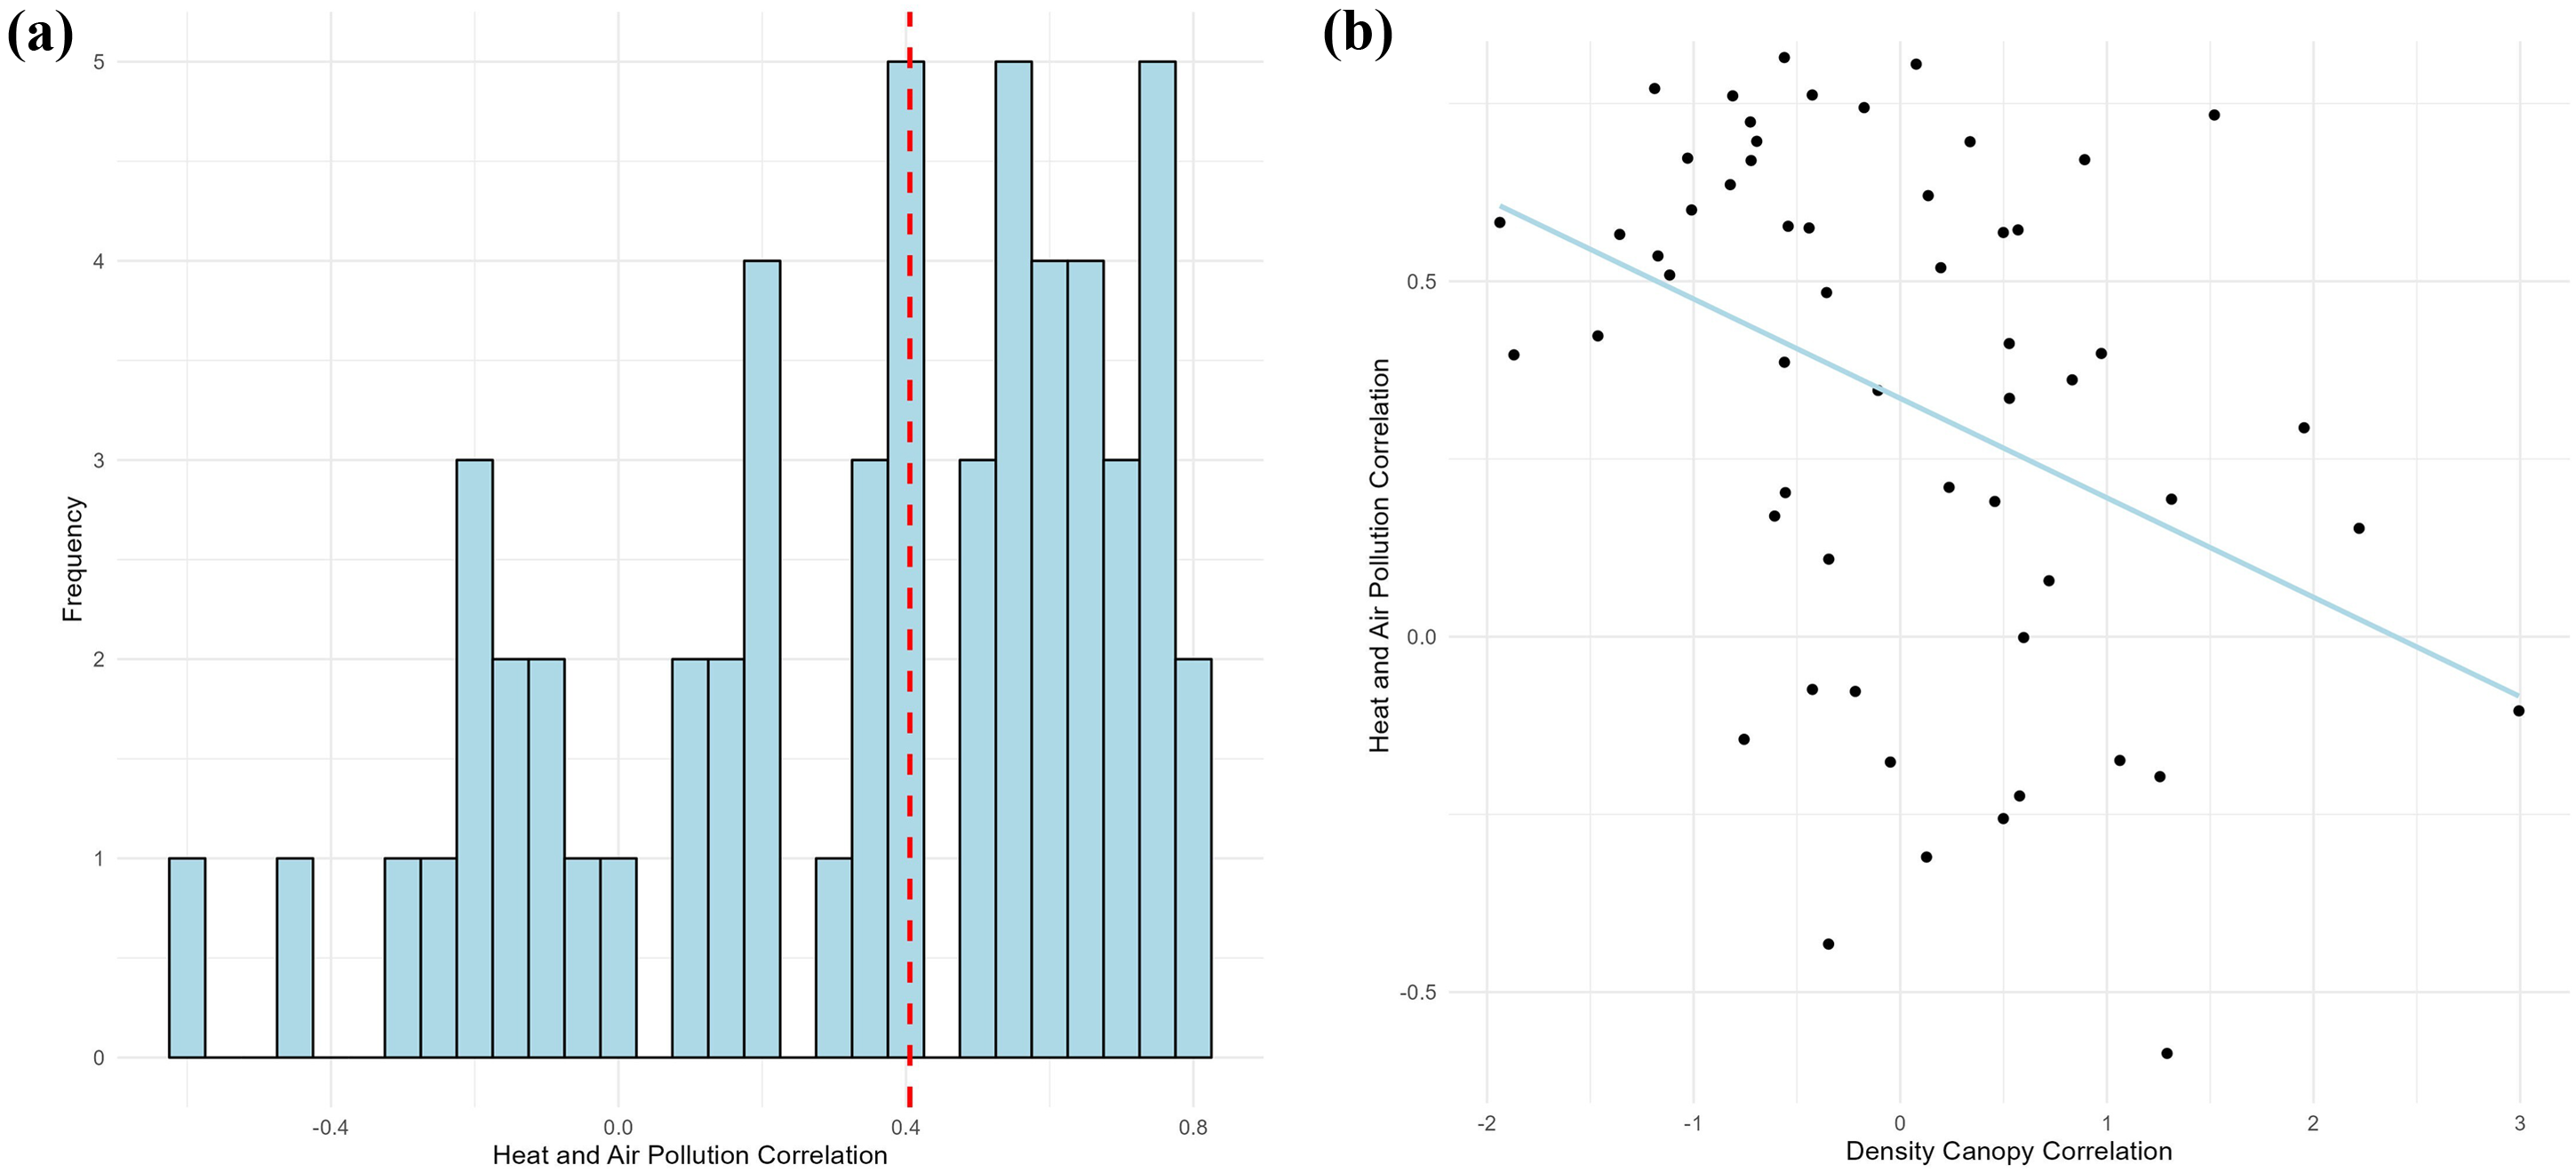
Hypothesis 1a: Street Density and canopy coverage drive multihazard exposure
Parameter estimates from multilevel models using census block group and city characteristics to predict variations in temperature and air pollution and the likelihood of multihazard exposure across the neighborhoods of 55 U.S. cities.
*p < 0.05, **p < 0.01, ***p < 0.001.
Note. All variables scaled before analysis. Parameters for temperature and air pollution models reflect standard deviations of change in the dependent variable predicted by a one standard deviation increase in the independent variable. Parameters in the third model reflect the logarithm of the increase in the likelihood of a community experiencing multihazard exposure given a one standard deviation increase in the independent variable.
aDichotomous variable with 1 indicating a census block group with above-median temperature and air pollution relative to all neighborhoods in the same city.
bR 2 captures the proportion of variance explained between CBGs within cities (i.e., accounting for city-level variation).
The street density of a CBG predicted higher temperature (β = 0.08, p < 0.001) and air pollution (β = 0.17, p < 0.001). Tree canopy predicted lower temperatures (β = −0.21, p < 0.001) and air pollution (β = −0.15, p < 0.001). Accordingly, both higher street density and lower canopy coverage predicted a greater likelihood of a community suffering from multihazard exposure (street density: β = 0.10, O.R. = 1.11, p < 0.001; tree canopy: β = −0.16, O.R. = 0.85, p < 0.001).
The effects of street density and canopy coverage were independent of other infrastructural and demographic features, including population density, the overall tendency of a neighborhood’s residents to drive cars, median income, and racial composition. Nonetheless, communities with lower incomes and more residents of color experienced more heat and air pollution and a greater likelihood of multihazard exposure, even when accounting for density of streets and canopy. This indicates that there are other drivers of hazards that are consistently associated with demographics (see Table 1).
Hypothesis 1b: Co-location of hazard-driving infrastructure explains citywide prevalence of multihazard exposure
Regressions testing city-level relationships between the co-location of hazard-driving infrastructure and the prevalence of multihazard exposure and socioeconomic disparities in the placement of hazard-driving infrastructure; and the independent effects of disparities in the placement of hazard-driving infrastructure and the correlation between heat and air pollution on socioeconomic inequities in multihazard exposure. (Also represented visually in Figure 2(c)).
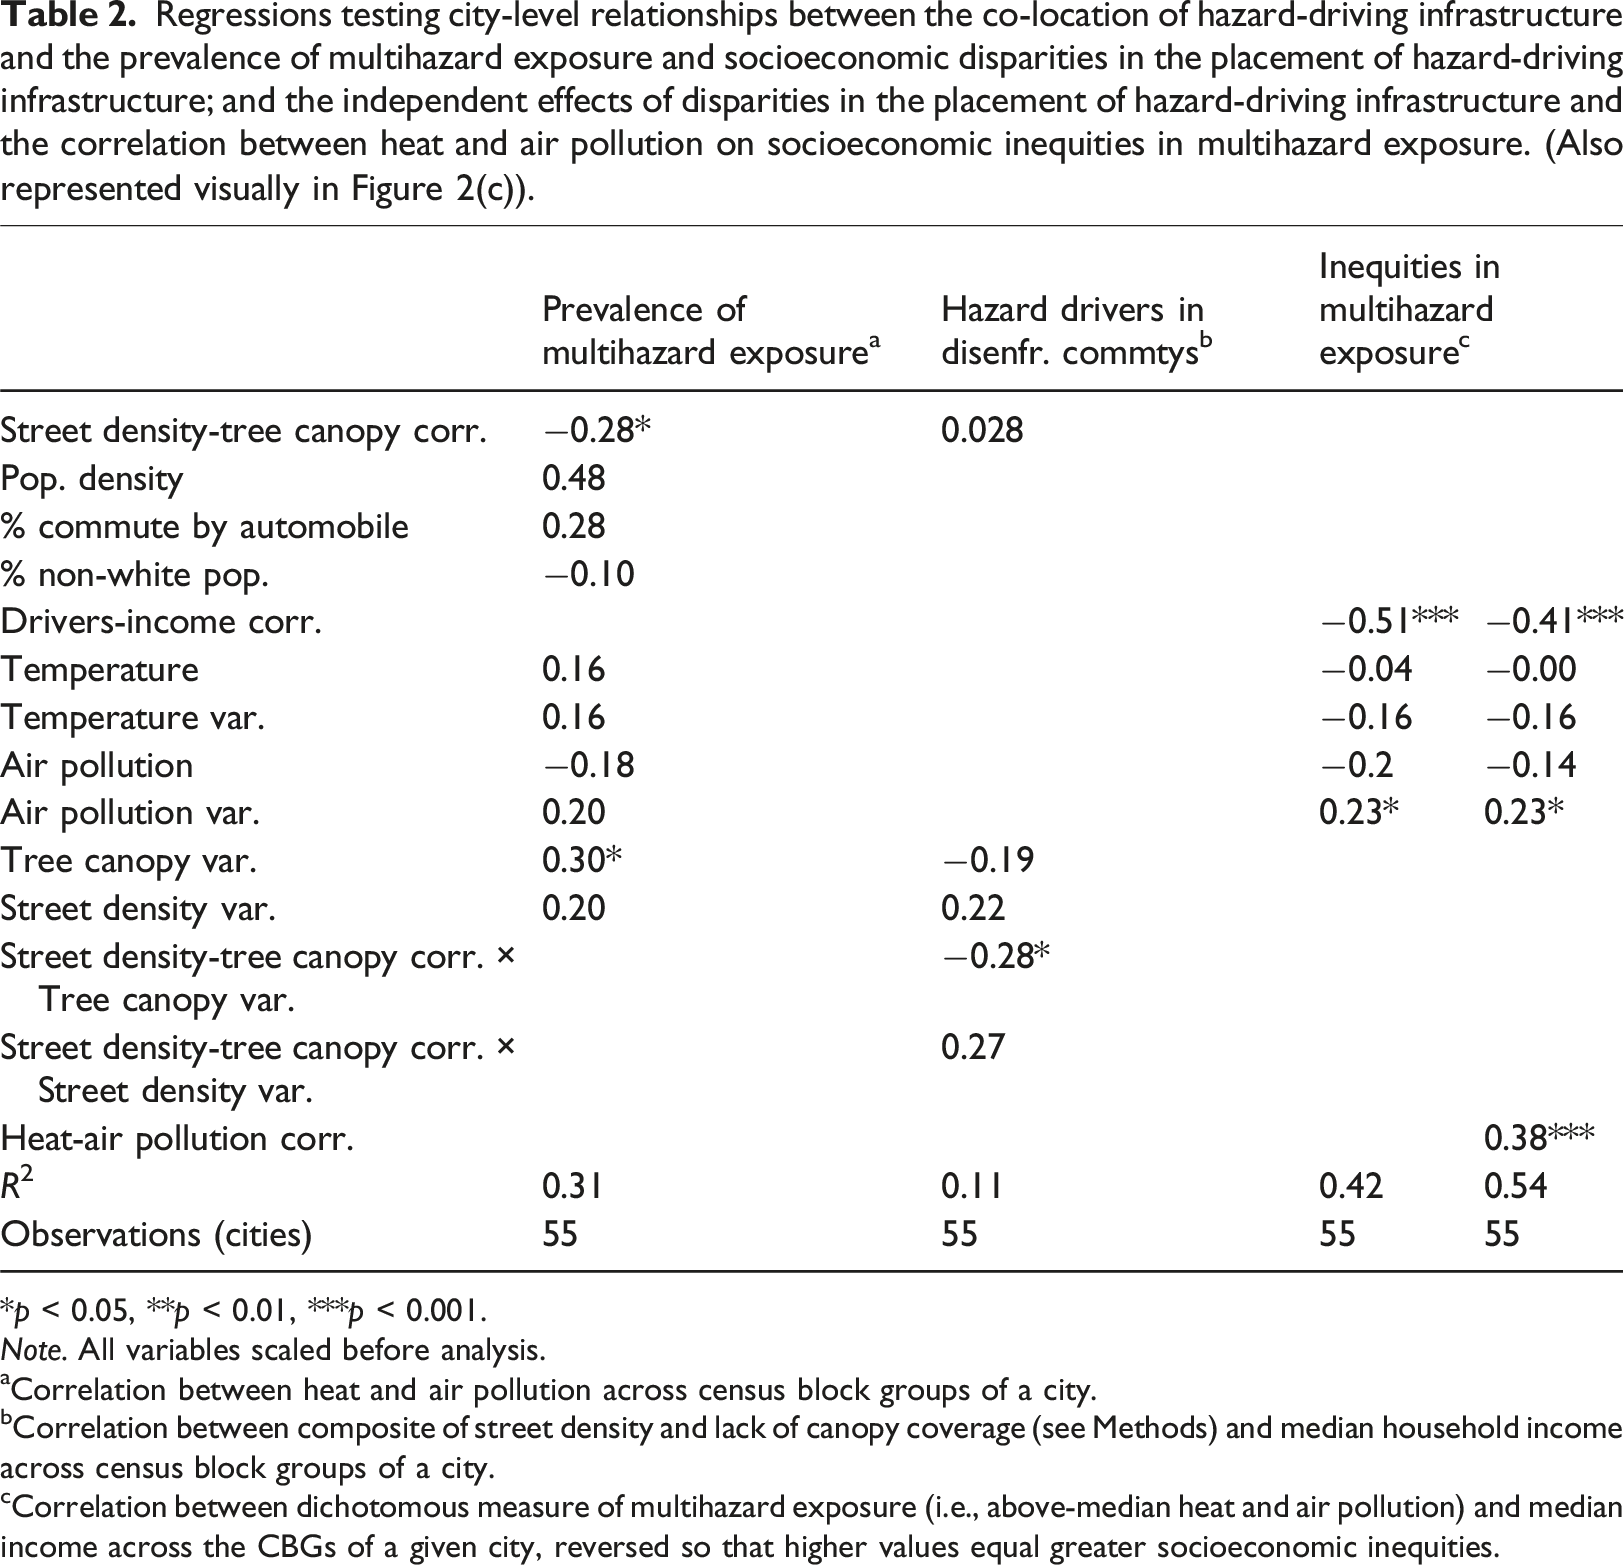
*p < 0.05, **p < 0.01, ***p < 0.001.
Note. All variables scaled before analysis.
aCorrelation between heat and air pollution across census block groups of a city.
bCorrelation between composite of street density and lack of canopy coverage (see Methods) and median household income across census block groups of a city.
cCorrelation between dichotomous measure of multihazard exposure (i.e., above-median heat and air pollution) and median income across the CBGs of a given city, reversed so that higher values equal greater socioeconomic inequities.
Part II: Inequities in multihazard exposure
Hypothesis 2: Socioeconomic inequities in multihazard exposure
We measure socioeconomic inequities in multihazard exposure in a city as the correlation between multihazard exposure (i.e., above median heat and air pollution) and income across CBGs, reversed so that higher values indicate greater inequities. As with multihazard exposure itself, socioeconomic inequities in multihazard exposure tended to be moderately high (median correlation between the presence of multihazard exposure and income = 0.27) but varied substantially and were even absent in some cities (see Figure 3(a)). Descriptively, such inequities were greater in cities with more multihazard exposure (r = 0.51). Many of those with the greatest socioeconomic inequities in multihazard exposure were the same that had a strong relationship between heat and air pollution above (e.g., Oakland/Berkeley, CA: r = 0.47). The proceeding analyses use this measure to reflect socioeconomic inequities in multihazard exposure, though to account for potential weaknesses in the correlation between a dichotomous variable and a continuous variable, we replicated all results with an alternative (but harder to interpret) measure based on a multilevel logistic regression using median income to predict the presence of multihazard exposure across the CBGs of each city. These results were statistically identical and are reported in the SOM. (a) Socioeconomic inequities in exposure to multihazard exposure varied across cities (median correlation = −0.27; red line). (b) Hazards were most heavily concentrated in low-income communities when cities with high variation in tree canopy have fewer trees in communities with high street density (i.e., a low correlation between density and canopy; interaction effect: β = −0.28, see Table 2). (c) The concentration of hazard-driving infrastructure in low-income communities was strongly associated with socioeconomic inequities in multihazard exposure in a city (β = 0.41, p < 0.001 in a multivariate model reported in Table 2).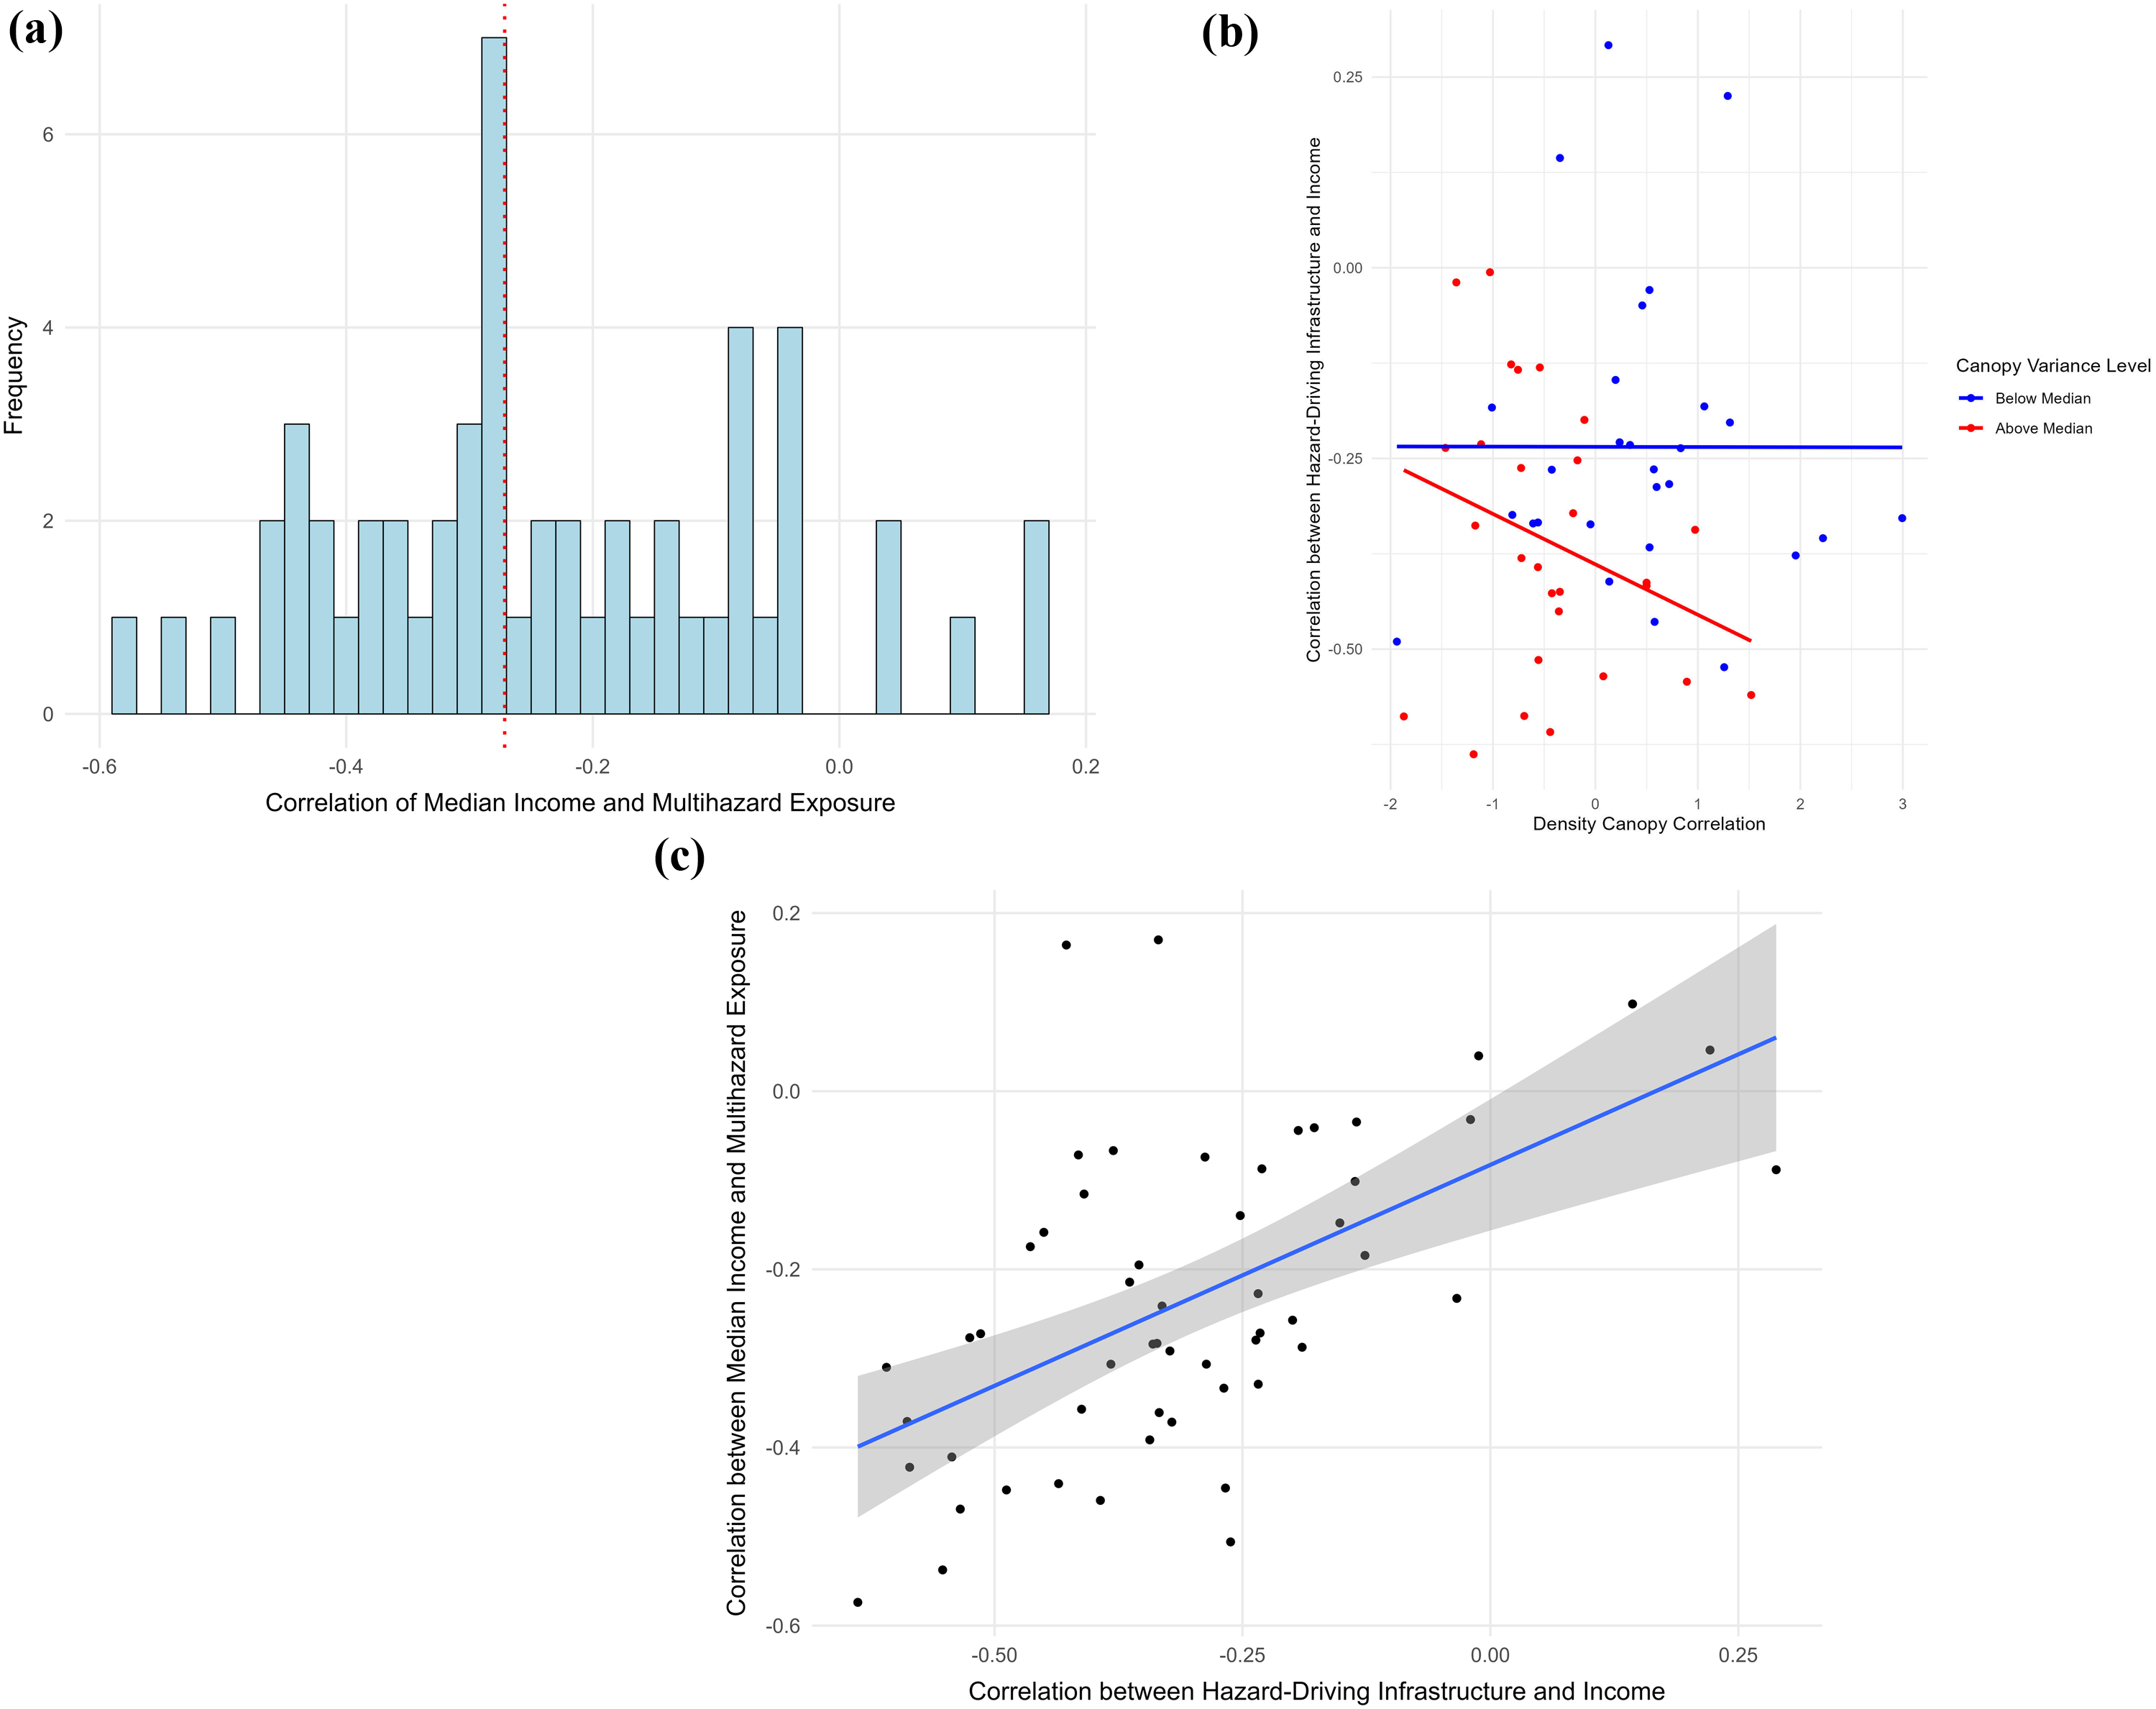
Hypothesis 3: Disparities in hazard-driving infrastructure
The simplest explanation for socioeconomic inequities in multihazard exposure is that infrastructure that drives both heat and air pollution (i.e., high street density, sparse tree canopy) is concentrated in low-income communities. There would be a greater chance of this happening in cities where high street density and low tree canopy are routinely co-located in particular neighborhoods, creating greater incentives for high-income populations to insulate themselves from those places. Consequently, we hypothesize that cities with a greater correlation between those features will have greater socioeconomic disparities in their distribution across neighborhoods. We test this by creating an index of hazard-driving infrastructure in a city’s low-income communities, measured as the correlation between (1) a composite measure of street density and lack of tree canopy (see Methods) and (2) median income. (The same analyses for racial inequities, with % non-white population replacing median income, produced similar results; see SOM.)
We analyzed the concentration of hazard-driving infrastructure in low-income neighborhoods with a regression that included the city’s correlation between street density and tree canopy. The model’s predictors also included variance in both street density and tree canopy and their interactions with said correlation, because the correlation between two types of hazard-driving infrastructure is only meaningful if there is substantial variation in the infrastructure itself. The interaction between the street density-tree canopy correlation and the variance in tree canopy (β = −0.28, p < 0.05) was the strongest predictor of the presence of hazard-driving infrastructure in low-income communities (see Figure 3(b)). This reveals that cities with the greatest socioeconomic disparities in hazard-driving infrastructure are those that have a greater range in tree canopy across neighborhoods and tend to have fewer trees in neighborhoods with higher street density.
Hypothesis 4: Hazard-driving infrastructure and socioeconomic inequities in multihazard exposure
The subsequent hypothesis is that, if hazard-driving infrastructure is distributed unevenly across socioeconomic groups, it will result in socioeconomic inequities in multihazard exposure. An additional regression found this to be true, as the correlation between hazard-driving infrastructure and income explained 26% of the variance in socioeconomic inequities in multihazard exposure across cities (β = −0.51, p < 0.001). This model controlled for the possibility that socioeconomic inequities in exposure are stronger in cities that are hotter or have more air pollution in general or have more variability in either of these hazards, any of which could create statistical artifacts.
As a robustness check, we re-ran this regression adding a city’s level of multihazard exposure as a predictor to the model. This tested whether there is a broader pattern of planning decisions that concentrate hazards in low-income communities above and beyond the placement of streets and trees (see Table 2). The correlation between heat and air pollution indeed predicted socioeconomic inequities in multihazard exposure with a strength equivalent to that of the correlation between hazard-driving infrastructure and income (heat-air pollution correlation: β = 0.38, p < 0.001, see Figure 2(c); infrastructure-income correlation: β = −0.41, p < 0.001), indicating additional planning and policy decisions that cumulatively concentrate multihazard exposure in low-income communities in addition to the distribution of streets and canopy cover.
Discussion
The results demonstrate how the organization of hazard-driving infrastructure creates variations in multihazard exposure across 55 U.S. cities, which in turn manifests as socioeconomic and racial inequities. Understanding where and how heat and air pollution are co-located describes a bridge between the planning decisions that give rise to environmental injustices (Agyeman et al., 2016; Cutter, 1995; Mohai et al., 2009; Soja, 2010) and the cumulative risk that results from hazards with distinct geophysical drivers (Callahan and Sexton, 2007; Krieg and Faber, 2004). We unpack the findings using our two-part framework and associated hypotheses from Figure 1 as a guide. We illustrate this discussion with maps of two cities that capture the variation in multihazard exposure and associated inequities we observed: Oakland/Berkeley, CA and Detroit, MI (Figure 4). Oakland/Berkeley, CA and Detroit, MI capture the variation in the organization of multihazard exposure, hazard driver infrastructure, and socioeconomic inequities in exposure possible across cities. Oakland/Berkeley (a) has many communities experiencing multihazard exposure, which are (b) often home to low-income populations because of (c) a combination of high street density with few trees. Detroit (d) has few places with multihazard exposure that (e) are not necessarily low-income communities, in part because (f) communities with high street density often have substantial tree canopy.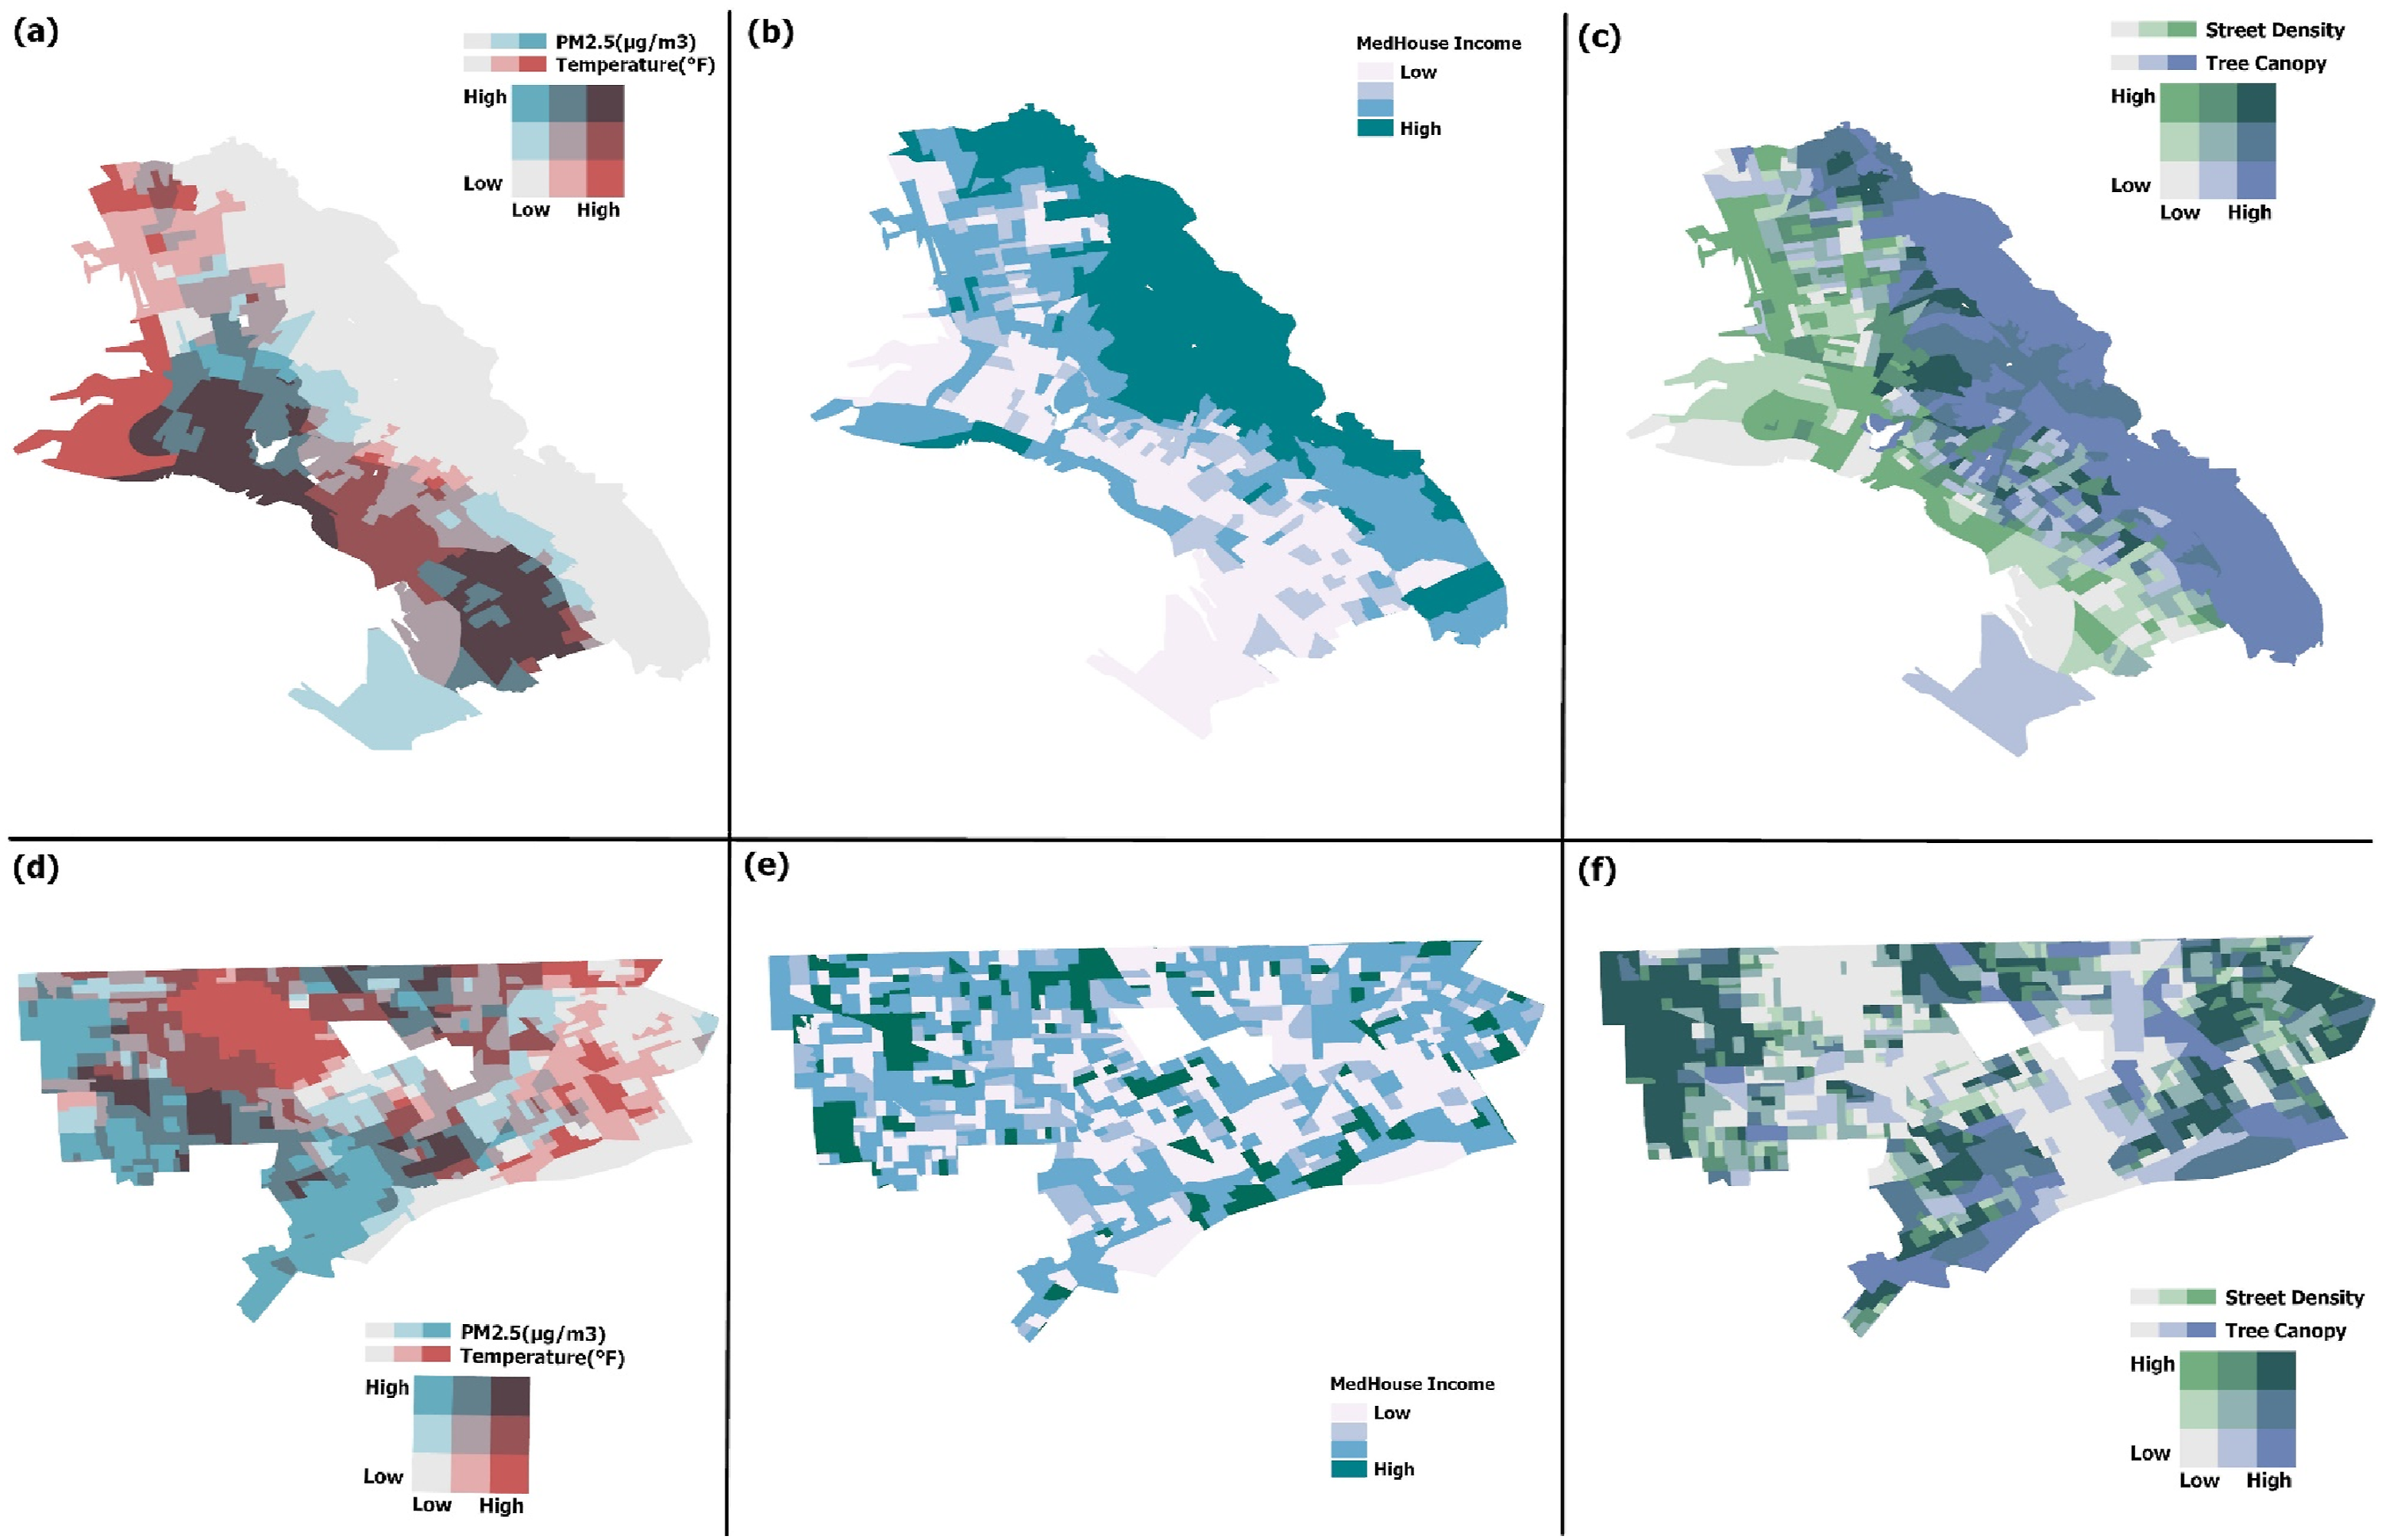
Heat and air pollution were moderately correlated in the average city (
The variation in multihazard exposure was rooted in each city’s infrastructural design. Both heat and air pollution were driven by a greater density of streets and a sparsity of trees. At a citywide scale, then, the prevalence of multihazard exposure depended heavily on whether trees mitigated the impacts of high street density (Hypothesis 1). Again, the contrast between Oakland/Berkeley and Detroit is instructive. In the former, the west side, which suffers from multihazard exposure, consistently had high street density and low canopy coverage; but the low-exposure region on the east had low street density and high canopy cover (r = −0.29 between canopy and street density; see Figure 3(c)). Meanwhile, Detroit neighborhoods with high street density often had higher levels of tree canopy (r = 0.60; see Figure 4(f)).
The second component of our framework was how greater prevalence of multihazard exposure in a city might manifest in inequities. We hypothesized that cities with more multihazard exposure would place this burden (i.e., cumulative risk; Callahan and Sexton, 2007) most heavily in low-income communities (and communities of color, see SOM; Hypothesis 2). Indeed, this is what we observed. Connecting the two components of our framework, these inequities were driven by the organization of hazard-driving infrastructure. In Oakland/Berkeley, for example, the strong disparities in infrastructure and hazards between the east and west sides of the city—especially in tree canopy—coincided with a socioeconomic divide (r = 0.70 between income and canopy; r = −0.16 between income and street density; see Figure 4(b)). But in Detroit, the correlation between canopy and income was muted (r = 0.26 between income and canopy), making the side-by-side maps in Figures 3(e) and 3(f) little more than a muddle. Consequently, heat and air pollution were intensively concentrated in low-income communities in Oakland/Berkeley (r = −0.79 and −0.97, respectively); whereas low-income communities in Detroit were moderately more likely to be exposed to high air pollution but less likely to be exposed to high heat (r = −0.18 and 0.20, respectively).
Implications
The distinct examples of Oakland/Berkeley and Detroit—as well as the results more generally—offer a nuanced view of inequities in multihazard exposure that goes beyond the inevitability of “all marginalized communities in all cities experience elevated exposure to all hazards.” We might describe the emergence of multihazard exposure with two interlocking processes, one discrete, the other systemic. First, as noted at the outset, environmental injustices are created by discrete planning or policy decisions, each impacting a specific set of hazards in a small portion of a city. For instance, the effects of green infrastructure are hyperlocal (see Kumar et al., 2024: for a review) and most powerful when smaller and distributed throughout a city (Kirschner et al., 2023). Second, as multiple discrete decisions coincide to create multihazard exposure—for example, building neighborhoods with lots of streets but few trees—they lay the groundwork for further intensification of hazards. In other words, the presence of multihazard exposure in a city is symptomatic of a broader pattern of planning and policy decisions that create and reinforce demographic inequities.
The reinforcement of inequities in multihazard exposure might occur because those with access to power and resources make decisions that exacerbate these inequities. For example, vegetation in formerly redlined neighborhoods has less of a cooling effect than in other communities, potentially because of poor maintenance (Jung et al., 2024) or because of interactions with the hyperlocal composition of a given neighborhood’s land use (Jung et al., 2025). Alternatively, the infrastructure that led to multihazard exposure might also make it difficult to counteract those effects, such as in New York City, where a program to make tree cover more equitable fell short because many low-income neighborhoods lacked suitable locations for planting trees (Garrison, 2019). In either case, multihazard exposure sets the stage for additional decisions or limitations that then intensify environmental injustices. As such, the interventions for ameliorating cumulative risk can be as complicated as the multilayered decisions that are responsible (Huang and London, 2016).
We do, however, see some potential solutions for the case of heat and air pollution by focusing on their shared infrastructural drivers. In cities like Detroit, the inclusion of trees in neighborhoods with high street density has diminished inequities in multihazard exposure. Of course, new trees are not an all-encompassing solution, and, as revealed by the study in New York City noted above, simply planting trees can have limited efficacy because of the legacy of inequitable planning decisions (Garrison, 2019). As such, solutions will often need to be multifaceted, incorporating elements that mitigate heat and air pollution separately. These efforts must be as proactive and systematic as those that preceded them to ensure that we do not reinforce multihazard exposure where it already exists and thus incentivize further injustices.
Limitations and next steps
We note some limitations and needed extensions of the study. First, the NOAA temperature data have the advantage of capturing on-the-ground conditions rather than approximating them remotely through satellites, but they have some shortcomings. To maintain measurement consistency within each city, temperature is measured on a single day. Consequently, cities cannot be directly compared to each other because the collection day’s temperature might be different relative to the city’s baseline. Instead, analysts are only able to calculate within-city relationships and compare these across cities, as we have done here. Nonetheless, data collection on a particularly warm day (e.g., Los Angeles’ data were collected during a heat wave) could impact the results as extreme events can exacerbate cross-neighborhood disparities (Yin et al., 2023). Additionally, the data are collected along streets, meaning temperature estimates for other spaces (e.g., parks, plazas) can be imprecise (Shi et al., 2021). Last, the NOAA data were collected in cities that signed up for the data collection program, creating a diverse but non-systematic sample. We believe that we have addressed these limitations by replicating the analysis with remotely-sensed data. Separately, our analysis has coordinated multiple data sets that were collected through different methodologies during different time periods. Fortunately, the variables that we are using to predict hazards—infrastructure and demographics—tend to shift slowly, so the results should be consistent with what we would see if all variables were observed simultaneously.
Looking toward future research, we reiterate that the goal of this study was to conduct a first examination of the prevalence of multihazard exposure and any associated inequities, using heat and air pollution as a test case. It was not designed to advance the science of the specific factors driving either heat or air pollution, especially as work on the impacts of tree canopy, street design, and more becomes so nuanced. Future research on multihazard exposure should incorporate this nuance to better articulate how multiple discrete decisions can coincide to concentrate multiple hazards in certain communities. Also, there are many other combinations of hazards that might be considered, each with their own infrastructural drivers to consider. For example, noise pollution (Walker et al., 2021) and flooding (e.g., Collins et al., 2019) are additional hazards associated with main thoroughfares but also driven by other factors. The diverse forms of pollution tracked by CRA dashboards derive from multiple sources, as well (August et al., 2021; EPA, 2023). Last, our two-process model of how multihazard exposure can be self-reinforcing posits a longitudinal process by which cities are developed. Verifying this will require historical studies on the design and planning of individual cities. Altogether, these suggested lines of inquiry will help us to fully understand the role that multihazard exposures play in our communities.
Supplemental material
Supplemental material—Multihazard exposure and environmental injustice: The correlation between air pollution and heat drives socioeconomic inequities
Supplemental material for Multihazard exposure and environmental injustice: The correlation between air pollution and heat drives socioeconomic inequities by Daniel T. O’Brien, Joshua Rosen, Mai Waziry, Takahiro Yabe, Esteban Moro in Environment and Planning B: Urban Analytics and City Science
Footnotes
Acknowledgments
We would like to thank members of the Boston Area Research Initiative and SUNLab research teams, especially Sarah Sanchez, as well as Qi Wang for feedback and advice on early versions of the manuscript.
Author contributions
Study conception and design: DTO, MW, TY, EM; Data collection: JR, MW; Analysis: JR, MW; Interpretation of Results: DTO, JR, MW, TY, EM; Writing—original draft: DTO; Writing—review & editing: DTO, JR, MW, TY, EM.
Funding
The authors disclosed receipt of the following financial support for the research, authorship, and/or publication of this article: This work was supported by the National Science Foundation (2334157) and Daniel T. O'Brien and Esteban Moro.
Declaration of conflicting interests
The authors declared no potential conflicts of interest with respect to the research, authorship, and/or publication of this article.
Data Availability Statement
Data sharing not applicable to this article as no datasets were generated or analyzed during the current study.
Supplemental material
Supplemental material for this article is available online.
Author biographies
References
Supplementary Material
Please find the following supplemental material available below.
For Open Access articles published under a Creative Commons License, all supplemental material carries the same license as the article it is associated with.
For non-Open Access articles published, all supplemental material carries a non-exclusive license, and permission requests for re-use of supplemental material or any part of supplemental material shall be sent directly to the copyright owner as specified in the copyright notice associated with the article.