
Abstract
Death literacy is defined as a set of knowledge and skills that make it possible to gain access to, understand, and act upon end-of-life and death care options. This study was conducted to test the validity and reliability of the 29-item original version of the Death Literacy Index (DLI) in Turkish society. The scale was applied on a sample of 436 Turkish adults determined using the snowball sampling method. Explanatory and confirmatory factor analyses were performed. The scale consisted of 6 subscales. The test-retest analysis of this study showed a strong and highly significant positive correlation between overall DLI (.98) and its subscales (.73–.98). The total Cronbach’s alpha reliability coefficient of DLI was found to be .90. It was observed that the Turkish version of DLI was a valid and reliable tool and suitable for use in Turkish society.
Introduction
It is known that talking about death, normalizing death as a part of life, and supporting preparation for death are important matters both for individuals and societies in general (Tieaman et al., 2018). In this context, researchers have laid the groundwork for the development of the concept of death literacy concerning how people support each other in caring for a dying person at home and how it can guide them in this regard (Noonan et al., 2015, 2016). The idea of death literacy was developed from a study conducted by the “End-of-Life Care” research team at Western Sydney University (Horsfall et al., 2015; Leonard et al., 2021).
Death literacy is defined as a set of knowledge and skills that make it possible to gain access to, understand, and act upon end-of-life and death care options (Leonard et al., 2021; Noonan et al., 2015, 2016). Death literacy is a novel concept that, at the same time, refers to an individual’s knowledge and understanding gained from past experiences (Leonard et al., 2021). In another study, death literacy was described as understanding what it is like to die and what it can imply (Hayes et al., 2020).
Individuals and societies with high death literacy will both have knowledge about the death system and the ability to put this knowledge into practice (Noonan, 2018). It is believed that care supports, which in general bring a burden to the country’s economy, can be transformative for both the caregiver and care network (e.g. family, neighbours, friend groups, service providers) (Noonan et al., 2015, 2016). The concept of death literacy can also contribute to well-being in the end-of-life period (Leonard et al., 2021). The number of studies on death literacy has increased with online courses such as Dying2Learn (Miller-Lewis et al., 2020; Tieaman et al., 2018).
Even though the assessment tools available in the literature can assess a variety of dimensions such as anxiety and fear about death, they are not adequate for assessing knowledge, experience, and attitude towards end-of-life (Leonard et al., 2021; Lester & Abdel-Khalek, 2003; Templer, 1970). Hence, an assessment tool needed to be developed to determine the level of death literacy in a society as well as the social effect of public health initiatives (Noonan, 2018), to which end Leonard et al. (2021) developed a 29-item Death Literacy Index (DLI) in Australia to assess knowledge, experience, and attitude towards end-of-life. Numerous professionals and experts contributed to the development of the scale, and statements by caregivers were also taken into account. DLI identifies knowledge about end-of-life care, along with its practice and effects (Leonard et al., 2021).
The number of studies on death literacy, which is a new concept in the literature, is extremely limited (Hayes et al., 2020; Leonard et al., 2021; Noonan et al., 2015, 2016; Noonan, 2018). Leonard et al., (2021) suggested that the scale should be applied in different countries to examine the scale’s international generalizability. There is currently no measurement tool customized to Turkish culture, and in this particular field of the literature, adaptation of measurement tools devised in a certain culture to other cultures is key to create a common language and to put forward a valid measurement tool. In Turkey, there is currently no valid and reliable assessment tool available for use in death literacy studies, and hence, the present study was conducted to adapt DLI to Turkish society. The aim of this study was therefore to investigate into the reliability and validity of the Death Literacy Index (DLI) in a Turkish sample.
Methods
Design
This was a cross-sectional and methodological study.
Participants
The population consisted of individuals aged 18 and over. The population was determined using the snowball sampling method. In line with the literature, the sample size of the study was planned to be 5 to 50 times the number of scale items, and accordingly, 436 people aged 18 and over who volunteered to participate in the study and had no communication problems were included in the sample (Karakoç & Dönmez, 2014). Mean age of the participants was 27.23 ± 9.51 years and their age ranged from 18 to 64 years. Majority of the participants were female (75.7%), single (70.2%), high school graduates (62.8%) and lived in the city centre (70.4%). 47.2% of the participants had an income equal to their expenses.
Instruments
Personal Information Form and DLI were used as data collection tools.
Personal Information Form: This form, prepared by the researchers, included a total of six questions about the participants' age, gender, educational status, marital status, income status and place of residence.
Death Literacy Index (DLI): The scale was developed by Leonard et al., (2021) and it consists of 29 items. This five-point Likert type scale has six subscales; namely Practical knowledge-Talking support (1), Practical knowledge-Hands on care (2), Experiential knowledge (3), Factual knowledge (4), Community knowledge-Accessing help (5), and Community knowledge - community groups (6) (TLI = .95; CFI = .95, RMSEA = .049, χ2 = 1556.4). DLI total (.94) and subscales (.81 to .94) have high reliability by Cronbach’s alphas (Leonard et al., 2021). 1. Practical knowledge-Talking support: refers to how difficult or easy a person perceives they can talk with their friends and family about death, dying, and grieving. 2. Practical knowledge-Hands on care: refers to how difficult or easy a person perceives to take part in the physical care of a dying person. 3. Experiential knowledge: refers to how right or wrong the experiences of death, bereavement, and other life-threatening situations are perceived by a person. 4. Factual knowledge: refers to a person’s level of knowledge about, and participation in, death-related issues and what needs to be done after a person’s death. 5. Community knowledge-Accessing help: refers to knowledge on how to access services and supports within the community to seek help and support for dying people, caregivers and when grieving. 6. Community knowledge - community groups: refers to whether or not there are any help or support groups available within the community for people in need of physical or emotional support for dying people, caregivers and when grieving.
The DLI version used in this study consisted of a six-factor construct, the rate of explained variance was between 7.6% and 23.8%, the factor load values of the scale ranged between .63 and .94, and Cronbach’s alpha value was .94. Higher total score in DLI signified that the death literacy level the individual was high. The aim of DLI is to obtain information about the knowledge, skills and experiences related to death, dying, caring for a dying or grieving person in a society or a group of people (Leonard et al., 2021).
Procedure
For the Turkish adaptation of DLI, permission was obtained from Leonard et al., the developers of the scale, via e-mail. Ethics committee approval was obtained (15.03.2022/Decision no: 63-04). Scientific and universal principles were followed. In this context, the principles of informed consent, autonomy, protection of confidentiality and privacy, equity, and nonmaleficence/beneficence were abided by. The study was conducted in accordance with the Declaration of Helsinki. Data was collected via Google Forms in the period from April 1 to May 15, 2022.
The first step in adapting DLI to Turkish society was to ensure language validity. For this purpose, the scale items were translated from English to Turkish independently by two different linguists who were fluent in both languages. Subsequently, the translations made by each linguist were compared and the translation that best expressed the original text was determined, based on which the first form of the scale’s Turkish version was prepared. Afterwards, the scale form was evaluated by two Turkish Language and Literature field experts in terms of grammar and intelligibility. After necessary corrections, the scale form was translated back into its original language by two different linguists. The original version of the scale and its back-translation were compared by the researchers together with a different linguist, and the level of similarity was evaluated. Afterwards, it was sent to 12 field experts to seek expert opinion on content and language validity., Content Validity Index (CVI) was calculated, and the scale was put into final form, based on the expert opinions received. The scale was then applied to a group of 30 people with similar characteristics to the sample, before the researchers proceeded to collect data online from 436 individuals.
Ethical Consideration
The study was approved by Bayburt University Ethics Committee (Document Date and Number: 15.03.2022/63, Decree no: 04). Permission to use the scale in the study was obtained from the authors thereof. Also, informed consent was obtained from the participants.
Analysis of Data
IBM SPSS (v. 25) was used for data analysis. Number and percentage distributions were calculated for descriptive information of the sample group. CVI was calculated using the Davis technique. Explanatory Factor Analysis (EFA) was applied to determine the construct validity of DLI. To test the factor analysis, Kaiser-Mayer-Olkin (KMO) and Bartlett’s tests were performed. Confirmatory Factor Analysis (CFA) was used on AMOS (v. 25) to validate EFA results. To calculate the reliability of the scale, Cronbach’s alpha reliability coefficient, which is the internal consistency coefficient, was calculated. T-test and Pearson correlation analysis was performed for test-retest reliability of the scale. Item-total correlations were calculated for item analysis. Tukey’s test of additivity was used to assess the scale’s additivity and Hotelling’s T-square test was used to determine response bias.
Results
Validity Analyses
Content Validity
Opinions of a total of 12 experts were taken for content validity. To evaluate the replies received from the experts, CVI was calculated for each item using the Davis technique. For content validity, the scale items were evaluated by the experts for clarity, simplicity, and language. Total CVI of the items was found to be .91.
Construct Validity
Construct validity was tested using factor analysis. Before examining the factor structure of the scale, KMO was applied to evaluate sample adequacy for factor analysis, and Bartlett’s test was used to evaluate suitability, and as a result, the following values were found for the study: KMO = .90 and Bartlett’s test χ2 = 6937.5; p = .000.
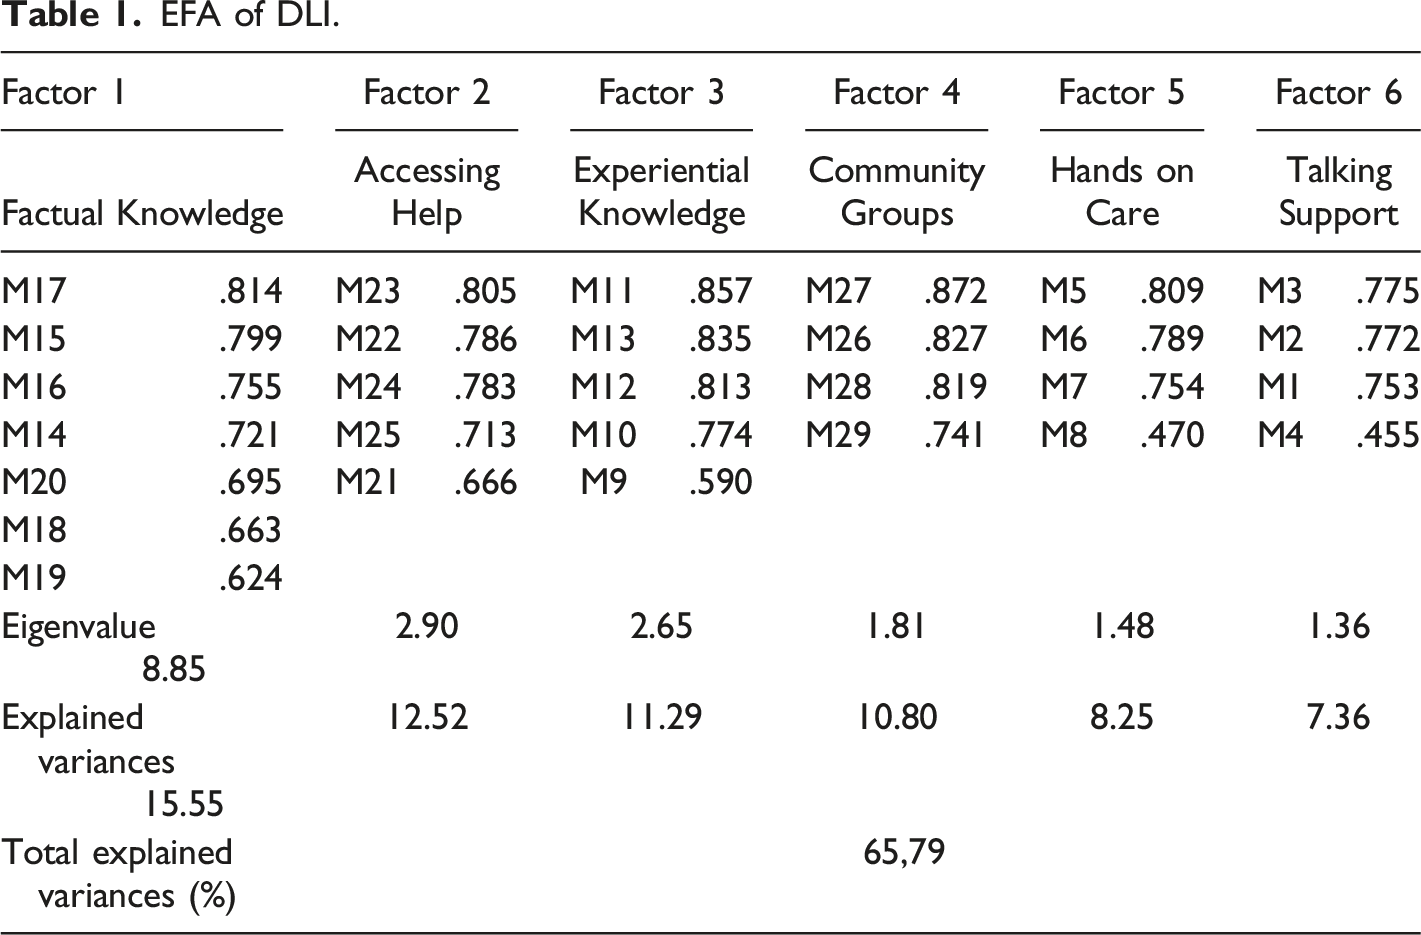
In EFA, the correlation matrix (Principal Component Analysis) method and the ʺvarimaxʺ rotation method were applied to the factors. The eigenvalue was 1.00 and the factor load was .32. The subscales’ factor loads, eigenvalues, and explained variances obtained in factor analysis of the scale are shown in Table 1.
The 6 factors shown to constitute the overall scale as a result of EFA accounted for 65.79% of total variance. The first subscale consisted of 7 items and their factor loads ranged between .81 and .62. The factor loads of the 5 items in the second subscale ranged between .80 and .66, and the factor loads of the 5 items in the third subscale ranged between .85 and .59. In the fourth subscale, the factor loads of the 4 items included therein ranged between .87 and .74. The factor loads of the 4 items in the fifth subscale ranged between .80 and .47, and lastly, the factor loads of the 4 items in the sixth subscale ranged between .77 and .45 (Table 1).
CFA was performed using AMOS. Maximum Likelihood estimation method was chosen. Model fit values were CFA χ2 = 796.619, sd = 362, p = .000, χ2/sd = 2.201, NFI = .88, CFI = .93 and RMSEA = .053, GFI = .88, RFI = .87, IFI = .93, TLI = .92.
The factor loads of the scale items related to CFA were indicated using the path diagram. When standardized parameter values in the scale diagram shown in Figure 1 are examined, it can be seen that factor loads ranged between .38 and .92. Specifically, the factor loads of the Practical knowledge-Talking support subscale ranged between .41 and .73, the factor loads of the Practical knowledge-Hands on care subscale ranged between .38 and .78, the factor loads of the Experiential Knowledge subscale ranged between .57 and .83, the factor loads of the Factual Knowledge subscale ranged between .65 and .81, the factor loads of the Community knowledge-Accessing help subscale ranged between .68 and .92, and the factor loads of the Community knowledge - community groups subscale ranged between .67 and .90 (Figure 1). DLI’s CFA path diagram.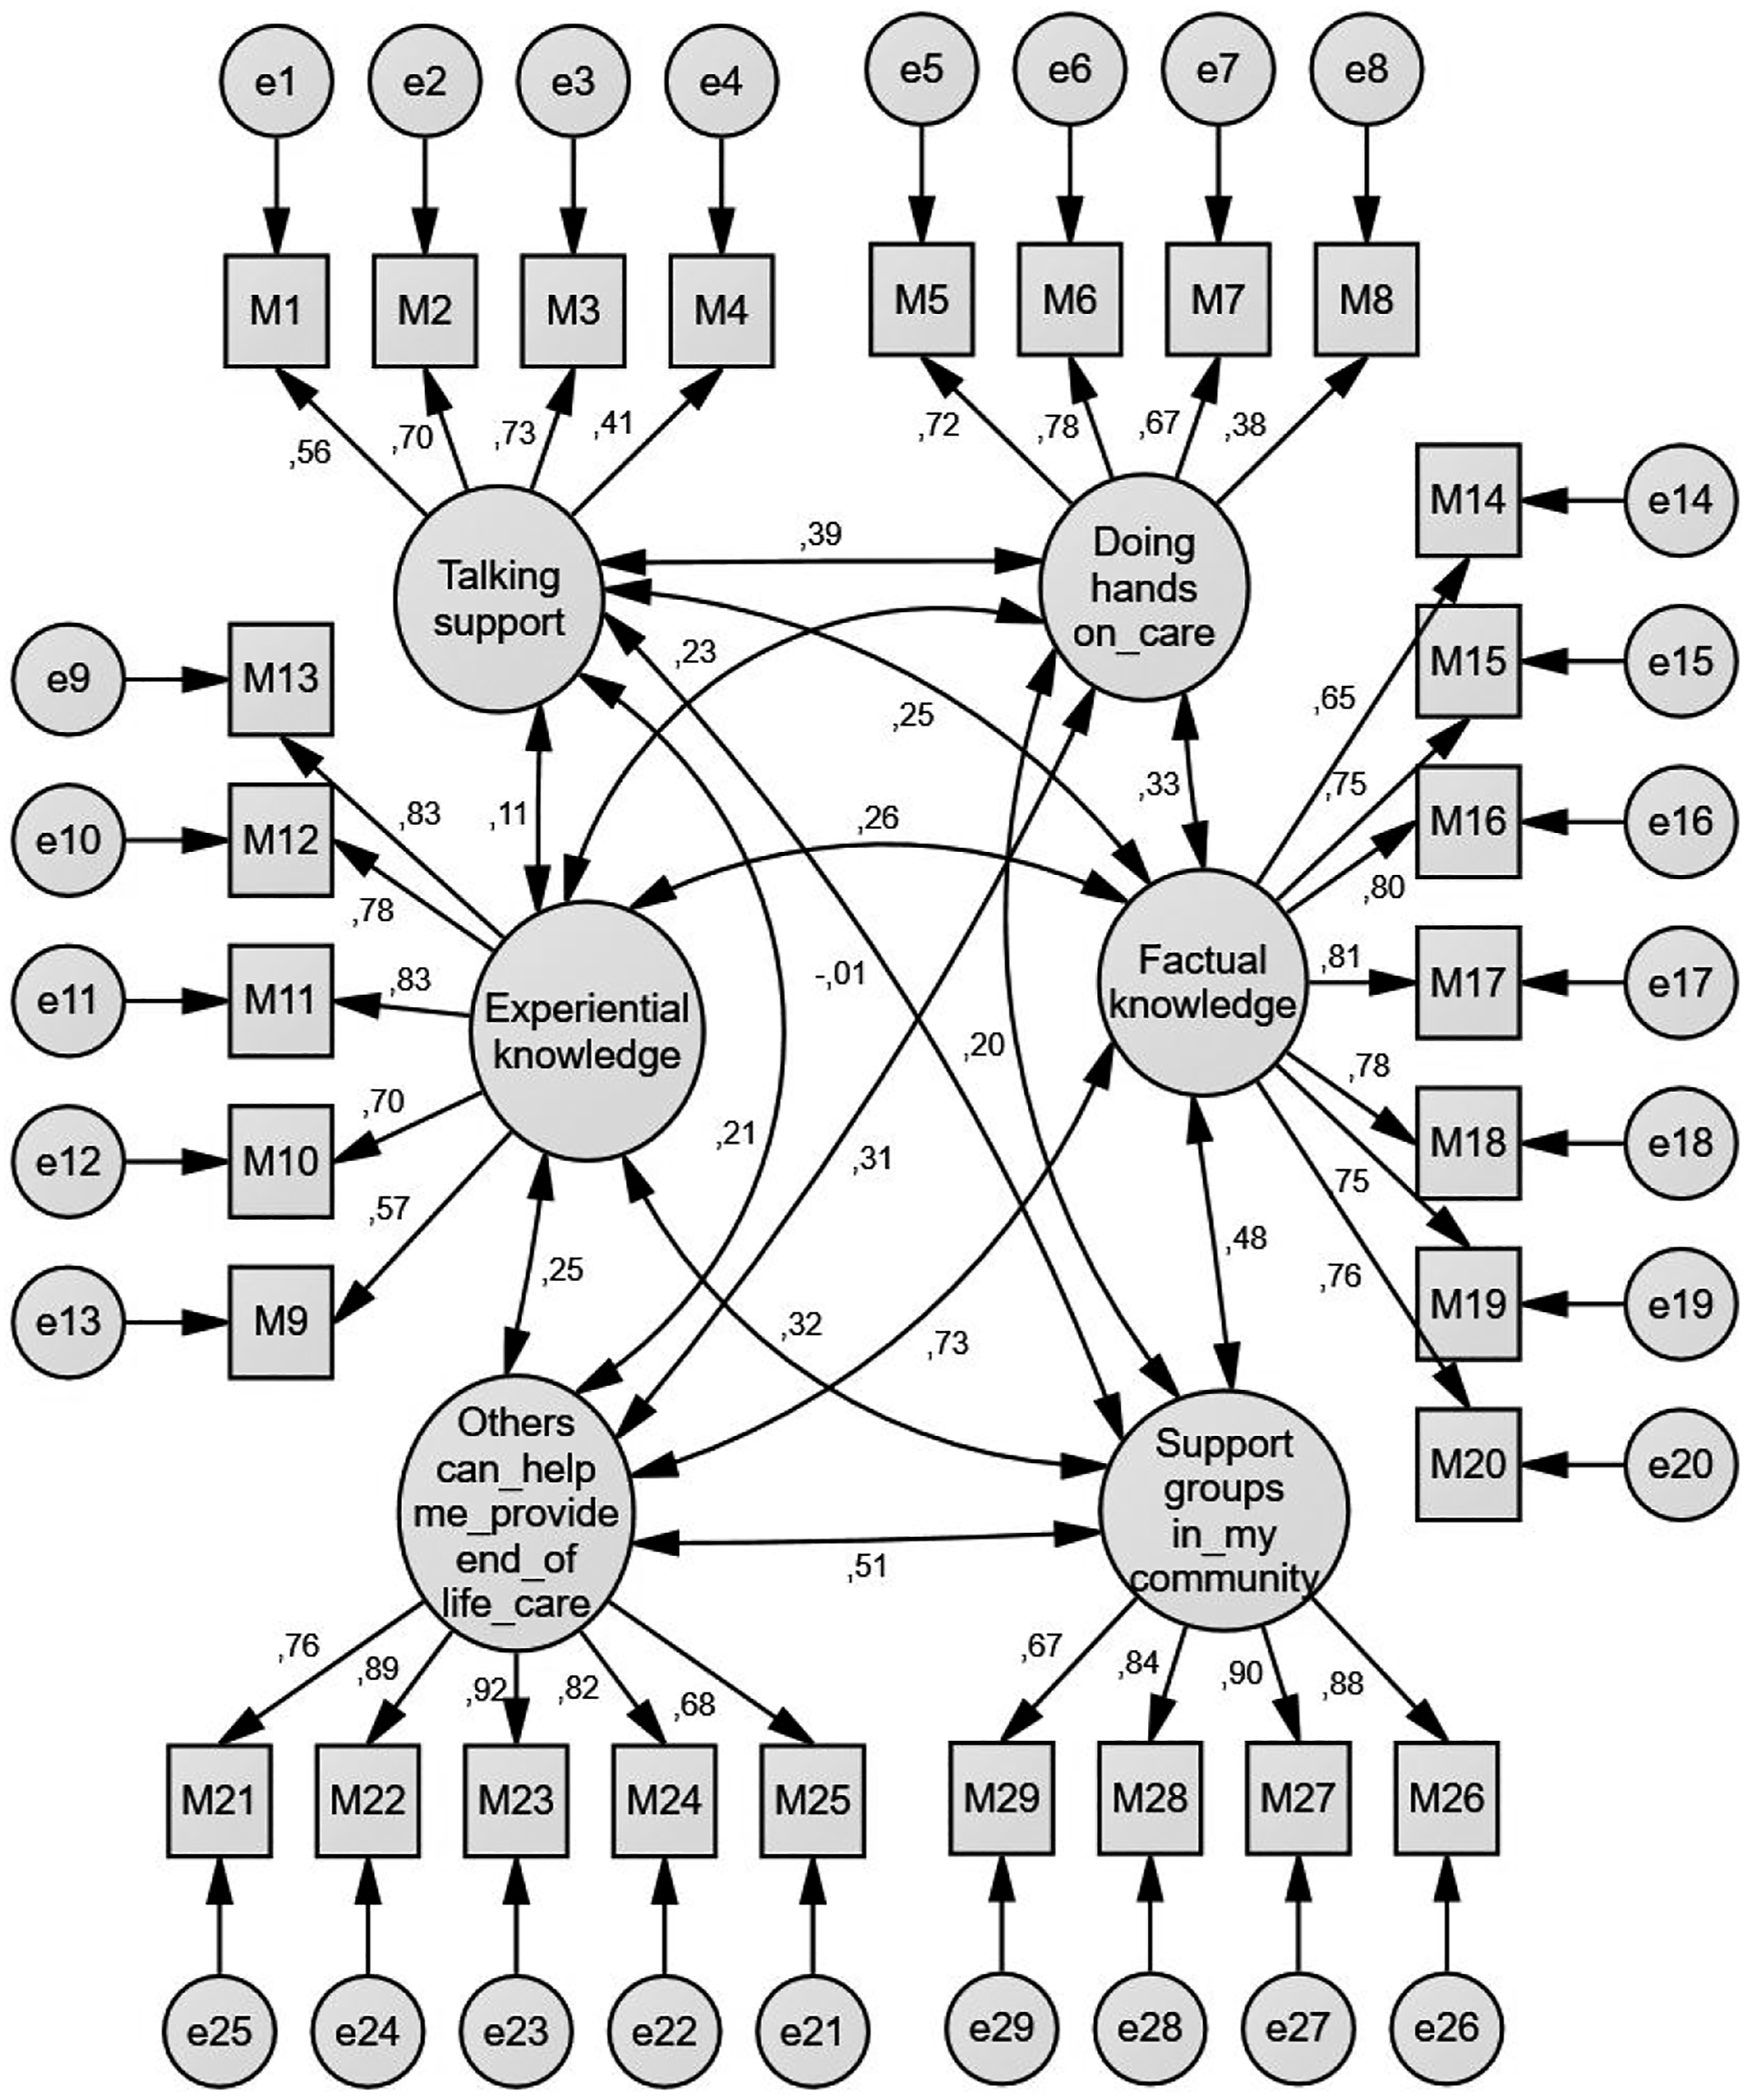
Reliability
Test-Retest Analysis
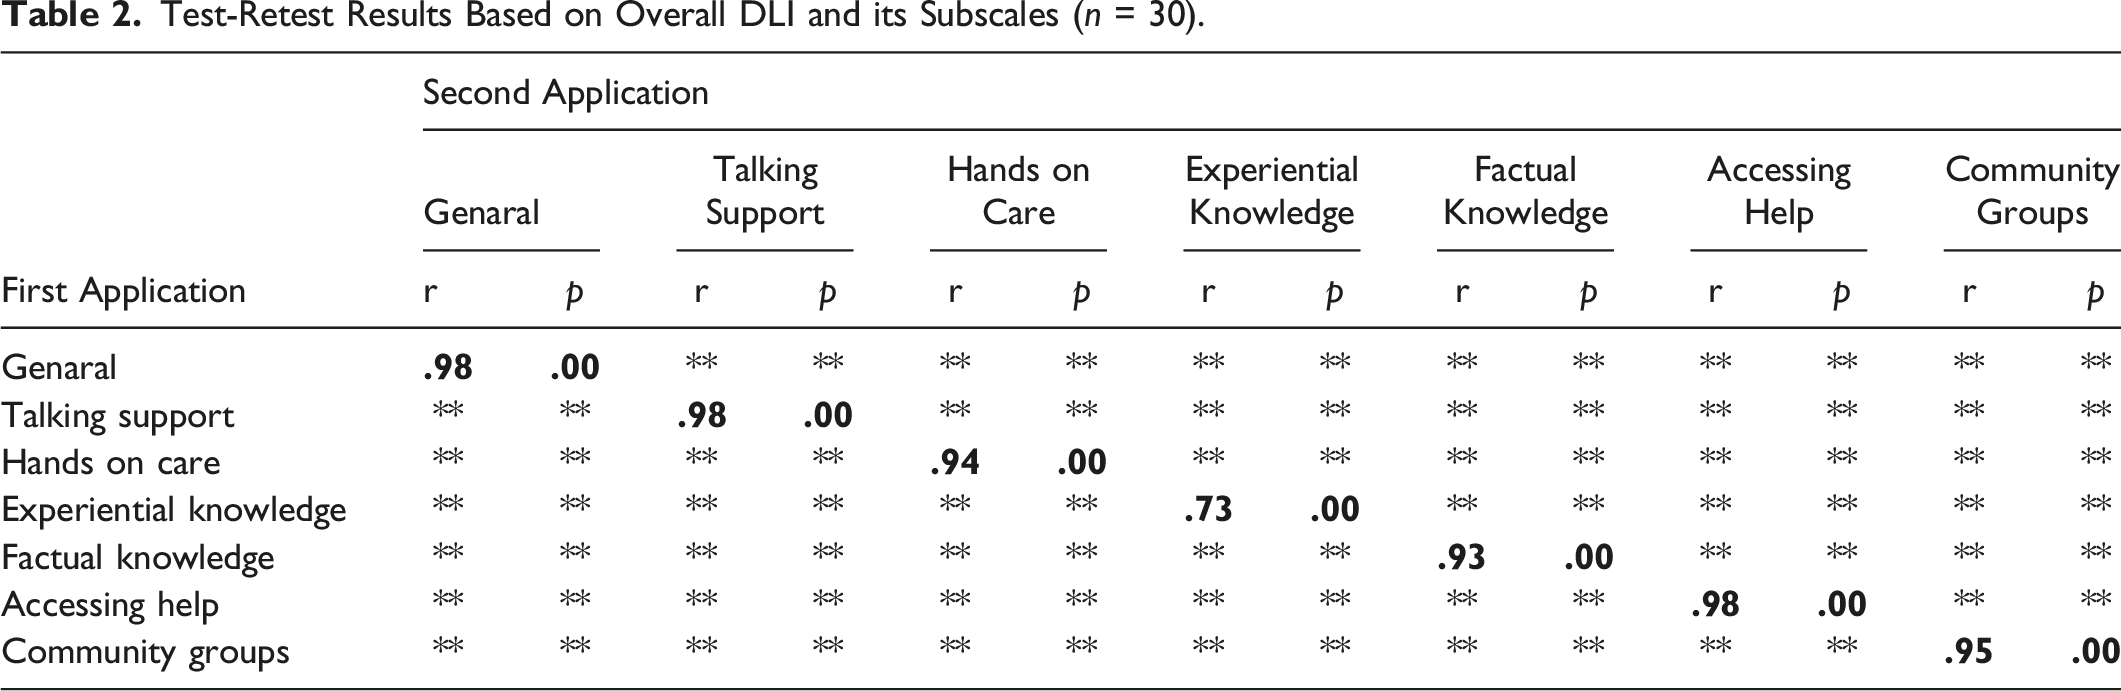
Test-Retest Results Based on Overall DLI and its Subscales (n = 30).
Internal Consistency and Item Analysis
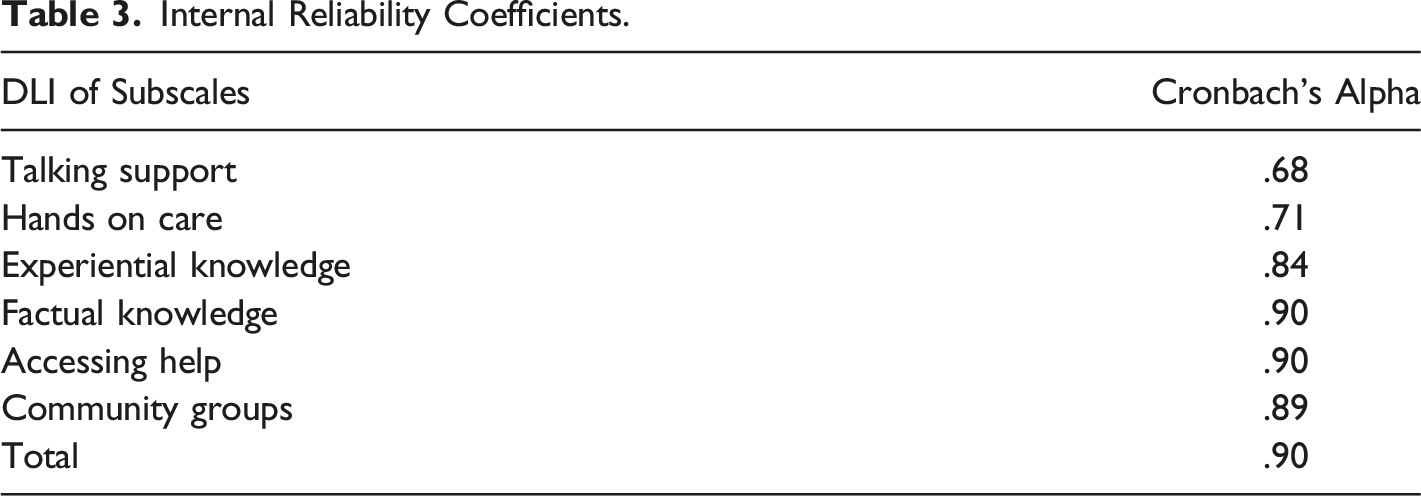
Internal Reliability Coefficients.
EFA of DLI.
Examination of the scale by Tukey’s test of additivity and non-additivity showed that the scale’s additivity, which indicates that the scale score can be considered as a single score by adding up the scores of the items in the scale, was F = 120.401 p = 0.000 and F = 1.852 p = .174, respectively.
Whether or not the responses of the individuals to the scale items were equal or not in the study was evaluated with the Hotelling’s T-test. For DLI, the result obtained from this test was Hotelling T2 = 63.945 p = .000.
Discussion
The aim of the present study was to investigate the reliability and validity of the Death Literacy Index (DLI) in a Turkish sample. Cultural adaptation refers to the systematic preparatory studies conducted in order for an assessment tool to be applicable in different cultures and languages. Cultural adaptation is not limited to translation, but it aims to find the cultural target language equivalents of concepts represented by a text’s wording in original language (Aksayan & Gözüm, 2002; Dalli et al., 2022). The most frequently used methods for translating a scale from its original language into a target language are “one-way translation”, “group translation” and “back translation”, the latter being the most common (Aksayan & Gözüm, 2002; Çapık et al., 2018). The method employed in this study was back translation, that is, the scale was translated back into its original language by two different language experts. In addition, expert opinions were sought, as a result of which it was concluded that DLI was suitable for the Turkish language and culture in terms of language equivalence.
In scale adaptations, content validity is used to determine to which extent the overall scale and each item represent the construct that is intended to be measured (Çam & Arabacı, 2010; Yeşilyurt & Çapraz, 2018). While there are different techniques that can be used for content validity, Davis technique was employed in the present study. Davis (1992) technique rates expert opinions on a four-point scale as (a) “Appropriate”, (b) “Item requires minor revision”, (c) “Item requires major revision”, and (d) “Item not appropriate”. In this technique, the number of experts making options (a) or (b) is divided by the total number of experts to obtain the CVI for each item, while a value of .80 is accepted as a criterion (Davis, 1992; Şencan, 2005; Tavşancıl, 2006). In the present study, it was observed that DLI had a CVI score of .91 and that the CVI scores of all items were above .80, confirming the content validity of DLI.
Factor analyses are frequently used to test the construct validity of scales. Before examining the factor structure of a scale, KMO is applied to evaluate the adequacy of the sample for factor analysis, and Bartlett’s test is applied to evaluate its suitability. In order to perform factor analysis, KMO is expected to be above .60, while a value above .80 indicates a very good fit. A Bartlett’s test result of p < .05 indicates that the correlation matrix will be significant, the data set will be appropriate, and the sample will be sufficient (Kamiloğlu & Vural, 2022; Karagöz & Bardakçı, 2020; Tavşancıl, 2006). In the present study, KMO and Bartlett’s test showed that the sample was sufficient and the data set was suitable for factor analysis. EFA and CFA were performed to evaluate construct validity in the present study.
In EFA for construct validity, factor loads are recommended to be at least above .32. Factors with an eigenvalue of >1.00 are considered significant in determining the factors, and it is reported that the higher the variance rates, the stronger the factor structure of the scale. It is considered sufficient if variance rates range between 40% and 60% (Gürbüz & Şahin, 2017). Hence, it can be asserted that results of the present study are compatible with the literature, there is no need to omit items according to EFA results, and the construct validity of the scale is strong (Table 1).
CFA is performed to test whether or not the factor structure of an existing scale or model is confirmed (Karagöz & Bardakçı, 2020; Özdamar, 2013). In CFA application, a multitude of goodness-of-fit indices, factor loads, and t-statistics are examined to test the scale and a Path Diagram is created accordingly. Looking at CFA goodness-of-fit indices, χ2 (CMIN/DF), CFI, NFI, IFI, GFI, AGFI, TLI, RMR and RMSEA data must be at a desired level. When χ2 (CMIN/DF) is ≤ 3 or below, it is considered a ‘perfect fit’, and when it is five or below, it is considered an ‘acceptable fit’. When CFI and IFI criteria are .95 or above, they are considered a ‘perfect fit’, and when they are 0.85 or above are considered an ‘acceptable fit’. NFI criterion of ≥.95 is considered a ‘perfect fit’, and when it is ≥.80, it is considered an ‘acceptable fit’. GFI, AGFI and TLI criteria of ≥.90 or above are considered a ‘perfect fit’ and when they are ≥.80, they are considered an ‘acceptable fit’. RMSEA and RMR criteria of ≤.05 are considered a ‘perfect fit’ and when they are ≤1.00, they are considered an ‘acceptable fit’ (Hooper et al., 2008; Karagöz & Bardakçı, 2020; Simon et al., 2010). When examining the fit indices of the scale investigated in the present study, it was observed that χ2 (CMIN/DF) and TLI showed perfect fit, while RMSEA, AGFI, GFI IFI, NFI and CFI values showed an acceptable fit.
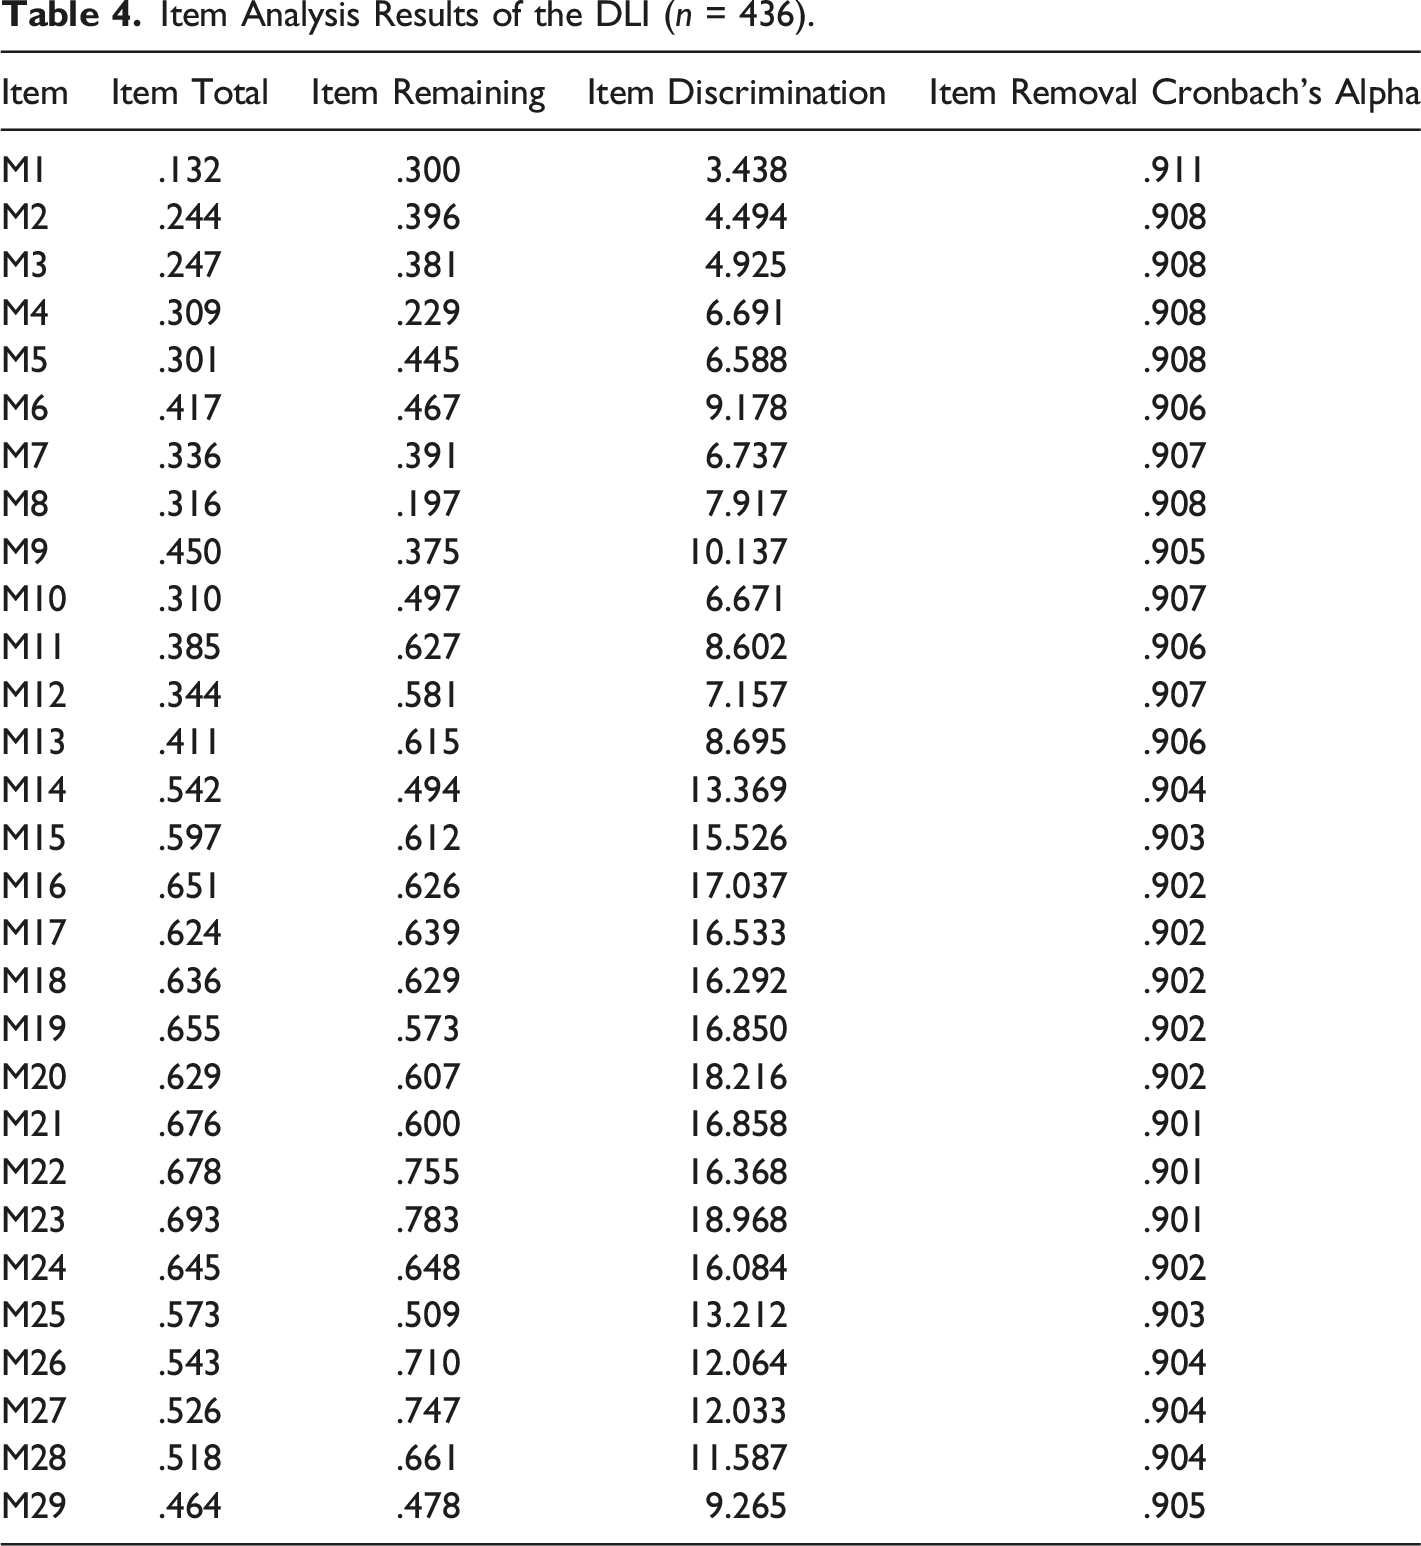
Item Analysis Results of the DLI (n = 436).
Reliability of DLI
Reliability is defined as the degree to which a measurement instrument gives the same results each time it is repeated (Aker et al., 2005; Gözüm & Aksayan, 2003; Şencan, 2005; Tavşancıl, 2006).
One of the analyses to determine scale reliability is test-retest analysis. This analysis is based on the principle of applying a scale to the same group at a certain interval (between 2 and 4 weeks) and looking at the correlation between them using the Pearson’s product moment correlation coefficient technique. The test-retest correlation coefficient is interpreted according to its range. A value of .00–.25 is considered as very weak, a value of .26–0.49 as weak, a value of .50–.69 as moderate, a value of .70–.89 as high, and a value of 0.90–1.00 as very high correlation coefficient strength (Büyüköztürk, 2008; Erefe, 2002; Gözüm & Aksayan, 2003; Karagöz & Bardakçı, 2020; Şencan, 2005; Tavşancıl, 2006; Tezbaşaran, 1997). In the present study, the test-retest correlation coefficient of DLI was found to be 0.98, suggesting that the scale is not affected by time, always measures the same quality even after time has passed by, and is reliable.
Cronbach’s alpha reliability coefficient evaluates whether or not the items in a scale are consistent with each other and whether or not they assess the same quality. In other words, the Cronbach’s alpha reliability coefficient is a measure of the internal consistency and homogeneity of the items in a scale (Gözüm & Aksayan, 2003; Şencan, 2005; Tavşancıl, 2006). The higher the Cronbach’s alpha reliability coefficient, the more reliable the scale (Şencan, 2005; Tezbaşaran, 1997). As put forth by Özdamar (2002), if Cronbach’s alpha reliability coefficient, i.e. internal consistency coefficient, is in the range of .00 ≤ α < .40, the scale is not reliable; if it is in the range of .40 ≤ α < .60, the scale has a low level of reliability; if it is in the range of .60 ≤ α < .80, the scale is fairly reliable; and if it is .80 ≤ α < 1.00, the reliability of the scale is high. In the present study, the Cronbach’s alpha reliability coefficient of overall DLI was 0.90. The values for its subscales are given in Table 3. According to these findings, it can be asserted that the overall scale and its subscales are reliable.
Item analysis is one of the methods used in internal consistency analysis. Item-total correlation accounts for the correlation between the scores of test items and the total score of the test. Positive and high item-total correlation indicates that the items exemplify similar behaviours and confirms that the internal consistency of the test is high (Büyüköztürk, 2008; Şencan, 2005; Tavşancıl, 2006). In the literature, it is recommended to omit from scales any items that have an item correlation coefficient of .30 or less than .20; however, in most cases .20 is used as a limit in studies (Gözüm & Aksayan, 2003; Şencan, 2005). In addition, it is expected that the results for both item-total and item remaining are statistically significant at the minimum level of p < .05 (Büyüköztürk, 2008; Şencan, 2005; Tavşancıl, 2006). Item discrimination is the comparison of the mean scores given to each item by top and bottom score groups (super-group, sub-group) when a sample group is sorted in descending order from the highest score to the lowest according to the total scores obtained from the scale. The difference between the item averages of the sub-group (27% bottom) and super-group (27% top) formed according to their total test scores is compared by independent sample t-test. There should be a significant difference between the two groups (Büyüköztürk, 2008; Şencan, 2005; Tavşancıl, 2006). In the present study, as a result of DLI item analysis, item-total correlations of the items in the scale were found to range from .693 to .132; while item-remaining correlation coefficients ranged between .747 and .197 (Table 4), with only two items (M1 and M8) below 0.20 (Table 4). As previously stated in the literature, an item that has low correlation with the total score measures a different quality from the other items in the scale, is not reliable, and should therefore be removed from the scale. But, before omitting an item from a scale, it is recommended to evaluate if and to what extent the omission will create a change in alpha coefficient and mean values. If omission of an item that is found unreliable creates an increase in alpha coefficient, the reliability of that item is confirmed to be low, and hence, should be removed from the scale (Çam & Arabacı, 2010; Çapık, 2014; Gözüm & Aksayan, 2003). In the present study, potentially omittable items were examined in terms of their effect on alpha coefficients, and since no significant increase was observed, no item was omitted from the scale in order not to disrupt the integrity of the scale. The t-values showing the item discrimination coefficients ranged from 3.438 to 18.216. Accordingly, all of the items in the scale were found to be statistically highly significant (p < 0.05). According to these results, it can be asserted that the items are distinctive in terms of the quality they measure and that the reliability of the items that constitute the overall scale is high and aimed at measuring the same purpose.
A scale’s additivity indicates that the scale score can be considered as a single score by adding up the scores of the items in the scale. Non-additivity = .000 shows that non-additivity is statistically insignificant, i.e., that the scale is additive.
Hotelling’s T-square test is used to determine response bias, which affects both the reliability and validity of the scale. Hotelling’s T-square test indicates whether or not the questions of a scale are perceived the same by the participants and whether or not they have the same level of difficulty. This test also shows whether or not the population mean is normally distributed (Karagöz & Bardakçı, 2020). According to the results of this test, the scale in the present study was shown to be free of response bias.
Based on the results explained above, the scale obtained as a result of the present study is considered a useful tool to conveniently measure death literacy in the Turkish society, and to determine the readiness of patients, their relatives, and especially health professionals who frequently encounter end-of-life patients, and to pinpoint erroneous behaviours and beliefs caused by imperfect knowledge.
The limitations of our study are that research was done online, that the study sample only consisted of individuals aged 18 and over, without extending to all segments of society. Although our study was conducted during Covid-19, the results were not affected by the pandemic. We think that personal experiences, as is also mentioned in the literature, are an important factor in death literacy independent of the pandemic (Noonan et al., 2016). It would be advisable to support the death literacy index with further research on a wider sample group that will extend to all segments of the Turkish society and other societies, including inter alia vulnerable groups (children, etc.).
Conclusion
It was observed that the Turkish version of DLI was a valid and reliable tool and suitable for use in Turkish society.
Supplemental Material
Supplemental Material - Validity and Reliability of the Turkish Version of the Death Literacy Index
Supplemental Material for Validity and Reliability of the Turkish Version of the Death Literacy Index by Vahide Semerci, Ebru Sönmez Sari and Ahmet Seven in OMEGA - Journal of Death and Dying
Footnotes
Acknowledgments
The authors acknowledge the contribution of our research participants
Ethical Consideration
The study was approved by Bayburt University Ethics Committee (Document Date and Number: 15.03.2022/63, Decree no: 04). Permission to use the scale in the study was obtained from the authors thereof. Also, informed consent was obtained from the participants.
Declaration of Conflicting Interests
The author(s) declared the following potential conflicts of interest with respect to the research, authorship, and/or publication of this article: No potential conflict of interest was reported by the author(s).
Funding
The author(s) received no financial support for the research, authorship, and/or publication of this article.
Supplemental Material
Supplemental material for this article is available online.
Author Biography
References
Supplementary Material
Please find the following supplemental material available below.
For Open Access articles published under a Creative Commons License, all supplemental material carries the same license as the article it is associated with.
For non-Open Access articles published, all supplemental material carries a non-exclusive license, and permission requests for re-use of supplemental material or any part of supplemental material shall be sent directly to the copyright owner as specified in the copyright notice associated with the article.