
Abstract
As India’s economy becomes more integrated with global capital markets, the foreign exchange (FX) exposure of non-financial corporations deserves closer scrutiny. This article presents the first firm-level empirical study of foreign-currency borrowing by Indian non-financial corporations, using a matched panel of 38,589 firms from 2009 to 2023. Using local projections, we estimate how changes in balance-sheet fundamentals—leverage, export intensity, profitability, asset returns and the interest coverage ratio—translate into different forms of foreign borrowing. We find that when leverage increases and export intensity rises, firms raise foreign-currency borrowing, whereas weakening profitability is associated with lower foreign borrowing; responses vary by instrument and by firm type. State-owned enterprises (SOEs) and small and medium-sized enterprises (SMEs) appear particularly vulnerable, often increasing FX exposure when fundamentals deteriorate. India ranks mid-table on corporate dollarisation but near the bottom on hedge ratios. A stress test that simulates a 20 per cent rupee depreciation shows that 12 per cent of firms have an interest coverage ratio below one, revealing hidden vulnerabilities. The findings suggest the need for granular FX exposure disclosure, calibrated hedge norms and differentiated prudential oversight. As India pursues its 2,047 growth ambitions, effective FX risk management is a core pillar of macroeconomic and financial stability.
1. Introduction
India’s deepening integration into global trade and finance has significantly increased corporate sector exposure to foreign exchange (FX) risk. As non-financial firms expand their cross-border operations, whether through exporting, importing or offshore investment, they face the prospect of currency-mismatch vulnerabilities. Unmanaged FX exposure can have severe consequences: a sharp depreciation inflates the local-currency value of foreign-currency debt, eroding equity and risking default (Chan-Lau & Santos, 2006; Goldstein & Turner, 2003). Conversely, proactive risk management—hedging via derivatives, pricing adjustments or ‘natural hedges’ (matching FX liabilities with export revenues)—can mitigate such vulnerabilities (Alfaro et al., 2021).
Despite the Financial Stability Reports of the Reserve Bank of India (RBI) repeatedly highlighting corporate FX risks and successive committees (Rangarajan, 1991; Reddy, 2007) recommending macroprudential oversight, there remains no comprehensive firm-level mapping of how balance-sheet fundamentals—leverage, export share, profitability, asset returns and interest coverage—drive Indian non-financial corporates’ FX borrowing choices. Aggregate studies (Sensarma & Bhattacharyya, 2016; Sur et al., 2019) mask heterogeneity across firms of different ownership structures and sizes. Nevertheless, such granularity is crucial: small and medium-sized enterprises (SMEs) and state-owned enterprises (SOEs) may behave very differently from large private firms when fundamental shifts occur (BIS, 2023; IMF, 2018).
This article fills that gap using a balanced panel of 38,589 Indian non-financial firms over the period 2009–2023 from CMIE Prowess-IQ. We apply Jordà’s (2005) local projections (LP) framework—estimating dynamic impulse responses to one-standard-deviation shocks in the five fundamental ratios, with firm and year fixed effects and clustering standard errors at the firm level. Our dependent variables are total FX borrowing, secured external commercial borrowings (ECBs), and unsecured ECBs, each expressed as a percentage of total debt. Explanatory variables include standardised, log-transformed debt-to-equity (LEVERAGE), export share (EXPORT), interest coverage ratio (ICR), net profit margin (PROFIT) and return on assets (ROA). We also control firm size, asset tangibility and real GDP growth. A brief identification section acknowledges residual endogeneity and suggests potential instrumental strategies for future work.
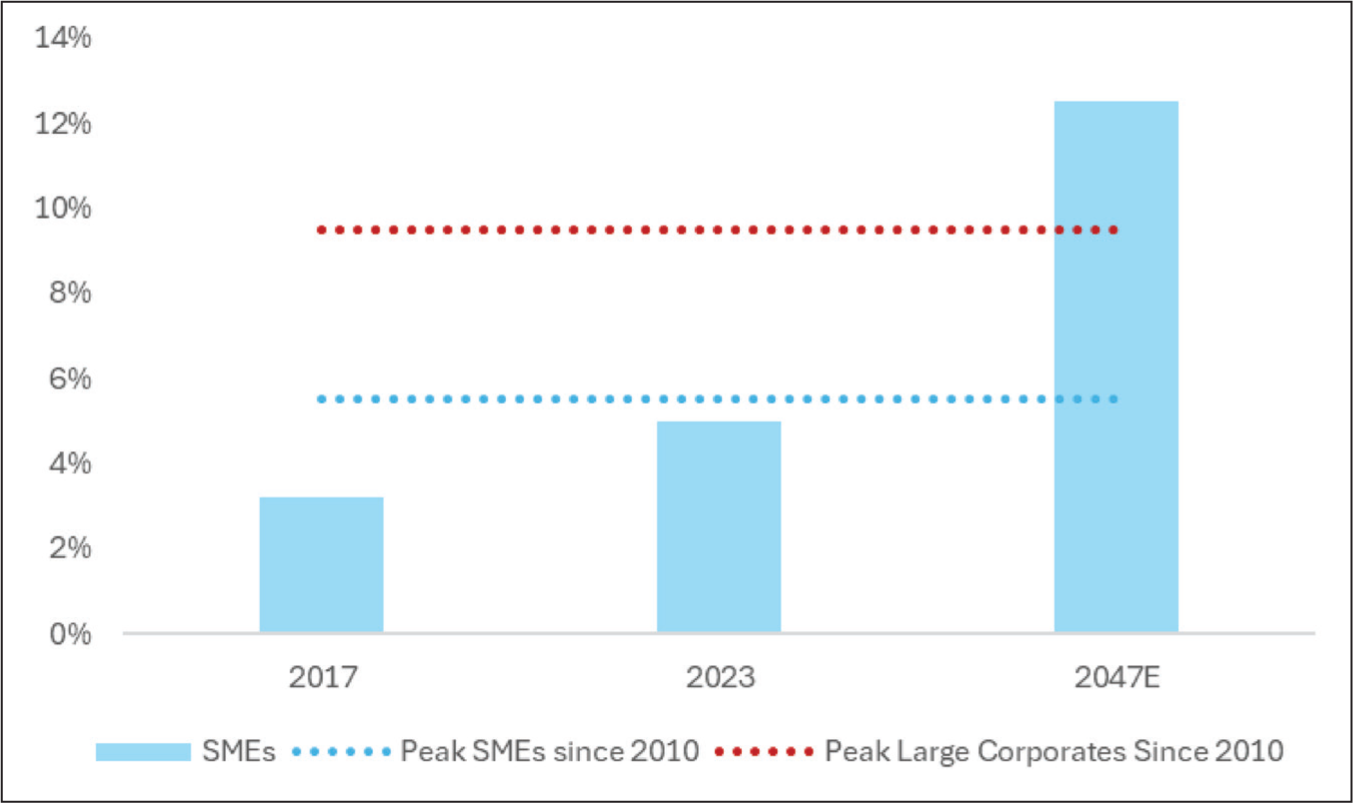
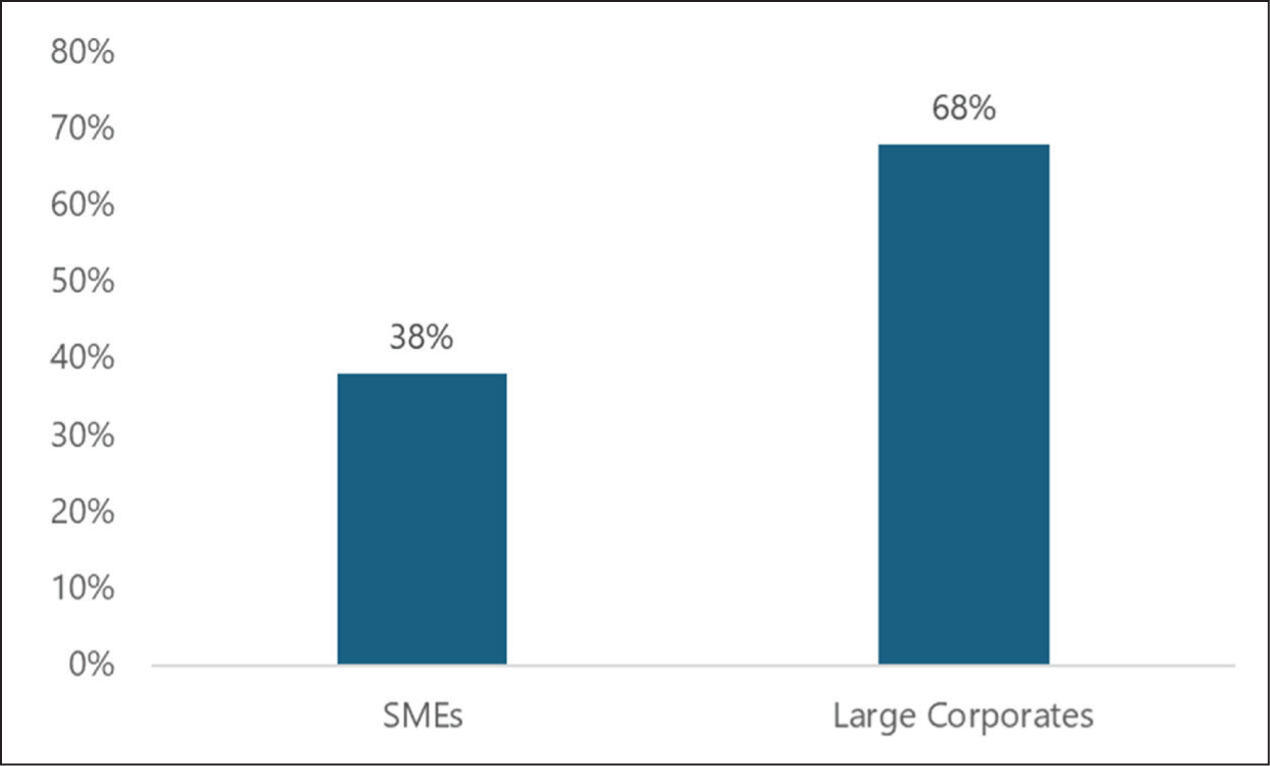
Our analysis yields four main insights. First, leverage and export shocks induce firms to increase FX borrowing, with a hump-shaped pattern—rising at one to one to two years, peaking, then tapering off and turning negative in the long run. Secured ECBs respond most strongly to leverage shocks, reflecting collateral availability, while unsecured ECBs exhibit only modest, transient responses. Second, profitability and ROA shocks yield only temporary increases in FX borrowing, as firms utilise windfall profits or elevated asset returns for short-term external funding but revert to domestic financing once margins normalise. Interest coverage shocks have mixed, muted effects. Third, ownership matters: SOEs tap unsecured FX markets even when leverage is high and profitability low, revealing moral-hazard dynamics under implicit government guarantees. Private firms tend to rely more on secured credit and domestic funding when economic fundamentals deteriorate. Fourth, SMEs face acute vulnerabilities: their share of ECBs rose from 3 per cent in FY 2017 to 5 per cent in FY 2023 (Chart 1), 1 but only 38 per cent of their FX liabilities are hedged (Chart 2), as compared to 68 per cent for large firms. A stress test simulating a 20 per cent rupee depreciation shows that 12 per cent of firms breach the ICR < 1 threshold, with SMEs and SOEs being the most affected. As global financial conditions tighten and trade patterns shift, there is an increasingly urgent need to address these vulnerabilities.
Cross-country benchmarking places India in the mid-table on dollarisation—total FX debt as a share of total debt—but near the bottom on hedge ratios, as compared to Indonesia, Thailand and Brazil (Tables 1 and 2; Chart 4). While peers employ firm-level reporting templates, mandatory hedge norms based on net open positions, and regular stress tests, India’s disclosure remains aggregate and coarse. These gaps pose risks as corporate FX exposure grows, especially with India’s ambition to achieve developed-country status by 2,047, implying sustained 10 per cent nominal GDP growth in dollar terms. Historical precedents, such as Brazil in the 2010s, Russia in the early 2000s, and China’s property sector recently, caution that rapid, externally financed expansions can unravel if FX mismatches go unchecked.
This article contributes to the literature in four ways. First, it is the earliest to deploy firm-level LPs on corporate FX borrowing in an emerging market context, offering flexible horizon-specific responses that circumvent the functional-form restrictions of VARs and diff-in-diff (Auerbach & Gorodnichenko, 2013; Jordà, 2005). Second, distinguishing between secured and unsecured ECBs reveals that collateral constraints are critical drivers of offshore funding decisions—an angle absent from prior Indian work and rare even in other emerging market economies (EMEs). Third, ownership splits reveal that the FX borrowing dynamics of SOEs diverge sharply from those of private firms, highlighting the effects of governance and implicit guarantees (BIS, 2023). Fourth, we translate empirical insights into policy by benchmarking India’s regime against international best practices, pointing to concrete surveillance gaps (IMF, 2018; Tiftik et al., 2023).
A central challenge is to separate cause from effect in firms’ foreign-currency borrowing. Our LP estimates describe conditional dynamics rather than structural causal effects. Reverse causality, common global shocks, measurement error and selection into offshore markets can move fundamentals and foreign borrowing together. We mitigate these risks with firm and year fixed effects, a lagged dependent variable, standard controls and lead and placebo tests, but we interpret the responses as descriptive.
The remainder of the article is organised as follows. Section 2 reviews literature, streamlining discussions of original sin, balance-sheet effects and risk-management practices. Section 3 describes the data, variables and the LP methodology, including a brief sub-section on endogeneity identification. Section 4 outlines headline trends—SMEs’ rising ECB share, hedging gaps, SOEs’ vulnerabilities and cross-country comparisons—and summarises key findings from Charts 1–4 and Tables 1–2. Section 5 synthesises the LP results, presenting only eight core figures (Figures 1–8) in the main text and relegating the remaining impulse responses to the Appendix. Section 6 reports the 20 per cent rupee depreciation stress test (Figure 42). Section 7 offers a cross-border analysis of FX exposure monitoring (Tables 1–2; Chart 4). Section 8 presents the conclusion. Section 9 distils policy implications, linking each recommendation to empirical findings. The Appendix contains descriptive statistics (Tables A4–A6), sectoral stress-test results and proposed firm-level reporting templates
2. Literature Review
We organise the review around three themes: (a) the origins of currency mismatches—‘original sin’ and balance-sheet effects, (b) empirical evidence on corporate FX borrowing and hedging and (c) policy responses and surveillance gaps. We focus on presenting each concept succinctly, avoiding repetition.
2.1 Original Sin and Balance-Sheet Effects
‘Original sin’ describes a country’s inability to borrow abroad in its currency, forcing both sovereigns and corporates to issue external debt in major currencies—typically the US dollar (Eichengreen et al., 2007). In the corporate realm, this leads to currency mismatches, where revenues are in local currency and liabilities are denominated in a foreign currency, leaving balance sheets vulnerable to exchange-rate swings (Eichengreen & Hausmann, 2002). When the domestic currency depreciates, the local-currency value of FX debt soars, eroding net worth and raising the default risk. Eichengreen et al. (2007) show that ‘original sin’ is driven less by poor domestic policies and more by global financial architecture and network externalities—only large, advanced economies can credibly issue external debt in their currency.
Theoretical models formalise how currency mismatches propagate shocks. The classic ‘balance-sheet effect’ model posits that depreciation inflates FX debt, reduces equity, induces banks to tighten lending, and triggers widespread deleveraging (Chan-Lau & Santos, 2006; Goldstein & Turner, 2003). During the 1997–1998 Asian Financial Crisis, Korean chaebols with unhedged dollar debt saw domestic-currency liabilities explode when the won collapsed, leading to corporate insolvencies and banking sector distress. Auerbach and Gorodnichenko (2013) demonstrate that such financial frictions amplify fiscal and monetary shocks, underscoring the macroprudential importance of monitoring corporate FX exposures.
While advanced economies possess ‘original sin exemptions’—deep local-currency markets and robust hedging infrastructures—EMEs remain exposed. Even advanced-economy banks accumulate FX positions through cross-border lending, and sudden exchange-rate movements can impair bank balance sheets, constrict credit supply and propagate shocks (Eichengreen et al., 2023). Nonetheless, stronger hedging and local capital markets mitigate these effects to a greater extent relative to EMEs.
2.2 Empirical Evidence on Corporate FX Borrowing and Hedging
Empirically, corporate currency mismatches remain pervasive in EMEs. Non-financial corporate FX debt in EMEs jumped from $4 trillion in 2004 to over $41 trillion by 2023 (Tiftik et al., 2023). India’s ECBs rose sharply after 2010, driven by liberalised policies and abundant global liquidity; by 2022–2023, ECBs accounted for 39 per cent of India’s external debt (Sensarma & Bhattacharyya, 2016; Sur et al., 2019).
Sur et al. (2019) ask whether domestic fundamentals (e.g., profitability and leverage) or global conditions (e.g., interest differentials) drive ECB flows in India, finding evidence for both supply- and demand-side influences. Sur et al. (2024) examine the role of unhedged FX exposure in corporate vulnerabilities during currency depreciations. Firms with higher unhedged FX debt faced steeper declines in profitability and credit ratings when the rupee weakened.
Across EMEs, hedging practices remain uneven. ‘Natural hedges’—matching FX revenues from exports with FX debt—are limited (Alfaro et al., 2021). Derivative-based hedging (forwards, swaps and options) concentrates among large firms with deep financial access, while SMEs struggle to hedge due to cost, market depth and governance constraints (Islam, 2022). Even large firms often hedge only near-term flows, leaving longer-term debts unprotected (Goldstein & Turner, 2003). Alfaro et al. (2021) find that despite increased availability of hedging instruments, aggregate corporate FX exposures in EMEs remain significant.
2.3 Corporate Governance, Ownership Effects and Policy Responses
Ownership structure affects risk-taking. SOEs often enjoy implicit sovereign guarantees, which reduce their borrowing costs and weaken managerial incentives to avoid excessive FX risk (BIS, 2023). In the mid-2010s, Brazil’s SOEs tapped unsecured FX markets precisely when leverage rose and profitability fell, accumulating losses that required sovereign support. In contrast, private firms face stricter budget constraints, such as equity dilution, higher credit spreads and takeover disciplines, aligning managerial incentives with shareholder value and curbing reckless FX borrowing (Eichengreen & Hausmann, 2002).
Regulatory responses in EMEs aim to contain FX exposures. After India’s 2013 ‘taper tantrum’, the RBI imposed limits on short-term ECBs and tightened end-use requirements, reducing destabilising dollar flows (Acharya & Siddharth, 2021). Indonesia mandates detailed firm-level exposure reporting (maturity, amount and hedging status) to Bank Indonesia, with mandatory hedging for significant FX liabilities. Thailand requires corporations to report FX borrowings with maturity and hedging details, conducts regular audits and enforces partial hedging of net open positions. Brazil imposes FX borrowing limits by maturity buckets, requires comprehensive disclosure of FX assets and liabilities and incentivises hedging through reduced reserve requirements. Despite these measures, India’s corporate FX monitoring remains less granular, especially for SMEs, leaving pockets of vulnerability undetected (IMF, 2018).
Emerging-market firms thus continue to face substantial FX mismatch risks due to original sin, incomplete hedging and governance distortions. While large firms often hedge partially, SMEs remain exposed. Regulatory frameworks in peers (Indonesia, Thailand and Brazil) offer lessons for India’s evolving regime. This article builds on this literature by providing firm-level impulse responses to financial shocks, distinguishing between secured and unsecured debt, and linking these insights to policy gaps in India.
2.4 Theoretical Motivation and Hypotheses
Corporate risk-management theory explains why firms hedge in the presence of frictions. Hedging reduces expected financial distress and bankruptcy costs and can raise firm value (Purnanandam, 2008; Stulz, 1984). When external finance is costly, risk management stabilises internal funds and protects planned investment, thereby helping coordinate investment and financing policies (Froot et al., 1993). Empirically, users of foreign-currency derivatives tend to have higher market valuations, which is consistent with value-increasing risk management (Allayannis & Weston, 2001), and hedging supports higher debt capacity and the tax benefit of debt (Graham & Rogers, 2002). These insights imply simple expectations for our setting. An increase in leverage is associated with higher foreign-currency borrowing at moderate levels, where debt capacity improves, but very high leverage is associated with retrenchment as expected distress increases. An increase in export intensity is associated with higher foreign-currency borrowing through a natural-hedge channel. Temporary improvements in profitability and ROA are associated with short-lived increases in secured foreign borrowing as firms expand. A weaker ICR is associated with lower unsecured foreign borrowing because lenders price expected distress.
3. Data and Methodology
3.1 Data Sources and Sample Construction
We assemble a balanced panel of 38,589 Indian non-financial firms from CMIE Prowess-IQ for fiscal years 2009–2023. We exclude financial firms, including banks, insurers, and non-banking financial companies (NBFCs) because their balance-sheet structures, regulatory frameworks and FX risk management differ fundamentally from those of non-financial corporates. Financial intermediaries routinely hold and transform FX assets and liabilities, face sectoral FX limits and hedge centrally, which can conflate corporate FX dynamics with financial sector behaviour. By focusing solely on non-financial firms, we isolate real-sector borrowing choices and risk management.
We define SMEs as firms with total assets ≤ $750 million; larger firms exceed this threshold. Ownership is flagged as SOE if government shareholding > 50 per cent; otherwise, firms are private. ECB data are sourced from firm disclosures in Prowess-IQ. Secured and unsecured ECBs are recorded in US dollars and converted into rupees at the average annual exchange rate. The total FX borrowing equals the sum of secured and unsecured ECBs. All monetary variables are in real terms, deflated by the firm’s fiscal-year CPI, and log-transformed. Panel variables are winsorised at the 1st and 99th percentiles to mitigate outliers.
Tables A4 (all firms), A5 (SOEs) and A6 (private firms) in the Appendix present descriptive statistics for FX borrowing, secured and unsecured ECBs, export share, debt-to-equity ratio, net profit margin, total asset returns and ICR.
3.2 Variable Definitions
Our dependent variables, expressed as a percentage of total debt, are:
Total FX borrowing: Sum of secured and unsecured ECBs in rupees divided by total debt. Secured ECBs: Foreign-currency loans collateralised by assets. Unsecured ECBs: Foreign-currency loans without collateral.
Our key explanatory variables are standardised to mean zero and unit variance. Where variables are strictly non-negative and highly skewed, we apply a monotone transformation to compress tails before standardisation; variables that can take zero or negative values (e.g., profit margin, ROA and ICR) enter the estimations in levels and are then standardised. Since all the transformed regressors are subsequently standardised, alternative small additive constants inside a logarithm amount to smooth, monotone re-mappings and only rescale the regressor; the signs and timing of the impulse responses do not change in interpretation. The variables are:
Debt-to-equity ratio (LEVERAGE): Total debt divided by shareholders’ equity. Export share (EXPORT): Export sales as a percent of total sales. Interest coverage ratio (ICR): EBIT divided by interest expense. Net profit margin (PROFIT): Net income divided by total revenue. Return on assets (ROA): Net income divided by total assets.
The control variables include:
Firm size (SIZE): Log of total assets. Asset tangibility (TANGIBLE): Fixed assets divided by total assets. Real GDP growth (GDPG): Annual growth rate of India’s real GDP.
All regressions include firm fixed effects (αi) and year fixed effects (τt). We cluster standard errors at the firm level to account for serial correlation and heteroskedasticity.
Leverage, export intensity, profitability, ROA and ICR serve as reduced-form proxies for distress costs, natural-hedge capacity and internal-fund availability that underlie the theories of Stulz (1984) and Froot et al. (1993). Interpreting impulse responses through these frictions allows us to relate our firm-level dynamics to the corporate hedging evidence in Allayannis and Weston (2001), Graham and Rogers (2002) and Purnanandam (2008).
3.3 Local Projections Methodology
We estimate horizon-specific impulse responses to one-standard-deviation shocks in each explanatory variable using Jordà’s (2005) LP approach. For each horizon k = 0,…,10, we estimate:

where y is a measure of forex borrowings, secured or unsecured ECB; the coefficients αi and τt are company and time fixed effects, respectively, accounting for cross-company heterogeneity and time shocks; βk denotes the cumulative response of forex borrowings, secured or unsecured ECB in each k year after the shocks in debt-to-equity ratio, export sales, net profit margin, ROA or ICR. X denotes debt-to-equity ratio, export sales, net profit margin, ROA or ICR.
We include the lagged level of the dependent variable to account for state dependence. Standard errors are clustered at the firm level. Estimating the LP for each k separately yields flexible, non-parametric impulse-response functions (IRFs) without imposing VAR restrictions.
The most common issues in panel data analysis are cross-sectional dependence, heteroskedasticity and serial correlation. Hence, we calculate the standard errors using the Driscoll–Kraay (DK) method. The DK procedure constructs heteroskedasticity- and autocorrelation-consistent estimators by first forming the sample averages of the products between each regressor and its residual. By building these weights from the data itself, the DK method naturally accommodates both cross-sectional and temporal dependence, yielding standard errors that remain valid under a wide range of heteroskedasticity and serial correlation forms. The DK approach has the following notable properties: (a) It delivers consistent covariance estimates even when observations exhibit spatial correlation or heteroskedasticity. (b) Its performance does not deteriorate regardless of whether the time dimension is small or large. (c) It refines the estimator’s covariance matrix by introducing a suitably large regularisation constant. (d) It can be applied to datasets with missing observations and accommodates both balanced and unbalanced panels.
With the data, sample construction and local-projection methodology in place, we now turn to the key patterns in FX borrowing by Indian non-financial firms. Section 4 summarises the main trends—SMEs’ rising share of ECBs, persistent hedging shortfalls, SOEs’ distinct vulnerabilities and India’s position relative to regional peers—before we present the impulse-response results in Section 5.
4. Headline Trends of Indian Corporate Fx Borrowing
We first summarise descriptive, headline patterns—SMEs’ growing ECB share, hedging gaps, SOEs’ distinct vulnerabilities and cross-country benchmarking—before presenting the empirical IRFs in Section 5.
4.1 SMEs: A Growing Source of Unhedged FX Risk
SMEs, defined here as firms with total assets ≤ $750 million, have become an increasingly significant source of ECBs. Chart 1 shows that the SME share of total ECBs increased from 3 per cent in FY 2017 to 5 per cent in FY 2023, and, if the trend prevailing during 2017–2023 persists, the SME share would reach an estimated 12 per cent by 2047. Two interrelated forces drive this shift.
On the push side, domestic credit conditions have tightened. Intermittent liquidity stress in NBFCs and heightened prudential requirements constrained long-term rupee financing for smaller firms. Higher domestic interest rates after 2013 also made onshore borrowing more expensive relative to low-cost USD funding, encouraging SMEs to tap offshore markets.
On the pull side, historically low global interest rates between 2014 and 2021, combined with successive liberalisations of the RBI’s ECB framework (e.g., increased end-use categories, reduced minimum maturities), lowered both the all-in USD cost of borrowing and the administrative burdens. Borrowers faced fewer documentary requirements for smaller-ticket loans, further incentivising cross-border borrowing.
However, this increased offshore borrowing has not been matched by adequate hedging. Chart 2 indicates that only 38 per cent of SME FX liabilities were hedged in FY 2023, compared to 68 per cent for large corporates. This gap echoes the vulnerabilities exposed in Korean and Thai SMEs during the 1997–1998 Asian Financial Crisis, when unhedged FX debt amplified currency shocks (Chan-Lau and Santos, 2006). SMEs’ limited access to derivatives markets, higher hedging costs and weaker risk governance contribute to low hedge ratios (Alfaro et al., 2021; Islam, 2022).
SMEs’ rising share of unhedged FX debt creates a precarious channel for currency shocks to transmit disproportionately through this segment. As global financial conditions tighten, potential rollover risks and margin calls on derivatives could trigger liquidity crunches that spill over into the broader corporate sector.
4.2 State-owned Enterprises
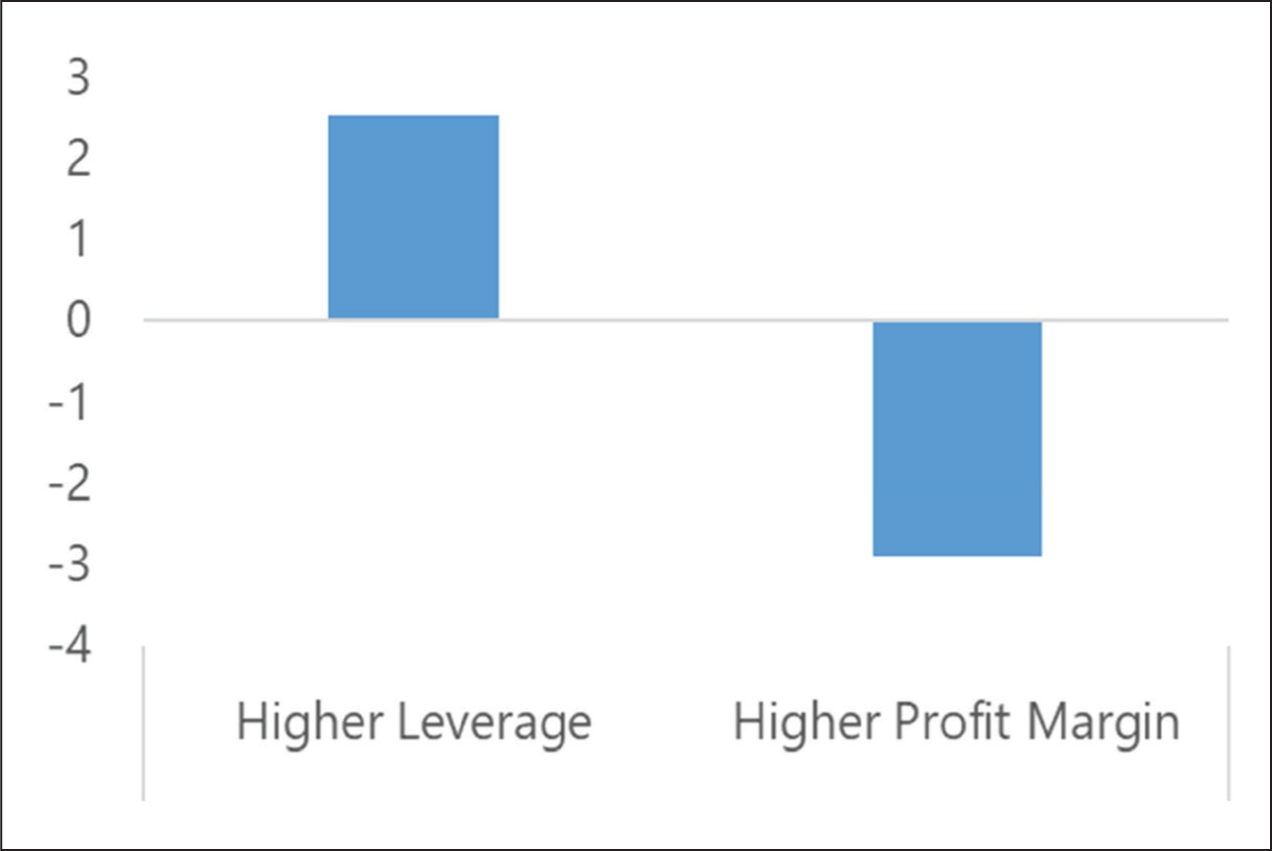
In a growing emerging market, SOEs play a key and distinct role. This is especially true for India, where SOEs have always formed a significant proportion of key sectors. This article analyses SOEs specifically and finds that they exhibit distinct FX borrowing patterns. Chart 3 aggregates descriptive evidence showing that SOEs’ unsecured FX borrowing is most sensitive to leverage and profitability shocks as compared to private firms. Implicit government backing appears to encourage SOEs to tap unsecured FX markets when their balance-sheet resilience weakens, reminiscent of Brazilian SOEs in the mid-2010s (BIS, 2023).
From a principal–agent perspective, SOE managers—anticipating that losses will ultimately be socialised while gains accrue privately—have incentives to increase FX borrowing even when leverage rises and profitability declines. This moral-hazard dynamic can lead to excessive risk-taking and heightened systemic vulnerability.
In contrast, private firms operate under more complex budget constraints: they face direct equity dilution, potentially higher credit spreads and market-based rating pressures when financial metrics deteriorate. These governance mechanisms and the threat of takeover serve as checks on reckless FX borrowing (Eichengreen & Hausmann, 2002).
5. Empirical Analysis
Instead of detailing all the IRFs, we synthesise insights by grouping findings according to shocks and instruments. We focus on three overarching themes: (a) collateral-driven secured borrowing, (b) inertia in unsecured credit and (c) ownership and size heterogeneity. We present eight core figures (Figures 1–9) in the main text; the remaining IRFs (Figures 10–45) are in the Appendix. We begin with a brief identification sub-section.
5.1 Identification and Endogeneity
LPs provide dynamic correlations rather than strict causal estimates. By including firm and year fixed effects, lagged dependent variables and observable controls (SIZE, TANGIBLE and GDPG), we mitigate—but do not eliminate—endogeneity concerns. To probe residual bias, we perform:
Lead tests: Replacing X{i,t}with X{i,t+1}, X{i,t+2}, … to check for anticipatory movements in FX borrowing; insignificant coefficients on leads support temporal precedence. Placebo tests: Randomly permuting X{i,t} across firms to ensure that significant IRFs vanish when shocks are uncorrelated with portfolios. Robustness checks: Estimating LPs without controls, with alternative lags and clustering standard errors by industry rather than firm; results remain qualitatively unchanged.
Nevertheless, supply-side conditions, such as global dollar liquidity, and unobserved firm-specific strategies could simultaneously influence fundamentals and FX borrowing. Future work could exploit exogenous policy changes—for example, the 2013 taper tantrum-induced ECB rule revisions—as instruments for causal inference.
Robustness checks excluding crisis years (2008–2009, 2020–2021) yield qualitatively similar results.
We also note that the impulse responses are reported for standardised regressors, so any smooth monotone re-scaling of a skewed variable (e.g., log(c+x) with a small c) affects only the regressor’s scale, not the qualitative pattern of responses.
5.2 Leverage Shocks: Collateral-driven Secured ECBs, Constrained Unsecured Credit
5.2.1 All Firms
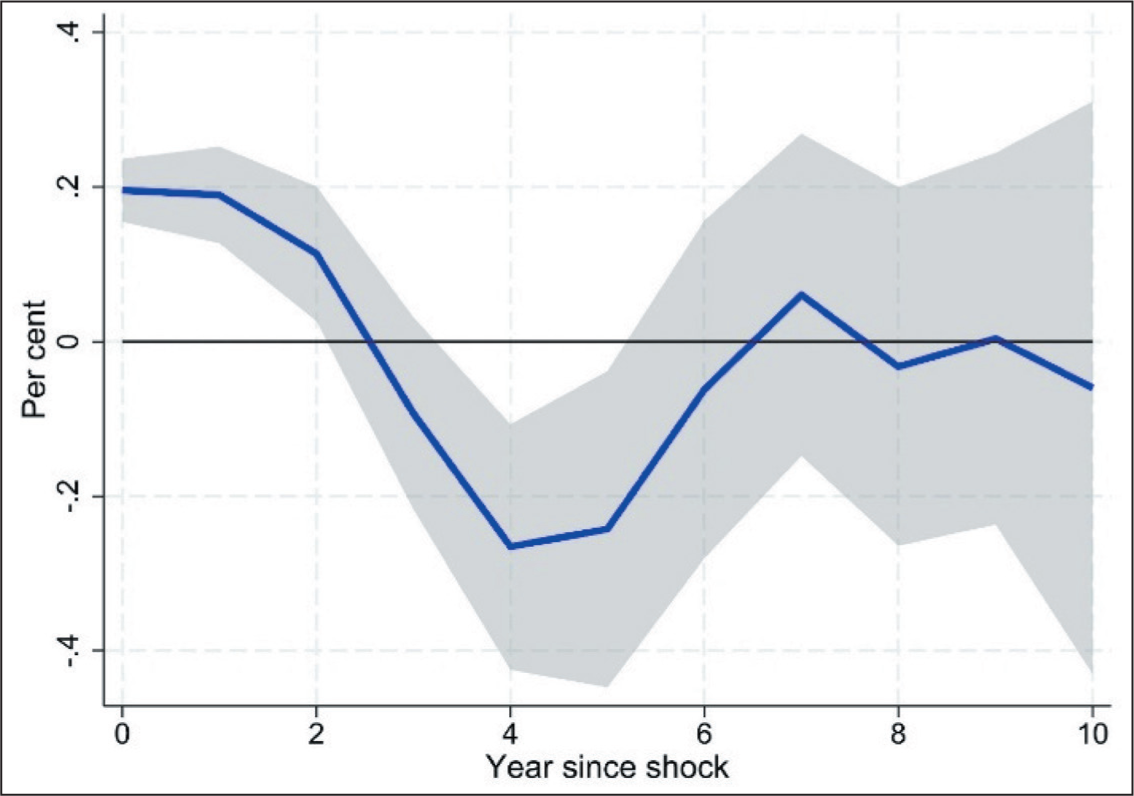
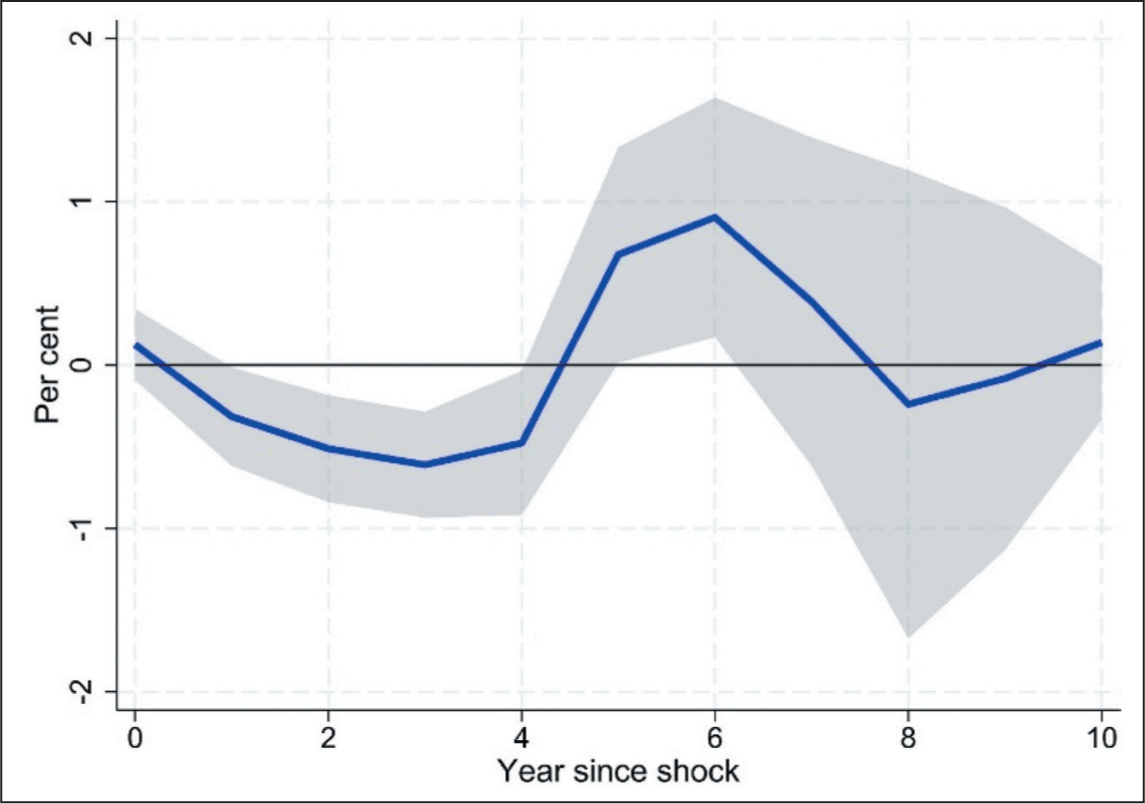
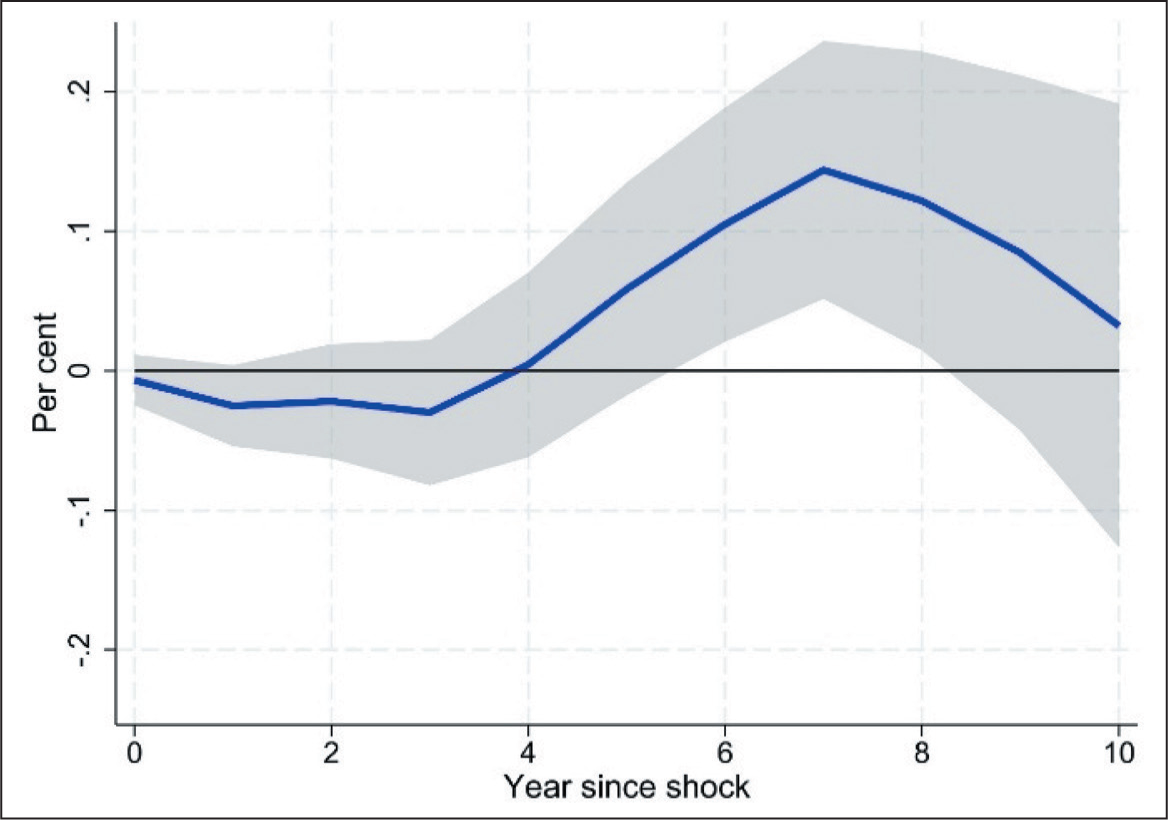
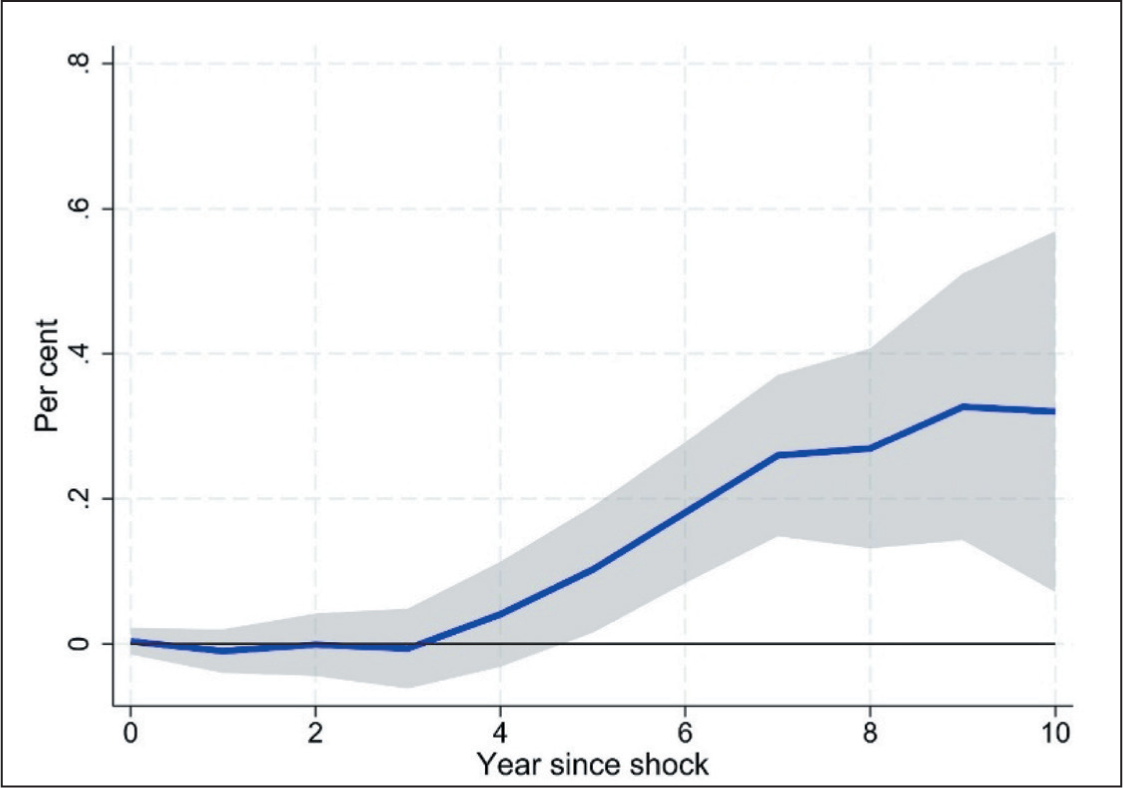
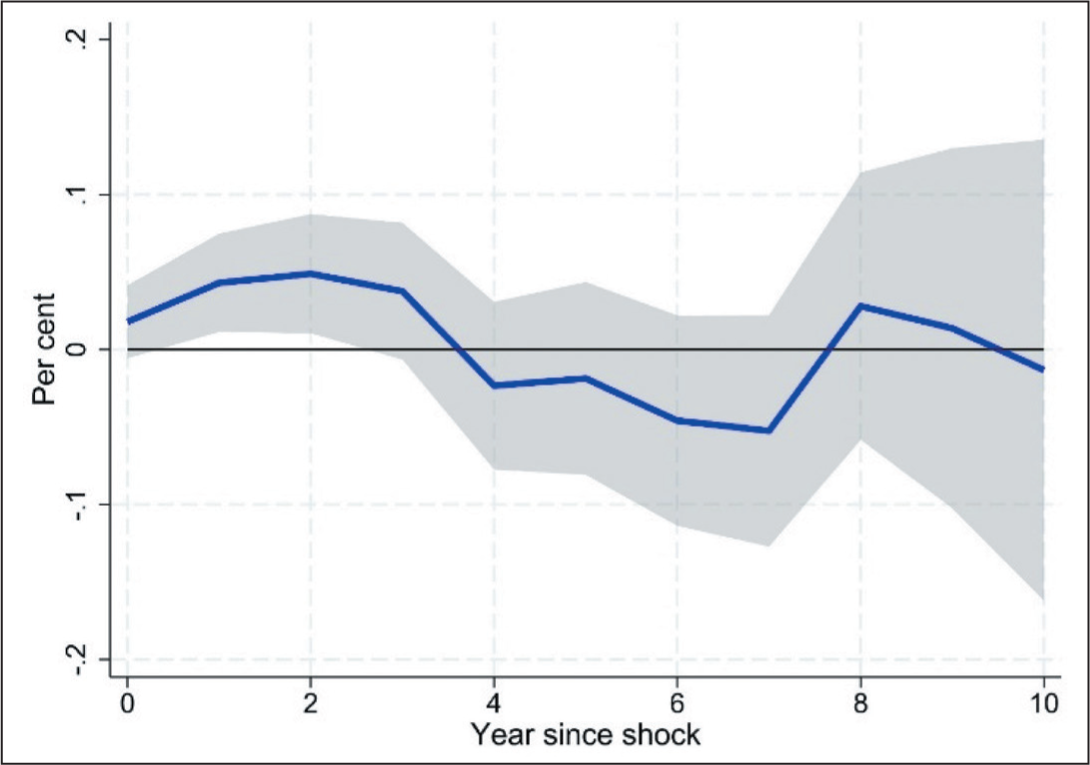
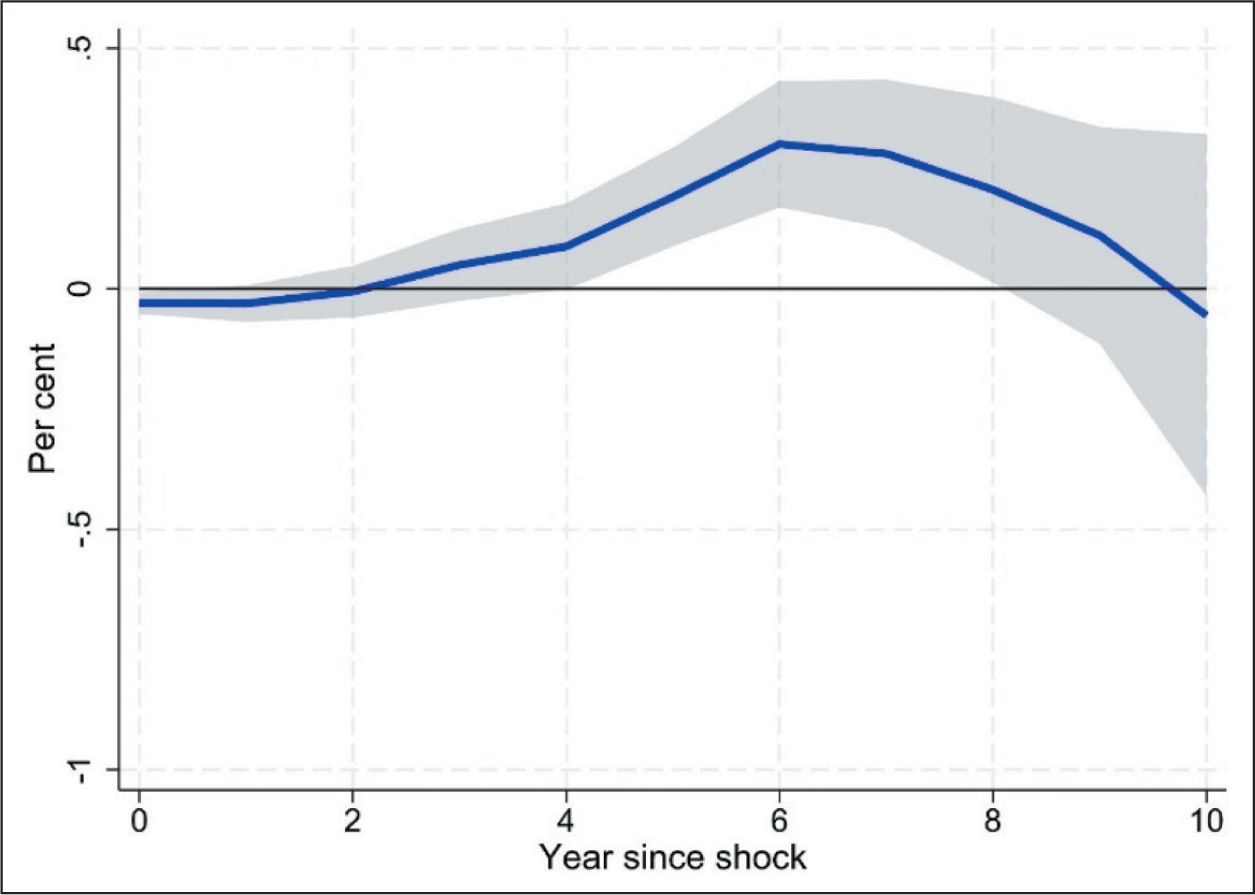
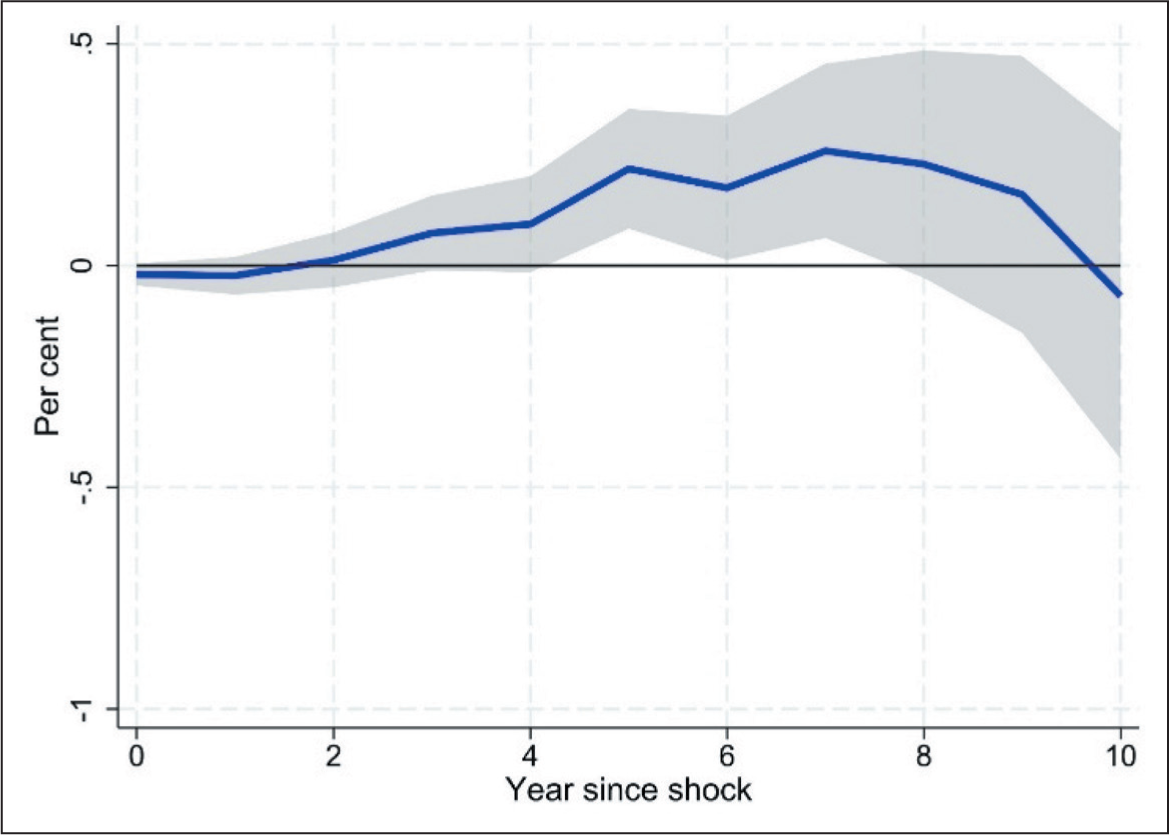
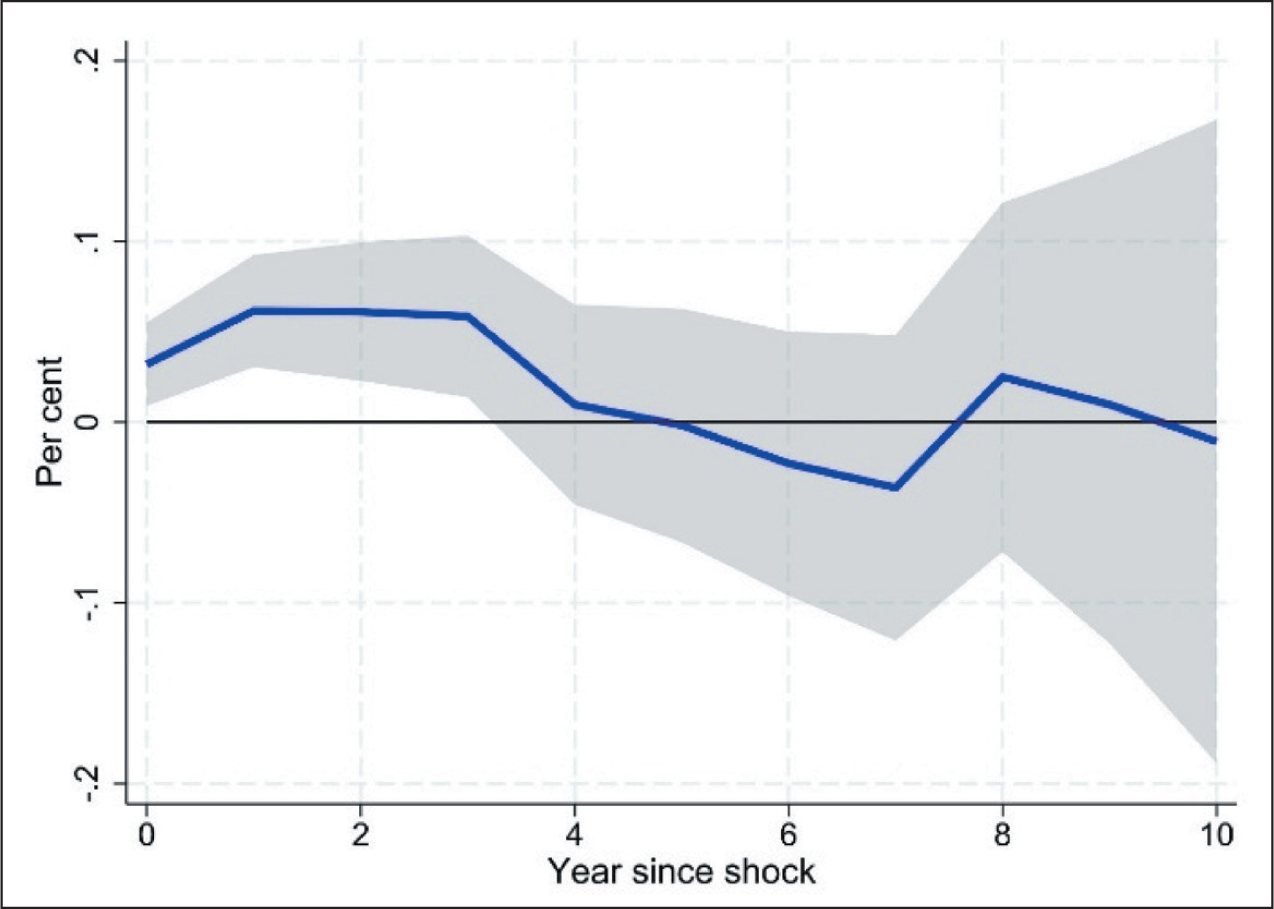
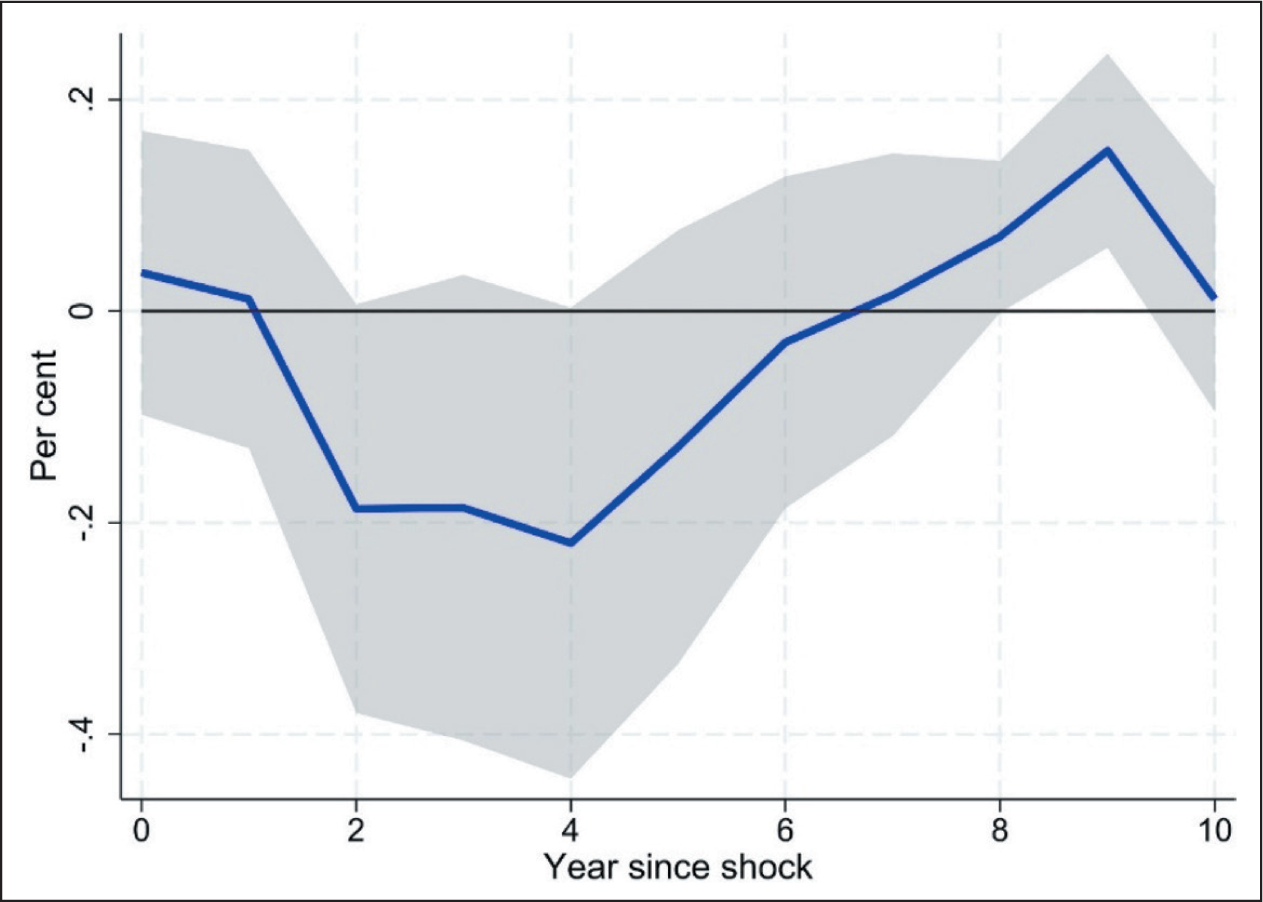
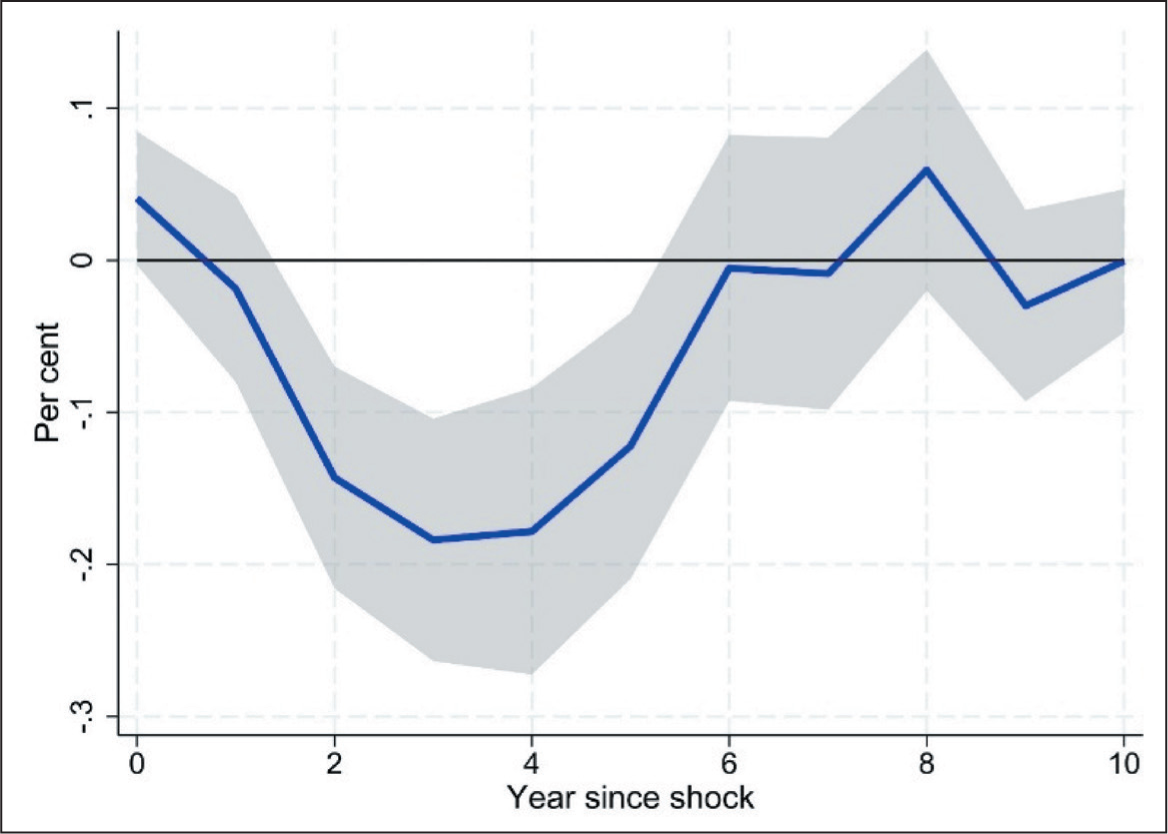
Figure 1 displays the response of total FX borrowing to a one-standard-deviation increase in leverage (debt-to-equity). At k = 0, the semi-elasticity is slightly negative (approximately −0.05 per cent), reflecting an initial pullback as firms with high leverage rely on existing financing. By k = 1, the response shifts towards zero, then rises, peaking around k = 4 at +0.20 per cent, before tapering off and turning negative by k = 9 (−0.40 per cent by k = 10). This hump-shaped pattern suggests that when domestic leverage tightens, firms initially exhaust their domestic credit or internal funds. With a lag of one to two years—the time required to establish offshore credit lines and hedging arrangements—they then turn to FX borrowing. As prolonged high leverage raises lenders’ risk assessments and hedging costs mount, firms eventually reduce their FX borrowing.
Response of FX Borrowing to Debt-to-equity Shocks, All Datasets
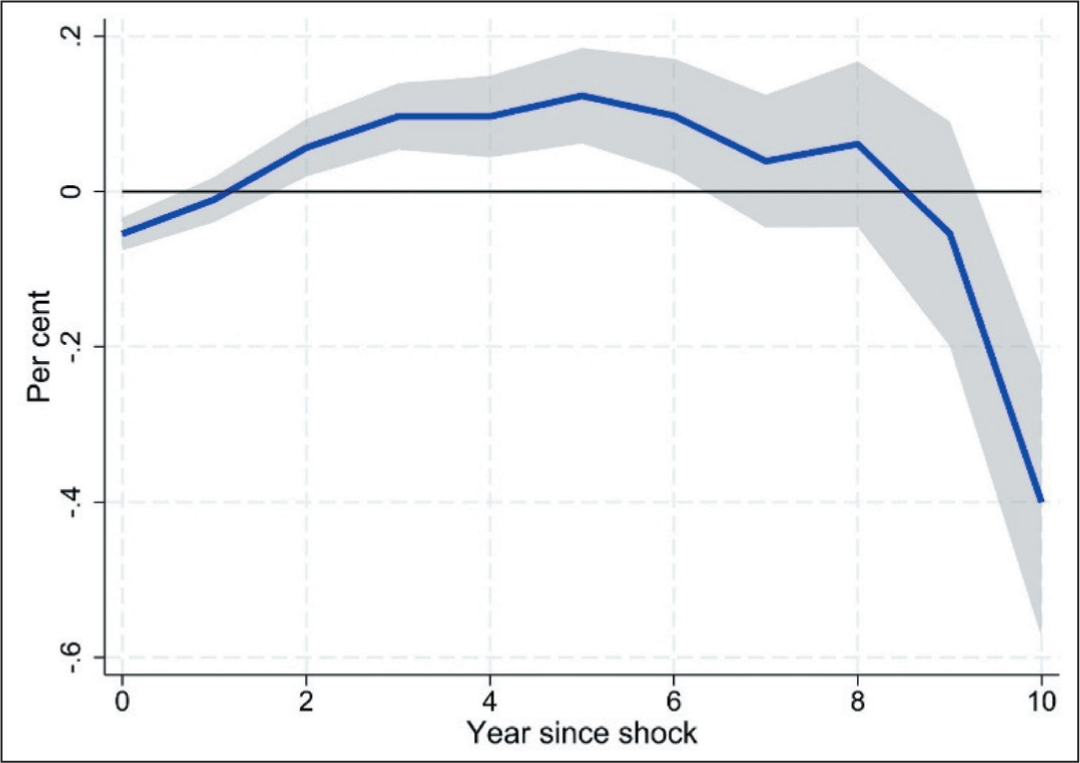
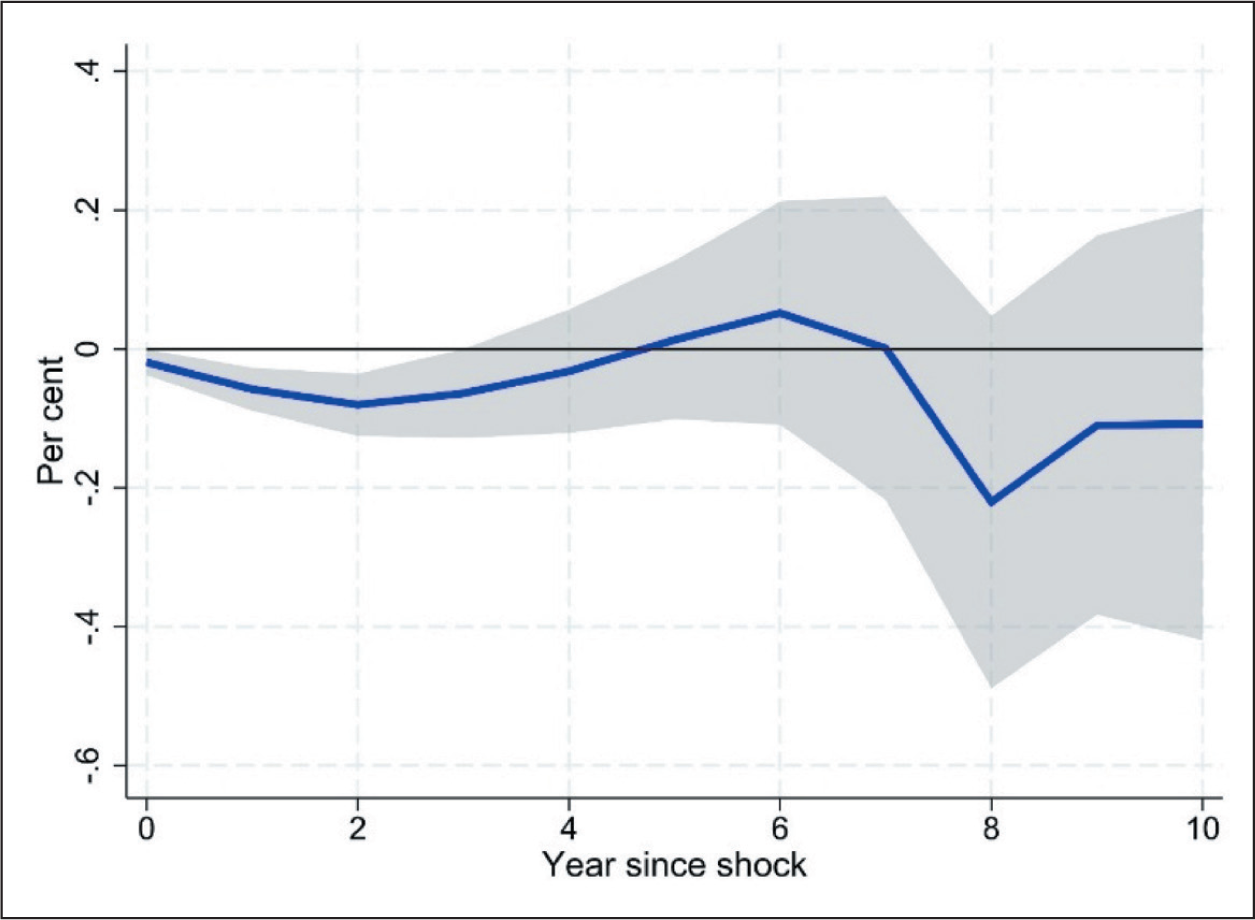
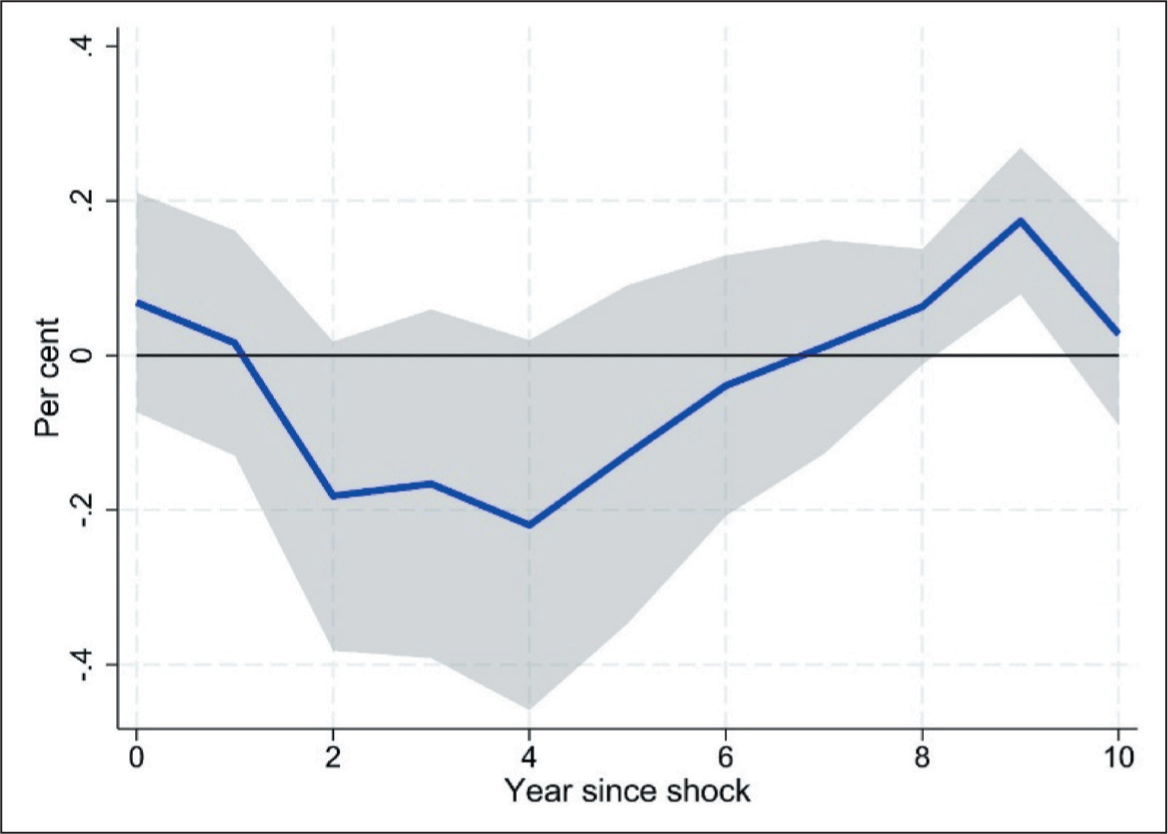
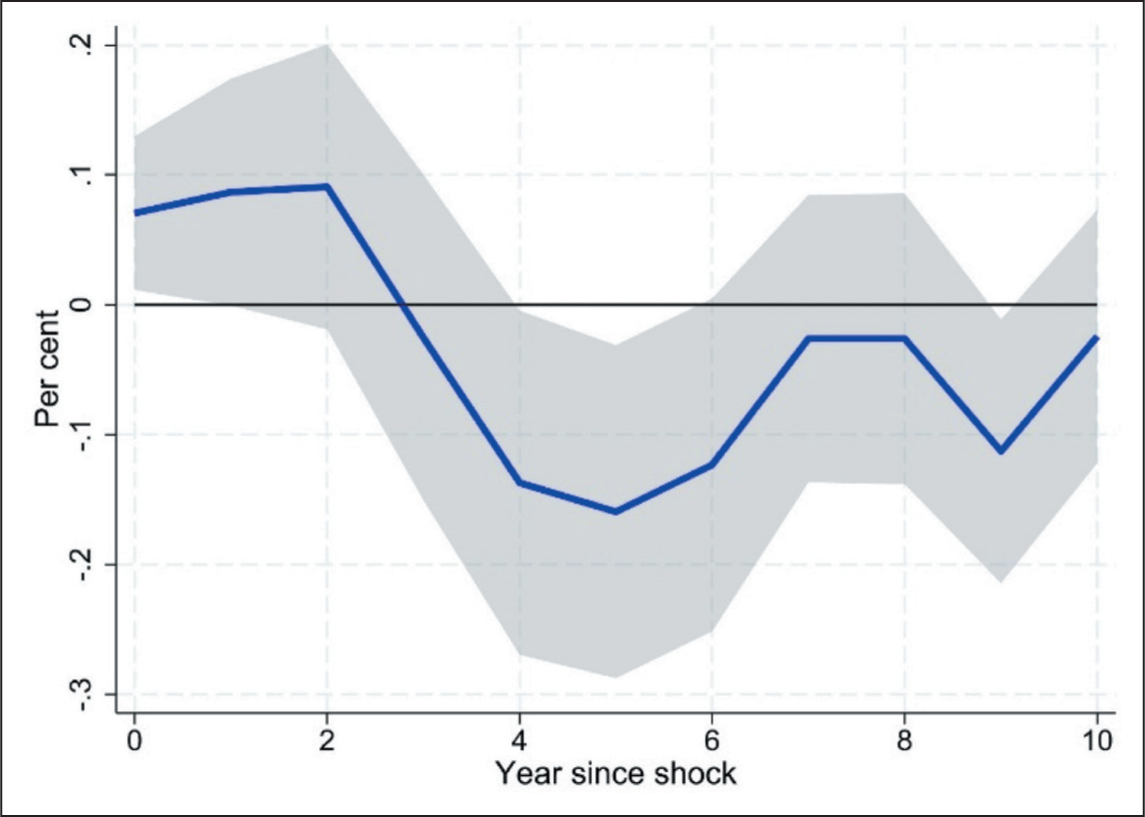
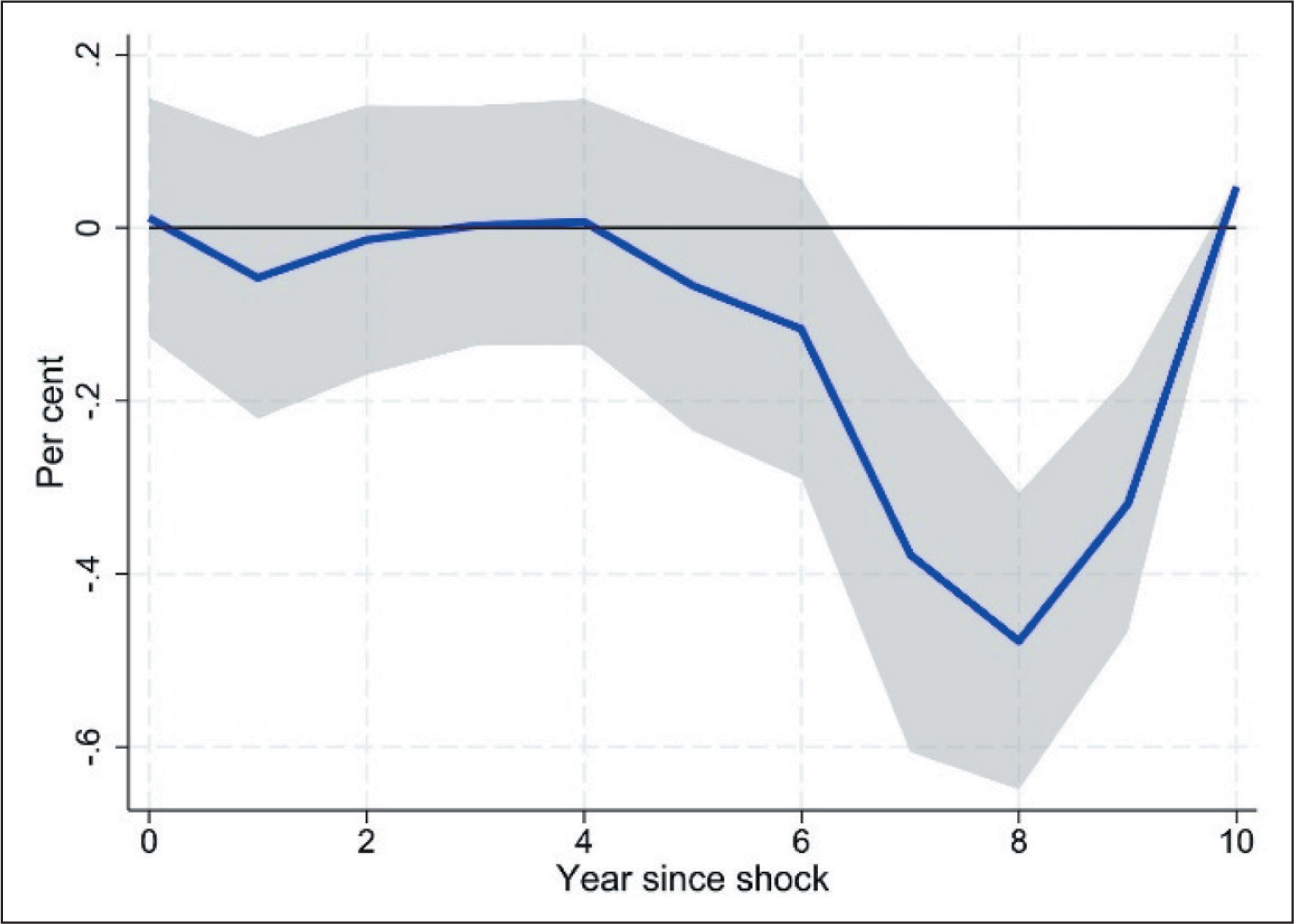
Figure 2 illustrates the response of the secured ECBs to the same leverage shock. The semi-elasticity is +0.20 per cent at k = 0, declines to zero by k = 2, turns negative between k = 3 and k = 5, hitting −0.30 per cent at k = 4, then becomes statistically insignificant. Firms initially pledge collateral to access secured credit in response to higher leverage, but as debt burdens intensify, lenders tighten collateral requirements and firms revert to domestic funding or unsecured borrowing.
Response of Secured ECB to Debt-to-equity Shocks, All Datasets
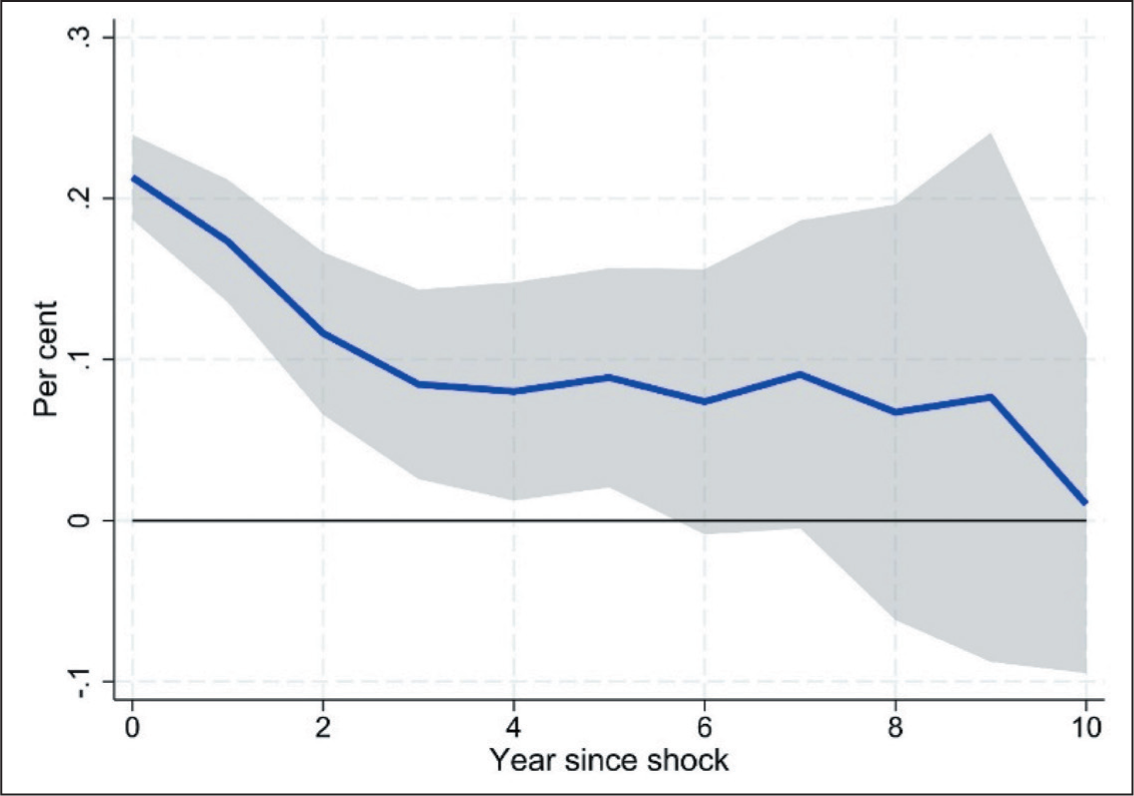
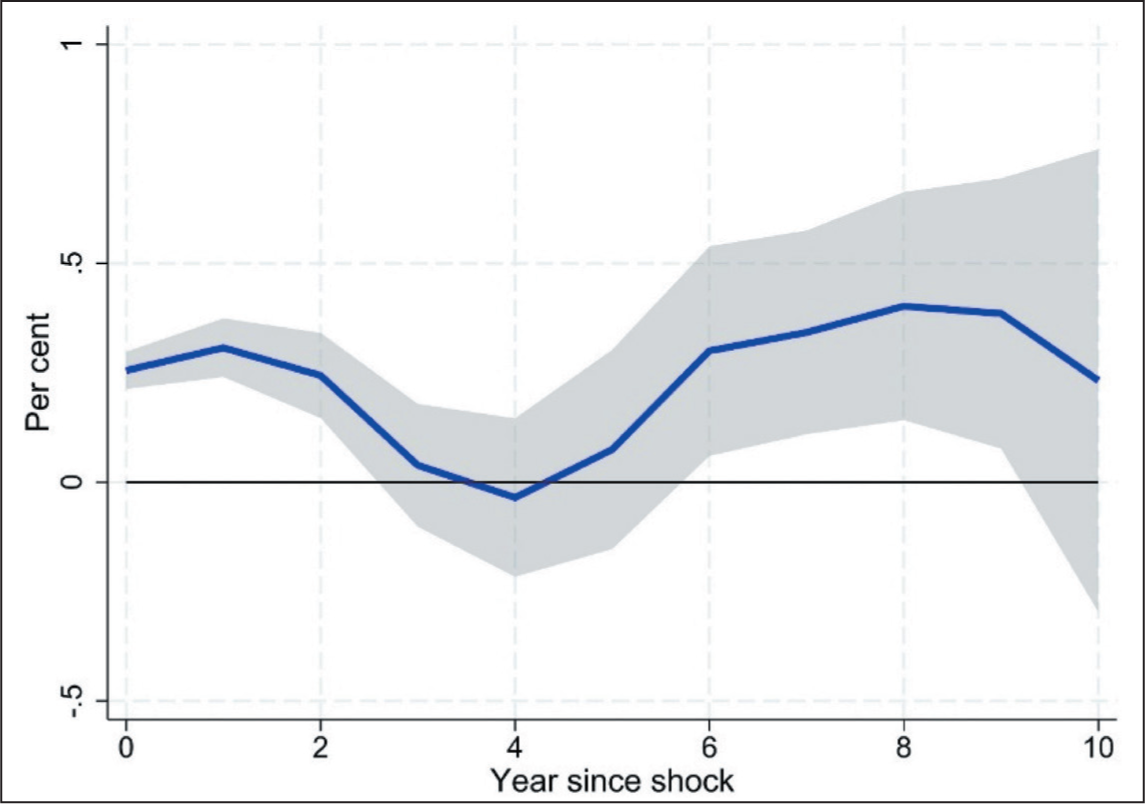
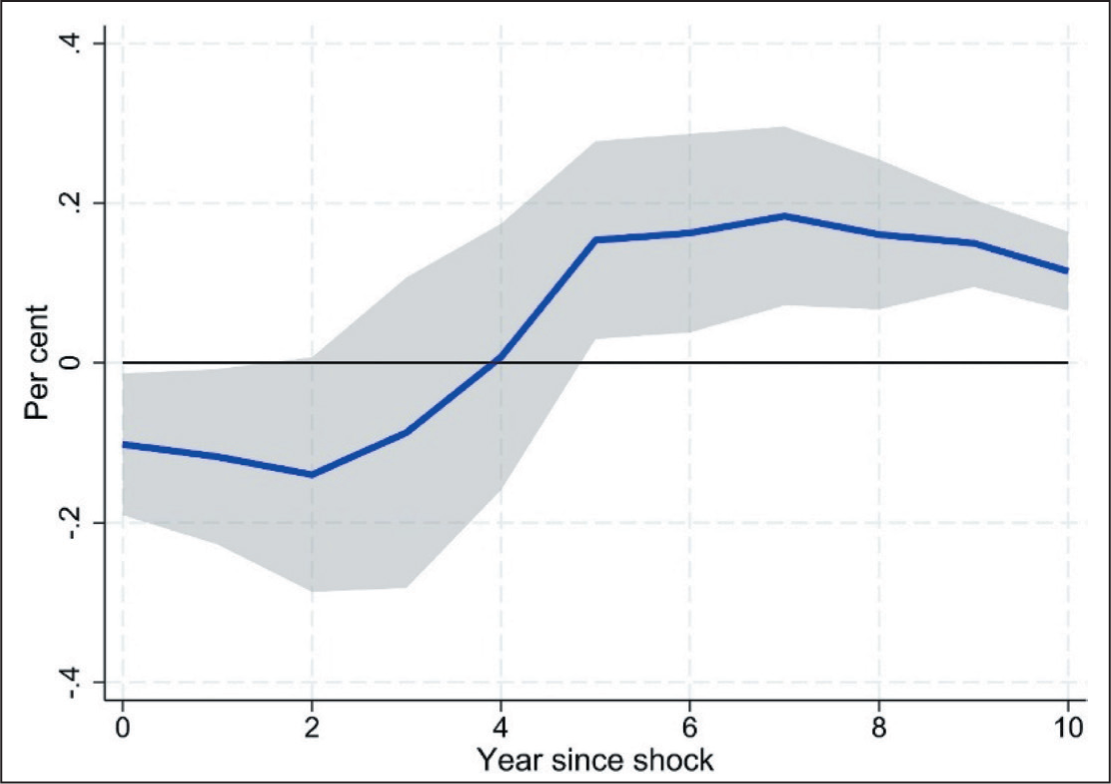
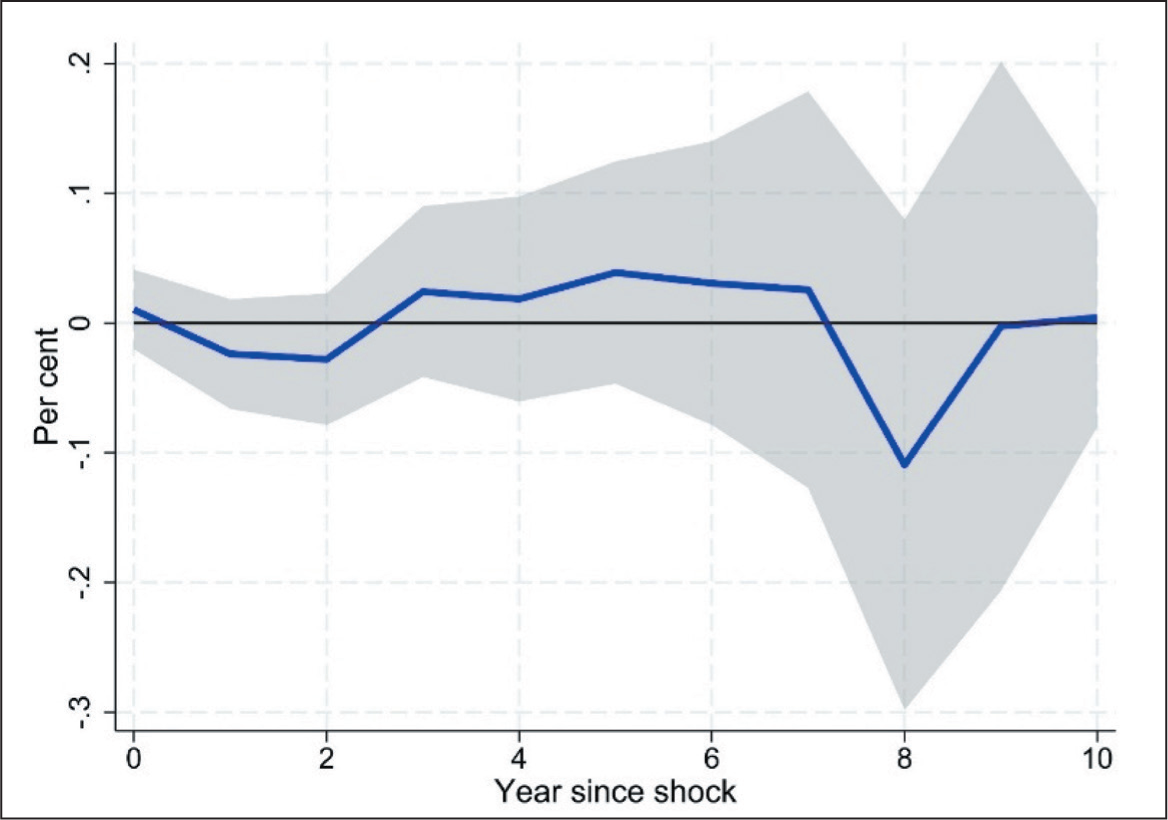
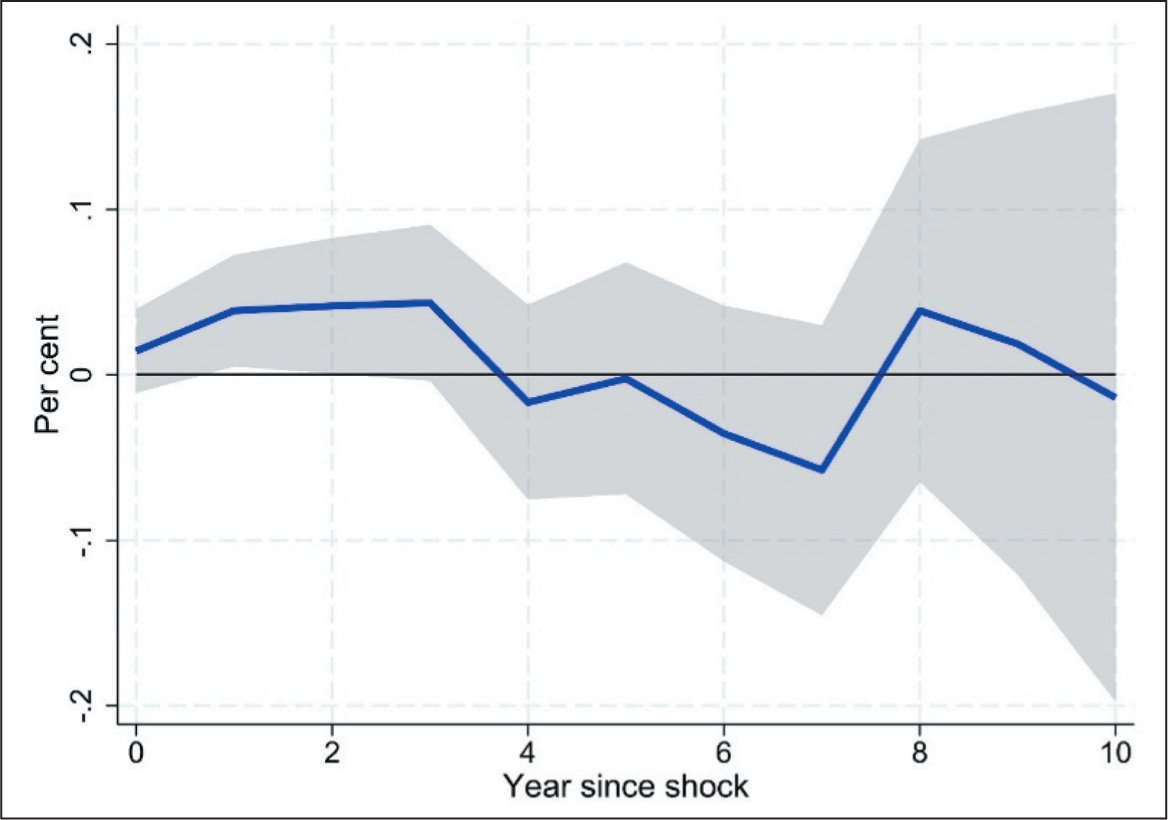
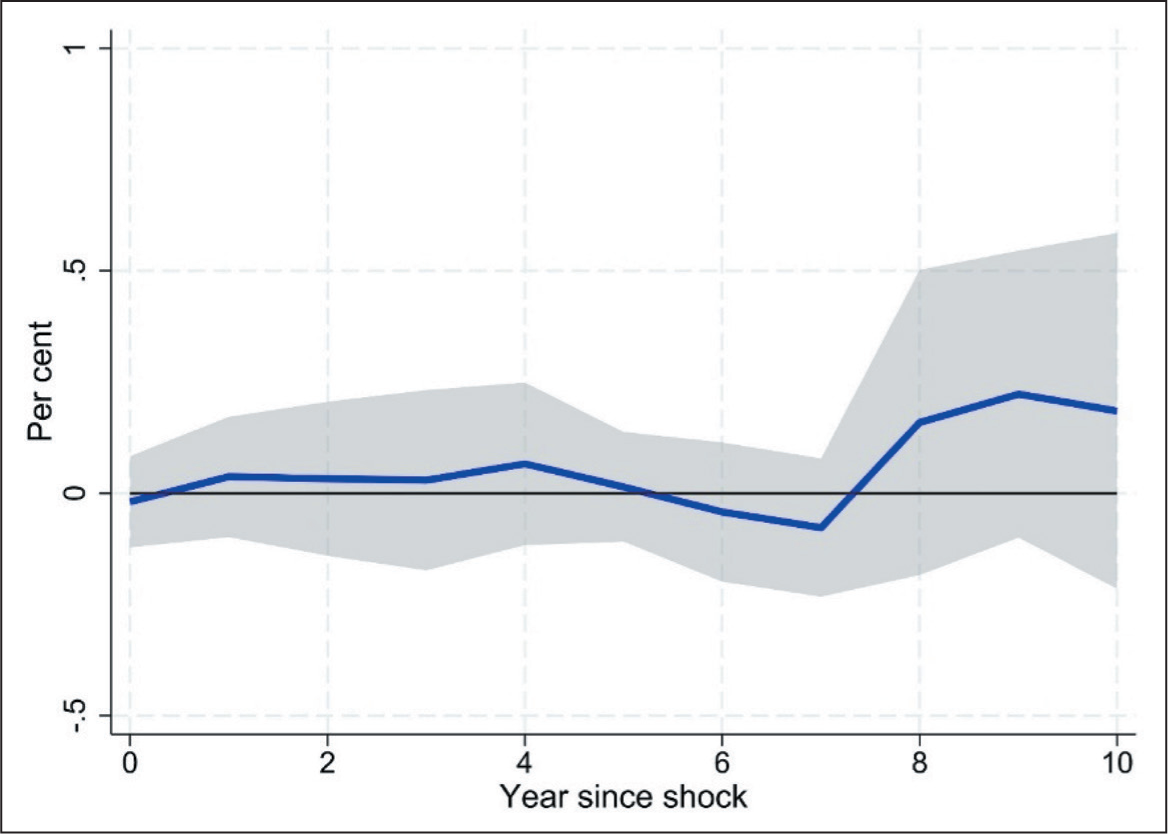
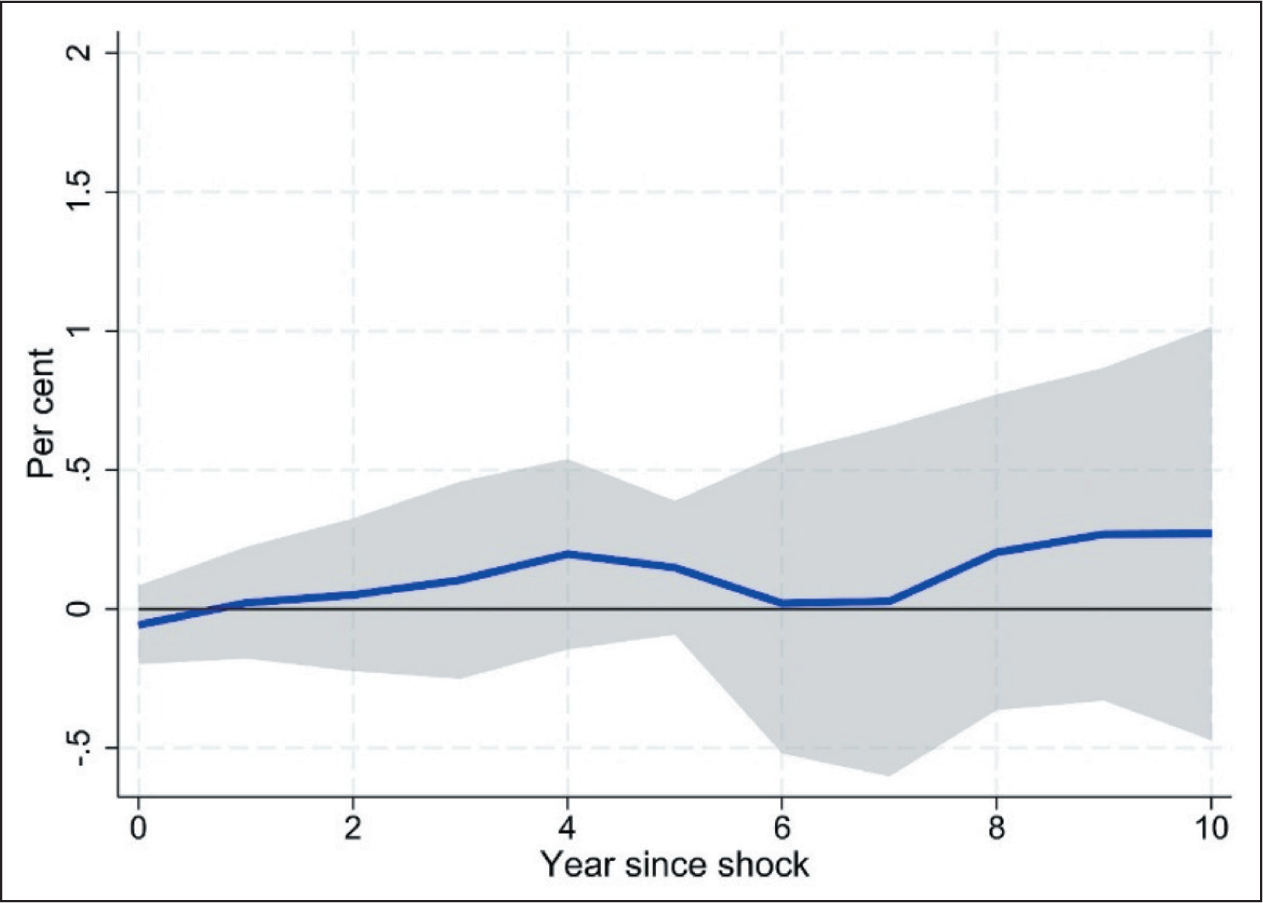
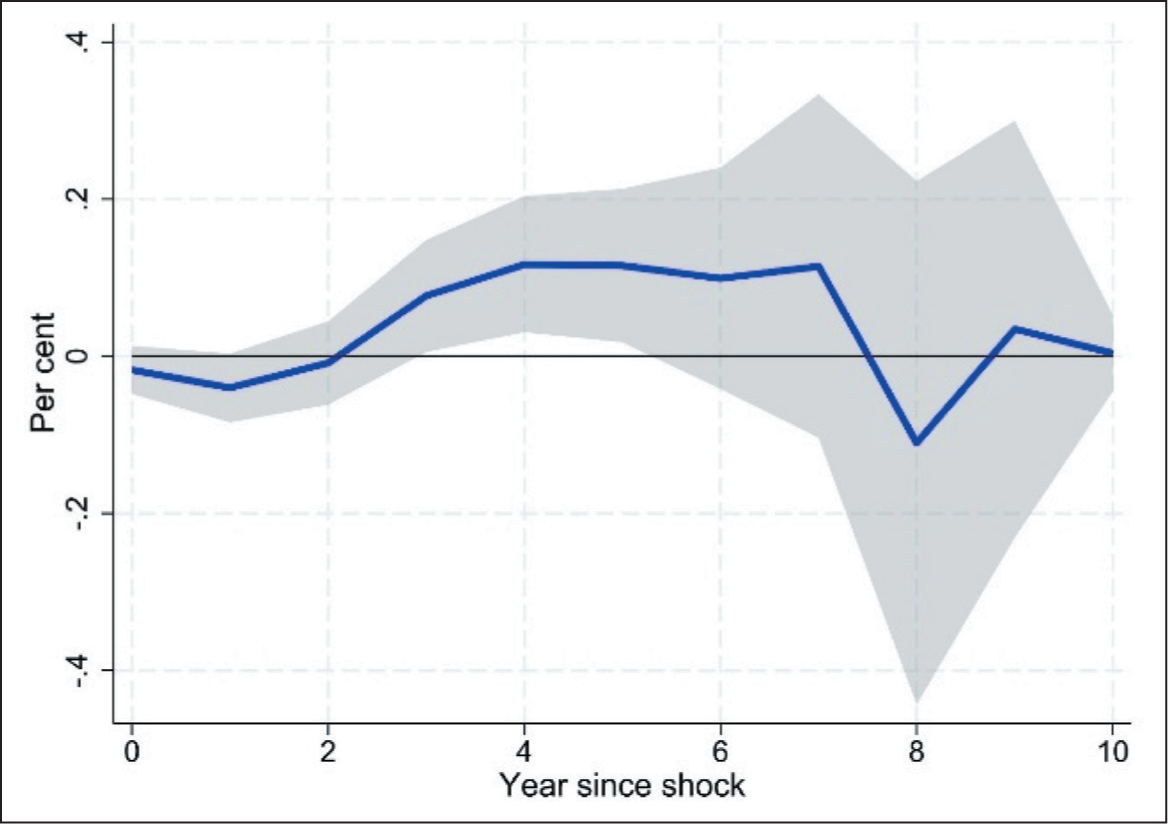
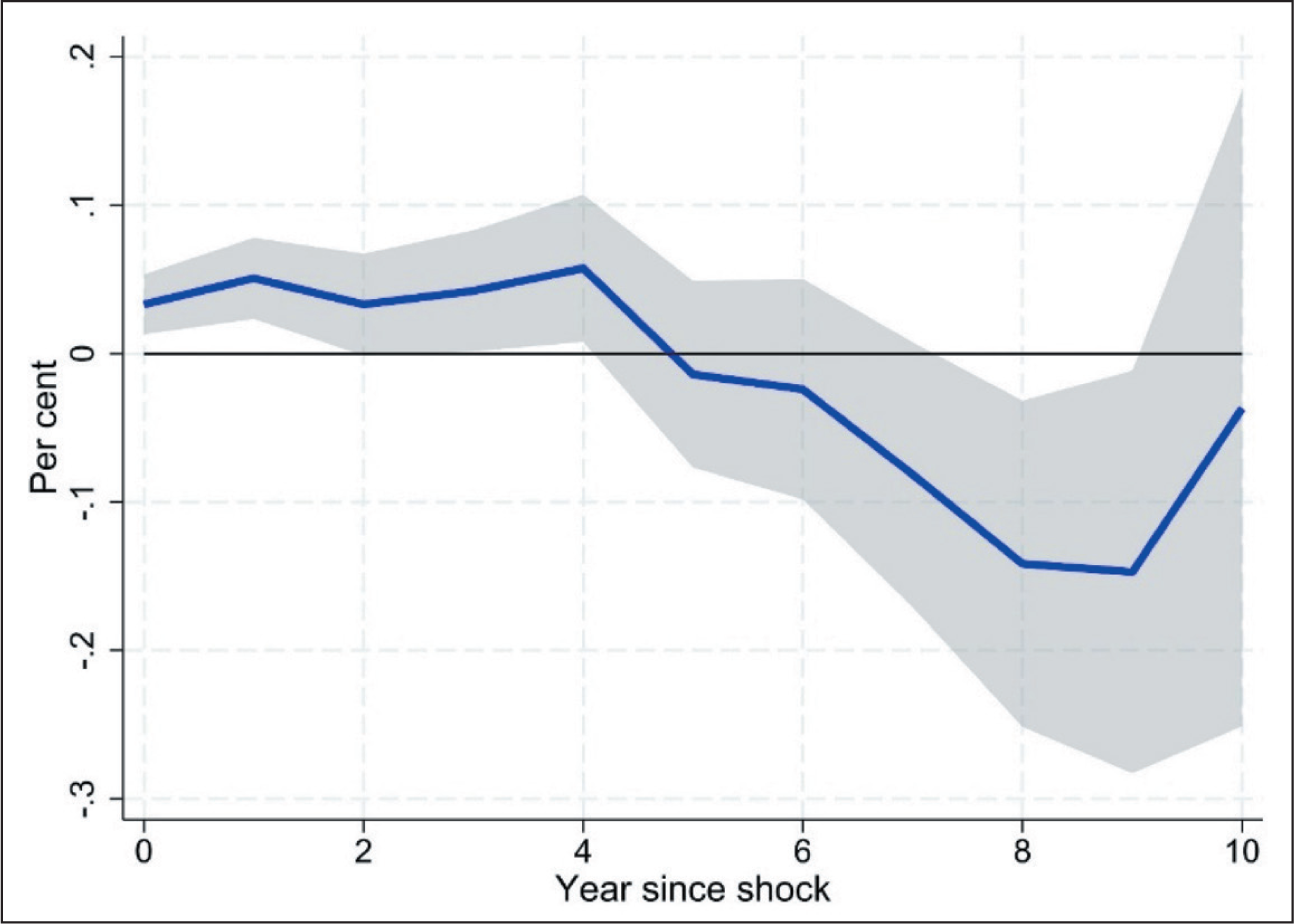
In contrast, Figure 3 illustrates unsecured ECBs’ response: +0.20 per cent at k = 0, dropping to +0.08 per cent by k = 2 and remaining near +0.08 per cent through k = 6, then fading. Unsecured FX borrowing rises briefly, but remains modest and short-lived. However, they quickly retrench as risk premiums rise.
Response of Unsecured ECB to Debt-to-equity Shocks, All Datasets
5.2.2 Ownership Splits
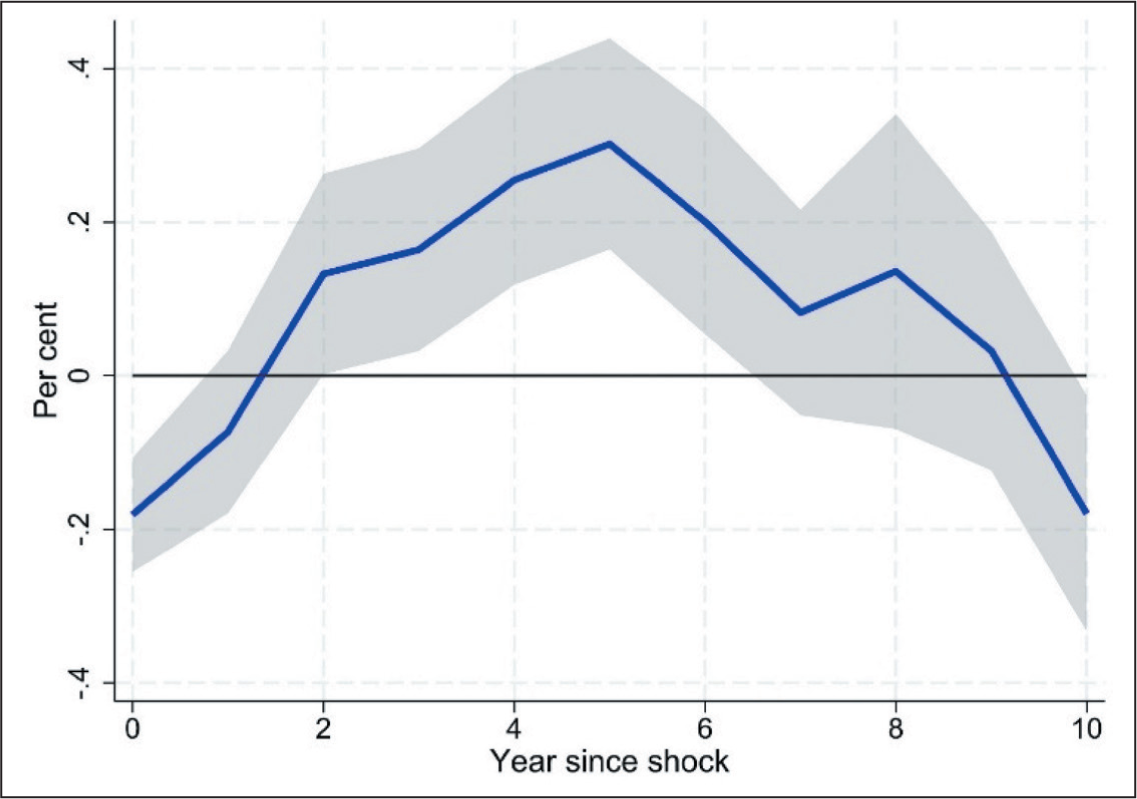
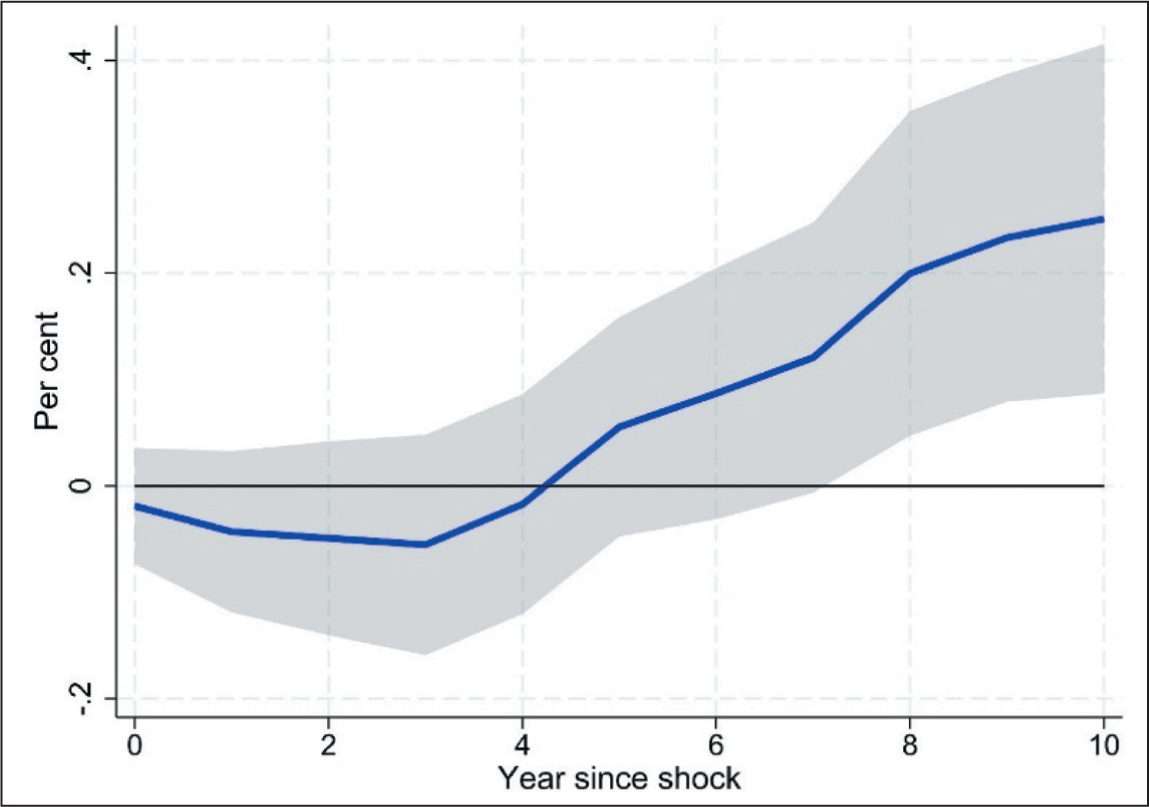
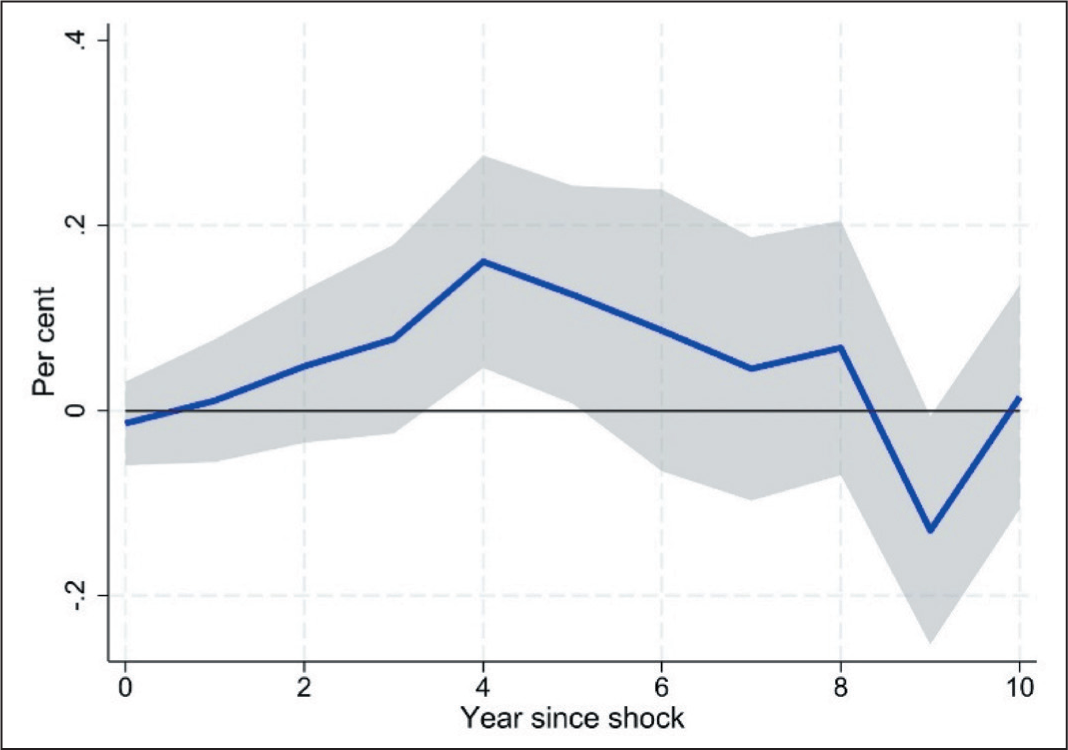
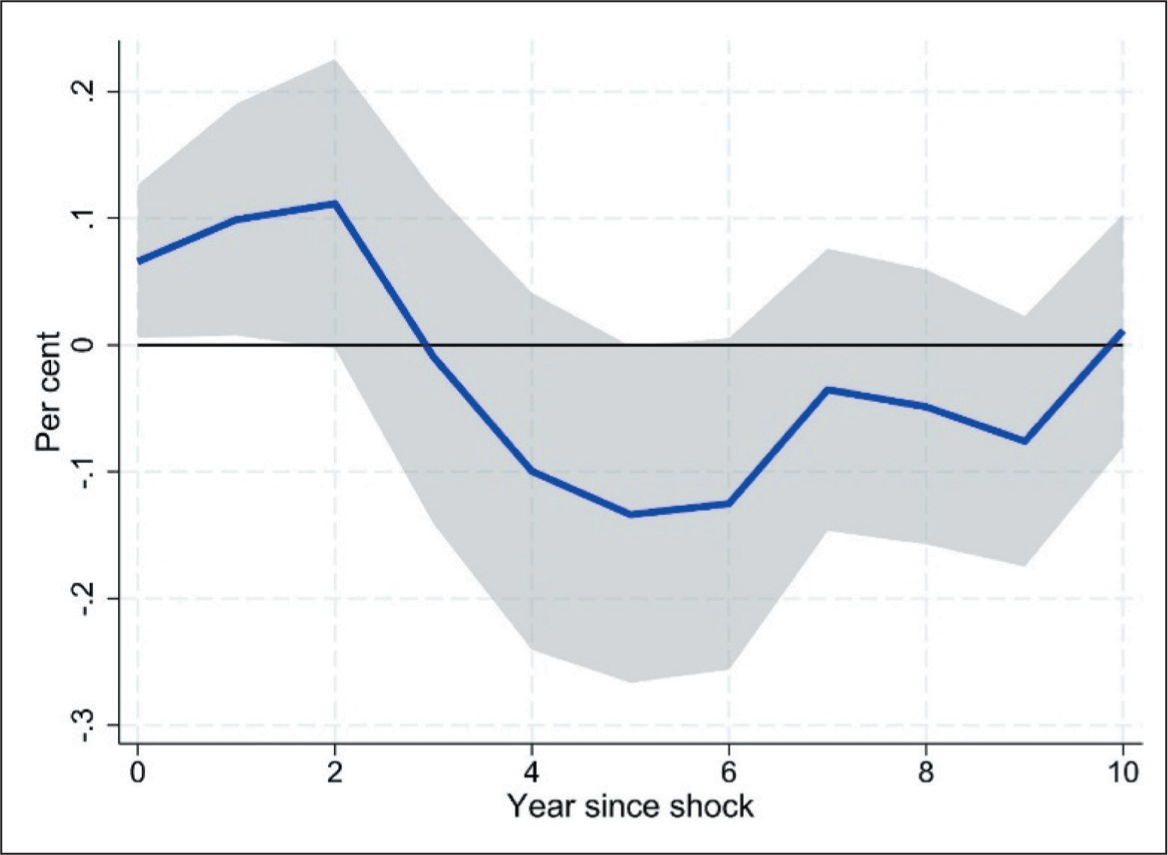
Figure 4 compares total FX borrowing responses for SOEs versus private firms. SOEs exhibit a negative response at k = 0 (−0.18 per cent), reflecting initial reliance on state-backed domestic funding when leverage jumps (BIS, 2023). From k = 1 to k = 5, SOEs’ FX borrowing rises, peaking at +0.30 per cent by k = 5, as domestic credit constraints intensify and implicit guarantees facilitate offshore access. Thereafter, concerns over currency mismatch and rollover costs prompt a retrenchment. Private firms, on the other hand, exhibit a much more muted sensitivity, potentially reflecting a more immediate reaction function. This result corroborates the result in the headline section that SOEs are more sensitive to exogenous shocks.
Response of FX Borrowing to Debt-to-equity Shocks, Government Firms
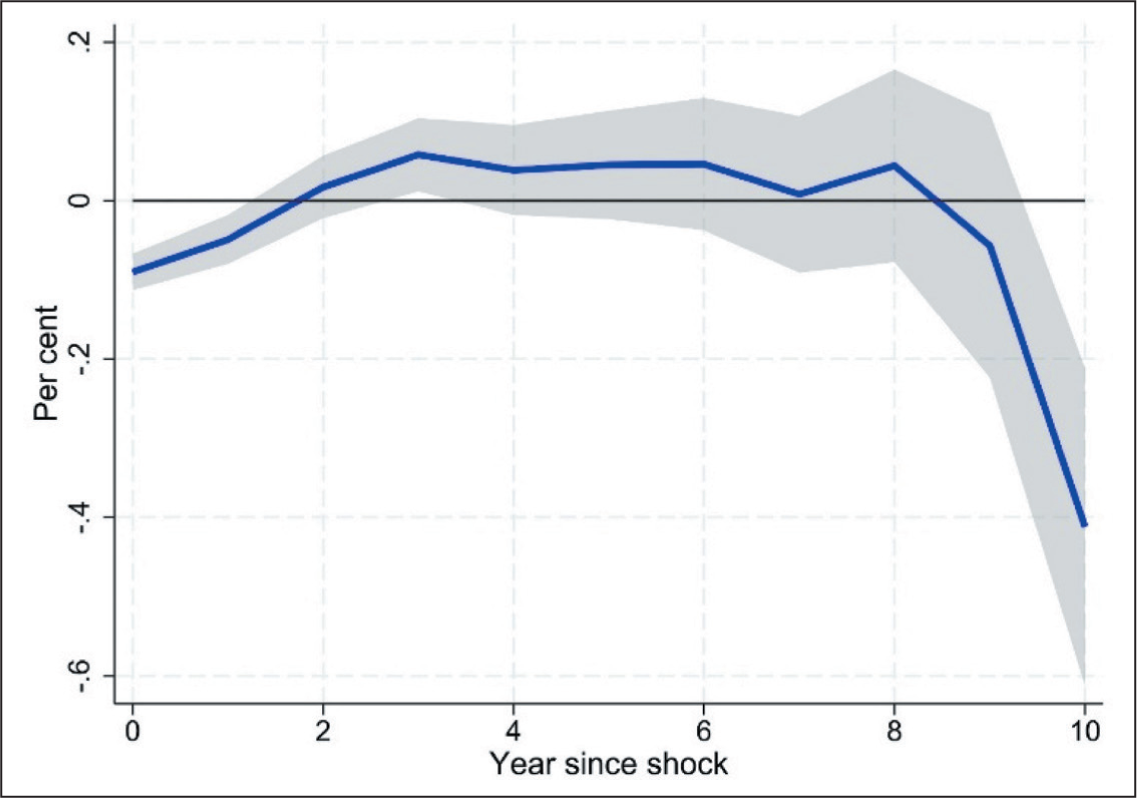
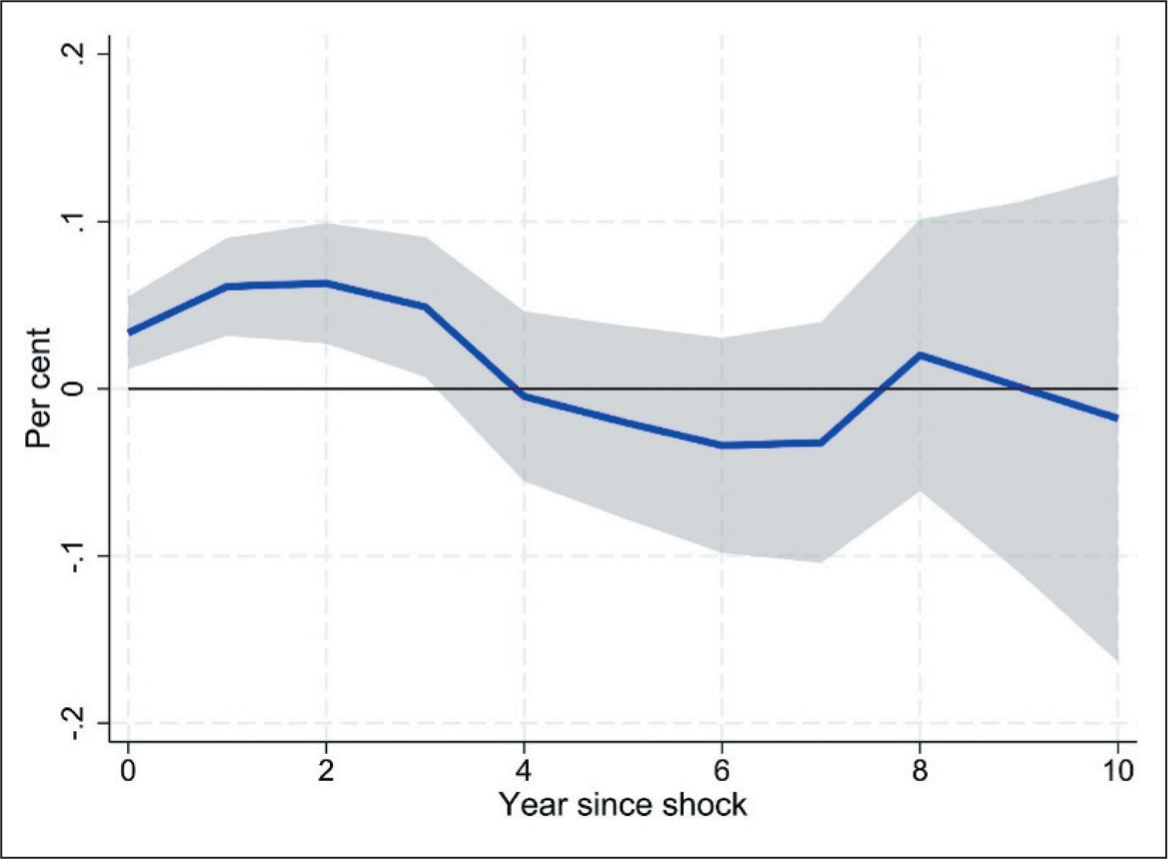
Private firms, however, cut FX borrowing immediately upon a leverage shock, most sharply between k= 0 and k = 1—partially recover through k = 4, then resume a downward trajectory, ending at −0.41 per cent by k = 10 (Figure 5). This reflects lenders’ immediate re-pricing of risk premia for private firms with elevated leverage and private firms’ preference for domestic financing when possible.
Response of FX Borrowing to Debt-to-equity Shocks, Private Firms
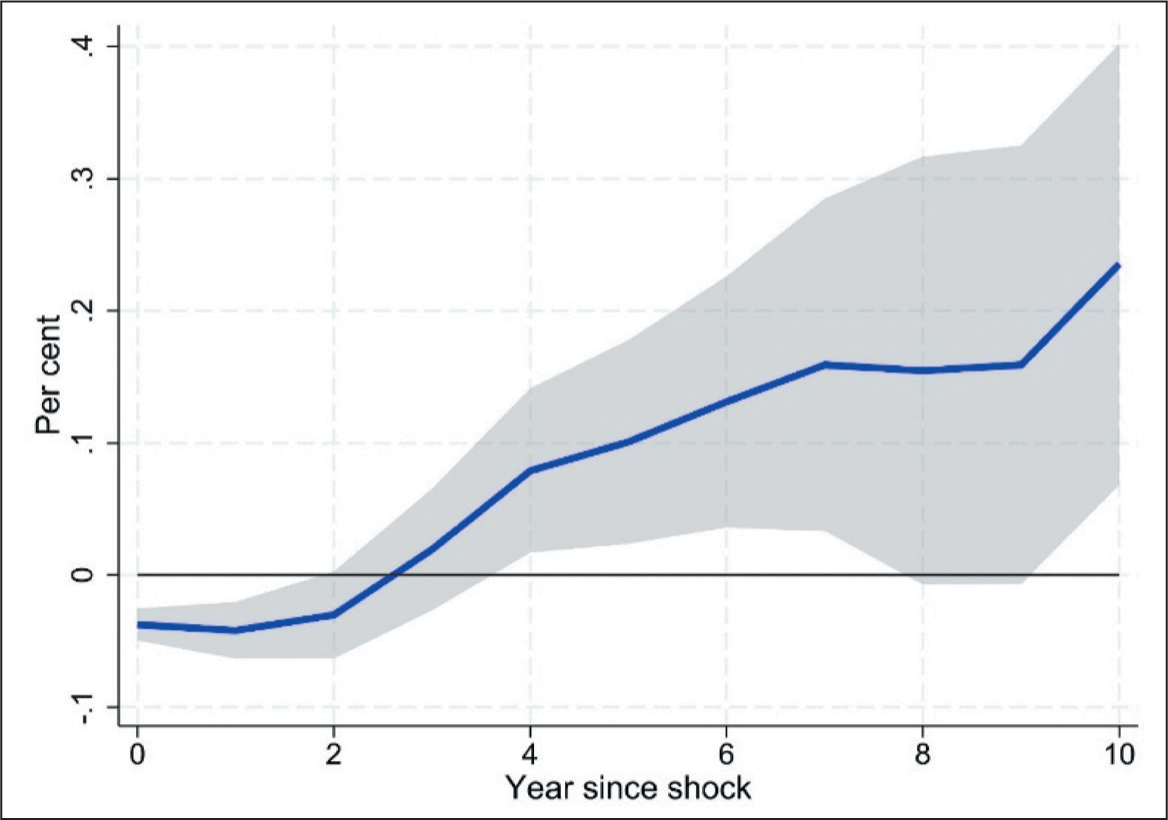
Figures 6 and 7 show secured ECB responses: SOEs pull back secured borrowing through k = 3 (−0.15 per cent at k = 3), then ramp up, peaking at +0.80 per cent by k = 6, reflecting lenders’ eased collateral scrutiny once leverage stabilises. Private firms see an immediate +0.25 per cent increase at k = 0, tapering to zero by k = 4, then rising again to +0.40 per cent by k = 8. Lenders appear willing to extend secured credit to private firms promptly after a leverage shock, —conditional on collateral values, before re-assessing risk and retreating modestly.
Response of Secured ECB to Debt-to-equity Shocks, Government Firms
Response of Secured ECB to Debt-to-equity Shocks, Private Firms
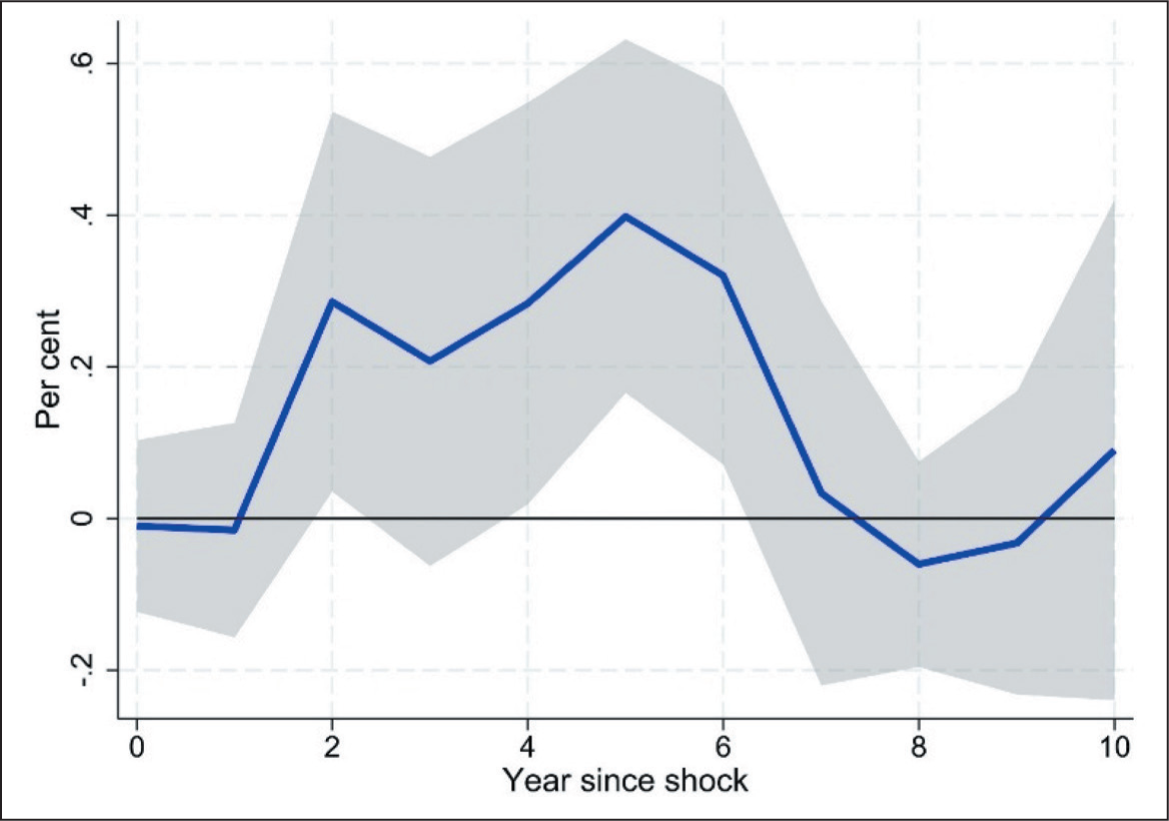
Figures 8 and 9 illustrate unsecured ECB responses: SOEs’ unsecured borrowing is insignificant until k = 2, then rises, peaking at +0.40 per cent at k = 4, before declining yet remaining positive through k = 6. Private firms show +0.10 per cent increases between k = 0 and k = 2, then return to zero. This underscores that SOEs can access unsecured FX lines with a lag, leveraging implicit guarantees, whereas private firms enjoy only modest, short-lived unsecured access following a leverage shock.
Response of Unsecured ECB to Debt-to-equity Shocks, Government Firms
Response of Unsecured ECB to Debt-to-equity Shocks, Private Firms

5.2.3 Insights on Leverage Effects
Secured borrowing dominates: Firms, particularly private ones, initially rely on secured ECBs when domestic leverage rises, signalling collateral values and lenders’ willingness.
Limited unsecured access: Unsecured ECBs exhibit only slight, transient upticks, highlighting lenders’ risk aversion for uncollateralised credit.
SOE moral hazard: SOEs delay unsecured FX borrowing until domestic constraints intensify, leveraging implicit guarantees to access offshore markets even at high leverage.
Private conservative adjustment: Private firms immediately retreat from FX borrowing, reflecting stricter lender scrutiny and a preference for domestic funding.
The hump-shaped pattern is consistent with a non-monotonic relation between leverage and risk management, with borrowing rising when debt capacity improves and retrenching when expected distress costs dominate (Purnanandam, 2008). It also accords with evidence that hedging supports higher debt capacity and the tax benefit of debt (Graham & Rogers, 2002).
5.3 Export Shocks: Collateralisation Requirements and Delayed FX Uptake
5.3.1 All Firms
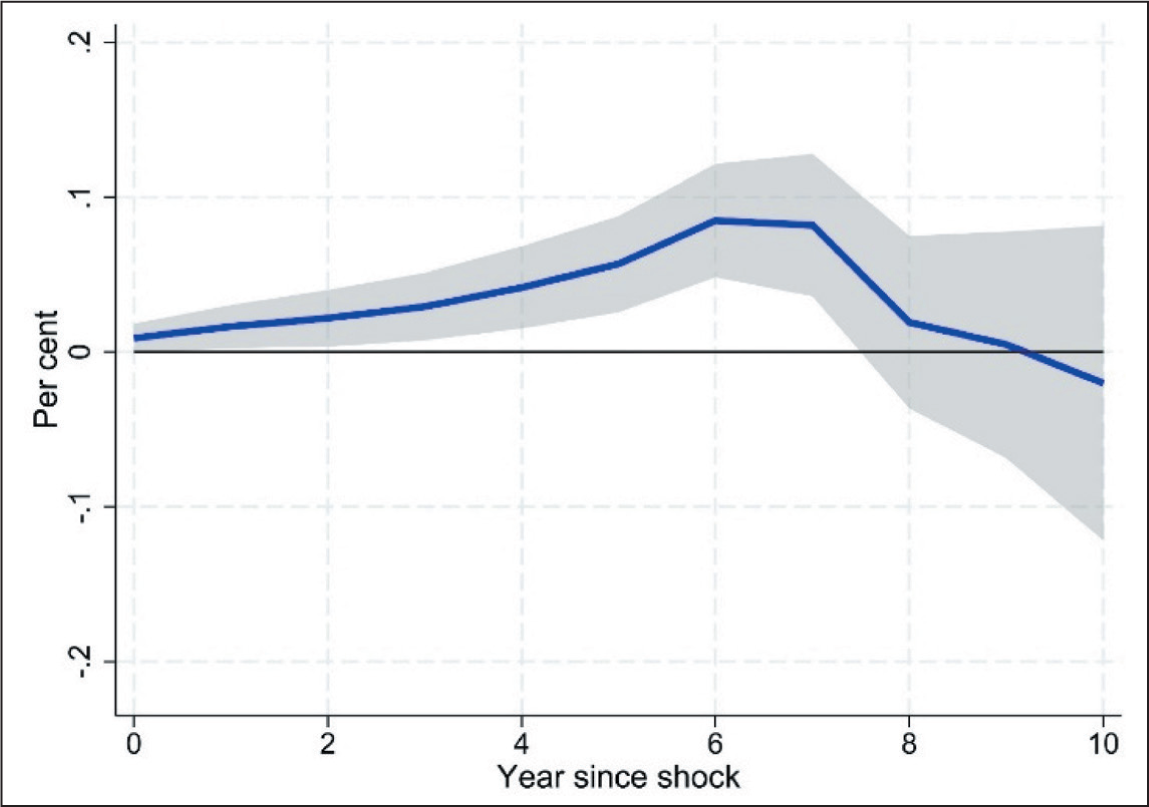
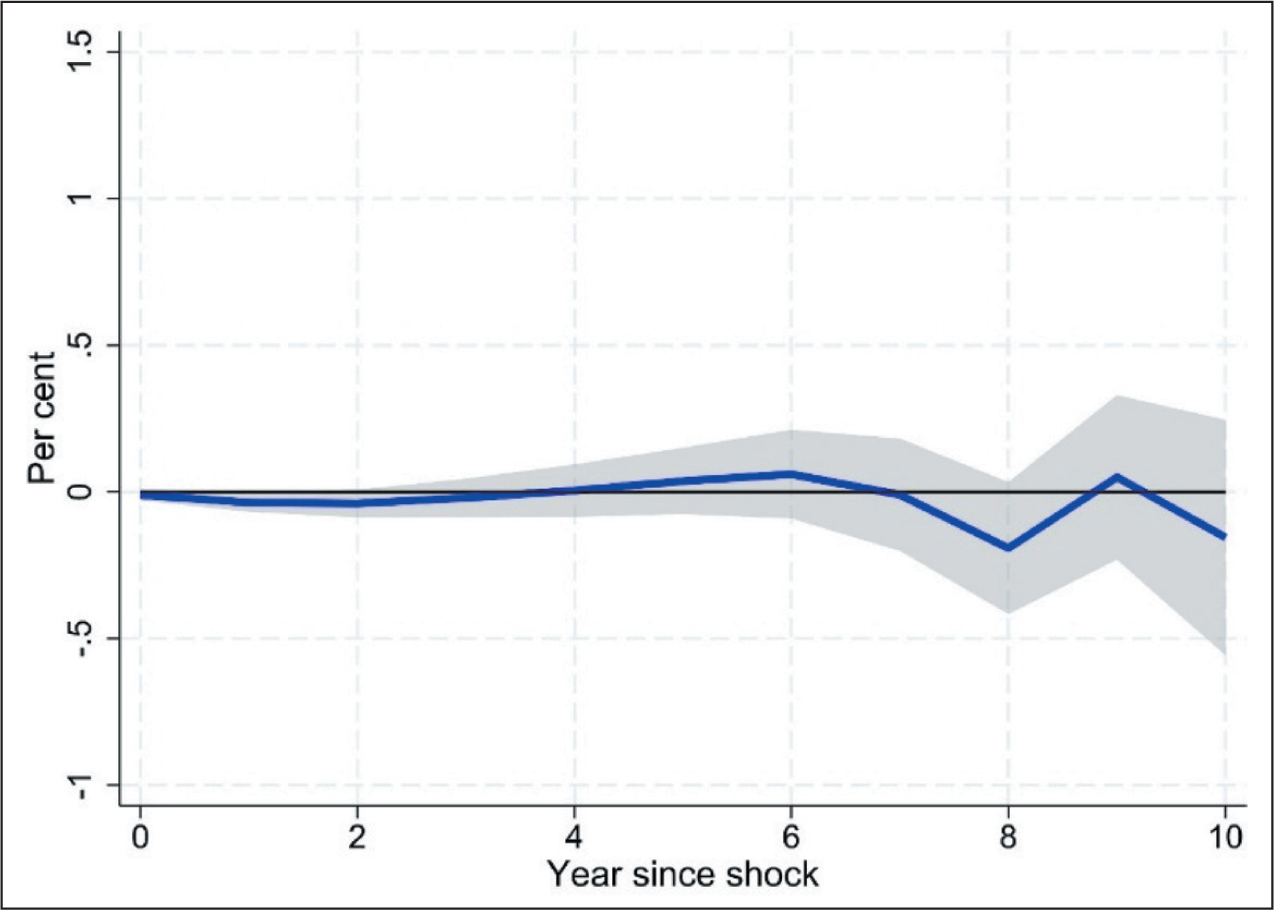
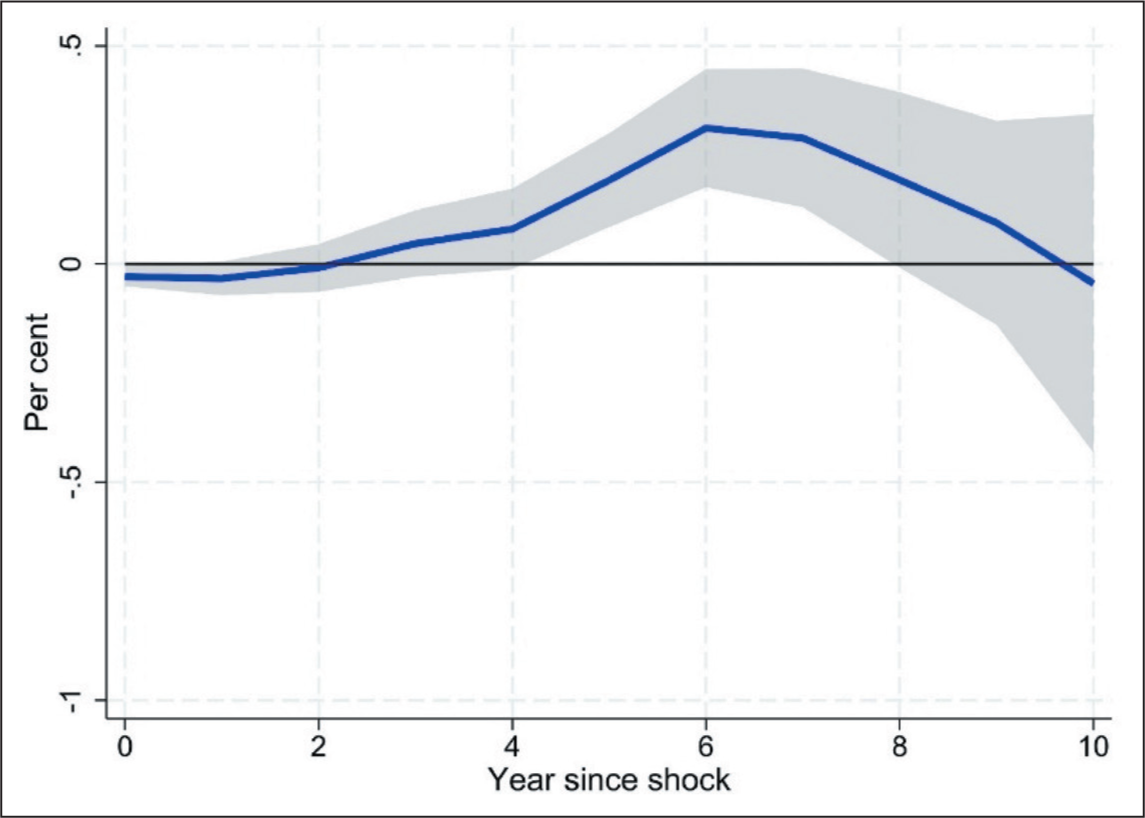
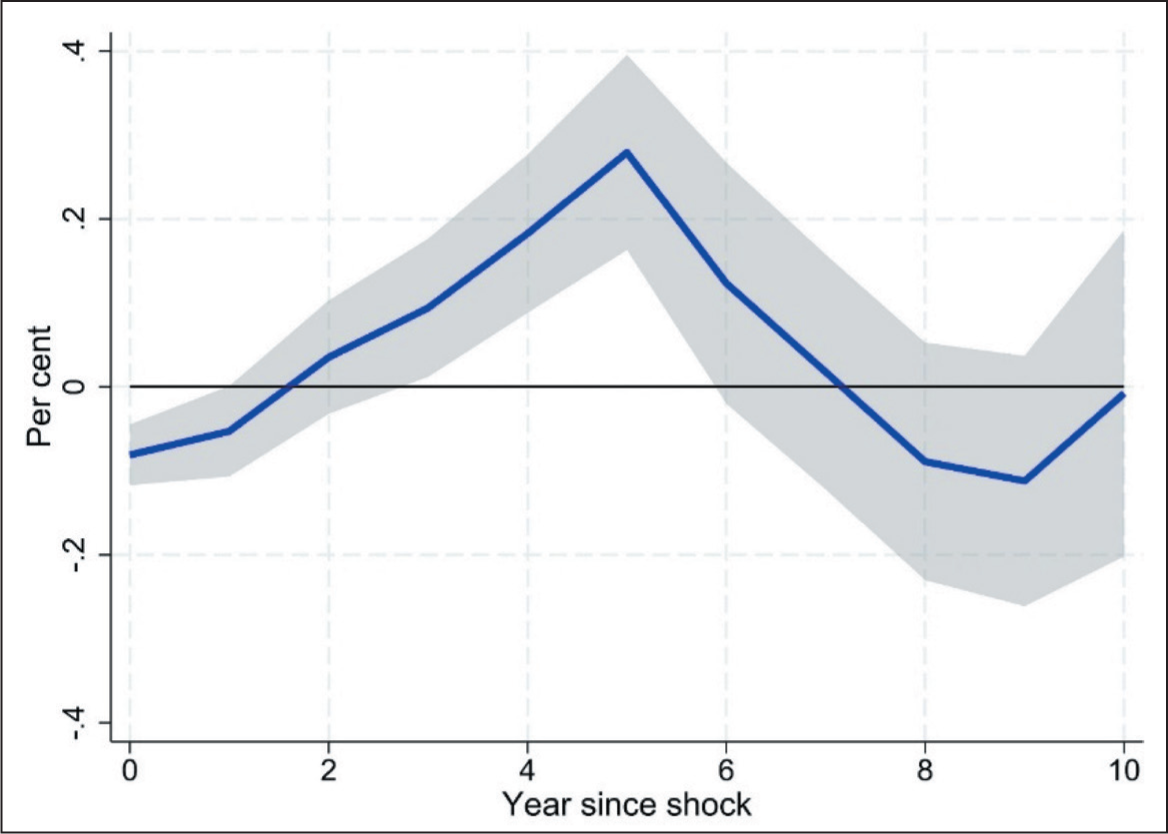
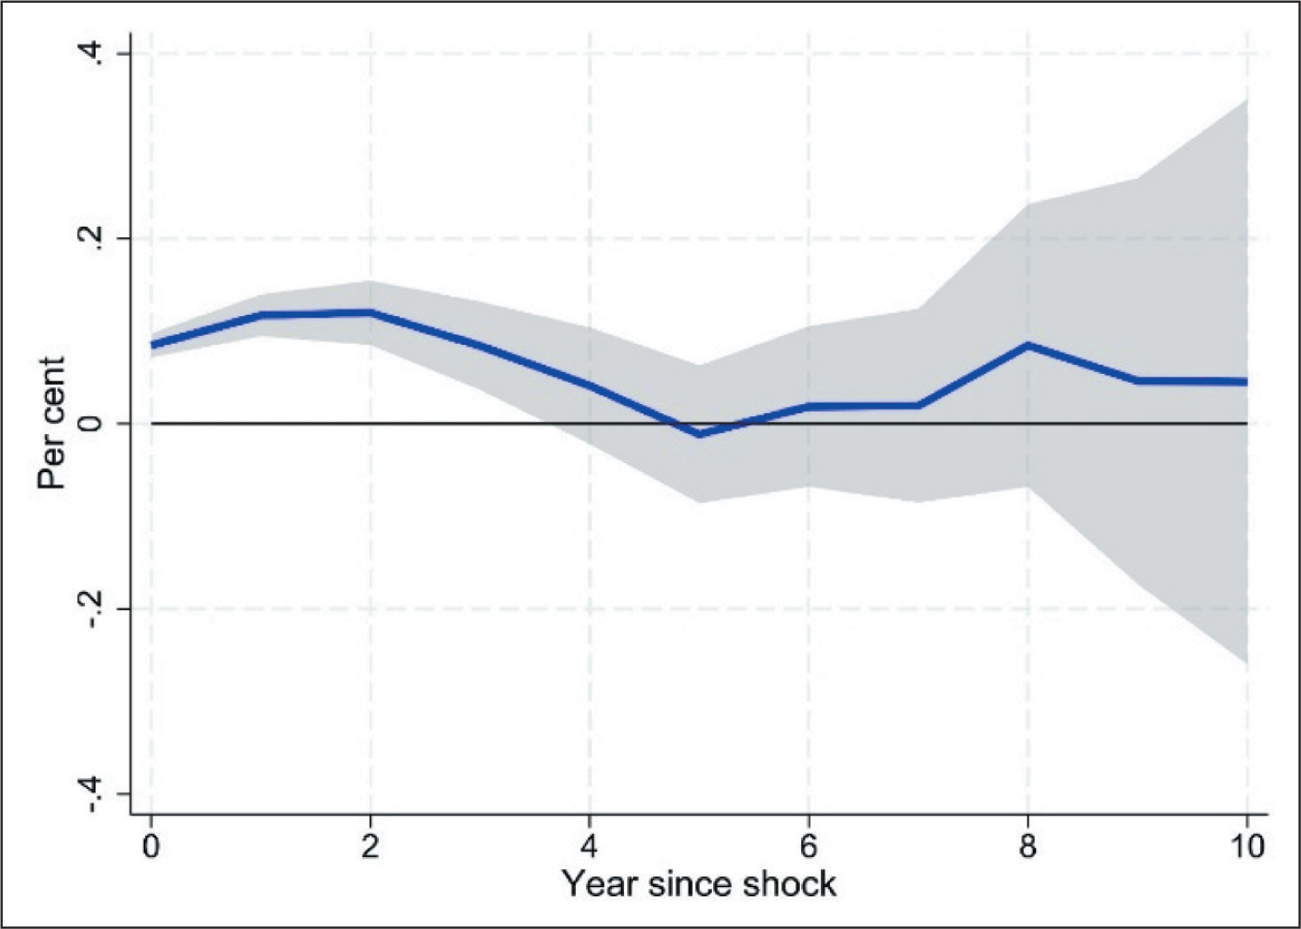
Figure 10 plots total FX borrowing responses to a one-standard-deviation export shock. FX borrowing shows no significant change through k = 3, then gradually rises, peaking at +0.09 per cent by k = 6, before fading to zero by k = 8. This suggests that firms initially use internal funds or domestic credit to support export growth. As export revenues materialise and collateral values improve, they tap FX markets around k = 4 to k = 6.
Response of FX Borrowing to Export Shocks, All Datasets
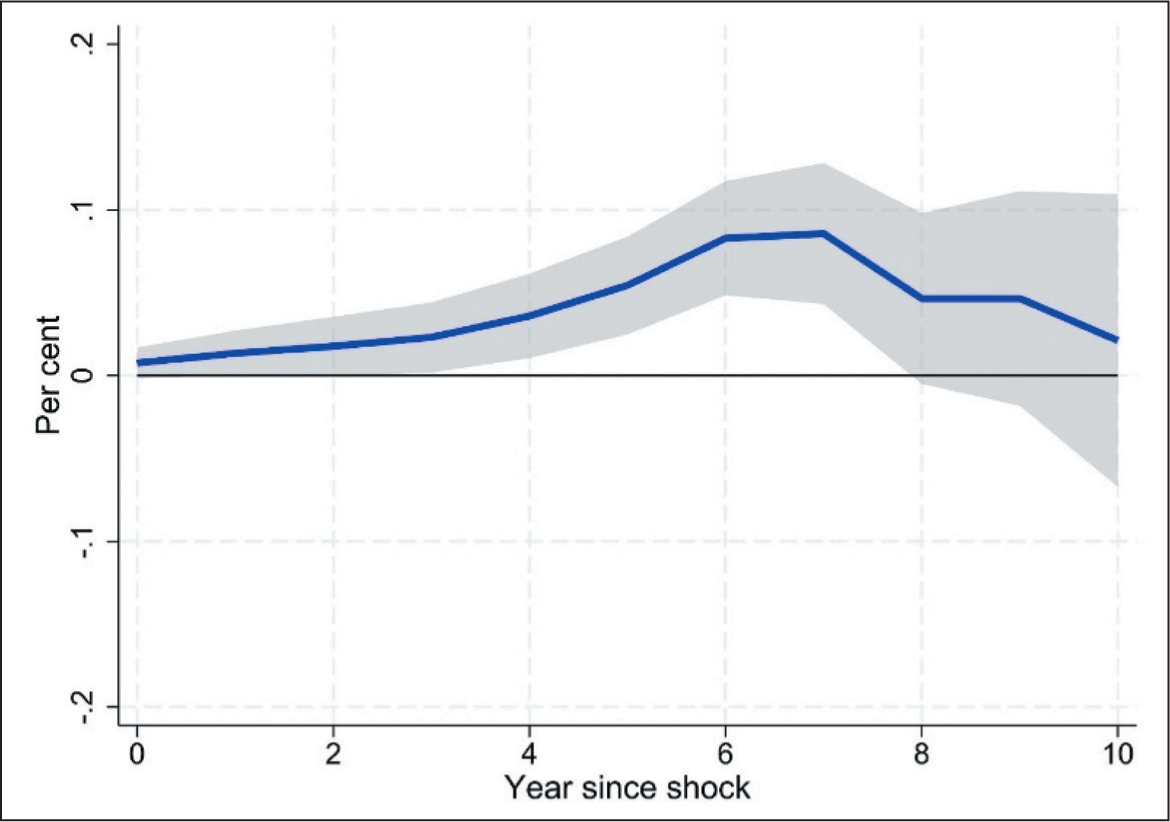
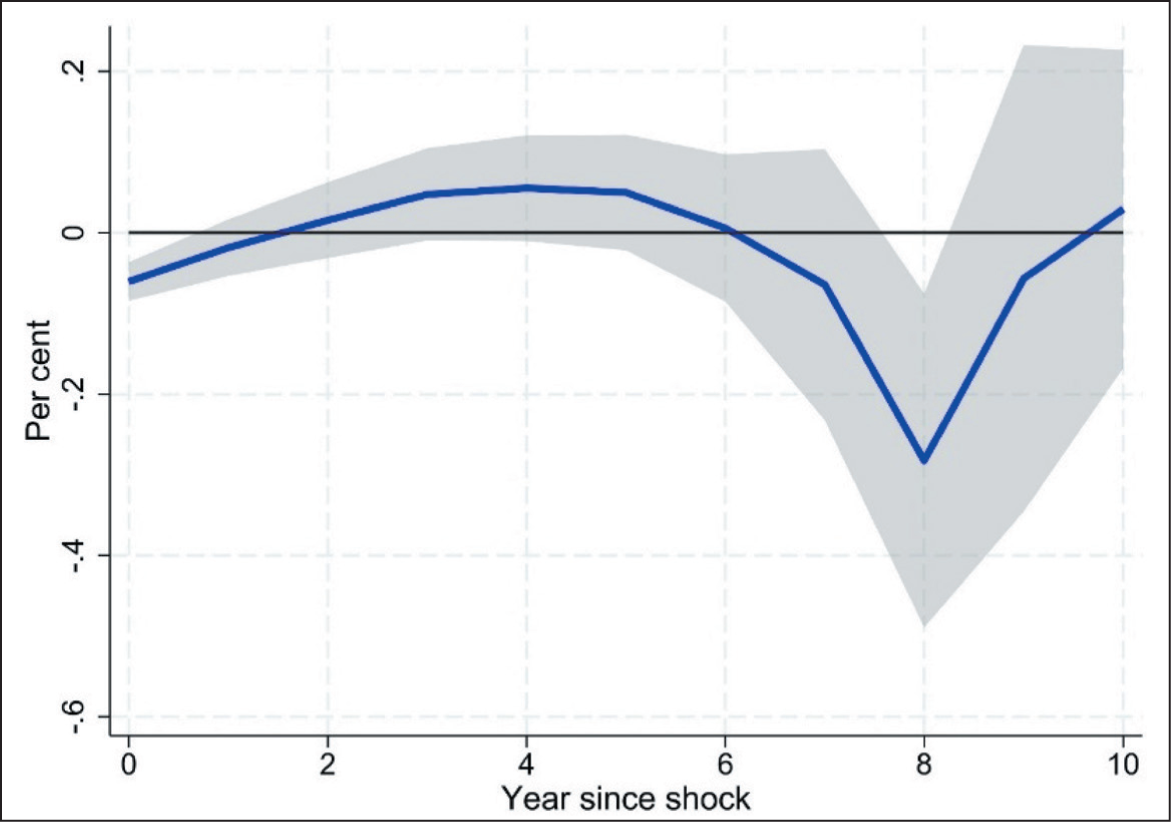
Figure 11 shows secured ECBs’ response: insignificant through k = 4, then positive from k = 5 to k = 8, peaking at +0.15 per cent at k = 7, consistent with lenders requiring sustained export performance before extending collateralised credit. Figure 12 displays unsecured ECBs, showing insignificance across all horizons, which indicates that lenders prefer collateralised lending for export-driven financing.
Response of Secured ECB to Export Shocks, All Datasets
Response of Unsecured ECB to Export Shocks, All Datasets
5.3.2 Ownership Splits
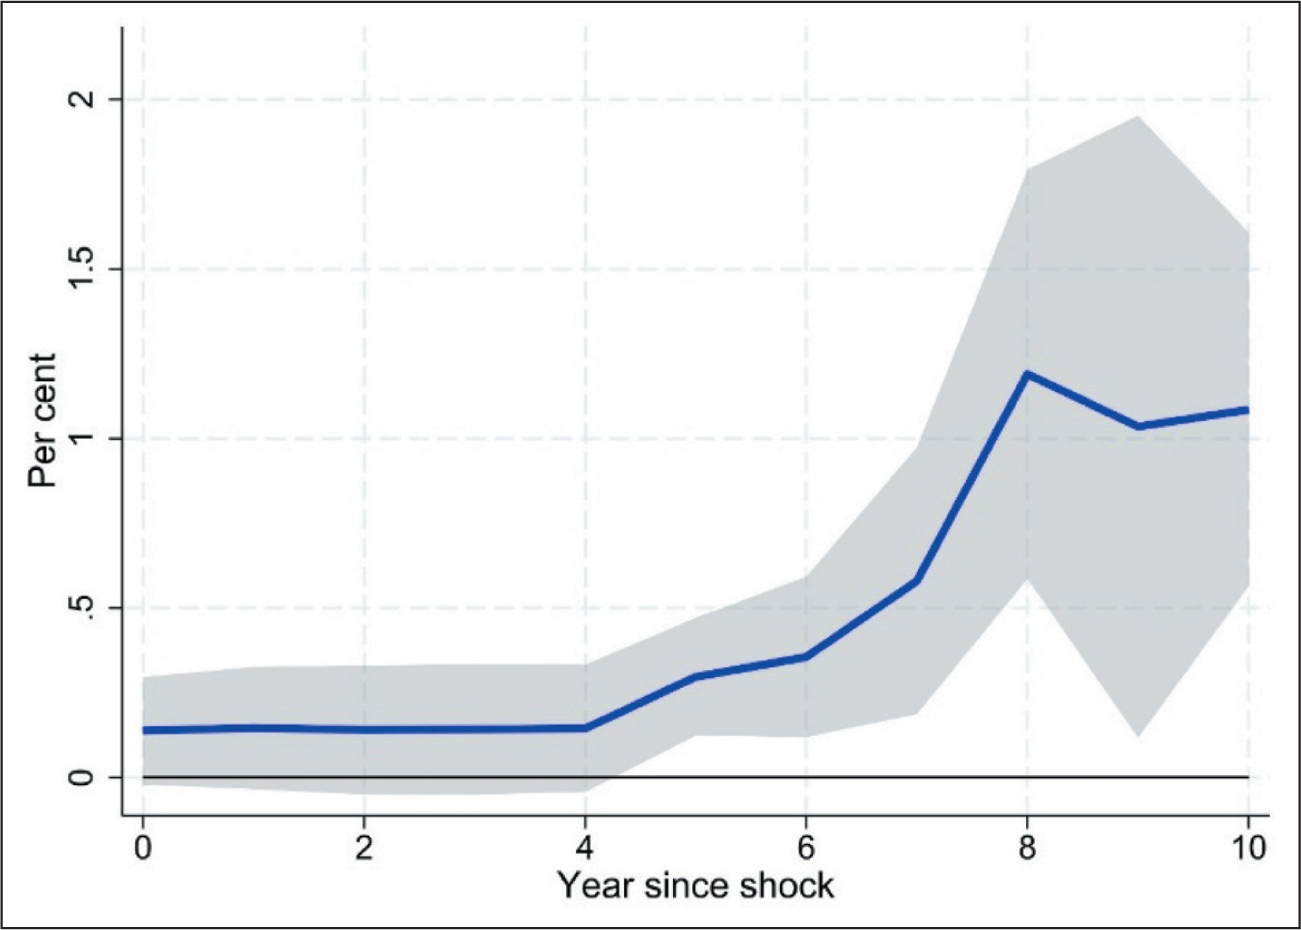
Figures 13 and 14 compare SOEs with private firms in terms of total FX borrowing. Private firms’ FX borrowing climbs almost monotonically, reaching +0.90 per cent by k = 7, then tapering. SOEs exhibit no significant response until k = 7, when FX borrowing rises to +0.25 per cent. This reflects private firms’ prompt offshore engagement once export growth signals their repayment capacity, whereas SOEs initially rely on state-backed or domestic resources.
Response of FX Borrowing to Export Shocks, Private Firms
Response of FX Borrowing to Export Shocks, Government Firms
Figures 15 and 16 present secured ECB responses: private firms exhibit +0.30 per cent by k=9, starting at k = 4; SOEs’ secured borrowing is negative through k = 2, then turns positive from k = 6 onward (peaking at +0.10 per cent at k = 8). Unsecured ECBs remain insignificant for both ownership groups (Figures 17 and 18).
Response of Secured ECB to Export Shocks, Private Firms
Response of Secured ECB to Export Shocks, Government Firms
Response of Unsecured ECB to Export Shocks, Government Firms
Response of Unsecured ECB to Export Shocks, Private Firms
5.3.3 Insights on Export Effects
Delayed FX uptake: Firms delay FX borrowing until export revenues solidify collateral or repayment prospects.
Secured credit channel: FX borrowing occurs mainly via secured ECBs once export growth proves sustainable.
Private–SOE divergence: Private firms swiftly leverage export shocks to secured FX debt; SOEs wait longer, reflecting preferential domestic resources.
Scarce unsecured access: Unsecured FX borrowing remains negligible, as lenders require collateral or proven cash flow.
The positive responses under stronger export intensity are consistent with the creation of a natural hedge and with the investment-smoothing role of risk management when external finance is costly (Froot et al., 1993); they also align with evidence that active FX risk management is associated with higher valuations (Allayannis & Weston, 2001).
5.4 Profitability and Asset Return Shocks: Transient FX Borrowing Upticks
5.4.1 All Firms
Figures 19–21 present total FX, secured ECB, and unsecured ECB responses to a one-standard-deviation net profit margin (PROFIT) shock. Total FX borrowing increases modestly to +0.05 per cent by k = 2, then returns to zero by k = 3 (Figure 19). Secured ECBs rise between k = 3 and k = 5, peaking at +0.10 per cent at k = 4, before fading (Figure 20). Unsecured ECBs are insignificant across all horizons (Figure 21).
Response of FX Borrowing to Net Profit Shocks, All Datasets
Response of Secured ECB to Net Profit Shocks, All Datasets
Response of Unsecured ECB to Net Profit Shocks, All Datasets
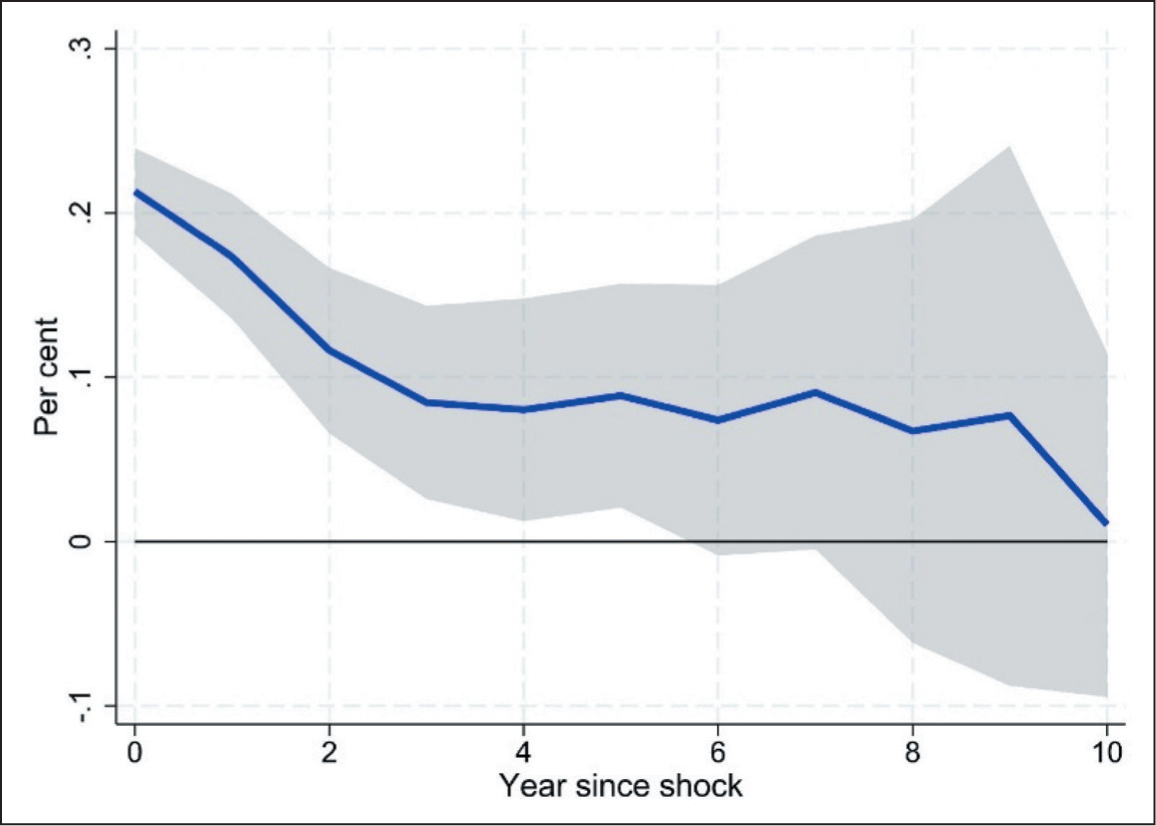
Figures 22–24 illustrate responses to a one-standard-deviation ROA shock: total FX borrowing shows a +0.10 per cent increase by k = 2, then dissipates (Figure 22); secured ECBs rise between k = 4 and k = 8, peaking at +0.35 per cent at k = 6 (Figure 23); unsecured ECBs exhibit a slight negative response through k = 3, then become insignificant (Figure 24).
Response of FX Borrowing to Total Assets Return Shocks, All Datasets
Response of Secured ECB to Total Assets Returns Shocks, All Datasets
Response of Unsecured ECB to Total Assets Returns Shocks, All Datasets
5.4.2 Ownership Splits
Figures 25–30 (PROFIT shocks) and Figures 31–36 (ROA shocks) compare the performance of SOEs with that of private firms. For PROFIT shocks, private firms’ total FX borrowing is insignificant at all horizons; SOEs show a +0.10 per cent uptick at k = 2 before fading (Figure 26). Private firms’ secured ECBs rise between k = 4 and k = 7, peaking at +0.25 per cent (Figure 27), while SOEs’ secured responses remain insignificant (Figure 28). Unsecured ECBs of both groups are negligible (Figures 29 and 30).
Response of FX Borrowing to Net Profit Shocks, Private Firms
Response of FX Borrowing to Net Profit Shocks, Government Firms
Response of Secured ECB to Net Profit Shocks, Private Firms
Response of Secured ECB to Net Profit Shocks, Government Firms
Response of Unsecured ECB to Net Profit Shocks, Government Firms
Response of Unsecured ECB to Net Profit Shocks, Private Firms
Response of FX Borrowing to Total Assets Return Shocks, Private Firms
Response of FX Borrowing to Total Assets Return Shocks, Government Firms
Response of Secured ECB to Total Assets Returns Shocks, Private Firms
Response of Secured ECB to Total Assets Returns Shocks, Government Firms
Response of Unsecured ECB to Total Assets Returns Shocks, Government Firms
Response of Unsecured ECB to Total Assets Returns Shocks, Private Firms
For ROA shocks, private firms exhibit +0.50 per cent total FX borrowing through k = 3 before fading, while SOEs show +0.10 per cent through k = 2 only (Figure 32). Private firms’ secured ECBs rise between k = 4 and k = 8 to +0.25 per cent, while SOEs remain insignificant (Figures 33–34). Unsecured ECBs are negligible for both (Figures 35 and 36).
5.4.3 Insights on Profitability and ROA Effects
Short-lived FX borrowing: Total FX borrowing spikes briefly following profit or ROA shocks, then reverts.
Secured channel activation: Secured ECBs respond with a lag—typically k = 3 to k = 5 for PROFIT and k = 4 to k = 8 for ROA—reflecting lenders’ need to verify enhanced cash flows and collateral.
Negligible unsecured response: Unsecured ECBs display no significant reactions, indicating lenders’ aversion to extending uncollateralised credit based solely on temporary profit upticks or asset returns.
Private firms more responsive: Private firms leverage profit and ROA improvements to access secured ECBs, whereas SOEs remain insulated by state backing and thus exhibit minimal FX borrowing responses to marginal profit or return shifts.
The short-lived increases in secured foreign borrowing following profit and return shocks are consistent with investment smoothing under costly external finance, where firms temporarily scale risk-matched funding as internal funds strengthen (Froot et al., 1993).
5.5 Interest Coverage Shocks: Mixed Responses
5.5.1 All Firms
Figure 37 displays total FX borrowing responses to a one-standard-deviation ICR shock. FX borrowing is slightly positive at k = 0, goes to zero by k = 2 (zero), then becomes insignificant. Figure 38 shows that secured ECBs fall at k = 0 (−0.10 per cent), recover around k = 3 (−0.05 per cent), and decline again by k = 8 (−0.25 per cent). Figure 39 indicates unsecured ECBs dip (−0.10 per cent) through k = 6 and then becomes 0.
Response of FX Borrowing to Interest Cover Shocks, All Datasets
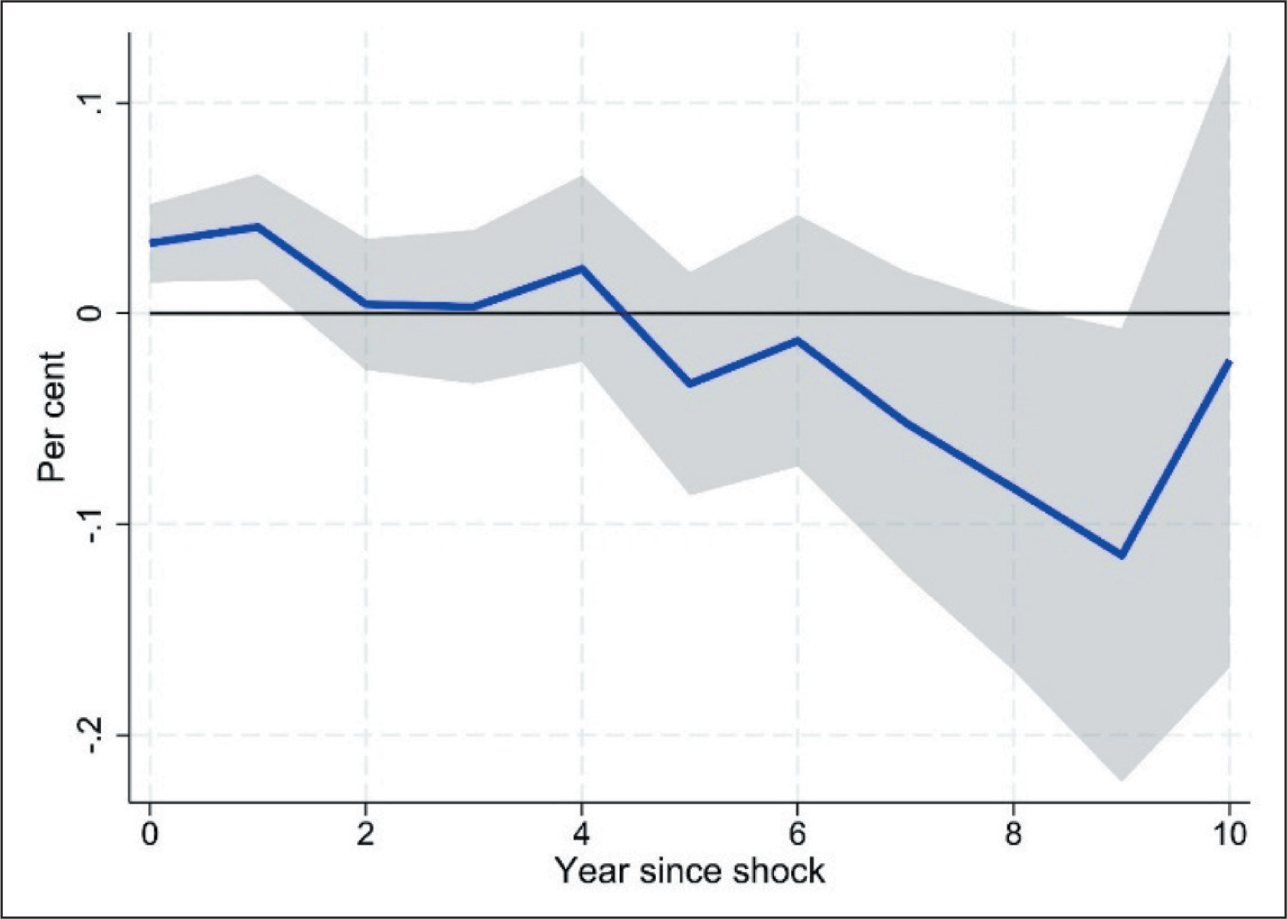
Response of Secured ECB to Interest Cover Shocks, All Datasets

Response of Unsecured ECB to Interest Cover Shocks, All Datasets
5.5.2 Ownership Splits
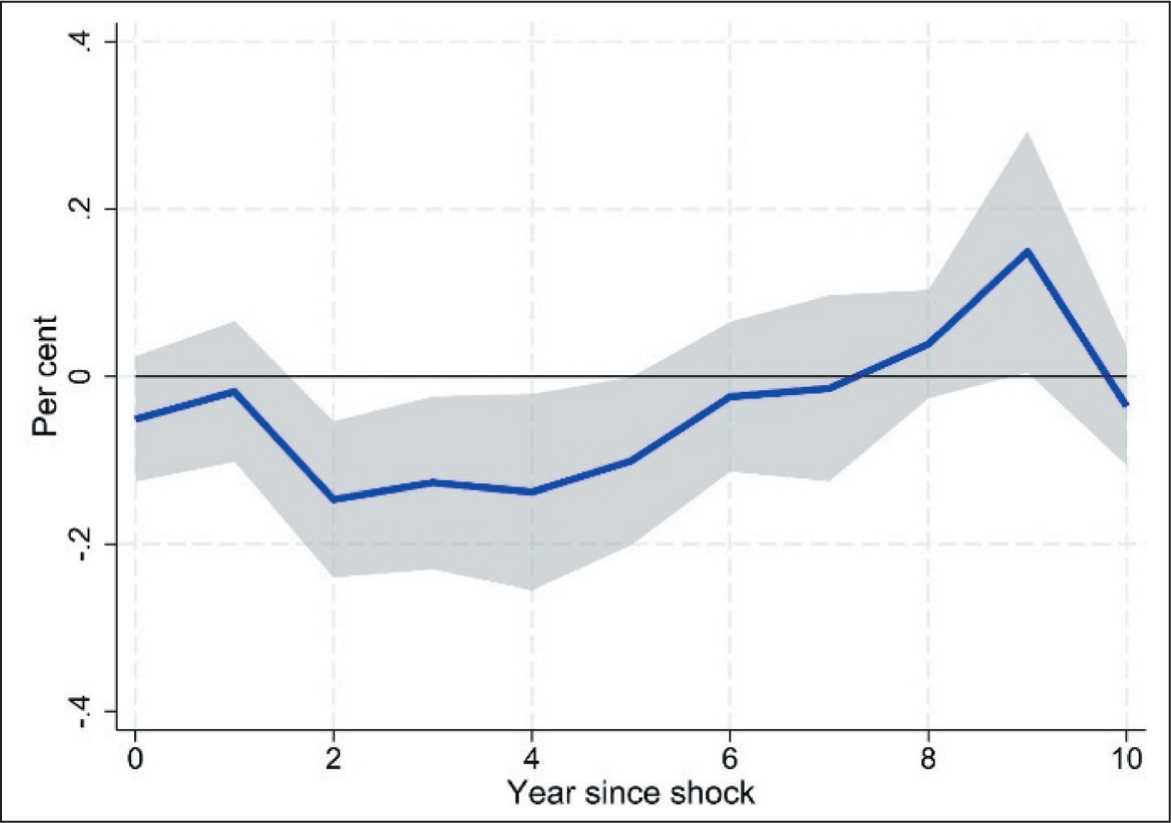
Figures 40–45 contrast SOEs versus private firms. For total FX borrowing, SOEs exhibit a persistent decline through k = 3 (−0.18 per cent), partial recovery to −0.08 per cent by k = 5, then insignificance (Figure 40). Private firms show a +0.05 per cent increase at k = 2, before a sharp decline to −0.15 per cent at k = 8 (Figure 41). Secured ECBs: SOEs are insignificant until k = 6, then exhibit a −0.50 per cent drop at k = 8 before recovering (Figure 42); private firms show +0.30 per cent at k = 5 before fading (Figure 43). Unsecured ECBs: SOEs rise at k = 4 to k = 10 (Figure 44); private firms stay in the positive zone but decline between k = 0 and k = 4 (Figure 45).
Response of FX Borrowing to Interest Cover Shocks, Government Firms
Response of FX Borrowing to Interest Cover Shocks, Private Firms
Response of Secured ECB to Interest Cover Shocks, Government Firms
Response of Secured ECB to Interest Cover Shocks, Private Firms
Response of Unsecured ECB to Interest Cover Shocks, Government Firms
Response of Unsecured ECB to Interest Cover Shocks, Private Firms
5.5.3 Insights on Interest Coverage Effects
Modest, transient reactions: Interest coverage shocks yield small, mixed FX borrowing responses—initial pullbacks reflecting lenders’ caution when debt service weakens, followed by modest upticks if coverage remains robust.
Secured versus unsecured dynamics: Secured ECBs of private firms benefit from temporary improved coverage (+0.30 per cent at k = 5), while SOEs face delayed cutbacks in secured credit. Unsecured ECBs respond minimally, indicating lenders’ aversion to uncollateralised lending when debt-service metrics fluctuate.
Ownership divergence: SOEs cut FX and secured borrowing more persistently when ICR weakens, relying on domestic or state-backed channels, while private firms briefly expand FX and secured borrowing when coverage improves, then retract as lenders reassess risk.
The muted or negative unsecured responses when coverage weakens are in line with distress-cost motives for hedging and lender sensitivity to expected default risk (Graham & Rogers, 2002; Stulz, 1984).
5.6 Key Takeaways from Empirical Analysis
Across various shocks, collateral-driven secured borrowing emerges as the strongest and most persistent channel, underscoring lenders’ reliance on collateral and firms’ use of asset pledges to access FX credit. In contrast, unsecured FX borrowing remains modest and transient in the wake of all shocks, reflecting lenders’ risk aversion and firms’ preference for collateralised or domestic financing. This divergence is further shaped by ownership: SOEs exploit implicit guarantees to obtain unsecured FX debt when fundamentals weaken, whereas private firms lean more heavily on secured borrowing from the European Central Bank and domestic funding sources. SMEs exhibit particular vulnerability: their FX borrowing responds more sharply to leverage and export shocks, yet their low hedge ratios amplify currency-mismatch risks and heighten exposure to adverse movements.
Balance-sheet fundamentals matter for the dynamics of FX borrowing. Leverage and export shocks tend to prompt increases in FX debt, while profitability shocks often lead to declines; however, these effects vary by instrument and firm type. Profitability and ROA shocks yield only short-lived increases in FX borrowing, suggesting that firms and lenders regard such improvements as insufficient grounds for long-term foreign currency commitments. ICR shocks provoke small and sometimes contradictory FX borrowing responses, reflecting lenders’ nuanced assessments of debt-service capacity. Hedge coverage remains low and uneven, with SMEs hedging just 38 per cent of their FX liabilities as compared with 68 per cent for large firms, and Indian corporates overall lagging behind their peers in FX risk mitigation.
Stress scenarios highlight the systemic risks inherent in this landscape. A 20 per cent depreciation of the rupee would push 12 per cent of the firms below the ICR distress threshold, raising serious concerns over rollover capacity, collateral shortfalls and funding pressures. In comparison with economies such as Indonesia, Thailand and Brazil, India’s oversight framework lacks mandatory hedge requirements, firm-level reporting templates and granular supervisory stress testing, signalling an urgent need for regulatory strengthening to safeguard financial stability.
Before quantifying these vulnerabilities, it is instructive to gauge their practical significance under a realistic exchange-rate shock. Accordingly, we conduct a one-off balance-sheet stress test for our 2023 firm cross-section, translating a 20 per cent rupee depreciation into a proportional increase in foreign-currency interest costs and examining its effect on the ICR. This exercise reveals how even moderate currency fluctuations can push a non-trivial share of corporates into distress, reinforcing the need for the policy measures outlined earlier.
6. Stress Test: Impact of a 20 Per Cent Rupee Depreciation
To gauge how vulnerable Indian corporates are to an exchange-rate shock, we run a one-off balance-sheet stress test on the 2023 cross-section of our firm panel. The exercise follows three straightforward steps.
First, we retain only observations for 2023 and drop any firm that is missing either its ICR or the share of foreign-currency debt in total borrowing. This ensures a clean, point-in-time view of the universe for which both variables are available.
Second, we translate a 20 per cent rupee depreciation into firm-level balance-sheet pressure by assuming that interest expense rises in direct proportion to each company’s exposure to foreign-currency liabilities. Concretely, a firm whose foreign-currency borrowing accounts for s per cent of its total debt sees its interest bill increase by 0.20 × s per cent, while the earnings numerator of the ICR is held constant. In effect, we inflate the denominator of the ICR but leave the numerator unchanged, thereby isolating the pure funding-cost channel of the depreciation.
Third, we re-calculate the stressed ICR for every firm and flag it as being in potential distress if the ratio falls below unity, a widely used early-warning threshold in credit covenants and banking supervision. Aggregating across the sample, we then compute the fraction of firms that breach this benchmark.
The outcome is sobering. A depreciation well within the historical range for INR moves would push the median ICR from 2.3 to 2.0 and, more importantly, would drive 12 per cent of non-financial corporates—roughly one in eight—below the critical cut-off of 1. In other words, even a moderate currency shock could leave a sizeable tail of firms facing covenant breaches, renewed collateral requirements or outright refinancing pressure. Coupled with the impulse–response evidence in Sections 4.1–4.3, the stress test underscores that benign aggregate indicators mask pockets of fragility that could amplify external volatility if left unaddressed.
7. Cross-Border Analysis and Benchmarking
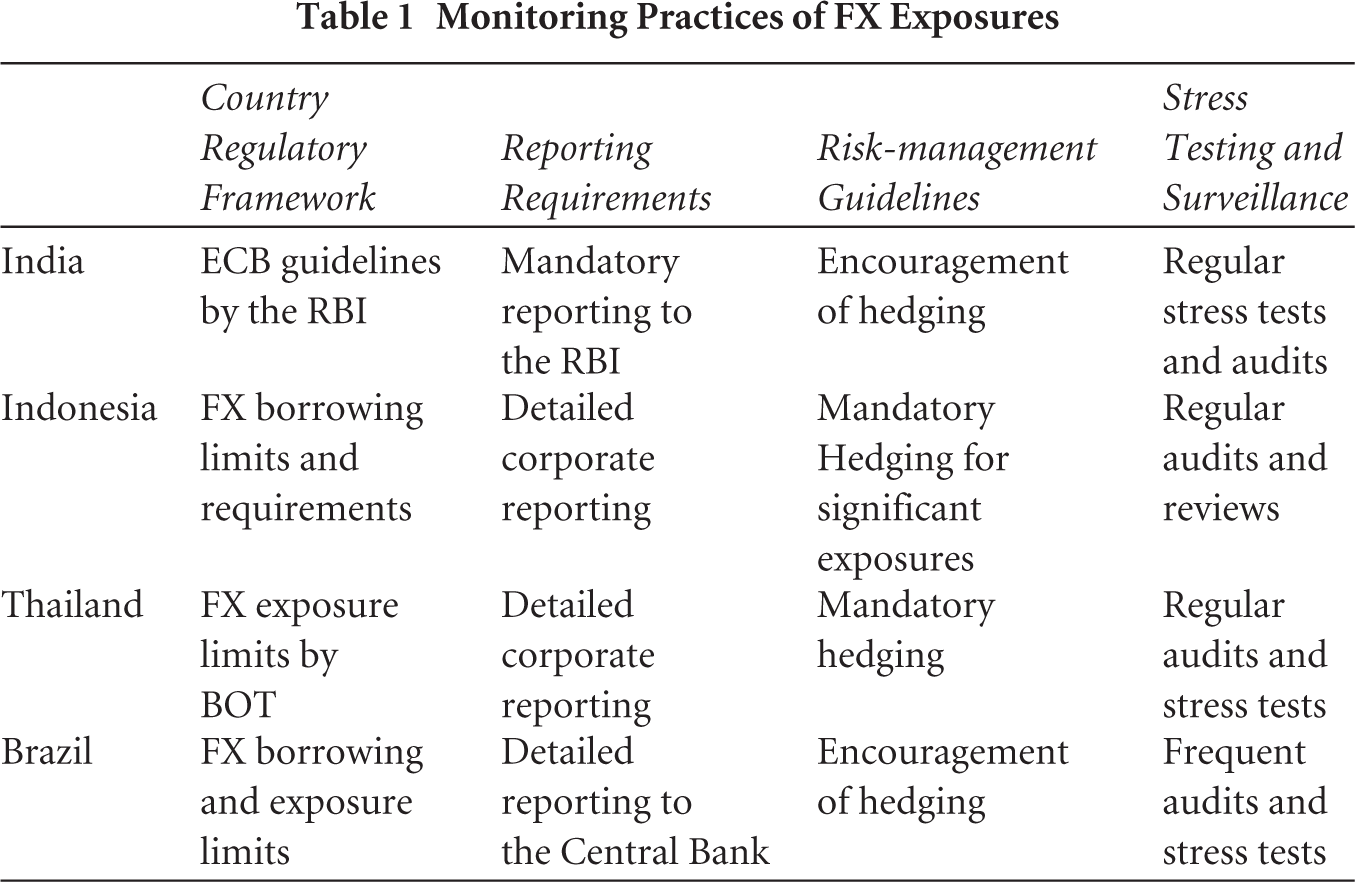
Comparing India’s corporate FX exposure framework to peer EMEs highlights best practices and gaps. We focus on four countries—India, Indonesia, Thailand and Brazil—along four key dimensions: regulatory framework, reporting requirements, risk-management guidelines and stress testing and surveillance.
7.1 Regulatory Framework and Reporting
7.1.1 India
The RBI regulates ECBs, specifying end-uses, minimum maturities and average maturity limits. Corporates must report aggregate ECB amounts, tenors and end-use categories. Listed firms provide narrative disclosures of FX exposures in annual reports; there is no standardised firm-level template for maturity breakdowns or hedge ratios.
7.1.2 Indonesia
Bank Indonesia mandates detailed firm-level reporting of FX liabilities—amount, currency, maturity and hedging status. Corporates with FX liabilities above a threshold (25 per cent of total debt) must hedge a minimum of 60 per cent of net open positions.
7.1.3 Thailand
Bank of Thailand requires firms to submit monthly reports on FX borrowings—amounts, maturity, currency and hedging status. Corporates with net open positions above 20 per cent of capital must hedge at least 50 per cent.
7.1.4 Brazil
The Central Bank of Brazil imposes FX borrowing limits by maturity buckets and requires firms to report both FX assets and liabilities. Corporates with significant FX exposures receive incentives—such as lower reserve requirements—if they hedge above mandated thresholds (e.g., 70 per cent of net open positions).
7.2 Risk-management Guidelines
7.2.1 India
The RBI encourages hedging through guidelines on permissible derivatives but does not mandate hedge ratios. The Securities and Exchange Board of India (SEBI) requires listed firms to disclose qualitative risk-management policies, including FX risk, but not quantitative hedge ratios.
7.2.2 Indonesia
It has mandatory hedging norms based on net open positions, and detailed risk-management guidelines for derivative usage. Bank Indonesia publishes monthly corporate FX exposures.
7.2.3 Thailand
It has mandatory hedging requirements and regular audits of corporate risk-management practices. The Bank of Thailand conducts stress tests for the corporate sector under FX and interest-rate shocks.
7.2.4 Brazil
The Central Bank offers incentives (e.g., reduced capital requirements) for corporates meeting hedge norms. Annual risk-management guidelines emphasise dynamic collateral haircuts under FX scenarios.
7.3 Stress Testing and Surveillance
7.3.1 India
The RBI conducts macro-level stress tests (e.g., scenarios of 20 per cent INR depreciation, 200 bps USD rate hike) for the banking sector, incorporating estimated corporate losses. There is no firm-level stress testing by regulators; corporate stress tests are conducted internally and are neither mandated nor disclosed.
7.3.2 Indonesia
Bank Indonesia performs quarterly firm-level stress tests, simulating FX and interest-rate shocks, and publishes anonymised sectoral outcomes.
7.3.3 Thailand
Bank of Thailand conducts periodic comprehensive stress tests for large corporates and publishes sectoral vulnerability assessments.
7.3.4 Brazil
The Central Bank undertakes semi-annual firm-level stress tests, with regulators reviewing results for capital-adequacy implications.
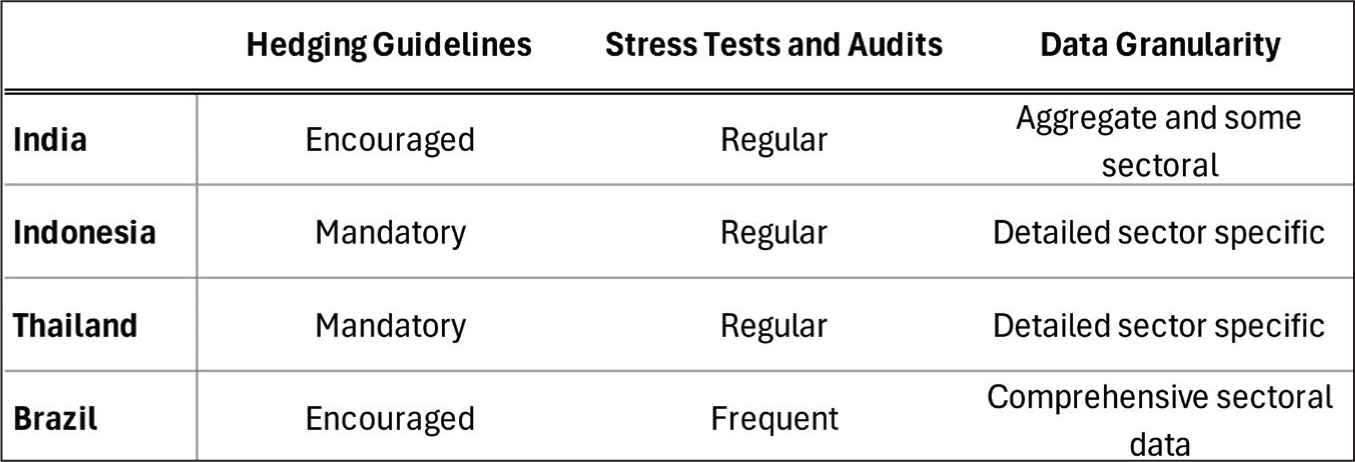
Tables 1 and 2 summarise these practices, including the regulatory framework, reporting requirements, risk-management guidelines and stress-testing approaches across countries, as well as publication details such as data granularity, the roles of rating agencies, and public-sector reports.
Monitoring Practices of FX Exposures
Publication of FX Exposure Data
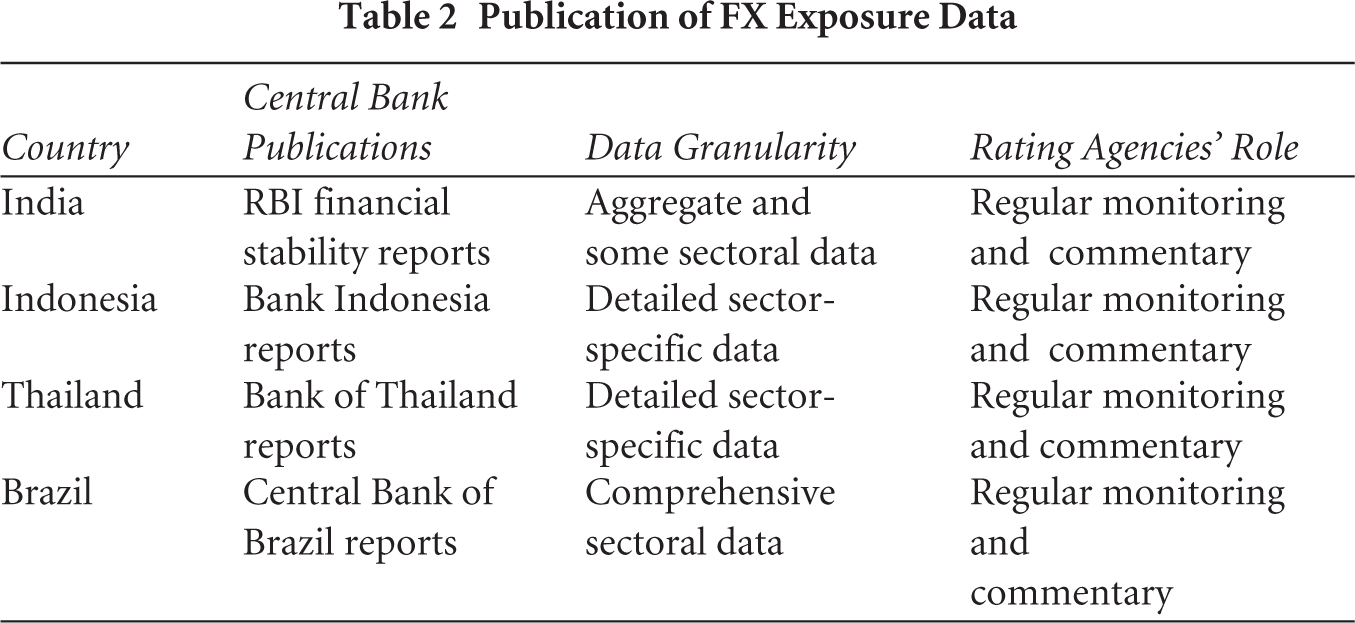
Chart 4 plots corporate dollarisation (X-axis) versus hedge ratios (Y-axis) for 2023. India’s 26 per cent dollarisation and 45 per cent hedge ratio contrast with Indonesia (32, 58 per cent) and Brazil (28, 62 per cent). Thailand (29, 55 per cent) also exhibits higher hedging.
7.4 Key Gaps in India’s Framework
Lack of firm-level granularity: India’s aggregate ECB reporting masks firm-specific maturity mismatches and net open positions, hindering early warning.
Absence of mandatory hedge norms: Without specified hedge ratios tied to open positions, firms, especially SMEs, lack incentives to hedge adequately.
No regulatory firm-level stress tests: RBI’s macro tests do not offer firm-level insights; regulators cannot pinpoint which corporates or sectors are most vulnerable.
Fragmented oversight: The RBI and SEBI coordinate sporadically; however, an integrated dashboard for corporate FX exposures, combining Central Counterparty (CCP) data, derivatives market information and corporate disclosures, is lacking.
Addressing these gaps would align India with best practices in peers, facilitating granular monitoring, timely interventions and market discipline.
8. Conclusion
Leveraging a matched panel of 38,589 Indian non-financial firms (2009–2023) and LP, this article maps how core balance-sheet fundamentals drive firm-level foreign-currency borrowing. We document that leverage and export shocks generate hump-shaped increases in FX borrowing, particularly via secured ECBs, while profitability and ROA shocks yield only transient FX upticks; interest coverage shocks have mixed, muted effects. Secured ECBs consistently exhibit the strongest and most persistent responses, reflecting collateral availability and lenders’ underwriting habits. Unsecured ECBs remain constrained across shocks, with only brief, modest spikes, underscoring lenders’ risk aversion towards uncollateralised FX exposure.
Ownership and size heterogeneity are critical. SOEs tap unsecured FX markets even when leverage is high and profitability is low, reflecting moral hazard under implicit guarantees. Private firms rely more on secured credit and domestic funding, adjusting FX borrowing immediately when fundamentals worsen. SMEs’ share of ECBs rose from 3 per cent in FY 2017 to 5 per cent in FY 2023 (Chart 1), yet only 38 per cent of their FX debt is hedged (Chart 2), heightening their vulnerability. A stress test simulating a 20 per cent rupee depreciation reveals that 12 per cent of firms breach the ICR < 1 threshold, with SMEs (18 per cent) and SOEs (15 per cent) being the most affected (Figure 40).
Taken together, the patterns for leverage, export intensity and instrument choice fit theories in which hedging lowers expected distress costs, supports debt capacity and smoothens investment when external finance is costly, and they are consistent with evidence on valuation premia for hedgers and non-monotonic hedging intensity across leverage (Allayannis & Weston, 2001; Froot et al., 1993; Graham & Rogers, 2002; Purnanandam, 2008; Stulz, 1984).
Cross-country benchmarking shows India mid-table on dollarisation but near the bottom on hedge ratios (Chart 4; Tables 1 and 2). Unlike its peers—Indonesia, Thailand and Brazil—India lacks firm-level disclosure templates, mandatory hedge norms and comprehensive firm-level stress tests. As capital inflows grow, these surveillance gaps risk turning corporate FX finance from a growth enabler into a latent fault line.
9. Policy Implications
9.1 Pillar 1: Data and Transparency
A foundational step is to mandate granular, firm-level disclosure of corporate FX exposures. All non-financial corporates would be required to submit a standardised template on a quarterly basis, detailing FX-denominated assets and liabilities by currency, maturity bucket (< 1 year, 1–3 years, > 3 years) and instrument (secured versus unsecured), net open FX positions, hedge positions by instrument (forwards, swaps and options) with maturity and notional amounts, and collateral pledges against secured ECBs with instrument-specific haircuts. These firm-level reports would be submitted to the RBI and published in aggregated, anonymised form to bolster market discipline without compromising confidentiality. A centralised corporate FX exposure dashboard—accessible to the RBI, SEBI and major banks—would track sectoral and size-based vulnerabilities in real time. (See reporting template in Appendix A4.)
9.2 Pillar 2: Risk-management Tools and Incentives
Dynamic hedge norms would be introduced to ensure that firms hedge a meaningful share of their net FX exposures. Firms whose net open FX positions exceed 10 per cent of total debt must hedge at least 50 per cent of that exposure; positions exceeding 20 per cent require 75 per cent hedging. Corporates would have the flexibility to choose forwards, swaps or options, but would be obliged to document mark-to-market practices to ensure real-time risk monitoring. Recognising the higher hedging costs faced by SMEs, a public–private FX Risk Pool would be established to aggregate SME exposures, secure lower forward-point margins and standardise option tenors and strikes. To reward compliance, firms consistently meeting hedge norms would benefit from reduced capital-adequacy risk weights, lower derivative margin requirements and eligibility for longer-tenor ECB facilities. These measures would be phased in over twelve months, with annual reviews to recalibrate thresholds.
9.3 Pillar 3: Supervisory Oversight and Stress Testing
Semi-annual, firm-level stress tests would be mandated for all corporates with FX debt exceeding 10 per cent of total liabilities. Scenarios would encompass INR depreciations of 15, 20 and 25 per cent; USD interest-rate shocks of 100, 200, and 300 basis points; and combined currency-rate shocks. Firms must report stressed viability metrics—stressed ICR, debt–service coverage ratio and net-worth changes—to the RBI, which would publish aggregated results by sector and size to foster market discipline and enable early regulatory outreach. A macroprudential dashboard would integrate firm-level FX data, tracking aggregate net open positions, maturity concentrations and hedge coverage, and triggering tiered surveillance alerts (e.g., audits or on-site inspections) when thresholds are breached. Collateral haircuts on secured ECBs would be dynamically adjusted under stress conditions—for example, a 20 per cent INR depreciation would automatically raise rupee-denominated collateral haircuts by an additional 10 per cent.
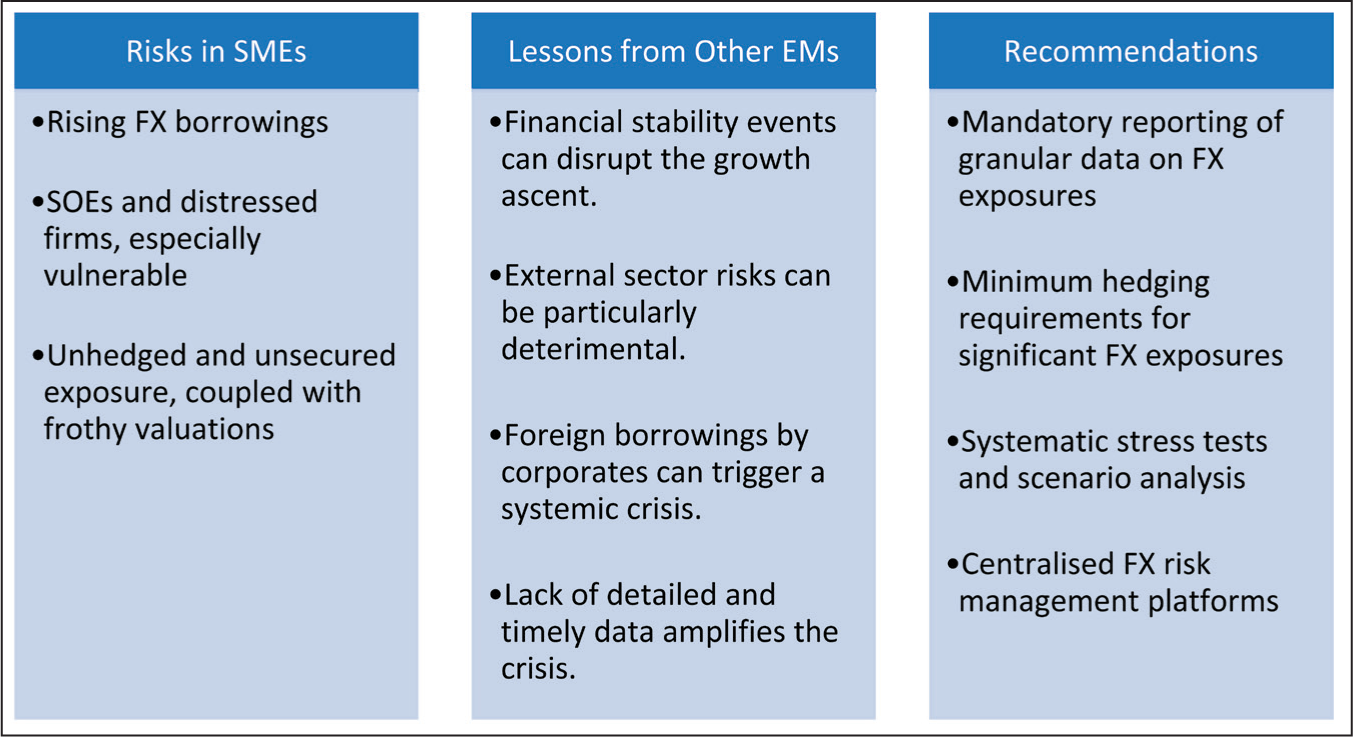
Within this enhanced supervisory framework, differentiated oversight would apply to SOEs and SMEs. SOEs would face prudential caps on net open FX positions (e.g., 15 per cent of total debt) and on unsecured ECB borrowing (e.g., unsecured FX ≤ 5 per cent of total debt), ‘sunset’ clauses phasing out implicit guarantees, mandatory board-level FX committees and senior-management bonus structures tied to long-term balance-sheet resilience rather than short-term offshore borrowing gains. SMEs would gain access to onshore derivative platforms with standardised contracts and low minimum lot sizes, partial government credit guarantees covering the first 10 per cent of forward-contract losses to lower hedging costs, modular financial-literacy programmes on FX risk management and concessional working-capital lines against export receivables to reduce reliance on FX debt for operations. A Regulatory Oversight Committee comprising the RBI, SEBI, industry and academia would oversee phased implementation and conduct annual policy reviews and random audits of FX disclosures to guard against misreporting and unintended shifts into unregulated OTC markets. The ideas can be summarised in Chart 5.
Summary of Key FX Risk Trends and Policy Implications
Footnotes
Declaration of Conflicting Interests
The authors declared no potential conflicts of interest with respect to the research, authorship and/or publication of this article.
Funding
The authors received no financial support for the research, authorship and/or publication of this article.