
Abstract
We assess India’s inflation-targeting regime at the eight-year mark. The Reserve Bank of India continues to be a flexible inflation targeter: it responds to both the output gap and inflation when setting policy rates. It has become neither more hawkish nor more reactive with the transition to inflation-targeting. Evidence points to improved outcomes: inflation is lower and less volatile, inflation expectations are better anchored and the transmission of monetary policy is more effective. Given this record, radical changes such as broadening the RBI’s monetary mandate, abandoning the target in favour of a more discretionary regime, targeting core instead of headline inflation or altering the target and tolerance band would be risky and counterproductive. One obvious area for improvement entails updating the weight of food prices in the CPI basket. We estimate the correct weight of food at today’s per capita income to be closer to 40 per cent instead of the current 45.8 per cent. This would likely fall further to around 30 per cent in a decade from now due to the projected increase in per capita incomes. This correction should ameliorate concerns about the design and practice of the current inflation targeting regime.
1. Introduction
In mid-2020, shortly after the outbreak of the COVID-19 pandemic, we published an interim assessment of the performance of inflation targeting in India. That earlier assessment, at the four-year mark, reached broadly positive conclusions. We presented evidence that adoption of inflation targeting by the Reserve Bank had rendered inflation more stable, more predictable and better anchored. We speculated that the credibility of the commitment to the target gave the RBI more room for manoeuvre when the pandemic struck—more scope for adopting accommodating monetary policies in response to the public health, economic and financial emergencies (Eichengreen et al., 2020).
Given the availability now of four additional years of data and experience, we revisit these issues. There are several good reasons for another look. First, COVID was a major stress test for the inflation targeting regime. If this monetary rule-cum-anchor performed well in the extreme circumstances of COVID, one can be more confident that it will perform well under a wide variety of different circumstances. We update our earlier tables, charts and analysis in an effort to shed light on this issue.
Second, the literature on inflation targeting in India has expanded considerably since our early assessment. This article thus affords an opportunity not only to extend and revise our own earlier analysis but also to take on board the views of others, including those adopting different methodological approaches.
Third, a number of voices have questioned the advisability of inflation targeting as it is currently practised by the RBI. Some have recommended a mandate where inflation is only one of several variables targeted by the central bank. Others have advised retention of the inflation targeting framework but modifying the point target, the target range, the reference price index or other operational aspects. Still others have suggested abandoning inflation targeting altogether. The next scheduled review of the RBI’s inflation targeting framework is due in 2026.
We show that the Reserve Bank of India continues to be a flexible inflation targeter: it responds to both the output gap and inflation when setting policy rates. It has become neither more hawkish nor more reactive following the transition to inflation-targeting.
Evidence points to improved outcomes during inflation targeting: inflation is lower and less volatile, inflation expectations are better anchored and the transmission of monetary policy is more effective. Given this record, radical changes such as broadening the RBI’s monetary mandate, abandoning the target in favour of a more discretionary regime, targeting core instead of headline inflation or altering the target or tolerance band around it would be risky and counterproductive. The 4 per cent point target, ±2 percentage point tolerance band and focus on headline inflation remain broadly appropriate for now.
One obvious area of improvement pertains to updating the weight of food-price inflation in the CPI inflation basket. We estimate the correct weight of food at today’s per capita income to be closer to 40 per cent instead of the current 45.8 per cent. This would likely decline further to around 30 per cent in a decade from now due to the projected increase in per capita income levels. This correction alone should ameliorate some concerns regarding the design and practice of the current inflation targeting regime.
2. Background
The government and RBI signed an inflation-targeting agreement (IT) in February 2015 and amended the RBI Act in May 2016. 1 The inflation target was set by the government in consultation with RBI with the possibility of revisiting it after five years. Accordingly, the government announced, via the Official Gazette, 4 per cent Consumer Price Index (CPI) inflation as the target from 5 August 2016, with an upper tolerance limit of 6 per cent and a lower limit of 2 per cent. It announced that the government would constitute a six-member Monetary Policy Committee (MPC), including three ex officio members from the RBI—the Governor (who would also be its Chairperson), the Deputy Governor in charge of Monetary Policy and one officer nominated by its Central Board—together with three external members to be appointed by the government. External members were to hold office for four years and could not be reappointed.
The RBI was required to organise at least four meetings of the MPC annually, as per a schedule published in advance. 2 It was asked to publish a Monetary Policy Report every six months, explaining the sources of inflation. It was to provide forecasts of inflation for a period between six and 18 months; the resolution adopted by the Committee; further details on the 14th day after every meeting of the MPC, including the minutes of the proceedings of the meeting; the vote and statement of each member of the MPC; and a document explaining steps to be taken to implement the decisions of the MPC. Finally, if the inflation target was not met, the RBI was required to submit a report detailing the reasons for failure to achieve it, remedial actions and the estimated time period within which the inflation target could be achieved. The agreement specified that the RBI would be deemed to have missed its target if inflation exceeded 6 per cent or declined below 2 per cent for three straight quarters.
The first MPC successfully completed its term four years ago, and in September, this year a second MPC will complete its full term. There has been a smooth transition of the external members as well as the three members from the RBI, with changes in the latter coinciding with the turnover of the RBI staff. Altogether six external members and 10 RBI staff have been the members of the two MPCs (which includes three governors and two deputy governors).
For most part, targets set under the IT have been met; and on almost all counts, the IT has performed as envisaged. It has been only once that inflation exceeded the upper tolerance band of 6 per cent for three consecutive quarters (during January 2022–September 2022). The RBI, in its own review of inflation targeting in 2021, endorsed its continuation in all respects, including the targets, design and implementation. The only revision it suggested was that failure may be deemed to have occurred when the inflation band is breached for four consecutive quarters rather than three.
3. Recent Literature
The RBI’s own analysis of its experience with inflation targeting postdates our earlier paper while coinciding with the first official five-year review of the framework in March 2021 (Reserve Bank of India, 2021). This documents a significant decline in inflation volatility (as measured by the standard deviation of inflation) relative to the preceding five-year period, and relatively few instances of large deviations from mean inflation during the IT period. It shows that inflation expectations of households moderated in the IT period, though continuing to exceed the upper bound of the RBI’s target range.
Bhattacharya (2023) also examines the recent behaviour of inflation expectations in India, using the survey of households’ inflation expectations conducted and published by the RBI. She does not find that inflation expectations respond in stabilising fashion to changes in RBI policy. Under credible inflation targeting, tightening by the RBI (an increase in the repo rate) should cause above-target inflation expectations to decline towards target. Her analysis of quarterly data for the period 2008 Q4–2019 Q4, using a co-integrated vector-auto-regression model, finds little evidence to this effect. However, this study does not distinguish the pre- and post-2016 periods, presumably because of a dearth of observations for the second sub-period. It thus leaves open the possibility that expectations became better anchored following the adoption of inflation targeting.
Kishor and Pratap (2023) consider this possibility directly. They analyse inflation forecasts from professional forecasters and an inflation sentiment index derived from text mining of newspaper articles covering the period 2010–2022. They decompose their measure of inflation expectations into a trend and a cycle, where they identify the trend with long-term expectations and the cycle with short-term expectations. Their analysis confirms that long-term inflation expectations became less sensitive to inflation sentiment in the post-2016 period, consistent with the view that the adoption of inflation targeting helped to better anchor these expectations.
Pattanaik et al. (2023) similarly investigate whether medium-term inflation expectations in India became better anchored following the adoption of inflation targeting. Also using survey data on household inflation expectations, they show that inflation expectations react less to new information about inflation following the adoption of IT, that expectations became better aligned with the central bank’s inflation target, and that the dispersion of views regarding expected inflation declined with the adoption of IT. Combining the three measures, they construct an index of the overall anchoring of inflation expectations and find a secular improvement starting in 2019. They interpret the finding as consistent with better anchoring following the adoption of inflation targeting.
Relatedly, Muduli and Shekhar (2023) use quantile regressions to analyse the determinants of lower- and upper tail inflation outcomes. Analysing monthly data spanning the period 2009–2019, they find a significant decline in both lower- and upper tail risks of inflation in the post-IT-adoption period, which they interpret as ‘add[ing] to the success story of the adoption of the IT framework in India in stabilizing CPI headline inflation’.
Finally, Bhalla et al. (2023) compare the performance of inflation and growth in countries where central banks have or have not adopted inflation targeting. India (since 2016) is one of their 33 treatment cases of countries adopting inflation targeting. They document a decline in average rates of inflation between three pre-IT and three post-IT years for 22 of their 33 countries, including India. But they cannot rule out the ‘regression to the mean hypothesis’, namely that countries suffering from relatively high inflation and then adopting inflation targeting see inflation fall not because of the role of IT in ensuring good outcomes, per se, but simply because periods of unusually high (and unusually low) inflation tend to be transitory. They find significant effects of IT for inflation stabilisation in approximately a third of their cases, and also weak evidence that IT adoption is associated with slower economic growth.
Thus, the majority of recent studies conclude in favour of constructive effects of inflation targeting, in India and more broadly, although there remains some scepticism and disagreement about the generality and robustness of the findings.
4. Analysis
We now analyse how inflation targeting in India has performed along a number of dimensions.
4.1 Measures of Inflation
Inflation in India has averaged 7.5 per cent or more since the 1980s, except in the early 2000s when it averaged 4 per cent and more recently when inflation fell with the move to inflation targeting (Table 1). Levels have exceeded average global inflation for the most part, while fluctuations have broadly tracked those in other low- and middle-income countries (LMI), aside from 2009 to 2015 (Figure 1).
Average Inflation in India, Low- and Middle-Income Countries and World
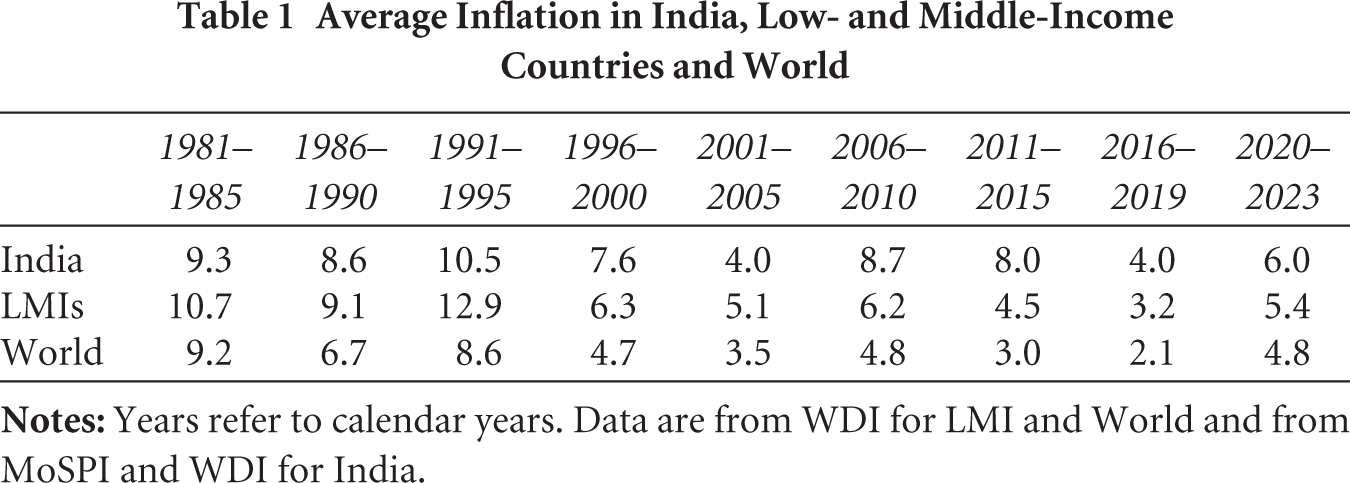
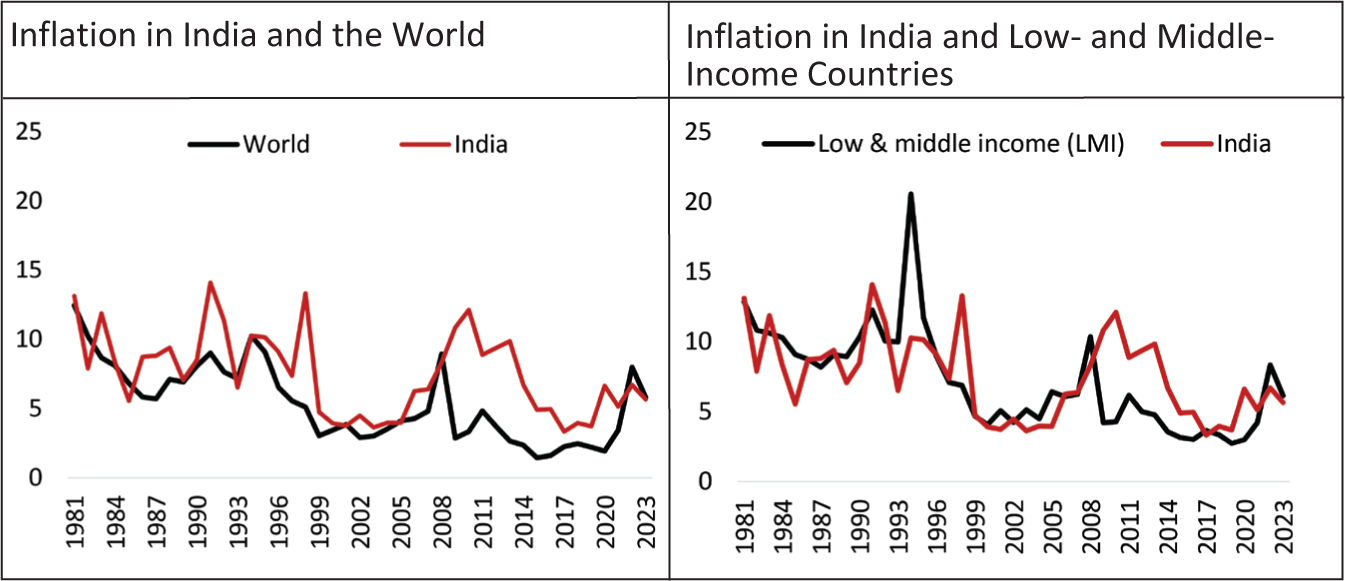
Inflation has declined since the adoption of IT, both compared to the preceding years and relative to the average inflation of the world and LMI. 3 Inflation in India exceeded the global average by about 4.5 percentage points and the average of LMI by 3 percentage points during the decade before IT. The differential has declined to 1.5 and 0.7 percentage points, respectively, since IT.
4.2 Alternative Measures
A challenge for monetary policy is measuring inflation. In India, there was no composite Cost of Living index before 2011. Instead, there existed separate CPI series for industrial workers, agricultural workers and non-agricultural rural workers. The CPI for industrial workers was commonly used as a proxy for the composite CPI. 4
A unified CPI series has been available since January 2011. Whereas the RBI took into account the Consumer Price Index (WPI) in monetary policy analysis until about March 2014, it now considers the headline CPI.
The question is which series the RBI should target. The WPI may not be best for two reasons. It consists of wholesale prices, not retail prices and comprises only manufacturing (64 per cent weight) and commodities, while excluding services altogether (Table 2).
Composition of Wholesale Price Index and Headline Consumer Price Index
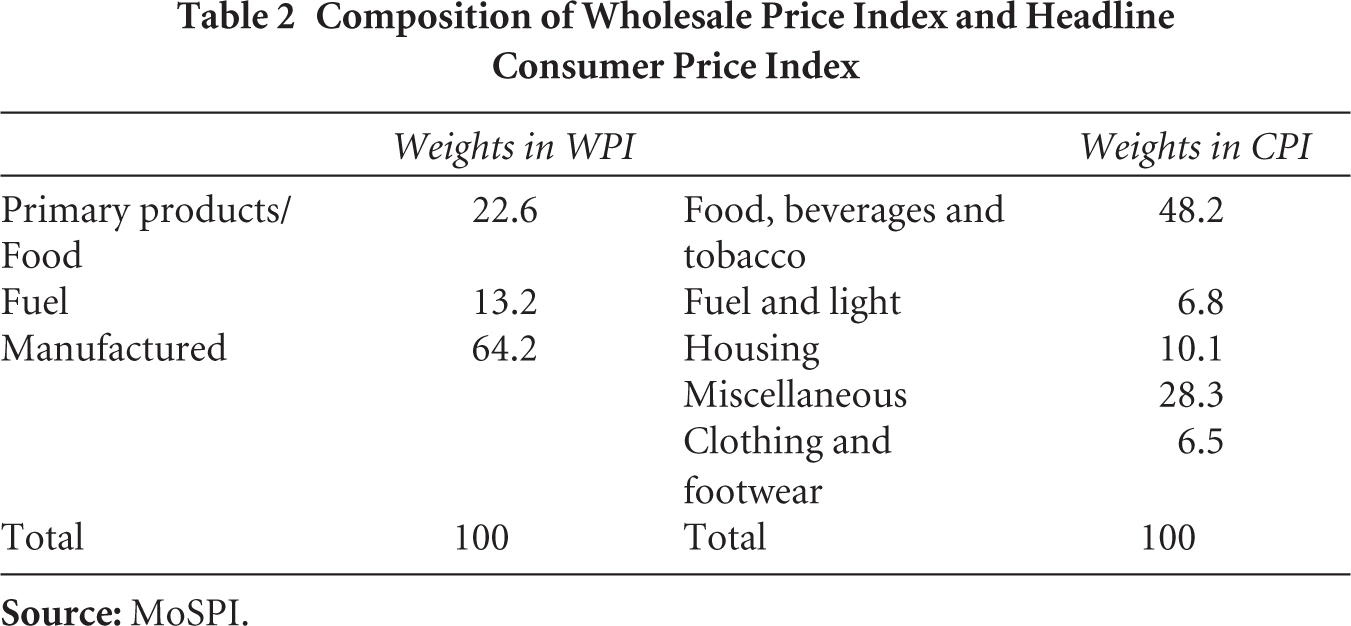
Headline CPI inflation is also affected by commodity prices, albeit to a lesser extent than the WPI. More importantly, food prices account for nearly half of the CPI and are often heavily affected by sector-specific non-monetary factors such as weather and harvests (supply shocks).
Insofar as shocks to food prices are transient, there is an argument that the RBI should look through them. Other arguments are that monetary policy is ineffective in combating supply-driven food inflation; food inflation is higher than the core inflation resulting in tighter monetary policy; and food prices are volatile necessitating more frequent policy changes. Such arguments favour a core (non-food, non-fuel) CPI. In the most direct official statement to this effect, the latest Economic Survey has proposed that ‘India’s inflation targeting framework should consider targeting core inflation, excluding food’. 5
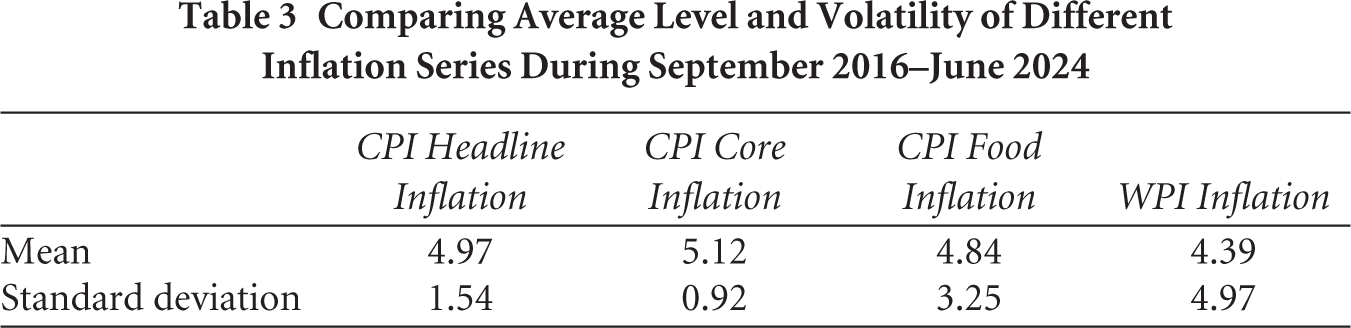
Counterarguments favouring headline inflation include that it is easier to explain to the public and thus more effective in anchoring expectations; food inflation feeds back into core inflation and hence needs to be tamed lest it becomes structural and strongly entrenched; and food price inflation has not been higher than core inflation. It has been more volatile than core inflation but less volatile than WPI inflation (Table 3).
Comparing Average Level and Volatility of Different Inflation Series During September 2016–June 2024
The choice of WPI or CPI is inconsequential if the two series co-move closely. But this is not generally the case, as shown in Figure 2.
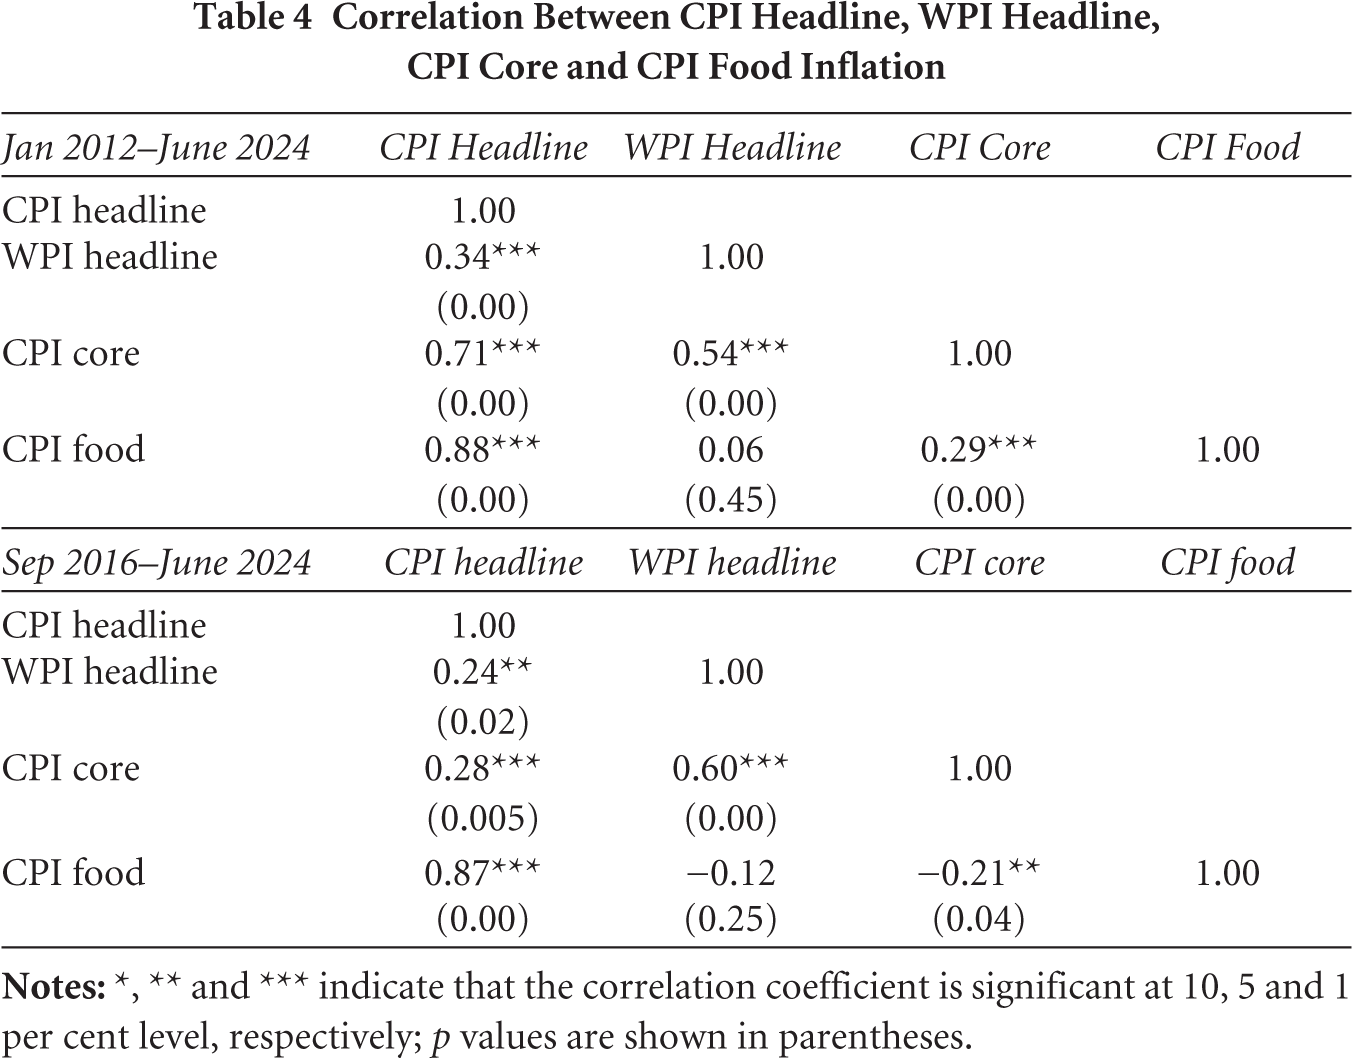
The correlation between WPI headline and CPI headline inflation has not been very high, although it is significantly greater than zero at the 90 per cent confidence level (Table 4). Given the relative composition of their baskets, it is unsurprising that CPI headline inflation correlates more strongly with food inflation.
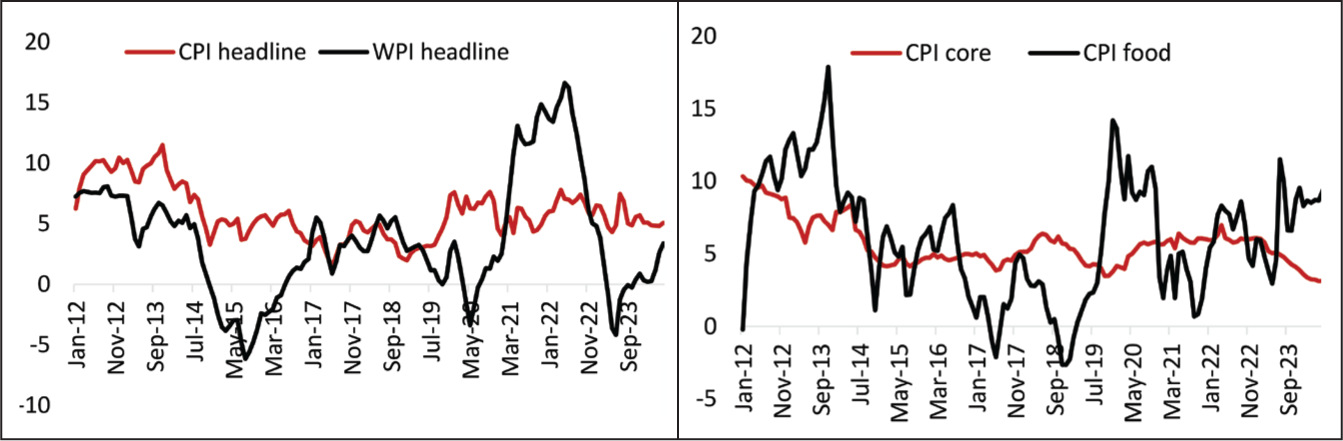
Correlation Between CPI Headline, WPI Headline, CPI Core and CPI Food Inflation
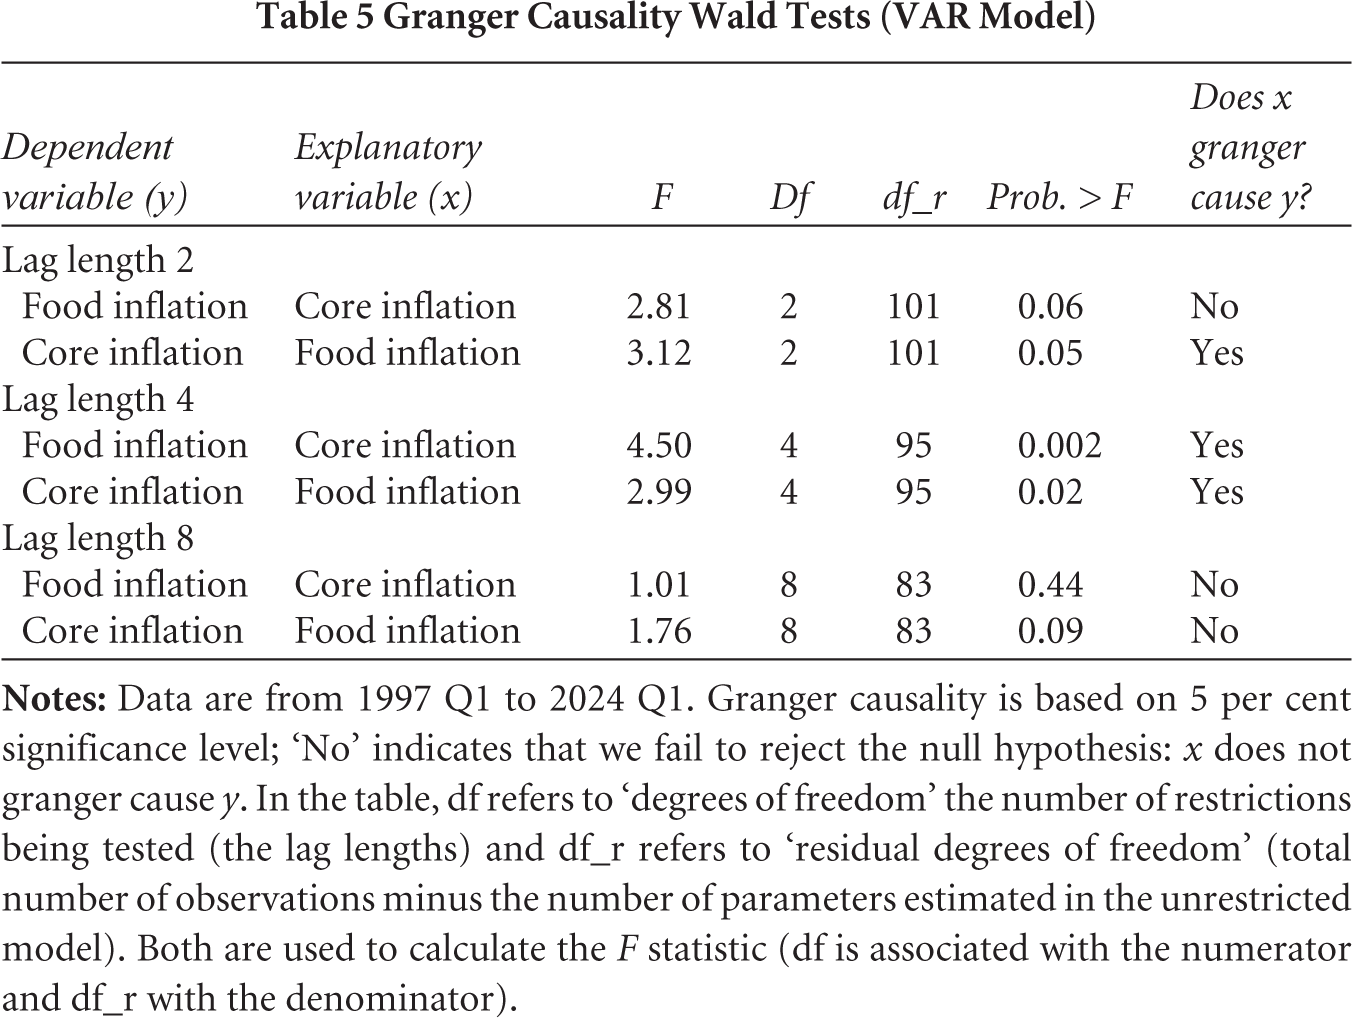
We estimate a VAR model to identify the relationship between food price inflation and core inflation, treating food and core inflation as endogenous and fuel inflation as exogenous (as given largely by global economic conditions). We estimate the relationship using quarterly data and with different specifications including two, four or eight lags.
Results (Table 5) indicate that food price inflation has a larger and more consistent impact on core inflation than vice versa. The impact is significant for two and four quarters. Granger causality tests in Table 5 suggest that food inflation Granger causes core inflation. In contrast, there is little evidence that core inflation Granger causes food inflation. Put differently, past values of food inflation help predict core inflation, but past values of core inflation do not help predict food inflation.
Granger Causality Wald Tests (VAR Model)
4.3 Reaction Functions
We now ask whether monetary policy decisions are influenced more by the output gap or inflation; whether the reaction function changed with the adoption of inflation targeting; whether the output gap and inflation carry different weights in the reaction function at high and low values; and whether the reaction function is different for headline and core inflation. 6 We estimated variants of reaction functions, all of which include the output gap and inflation. In an augmented version, we also include the lagged policy rate, the percentage change in exchange rate and the budget deficit or borrowing of the central government.
A number of earlier papers estimated reaction functions for the RBI. These studies find that the output gap is important (Hutchison et al., 2013; Mohanty & Klau, 2004) but that the exchange rate also matters, especially from the late 1990s when it became more flexible. These analyses typically use quarterly data. Since quarterly GDP growth is available from 1997, we follow this standard practice. For inflation, we use the WPI inflation until 2013 and the CPI inflation thereafter, since these are the inflation rates monitored by the RBI.
For the policy rate, we construct a composite policy rate series in the manner of Patra and Kapur (2012), based on the rate that was used by the RBI for monetary policy at different points in time. Thus, the series comprised bank rate from 1996 to February 2002; reverse repo rate from March 2002 to June 2006; repo rate from July 2006 to Nov 2008; reverse repo rate from December 2008 to May 2010 and repo rate from June 2010 onwards.
The exchange rate is calculated as quarter-over-quarter percentage change in the nominal exchange rate with respect to the US dollar. Budget deficit and market borrowing variables are highly seasonal, so we adjust them for seasonality and express them as a per cent of seasonally adjusted nominal GDP. The output gap is measured as the difference between seasonally-adjusted real GDP and its trend, obtained via the HP filter (as in Patra & Kapur, 2012) and expressed as a percentage of seasonally adjusted real GDP. 7
We estimate the following baseline specification of the reaction function using OLS:

where epr t is the effective policy rate; gap t denotes the output gap expressed as a percentage of GDP, and inflation t denotes the inflation measure as targeted by the RBI. We assess if the policy rate is different, contingent on values for the output gap and inflation, once the country moved to inflation targeting by including a dummy for the period since inflation targeting in the regression. We now expand this specification by including two dummy variables for the post-IT period—an IT1 dummy that equals 1 during the inflation targeting regime in the period Q3 2016–Q4 2019 and is zero otherwise; and another IT2 dummy that equals 1 during the inflation targeting regime in the period Q1 2020–Q1 2024 and is zero otherwise.

In all variants in Table 6, the output gap has a positive and significant coefficient, as anticipated. Inflation also has a positive coefficient. 8 When we add the lagged policy rate as an explanatory variable (Woodford, 2001 version of the Taylor Rule), its coefficient indicates significant inertia. The coefficients of output gap and inflation remain positive as before.
Monetary Policy Reaction Functions (1997 Q1–2024 Q1) (Dependent Variable Is Effective Policy Rate)
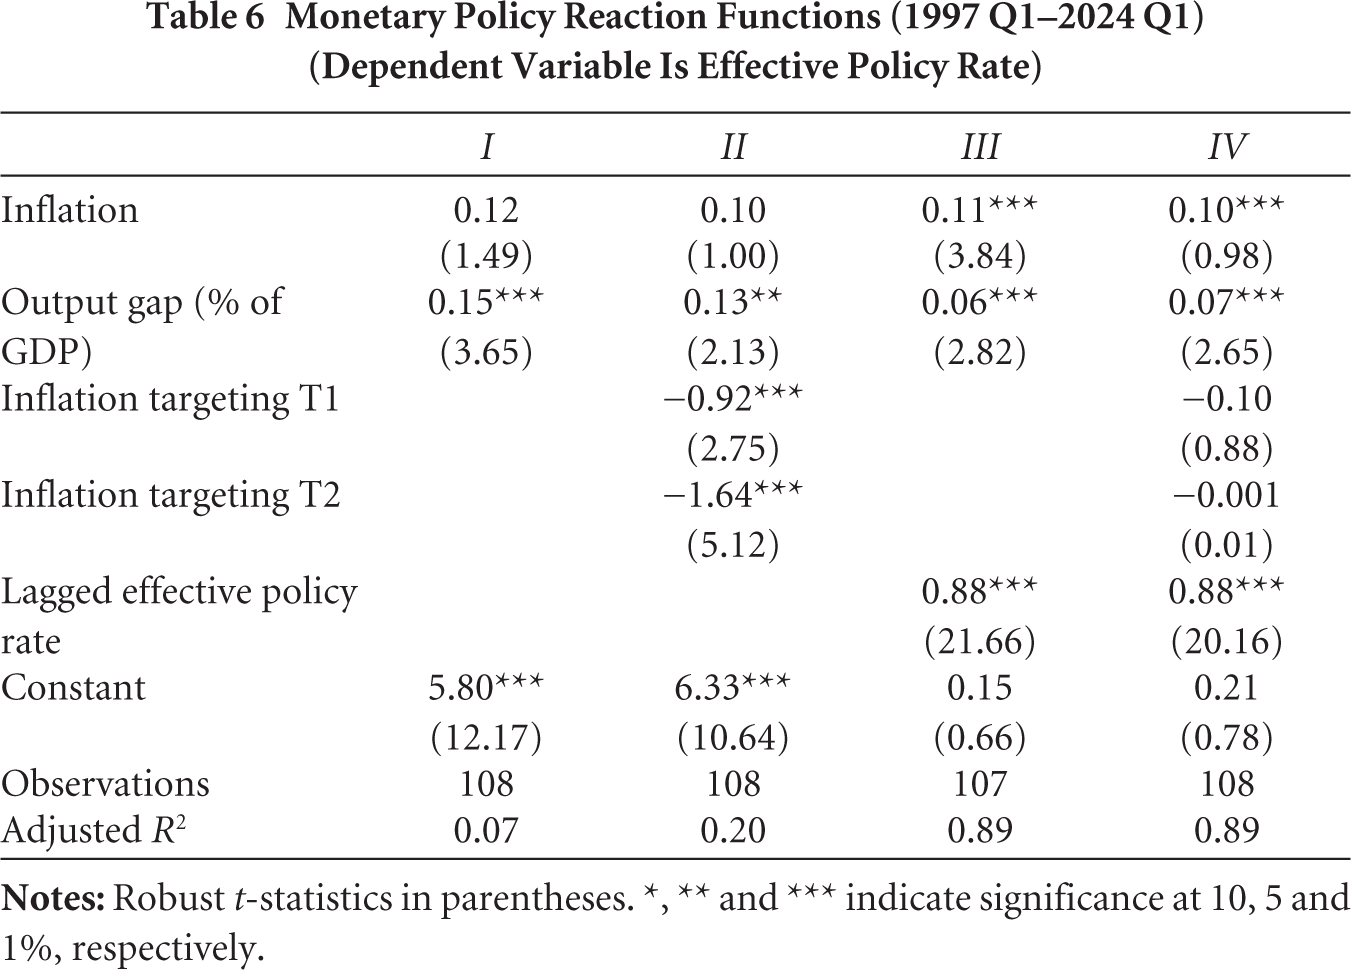
When we include dummy variables for the inflation targeting periods to address complaints that interest rates have been higher post-inflation targeting, we find, to the contrary, that rates have been lower once one accounts for inflation and the output gap, though not always significantly. 9
Policy rates were lowered dramatically during the global financial crisis. Was this reaction unusual, given that growth slowed sharply between 2007 and 2008? In extensions, we added a dummy for the global financial crisis; its coefficient is negative and significant, confirming that the RBI moved more quickly than predicted. Another question is whether policy rates react to the inflation series that the RBI tracks formally or to one or more of the CPI inflation series. When we include different inflation series in the reaction function, the results suggest that monetary policy responds to headline and core inflation but not to food price inflation.
We also ask if the weights on the output gap and inflation are different in periods when these variables take on unusually high or low values. Contrary to previous suggestions, we do not find evidence of threshold effects. 10
While there is evidence of autocorrelation in our ordinary least squares (OLS) estimates, when we adjust the standard errors using Newey–West correction, significance levels are unaffected. Previous studies have used generalised method of moments (GMM) for estimating the reaction function on the grounds that OLS coefficients may suffer from endogeneity and simultaneity bias. When we do so, the coefficients of inflation and output gap are similar to the OLS estimates obtained when we include the lagged policy rate. When we do not include lagged policy rates, the GMM estimates of the coefficients for both inflation and output gap are larger and more significant than the OLS estimates (see Appendix B).
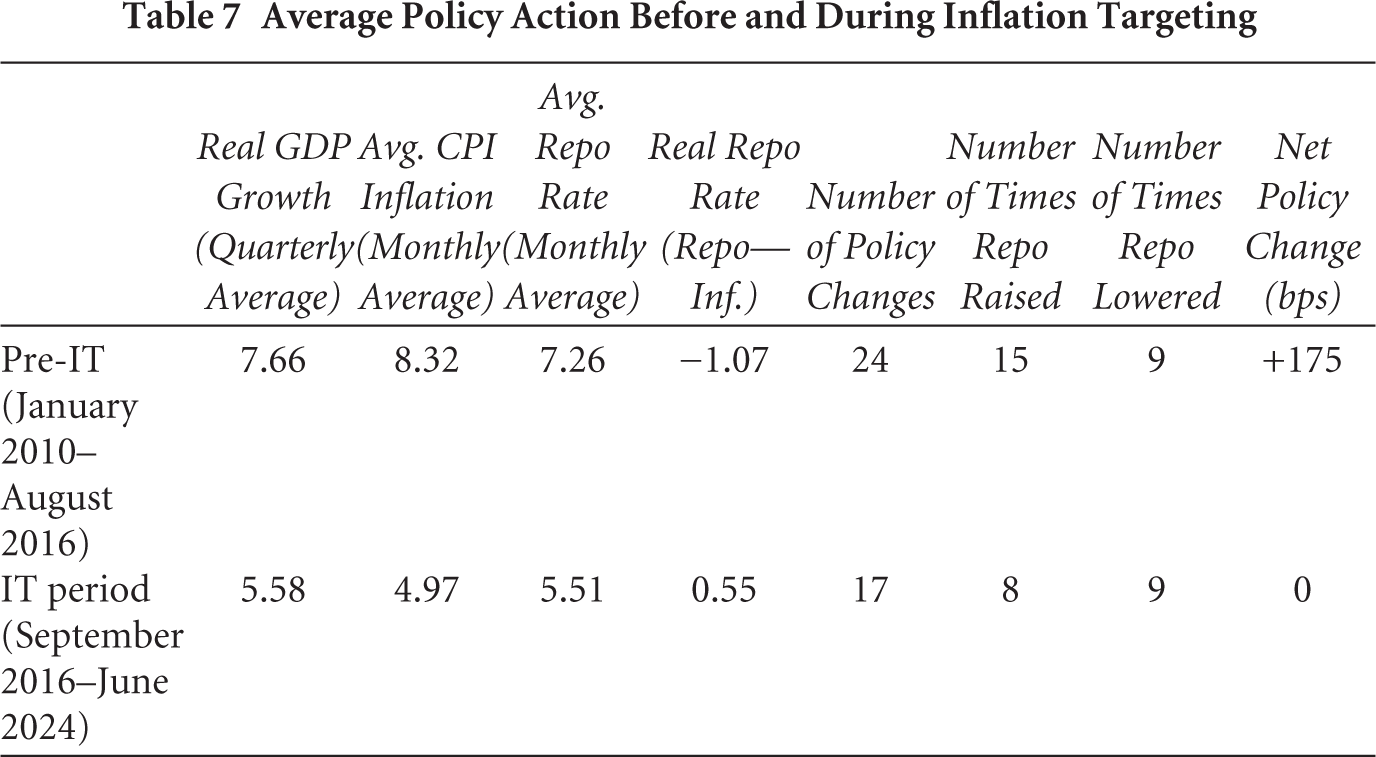
Finally, contrary to earlier scepticism, it does not appear that IT has made the RBI overly hawkish or reactive to every small deviation in inflation rate from its target of 4 per cent or to every spike in food inflation. Since September 2016, the RBI has changed the key policy rate 17 times, majority of them during two turbulent years: in 2019–2020 when the policy rate was eased five times by a cumulative 185 basis points in response to a sharp growth slowdown; and in 2022–2023 when the policy rate was increased six times by a cumulative 210 basis points in response to accelerated inflation emanating from global shocks. During the remaining six years, the policy rate was changed only six times, about once every year. Compared to this, the RBI changed its policy rate 24 times in the seven years prior to IT (Table 7).
Average Policy Action Before and During Inflation Targeting
4.4 Pre- and Post-Inflation Targeting Outcomes
Studies of the impact of inflation targeting have reached different conclusions depending, inter alia, on countries, periods and measures considered. For emerging markets as a class, there is evidence of lower inflation under IT, but results for inflation volatility are less consistent. 11 There is no clear consensus on the effects of IT on output growth—Brito and Bystedt (2010) find a significant negative effect on growth while other studies (Born et al., 2011; Naqvi & Rizvi, 2009) find insignificant effects of IT on growth. Gonçalves and Salles (2008) find that IT reduces output volatility, whereas Batini and Laxton (2007) find no such evidence.
We now update our earlier comparisons of the behaviour of a range of economic and financial variables before and after the adoption of IT in India. Our earlier baseline specification was of the form:

where yt denoted the outcome variable; IT t GFC t and PostGFC t denoted inflation targeting dummy (2016 Q3–2019 Q4), global financial crisis dummy (2008 Q3–2009 Q1) and a post-global financial crisis dummy (2009 Q2–2019 Q4), respectively. 12 We now revise this specification by including two dummy variables for the post-IT period instead of one—an IT1 dummy that, as before, equals 1 during the inflation targeting regime in the period 2016 Q3–2019 Q4 and is zero otherwise; and another IT2 dummy that equals 1 during the inflation targeting regime in the period 2020 Q1–2024 Q1 and is zero otherwise.

For outcome variables, we consider level of inflation across different inflation series and their respective volatility; percentage changes in the exchange rate and in external reserves; bond yields; volatility of the exchange rate; volatility of returns on equities; and the transmission of monetary policy (more on which below). Data used are from 1997 Q1 till 2024 Q1 unless otherwise noted.
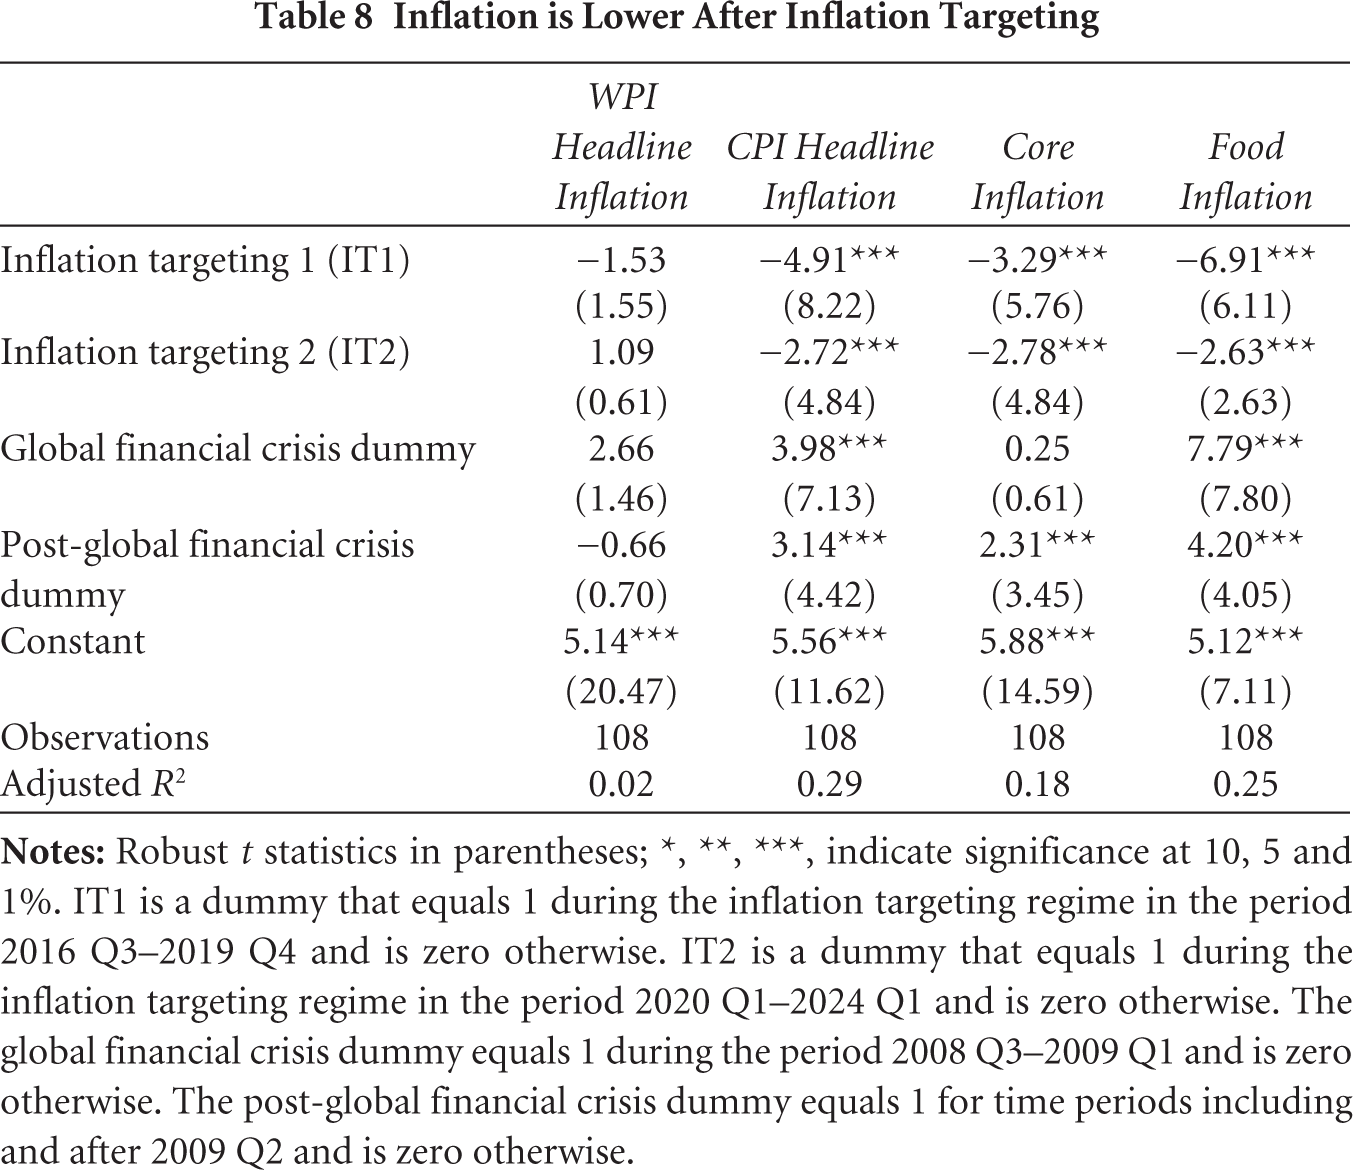
CPI headline, core and food inflation are lower in the IT period, as shown in Table 8. While CPI inflation increased after the global financial crisis, all measures of CPI inflation were lower after the shift to inflation targeting. It was lower during the first four years (2016–2019) than during the subsequent four years (2020–2023). On the other hand, WPI inflation was broadly similar in post IT period, as during the pre-IT period.
Inflation is Lower After Inflation Targeting
Similar analysis for inflation volatility, calculated as the quarterly average of the 15-month rolling standard deviation of monthly inflation series, shows lower volatility of CPI headline and core inflation after the adoption of IT (Table 9). Volatility of food inflation has not changed after IT; and the patterns are mixed for WPI inflation. Volatility in WPI headline, and its primary, and manufacturing components declined between 2016 and 2019 but has reversed since then.
Inflation Volatility Under IT
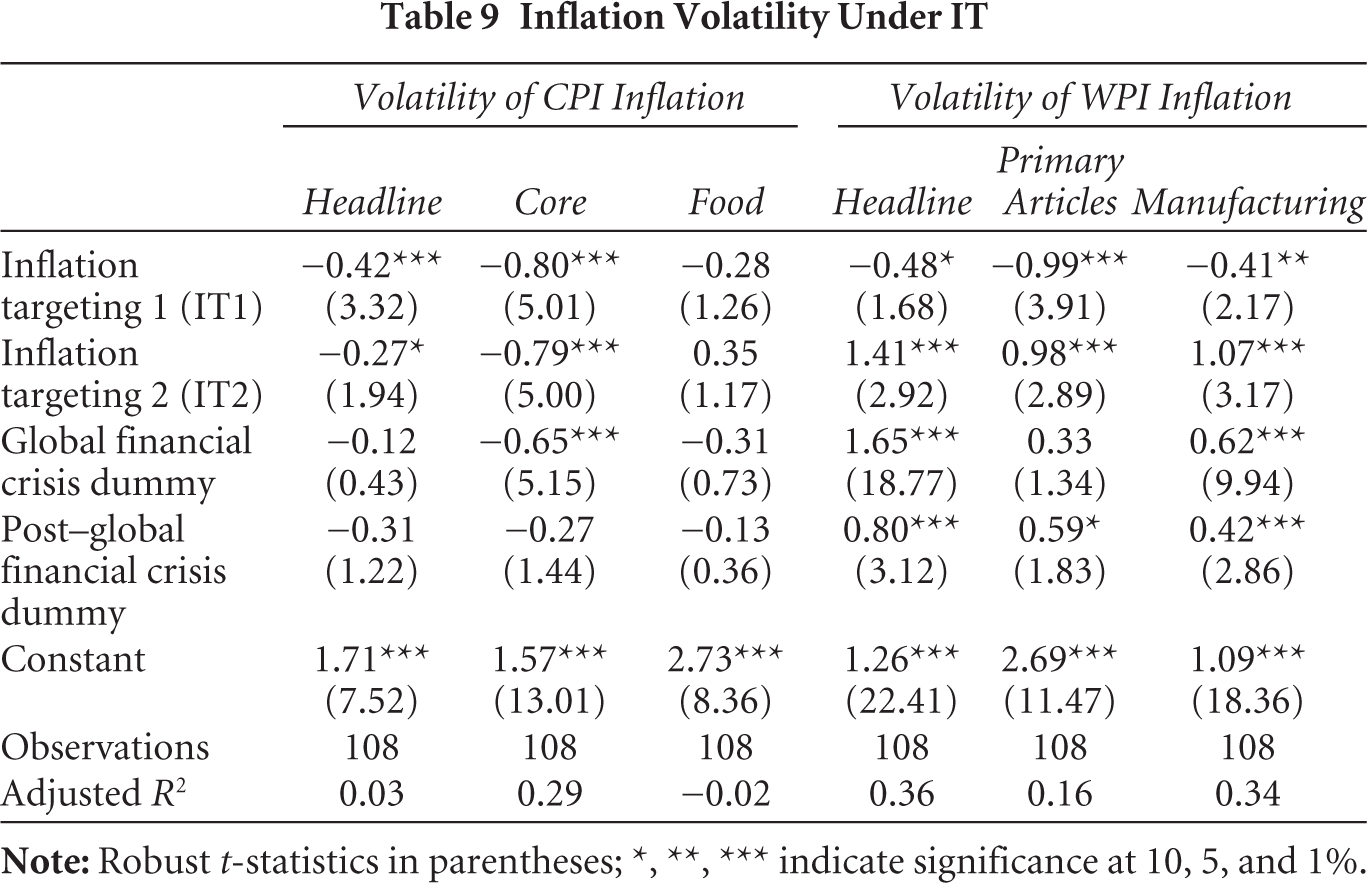
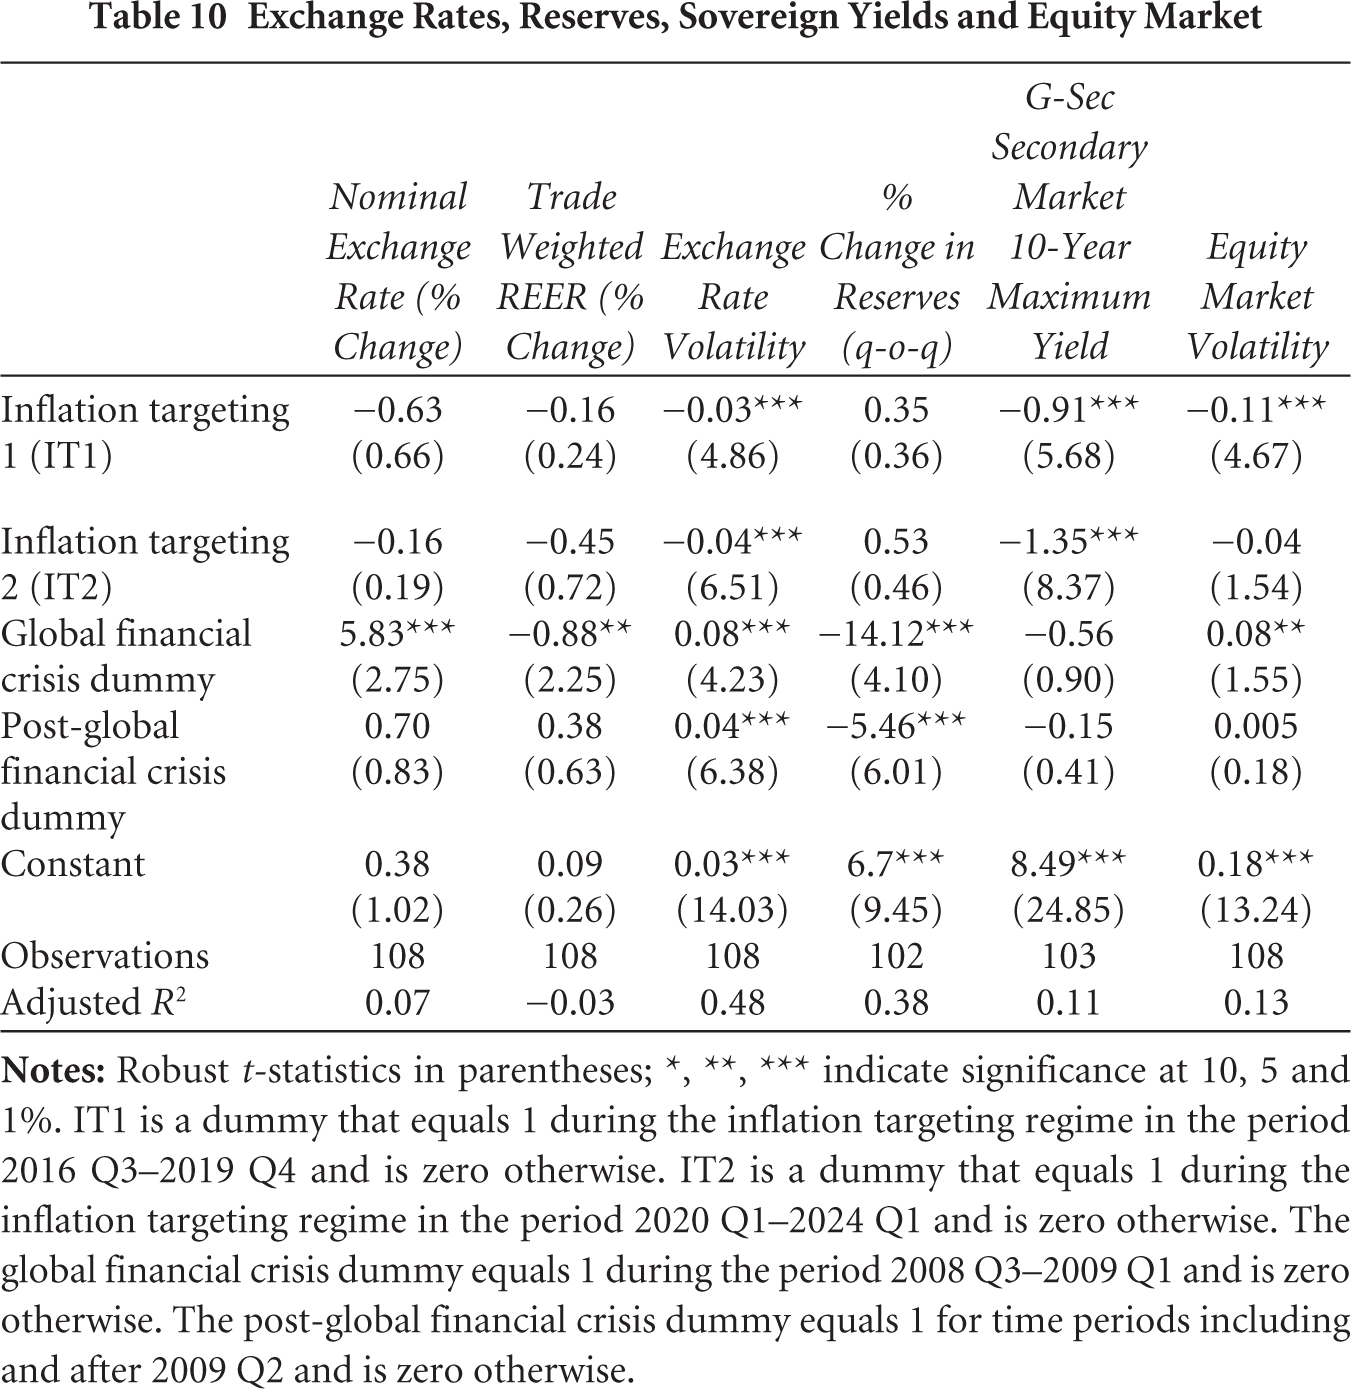
Table 10 indicates no change in exchange rate depreciation or appreciation (computed as an average of daily changes) or foreign exchange reserves. We measure exchange rate and equity market volatility by the standard deviation of percentage changes in daily value of the rupee to dollar exchange rate and equity markets, respectively. Table 10 suggests that the exchange rate and equity market have become less volatile under IT. Yields on government debt are lower after the adoption of IT. 13
Exchange Rates, Reserves, Sovereign Yields and Equity Market
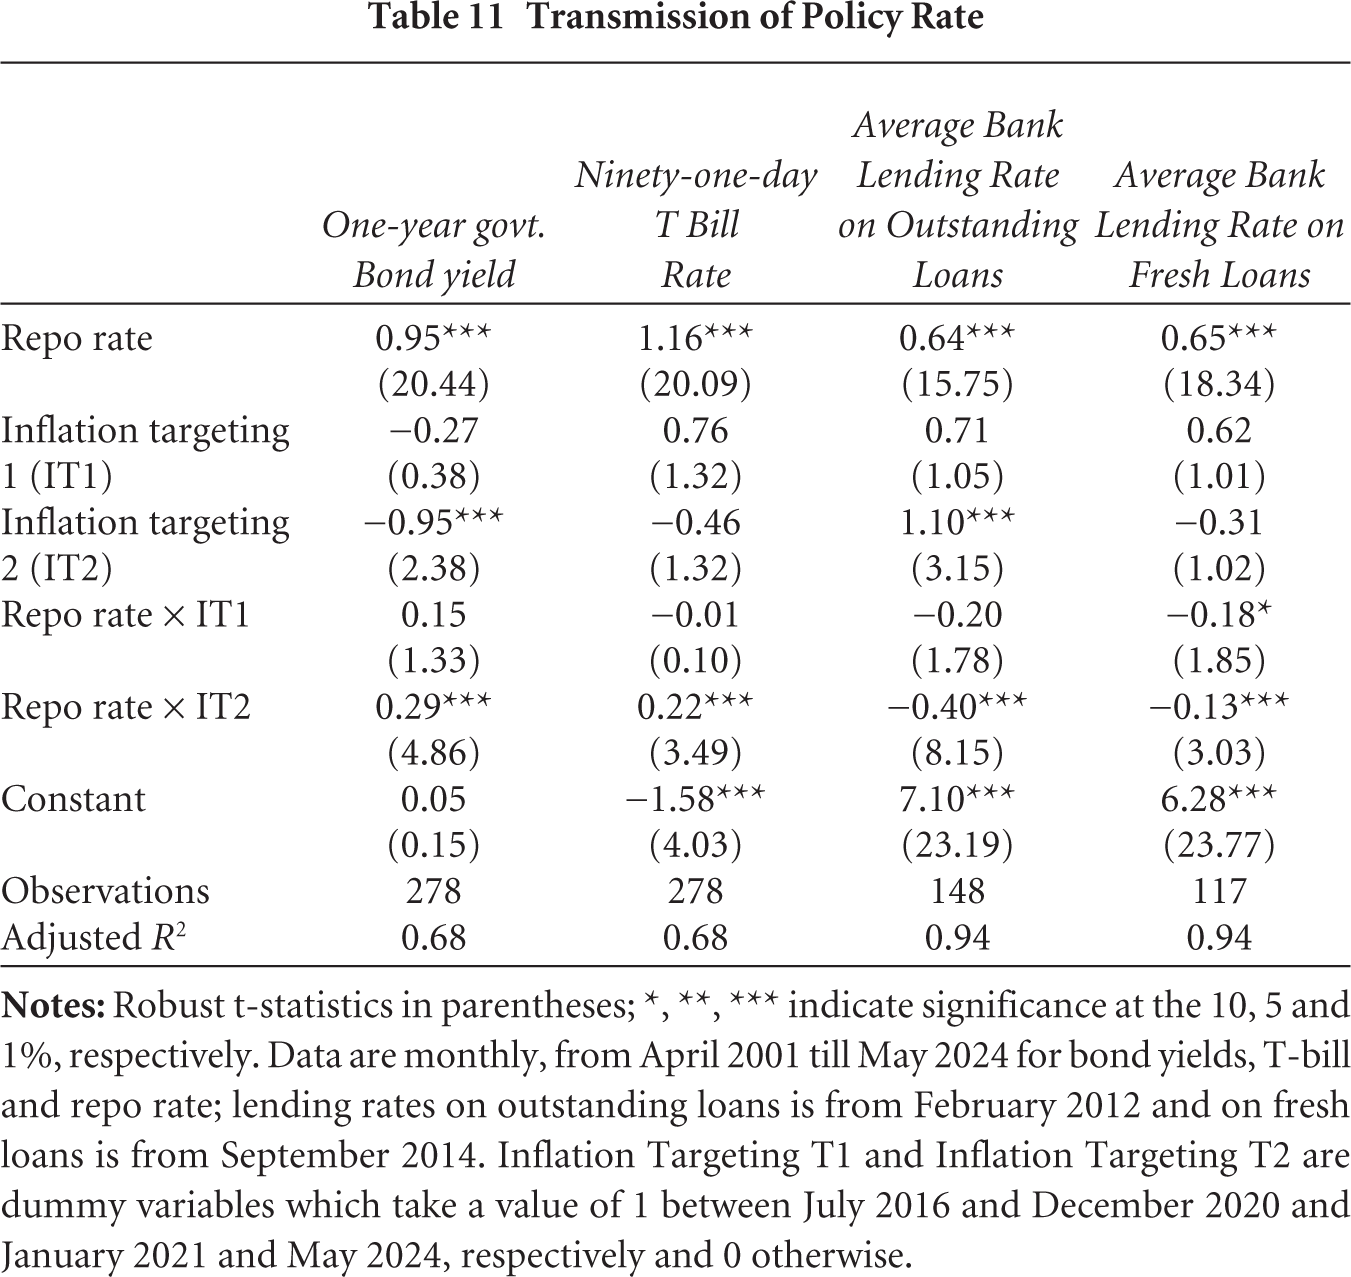
Finally, we examined whether the transmission of policy impulses to banking and financial markets improved with the adoption of IT. 14 We collated monthly data on government bonds yields of one-, two-, five- and 10-year maturities, treasury bill rates and average lending rates on new and outstanding loans. We used the repo rate as the relevant policy rate. Table 11 confirms that transmission is greater for treasury bill and short-tenure bonds. Transmission to government bonds yields and bill rates improved somewhat following the adoption of inflation targeting. Transmission to bank lending rates is relatively weak, as other authors have shown, and has not improved with the adoption of IT. Transmission to bond yields of longer tenure securities is weaker and has not improved with the adoption of IT (results not shown for brevity).
Transmission of Policy Rate
4.5 Are Expectations Better Anchored?
Kose et al. (2019) find that long-term inflation expectations have declined in the past two decades in both advanced economies (AEs) and emerging markets and developing economies (EMDEs). Although inflation expectations are less well anchored in EMDEs, their sensitivity to domestic and global shocks has declined. They suggest that an IT regime and greater central bank transparency are associated with better anchoring. 15
Studies of India similarly suggest that expectations have become better anchored in recent years. For example, Asnani et al. (2019) analyse the inflation expectations of households and find that inflation expectations have become better anchored during the inflation targeting period—in particular, there is only limited spill over from food inflation to food and non-food inflation expectations in the inflation targeting period. 16
The RBI has been conducting its Inflation Expectations Survey of Households since 2005, recording survey respondents’ perceptions of current inflation and expectations of inflation three months and one year ahead. The survey records both qualitative and quantitative responses. It was conducted quarterly (viz. Mar, Jun, Sep and Dec) until March 2014. At that point, two additional rounds in May and November were added to align it with the bi-monthly monetary policy review cycle.
The RBI has also been conducting a survey of professional forecasters since the second quarter of 2007–2008, drawing responses from forecasters with both financial and non-financial institutions. Initially, the survey was conducted at quarterly frequency, but this was changed to bi-monthly in 2014–2015. The survey collects annual quantitative forecasts for two financial years (current year and next year) and quarterly forecasts for five quarters (current quarter and next four quarters).
We ask how the inflation expectation series for India has changed since the implementation of inflation targeting. For the analysis below, we use both the household and professional forecaster series averaged at quarterly frequencies. We use the CPI inflation expectations of professional forecasters and compare household and professional forecasts with CPI inflation. 17
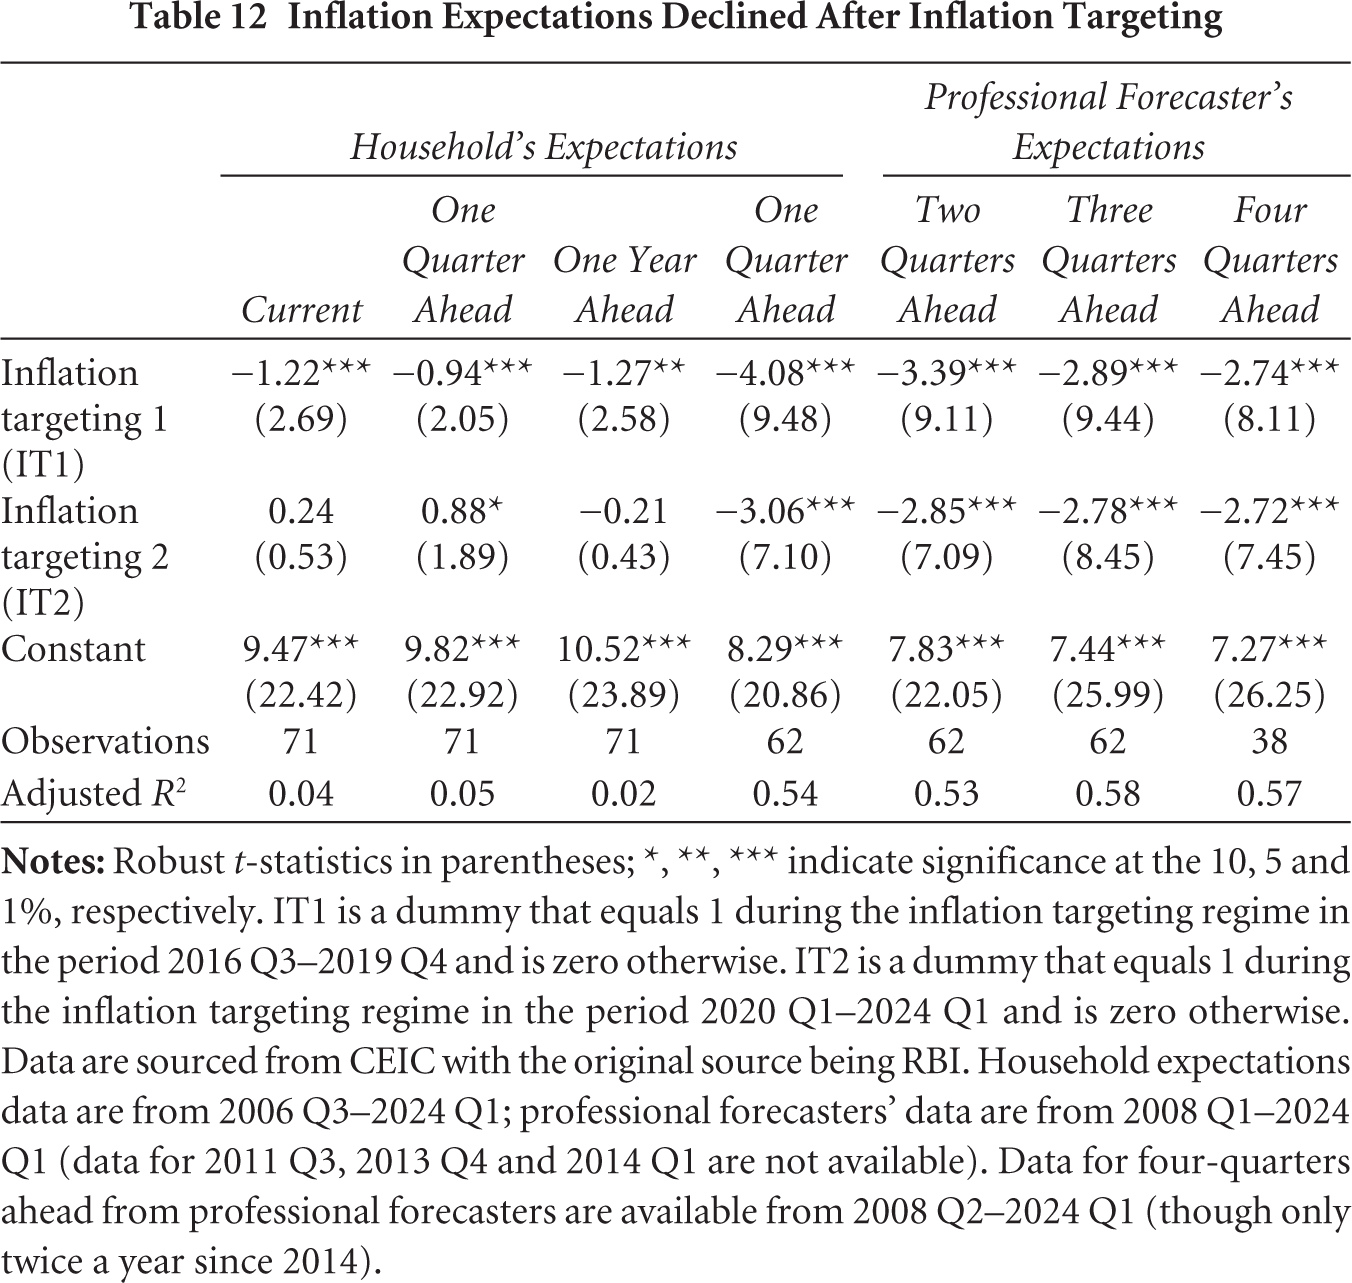
Both professional forecasts and household expectations of inflation declined with the shift to IT. Even so, household expectations of inflation consistently exceed actual inflation, and the deviation has not declined. The averages of professional forecasts have been close to actual inflation, while household expectations have often exceeded actual inflation. In the last few years, and particularly since the shift to IT, expected inflation has declined, in line with the decline in actual inflation (Table 12).
Inflation Expectations Declined After Inflation Targeting
5. Potential Reforms
In this section, we review and assess some recommendations that have been tabled for modifying the Reserve Bank’s approach to inflation targeting.
5.1 Broadening the Mandate?
A number of critics have opined that the RBI’s mandate to maintain price stability while also ‘keeping in mind the objective of economic growth’ is too restrictive and should be broadened to encompass other goals. It has been suggested that the growth objective should be elevated so that it has parity with the price stability objective, in the manner of the US Federal Reserve’s dual mandate. Mehrishi (2024) argues that the RBI’s mandate should be expanded to include responsibility for corporate bond market development, to be achieved by purchasing corporate bonds and accepting commercial bank holdings of the same as collateral when obtaining liquidity at the central bank. Dikau and Volz (2021) note that unlike some 70 other central banks worldwide, the RBI has no sustainability objectives or responsibility for the promotion of green finance.
In our view, the costs of broadening the mandate exceed the benefits. King (2024) notes that giving too many responsibilities to the central bank will tend to reduce the time and focus of senior personnel on the main responsibility of achieving price stability. In addition, a first rule of policy is that an institution should not be tasked with hitting targets to which its instruments are ill suited. It is not clear, in this context, that the MPC, when setting interest rates, can promote economic growth in additional ways besides maintaining a stable and predictable rate of inflation conducive to productive investment decisions. Wearing its hat as regulator, the RBI can adopt regulations designed to promote corporate bond market liquidity and green finance, but making these objectives elements of its monetary policy mandate threatens to overload and distort the conduct of interest rate policy. The more objectives the MPC is tasked with pursuing, the more difficult it would become to communicate its policy towards inflation and thereby help to stabilise inflation expectations. Moreover, a more complex mandate hinders central bank accountability by making it harder for observers to evaluate the central bank’s actions relative to its objectives.
5.2 Is Headline CPI Still Relevant?
Some authors (Chhibber, 2020; Ministry of Finance, 2024) have suggested that headline inflation is an inappropriate target, that the RBI should ‘look through’ (i.e. disregard) movements in food price inflation on the grounds that food prices are volatile, and that focusing on them distorts the conduct of policy. In responding to food price inflation, the central bank will be focusing on transitory inflation threat and neglecting other more important objectives of policy.
Our results indicate that food-price inflation feeds through to core inflation as producers mark up the prices of other products. Food-price inflation, which is captured by headline inflation, has predictive content for future core inflation, in other words, and should not be disregarded. Whereas central banks in AEs have been able to look through fluctuations in food and fuel price inflation without consequences for core inflation and therefore without jeopardising their inflation targets, in India, where food is a much more important component of consumption baskets, this may not be the case. This is not an argument that the central bank should react to each and every movement in headline and food inflation. But it does suggest that neglecting food price inflation that diverges from target for an extended period can have negative consequences.
5.3 Should the Consumption Basket Be Updated?
Is the weight on food prices in the headline CPI basket excessive? The current basket accords a weight of 45.8 per cent to food and beverages. The basket was last calculated in 2011–2012 and has not been revised since then, even though per capita incomes have nearly doubled meanwhile. 18
To calculate an appropriate weight on food in India’s consumption basket, we estimated the relationship between the share of food and per capita income across countries. We estimated a similar relationship for the Indian states (for their respective consumption baskets as of 2011–2012). The estimates across each regression confirm that the share of food in consumption declines as income levels increase (Appendix C). While a Bangladeshi spends 45 per cent on food, a Vietnamese spends 33 per cent, a Brazilian 24 per cent and a South Korean spends only 14 per cent on food. Similar dispersion is seen across Indian states.
Based on these results, the estimated weight of food for India at today’s per capita income would be closer to 40 per cent instead of the current 45.8 per cent. It would likely further decline to around 30 per cent in a decade from now, due to the projected increase in per capita income levels. This correction itself should ameliorate concerns on account of food inflation being part of the inflation target.
5.4 Is a 4 Per Cent Midpoint for the Target Range Still Appropriate?
A number of other inflation-targeting emerging markets have reduced their point target for inflation as they gained experience with the regime and inflation came down (Appendix D). Thus, the Central Bank of Brazil reduced its target from 4.5 per cent in 2018 to 4.25 per cent in 2019, 4 per cent in 2020, 3.75 per cent in 2021, 3.5 per cent in 2022 and 3.25 in 2023. Indonesia reduced its target from 5 per cent in 2015–2017 to 3.5 per cent in 2018–2019 and 3 per cent in 2020. The Bank of Thailand effectively reduced its point target from 2.5 per cent to 1.5 per cent in 2020.
Compared to these other emerging markets, the RBI’s point target of 4 per cent is relatively high. Compared to these other cases, however, India is also a lower income, faster growing catch-up economy. As such, service-sector inflation in India will be relatively high, following from the Balassa–Samuelson effect. Such considerations suggest that a 4 per cent target is more appropriate for India than the advanced-country convention of 2 per cent.
5.5 Should the Tolerance Band Be Narrowed?
Similarly, the RBI’s tolerance band of ±2 per cent is relatively wide by emerging market standards. The Central Banks of Thailand and Indonesia have a ±1 per cent tolerance band, the Central Bank of Brazil a ±1.5 per cent tolerance band. It might be argued that allowing for relatively wide fluctuations of inflation weakens the anchoring effects of the regime and amplifies the volatility of inflation expectations.
Here the fact that inflation in India is heavily weighted towards food-price inflation, which is perturbed by climate variations, and towards energy-price inflation, which is affected by volatile world energy market conditions, militates against adopting a narrower tolerance band. Keeping inflation within a narrower range would likely require larger, more frequent variations in the policy interest rate. Such variations might create a less predictable climate for investment and hence challenges for economic growth. One wonders whether they would be conducive to financial development and financial stability.
In addition, if the world is, in fact, now entering a period of heightened economic and financial volatility, with geopolitical tensions, high and rising sovereign debts and deficits, and a shift away from trade liberalisation, keeping inflation within a narrow band will become even more challenging and require even wider, more frequent swings in interest rates. This is an additional argument against narrowing the RBI’s tolerance band at this time.
5.6 Should the RBI Take into Account State-level Variations in Inflation?
Inflation in India varies across states and regions, reflecting differences in incomes, agro-climatic conditions, population characteristics and sectoral economic mix. Occasionally one hears the argument that the MPC should pay special attention to Indian states where inflation is above or below its target range and adjust policy to bring their inflation rates back within the tolerance band. Households, it is argued, look to local inflation, not national inflation, when forming expectations, so ignoring these outliers runs the risk of de-anchoring expectations. Similarly, rural and urban inflation rates differ, reflecting differences in rural and urban consumption baskets. Looking only at average inflation, it might be argued, elevates the risk that one or the other of these two indices violates the tolerance range, again potentially de-anchoring expectations.
At the same time, there is some evidence of the convergence of state-level inflation rates over time and, in the long run, of urban and rural inflation rates moving together (Reserve Bank of India, 2021). Targeting outlying rates of inflation in one state or sector threatens to destabilise the rate of inflation in other states and sectors. Such is the merit of targeting the average.
5.7 Should Inflation Targeting Be Abandoned?
Abandoning inflation targeting would be an extreme alternative. The bulk of the evidence, as we read it, is that monetary policy has been more effective since the adoption of IT in 2016 than before. Monetary policy must be organised around a nominal anchor, be this a target for inflation, a target for the exchange rate, a target for the rate of growth of monetary aggregates or some other target. Inflation targeting has a better track record than these other options. It is relevant in this connection that, in contrast to other monetary regimes, no country that adopted an inflation targeting regime has abandoned it subsequently.
6. Conclusions
The RBI’s inflation targeting regime has worked well. Given this record, radical changes such as broadening its mandate or abandoning the target in favour of a more discretionary regime would be risky and counterproductive. In contrast, the 4 per cent point target, ±2 percentage point tolerance band and focus on headline inflation remain broadly appropriate. That said, the regime can be tweaked to improve performance. The weight of food-price inflation in the CPI inflation basket should be reduced to better reflect the circumstances of Indian households, for example. Suitably updated, the current inflation targeting regime should remain the framework for the country’s monetary policy for the foreseeable future.
Footnotes
Acknowledgements
We thank Ayesha Ahmed, Shubhashree Jha and S. Priyadarshini for research assistance.
Disclaimer:
The findings, interpretations and conclusions expressed in the article are those of the authors and do not necessarily reflect the views of the Governing Body or Management of NCAER.
Declaration of Conflicting Interests
The authors declared no potential conflicts of interest with respect to the research, authorship and/or publication of this article.
Funding
The authors received no financial support for the research, authorship and/or publication of this article.
Appendix A
Correlation Coefficients Between Variables in the Reaction Function
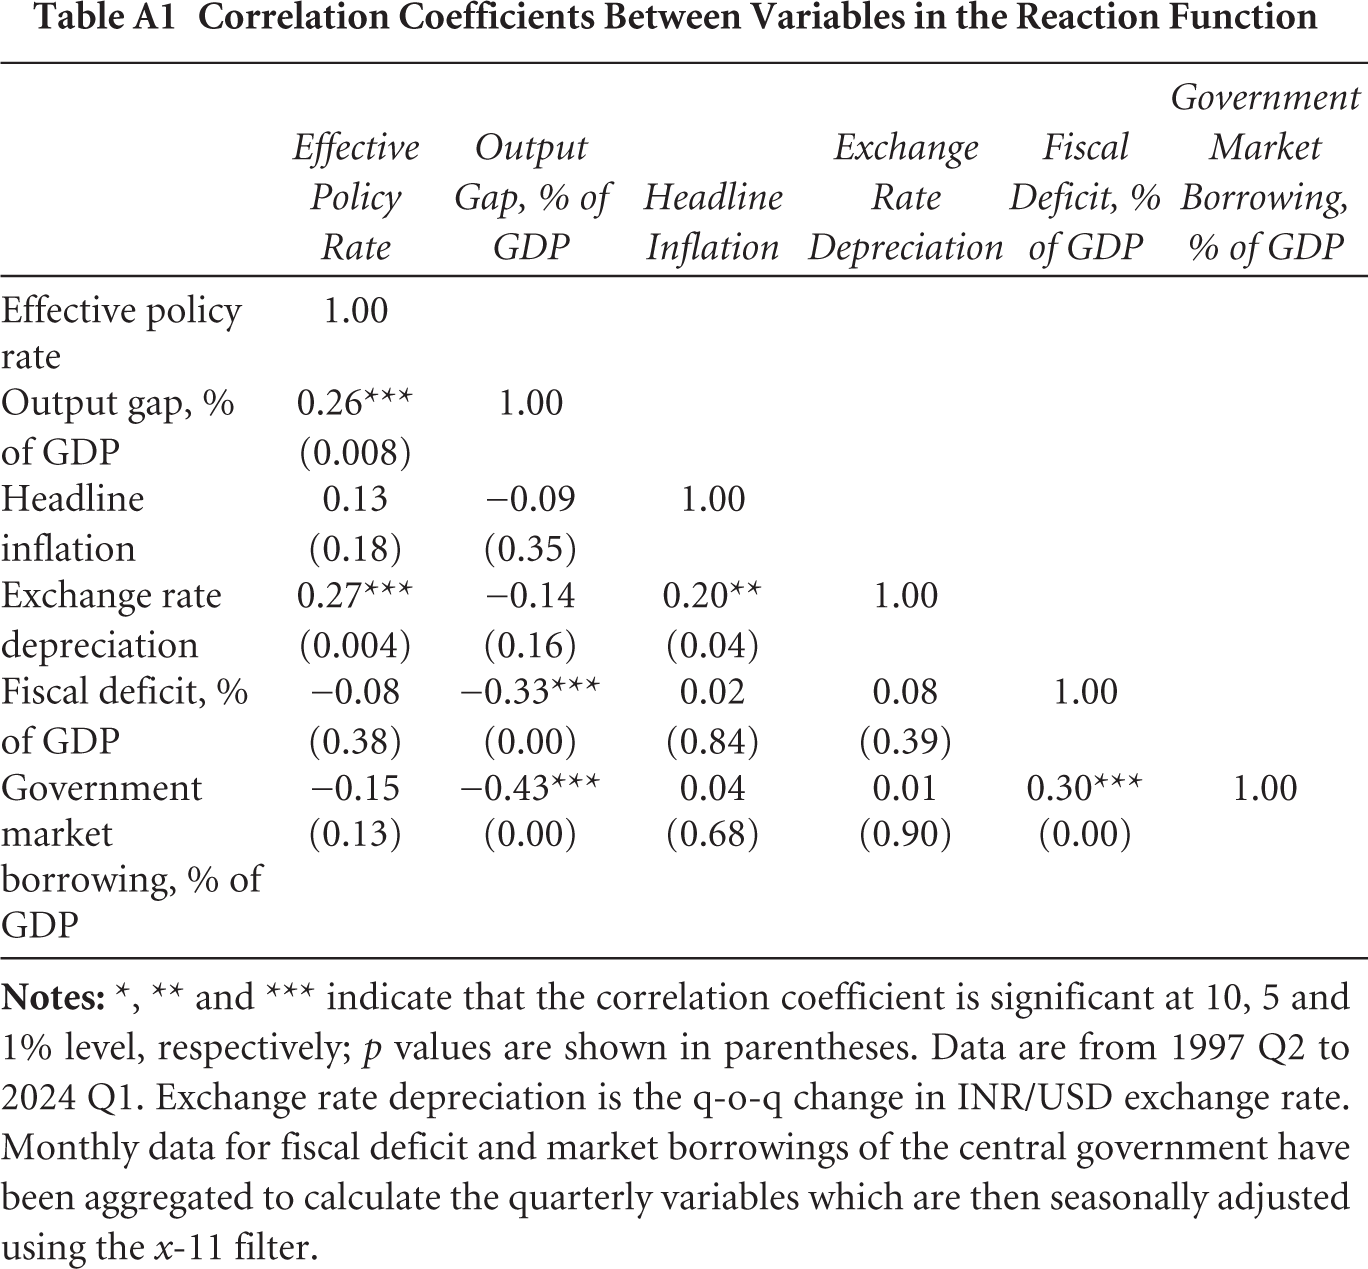
| Effective Policy Rate | Output Gap, % of GDP | Headline Inflation | Exchange Rate Depreciation | Fiscal Deficit, % of GDP | Government Market Borrowing, % of GDP | |
| Effective policy rate | 1.00 | |||||
| Output gap, % of GDP | 0.26*** (0.008) | 1.00 | ||||
| Headline inflation | 0.13 (0.18) | −0.09 (0.35) | 1.00 | |||
| Exchange rate depreciation | 0.27*** (0.004) | −0.14 (0.16) | 0.20** (0.04) | 1.00 | ||
| Fiscal deficit, % of GDP | −0.08 (0.38) | −0.33*** (0.00) | 0.02 (0.84) | 0.08 (0.39) | 1.00 | |
| Government market borrowing, % of GDP | −0.15 (0.13) | −0.43*** (0.00) | 0.04 (0.68) | 0.01 (0.90) | 0.30*** (0.00) | 1.00 |