
Abstract
Previous work has shown that L2-accented speech incurs a processing cost even when accurately understood. It remains unknown, however, whether an online processing cost is found when listeners process speech produced in L1 accents that are not their own. In this study, we examine this question by using comparative pupil dilation as a measure of cognitive load. Participants from the South of England heard sentences produced in four different accents: Southern British English (the listeners’ own familiar accent), American English (a standard L1 accent widely used in media), Glaswegian English (a less-familiar regional L1 accent), and Mandarin Chinese-accented English (an L2 English accent). Results show that Chinese-accented speech elicited significantly larger pupil dilation responses compared with Southern British English. Speech from less-familiar L1 accents elicited pupil dilation responses of different shapes and trajectories, suggesting differences in processing of these accents. Furthermore, participants showed larger mean pupil dilation when they heard relatively less-familiar L1 American-accented speech than when hearing Glaswegian English. Interestingly, this effect was found despite participants self-reporting that they were less familiar with the Glaswegian accent and found it more effortful to comprehend compared with American English. These results suggest that accurately perceived and highly intelligible L1 accents such as American English also incur a cognitive cost in processing, but to a smaller extent compared with L2-accented speech. We discuss the implications of our findings for the relationship between exposure, subjective effortfulness measures, and pupil dilation responses.
1 Introduction
Listening effort describes the allocation of cognitive resources to achieve accurate speech processing (see Pichora-Fuller et al., 2016). A relationship between speech intelligibility and listening effort has long been assumed, such that less intelligible speech is more effortful to process (see Van Engen & Peelle, 2014). While related, however, intelligibility and listening effort are not strictly coterminous, as listeners still exert different amounts of effort even when speech is accurately understood (Baese-Berk et al., 2023; Floccia et al., 2009). In this study, we examine how listeners process different accurately understood, less-familiar accents using pupillometry. Specifically, we are interested in testing if the degree of familiarity that listeners have with different L1 accents modulates their online listening effort.
It is well-known that listeners typically show processing benefits for L1 versus L2 speech (e.g., Munro & Derwing, 1995; see Baese-Berk et al., 2020 for a review). Models of working memory systems like the Ease of Language Understanding (ELU) model (Rönnberg, 2003; Rönnberg et al., 2008) posit that a mismatch between the phonological information in the signal and stored representations requires explicit (vs. implicit) resources to infer meaning. In accordance with this, current theories suggest that non-familiar accented speech requires more cognitive resources to match incoming phonetic input to mental representations, to allow for accurate speech comprehension (see Peelle, 2018; Van Engen & Peelle, 2014). Studies on cross-dialectal speech perception also show that listeners are slower and less accurate in perceiving speech produced in non-local or less-familiar accents than in a local and/or familiar accent (e.g., Adank et al., 2009; Clopper & Bradlow, 2008; Floccia et al., 2006; Impe et al., 2008; Kunkel, 2025; Smith et al., 2014; Sumner & Samuel, 2009; Walker, 2018).
Nonetheless, it is less clear, with regard to speech processing across L1 accents, whether different less-familiar accents are processed similarly in terms of the cognitive demands they incur. Studies examining the perception of different regional L1 accents among listeners sharing the same dialect show that perceptual accuracy of regionally accented speech is not necessarily equal across varieties (e.g., Bent et al., 2024; Best et al., 2013; Shaw et al., 2018, 2023). However, because these studies have not explored the online processing of different less-familiar L1 accents, the level of granularity involved in the accurate processing of different less-familiar accents remains unknown.
A related question that is particularly relevant to this body of literature is what is meant by “familiarity” in terms of accents. For instance, increased familiarity with an accent can arise either through local in-person exposure or through supralocal (i.e., non-local) sources such as media exposure (Stuart-Smith et al., 2013). However, it is unclear whether receiving exposure to an accent such as General American English via the media carries the same processing benefit that exposure from local conversational input does. Previous work on this has proven inconclusive: although Adank et al. (2009) find Glaswegian English participants to show processing benefits for Southern British English, an accent that they are exposed to in the media but not through regular, in-person input, Smith et al. (2014) do not replicate this effect, as they find Glaswegian listeners to show a perceptual disadvantage for Southern British English compared with their own variety.
Furthermore, differing theories have been proposed regarding how L1-accented versus L2 speech is processed (see Goslin et al., 2012; Thomas et al., 2022, 2025). On one hand, results showing similarities in processing cost across less-familiar L1 and L2 accents have led researchers to propose the Perceptual Distance Hypothesis (Clarke & Garrett, 2004), which predicts that regional L1 accents are processed using the same mechanisms as L2 speech. According to this view, L2 and less-familiar L1 accents exist on a scale of perceptual similarity to the listeners’ own speech, with varieties that are perceptually closer to a listener’s own accent (often other L1 accents) requiring a lower processing cost than those that are perceptually more distant (Floccia et al., 2006; Thomas et al., 2022). An alternative proposal, the Different Processes Hypothesis, suggests that different normalization mechanisms are recruited in the processing of L2 versus less-familiar L1 speech (Thomas et al., 2022, 2025) given that L2 speech contains less predictable variations from the listeners’ own accent (Floccia et al., 2009a, 2009b; Girard et al., 2008; Goslin et al., 2012). It remains unclear, however, whether the cognitive mechanisms and effort underlying the processing of different L1-accented varieties show varying levels of attenuation depending on the accent.
One approach to examining listening effort and processing in speech comprehension tasks is the use of physiological measures. One such measure, pupillometry, is a method for measuring changes in pupil size. As a physiological phenomenon, changes in pupil size are known to correlate with a number of factors. Beyond showing responsiveness to changes in luminosity and visual focus, pupils can also dilate as an index of shifts in attention and higher-level cognitive processes, such as heightened mental arousal (see Mathôt, 2018 for a recent review). Pupil size has also long been known to be associated with processing effort, such that when a task is more difficult, pupil size tends to increase (e.g., Hess & Polt, 1964; Kahneman & Beatty, 1966; Simpson & Hale, 1969). As a measure of listening effort, pupillometry holds several advantages over more explicit measures for examining listening effort (e.g., self-reported listening effort ratings). For instance, measuring pupil size through pupillometry yields granular responses, allowing for the more fine-grained distinctions between tasks that are more or less effortful (Winn et al., 2018). Pupil responses are also involuntary in nature and therefore resistant to response strategies on the part of listeners. Furthermore, because pupillometry is a time-series measurement that tracks changes in pupil size over time, it can provide a dynamic measure of how the allocation of cognitive resources changes over a specified time window, rather than providing a single static measure.
Although pupillometry has been used for decades in psychological research, it has only relatively recently been applied to the study of language processing. Past research has found pupil dilation responses as an index of listening effort arising from diverse aspects of the speech perception and production process. One body of research has shown that listener-related factors such as hearing impairment (e.g., Ohlenforst et al., 2017; Wagner et al., 2019; Zekveld et al., 2020), aging (e.g., Kuchinsky et al., 2016; Piquado et al., 2010; Zekveld et al., 2011), cognitive abilities (e.g., Koelewijn et al., 2012; Wendt et al., 2016), and non-native listener status (e.g., Borghini & Hazan, 2018) can affect listeners’ pupil size (see Zekveld et al., 2018 for a review). Another body of research has shown that degradation of the speech signal itself can result in larger pupil dilation responses (e.g., Colby & McMurray, 2021; McGarrigle et al., 2017; Neagu et al., 2023; Winn et al., 2015; Zekveld et al., 2010). Some recent research has also revealed that factors relating to the type of speech that listeners are exposed to, such as whether it was produced by an L1 or L2 speaker, can influence pupil size (e.g., Brown et al., 2020; McLaughlin & Van Engen, 2020; Porretta & Tucker, 2019).
Building on these results, the present study uses pupillometry to investigate whether processing speech in less-familiar L1 accents incurs a processing cost even if accurately understood. We build specifically on the findings by McLaughlin and Van Engen (2020), who used pupillometry to measure the listening effort involved in processing accurately understood sentences in General American and Mandarin Chinese-accented English by American English listeners. A larger pupil response was found for Chinese-accented than for American-accented speech, even when these sentences were accurately understood. These results were interpreted as showing that processing L2-accented speech imposes greater cognitive load than L1-accented speech on listeners, independent of intelligibility. This presumably reflects listeners’ need to recruit more cognitive resources when processing acoustic mismatches between the L2-accented speech and stored native representations, even though the outcome is ultimately successful comprehension. Pupillometry therefore allows us a window into the process of comprehension rather than simply its outcome.
Three main parameters have been used to quantify cognitive load in pupillometry research: mean dilation or the average pupil size; peak dilation amplitude or the maximum pupil size relative to the baseline; and peak latency or the time required for the dilation to reach its peak (Van Engen & McLaughlin, 2018; Zekveld et al., 2011). Although task-evoked pupil response may correlate with cognitive load regardless of the measure used to capture dilation (see Zekveld et al., 2018, p. 4), these parameters may correspond to subtly different aspects of processing. Mean dilation may indicate overall cognitive load across a trial (Van Engen & McLaughlin 2018). Peak dilation amplitude is said to correspond to the maximum point of cognitive effort (Van Engen & McLaughlin, 2018). Latency to peak dilation may reflect the speed with which information is being processed, with a longer latency reflecting slower processing (Shechter & Share, 2021; Zekveld et al., 2011). To account for all these elements, we follow McLaughlin and Van Engen (2020) in using growth curve analysis (GCA; Mirman, 2014) to model the trajectory of the pupil dilation response as a whole, before using static measures of the three parameters directly to examine potential correlations with self-reported exposure measures.
By modeling the size and the shape of the pupil dilation curve, GCA allows us to measure an additional fourth parameter, peak duration (i.e., the time that the pupil remains around peak dilation), which has been hypothesized to correlate with aspects of cognitive processing effort (Porretta & Tucker, 2019; Winn et al., 2015, 2018; Zekveld et al., 2011, 2018). Winn et al. (2015, 2018) posit that continued pupil dilation reflects the cognitive load required for linguistic processing, whereas peak amplitude is related to auditory demands. Other researchers, however, have suggested that a longer peak dilation represents a more sustained cognitive load over a period of time (Porretta & Tucker, 2019; Zekveld et al., 2011). In this study, we examine a range of accents with differing levels of familiarity to listeners: Southern British English as a familiar L1 accent, Mandarin Chinese-accented English as a less-familiar L2 accent, American English as a non-local L1 accent that listeners are likely to have media experience with, and Glaswegian English as a less-familiar L1 accent. The first aim of this study was to see whether the L1 versus L2 speaker effect that McLaughlin and Van Engen (2020) found could be replicated in another listener population (Southern British English participants). In addition, both American and Glaswegian English were included to test the effect of familiarity on listening effort in the processing of relatively less-familiar L1 varieties with differing profiles. Glaswegian English has previously been characterized as a “highly unintelligible native accent for [Southern English] listeners” (Adank et al., 2009: 521) and speech-in-noise perception experiments have shown Southern British English listeners to be less accurate in comprehending Glaswegian English compared with their own variety (e.g., Adank et al., 2009; Guo et al., 2023; Smith et al., 2014; Stringer & Iverson, 2019). As for American English, Southern British English listeners show less accuracy in transcribing American English speech compared with Southern British English speech (e.g., Walker, 2018). However, whereas Glaswegian English receives relatively little media representation in British media, American English receives wide exposure and is therefore likely to be relatively more familiar to Southern British English listeners (e.g., Smith et al., 2014). Furthermore, many previous studies have compared a regional non-standard L1 variety to a national standard within the same country (e.g., Adank et al., 2009; Smith et al., 2014), showing that listeners show a processing benefit for standard accents as well as their own variety (see Clopper, 2021). It is less clear how cognitive effort is affected by processing an external standard variety, which participants are mostly exposed to via the media.
In the current study, we are primarily interested in the effect of familiarity with L1 accents on processing, compared with processing L2-accented speech (Chinese-accented English). Given previous findings, we expect that Southern British English listeners will show relatively lower pupil dilation responses when processing their own dialect compared with L2 Chinese-accented English, as well as to less-familiar L1 accents (Glaswegian and American English). This study was not explicitly set up to examine the Perceptual Distance and Different Processes Hypotheses cited above, since we do not have a measure to quantify perceptual or acoustic distance between the different L1 accents. However, both hypotheses would likely predict a higher processing cost (larger dilation response) when listening to L2 Chinese-accented speech compared with a speech in non-local L1 accents, under the assumption that L2 accents are likely to be more perceptually distant from local L1 accents (Southern British English) compared with non-local L1 accents (American and Glaswegian English). More pertinently, if greater exposure, and therefore familiarity, to an L1 accent facilitates normalization, we predict that because of increased media exposure to American compared with Glaswegian English, listening to speech in the former accent should provoke a smaller dilation response than speech in the latter. As the two hypotheses outlined above relate to the processing of L1 versus L2 speech, they do not make predictions about how exposure to L1-accented speech influences cognitive load. Instead, we base this prediction on the fact that General American English is both a standard variety, and one to which we predict our participants to have substantial media exposure.
2 Method
2.1 Participants
In total, 60 adult listeners (48 F; 10 M; 1 Other; 1 preferred not to say) took part in this experiment. Participants were all native speakers of Southern British English who had been born in and had not spent more than a year outside of the South of England. Participants were also screened to ensure that their parents were not from the United States, China, or Scotland. Participants ranged in age from 18 to 30, with a mean age of 19.9 years (SD = 2.6). Participants were recruited through the Queen Mary University of London Psychology subject pool and wider student body and were either compensated with course credit or £10 in cash. All participants provided written informed consent, as approved by the Ethics Committee at Queen Mary University of London (QMERC22.298), at the beginning of the study. Prior to starting the experiment, following McLaughlin and Van Engen (2020), participants were screened with a pure tone audiometric test to ensure their hearing thresholds were at 25 dB or lower for octave frequencies from 250 to 8,000 Hz. Seventeen additional participants were recruited but excluded from the analyses as they either failed the audiometric hearing test (n = 10), were not born and raised in the South of England (n = 3), or had parents from the United States, China, or Scotland (n = 2). Data from two further participants were excluded due to equipment malfunction when running the experiment. This study was pre-registered on Open Science Framework (OSF), and all data and analysis scripts are accessible in our OSF repository: https://osf.io/hvz9t/?view_only=b35dd587a6304e0f8d4ec5888623d4d9.
2.2 Stimuli
Four speakers of different accents were used in the stimuli: an American English speaker, a Mandarin Chinese-accented L2 speaker of English, a Southern British English speaker, and a Glaswegian English speaker. To ensure comparability across studies, recordings from the same American and Chinese-accented speakers featured in McLaughlin and Van Engen (2020) were also used in this study. New recordings of a Southern British English speaker and a Glaswegian English speaker were made for this study. These new speakers were women in their twenties, matching the background of speakers used by McLaughlin and Van Engen (2020), and were recorded reading sentences in a sound-attenuated booth at Queen Mary University of London. Each speaker was instructed to read the same 160 sentences used by Van Engen et al. (2012) from a computer monitor. The stimuli used in McLaughlin and Van Engen (2020) were sampled from this set of sentences, which were originally modified from those in the Basic English Lexicon materials (Calandruccio & Smiljanic, 2012). Every sentence comprised six words and followed a similar syntactic structure, containing four keywords—all content words—that were scored for accuracy (e.g., “the hot sun warmed the ground” or “the new kitten climbed the tree”). Speakers were recorded using a SHURE SM10A unidirectional head-worn dynamic microphone and an Audient iD14 audio interface. Sentences were recorded in mono format into Audacity® Version 3.7.1 (Audacity Team) at a sampling rate of 44.1 kHz and a bit depth of 32-bit.
Thirty sentences were chosen from each speaker to be used in the experiment, giving a total of 120 sentences across speakers. Sentences from all speakers were subject to the same inclusion criteria, with attention paid to the fluency of the speech and voice quality (e.g., disfluent pronunciations or absence of modal voice). Given that the original sentences were designed for use with American participants, sentences containing vocabulary that may sound unusual in U.K. varieties of English, e.g., “soccer” and “garbage,” were also not included. The peak intensity of all sentences was scaled to 70 dB, and sentences were downsampled to 22.05 kHz in Praat (Boersma & Weenink, 2023), to match the sampling rate of the original stimuli for the American- and Chinese-accented speakers. Following McLaughlin and Van Engen (2020), the native speaker sentences were also acoustically lengthened using the stretch function in Adobe Audition CC, so that the average sentence length would be comparable to the slower L2 speaking rate to facilitate interpretation of the time course of pupil dilation curves. This was done by lengthening each native speaker’s sentences by a fixed amount (for each speaker) equal to the difference between the overall average duration of the Chinese-accented sentences and the average duration for sentences in each native accent. This ensured that each native speaker’s average sentence duration matched that of the Chinese-accented speaker. The length of the Chinese-accented sentences was not manipulated, and there were no significant differences found in the average sentence length across accent types after lengthening, as assessed by an analysis of variance (ANOVA) (F(3, 116) = 0.434, p = .729). Although speech rate is known to differ cross-dialectally (e.g., Jacewicz et al., 2009), the normalization of speech rate in this study means that the impact of this factor on processing cannot be determined here.
2.3 Procedure
At the start of the experiment, participants were asked to rest their chin on a head-mount approximately 75 cm from an Eyelink 1000 Plus (SR Research, Mississauga) camera positioned on a tabletop in a low-luminated room. The experiment was displayed to participants on a computer monitor behind the eye-tracking camera. The experimental procedure followed that of McLaughlin and Van Engen (2020). As in this previous study, red and blue fixation crosses were used as cues for participants. When the cross was red, participants were instructed to do their best not to blink and to blink freely whenever the cross was blue. Prior to each stimulus being played, participants were shown the red fixation cross in the middle of the screen for 3000 ms, during which a baseline measure of participants’ pupil sizes was obtained (see Figure 1). Following this, participants heard a sentence played through Audio-Technica ATH-M40x circumaural headphones while looking at the red fixation cross. Immediately after the end of the sentence, there was a 3000-ms pause during which the red cross remained on screen. Following this period, the fixation cross turned from red to blue, at which point participants repeated aloud the sentence they had heard. These responses were recorded onto a Zoom H2n handy recorder to ensure that participants had correctly understood the sentences. The experiment was self-paced, with participants instructed to press the spacebar on a keyboard placed in front of them whenever they were ready to move to the next trial (i.e., when the cross was blue and they had finished repeating the sentence). The same 120 sentences were presented in a different randomized order for each participant, with 30 unique sentences included from each accent condition. Ideally, sentences would have been counterbalanced for speaker across multiple lists. However, we could not fully rotate the full set of sentences based on the existing stimuli, given the exclusion criteria described above. Moreover, the choice to not counterbalance the sentence across speakers more closely adheres to the methods of McLaughlin and Van Engen (2020). To evaluate listeners’ subjective listening effortfulness ratings, participants were asked after every third trial to report how effortful they found it to be to understand the previous sentence they had heard. They used the keyboard to provide a response on a semantic differential scale from 1 to 9, with 1 representing “not effortful,” 5 representing “moderately effortful,” and 9 representing “extremely effortful.”
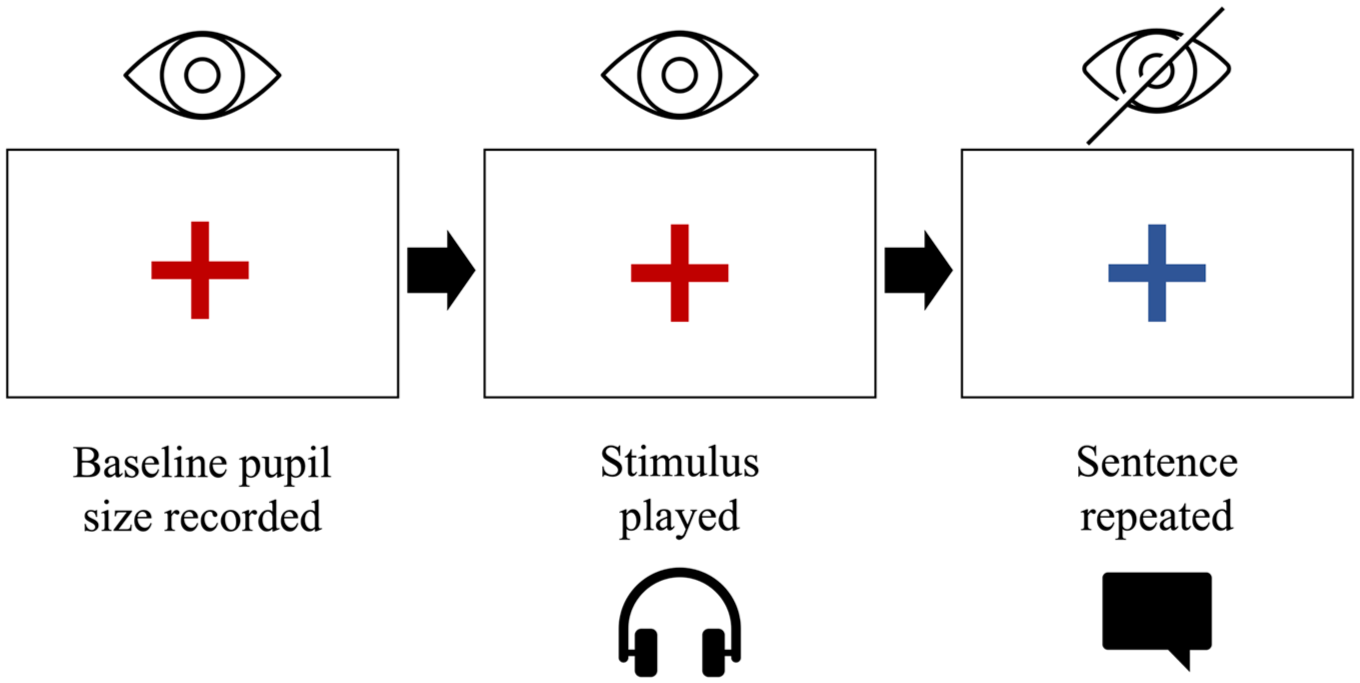
The main procedure of the pupillometry experiment.
After completing the experiment, participants completed a short questionnaire designed to gather participants’ demographic information, as well as information about their language backgrounds and their exposure to each of the four accents tested in the experiment. Adapting this latter measure from the accent exposure questionnaire used by D’Imperio & German (2015), participants were asked to indicate how much exposure they received to each accent in three different domains: social life, work life, and in the media they consume (see Appendix A for full questionnaire). Finally, participants were debriefed about the purpose of the study following completion.
2.4 Analyses
Since we were only interested in listeners’ processing of accurately understood sentences, recognition accuracy for sentences was first assessed by two researchers (the first authors) based on participants’ recordings. Trials in which any keywords were missed or inaccurately produced were excluded from the subsequent pupillometry analysis (n = 236, 3.28% of total trials). The subsequent steps taken to pre-process the time-course data closely followed those of McLaughlin and Van Engen (2020). First, the pupil dilation data were time binned at 20 ms intervals. The sampling rate of the eye tracker was set at 500 Hz, resulting in every 20 ms bin containing the averaged data of 10 samples. To remove noise in the data caused by blinking, intervals of missing pupil measures were identified and then expanded by 30 ms before blink onset (eyelid closing) and 160 ms after blink offset (eyelid reopening) to account for artifacts caused by eyelid movements. Moreover, if the value of a single sample in a time bin was missing, the averaging process yielded a missing value for the entire bin. For each trial, the period of 500 ms before the onset of the stimulus was defined as the baseline period. The baseline for each trial was calculated as the average pupil diameter of all time bins within the baseline period. Following this, average baseline measures were subtracted from the pupil diameter of every time bin within the trial period, to obtain measures of difference in dilation from the baseline across the time course of the trial. Then, an area of interest period was fit to the data, corresponding to the period 500 ms after the onset of the audio stimuli and 1000 ms after the average sentence offset time (2006 ms), following McLaughlin and Van Engen (2020). Trials that contained more than 50% of missing data either in the baseline or the area of interest period were omitted (n = 368, 5.1% of total trials). For trials that contained less than 50% missing data in those two periods, linear approximation was used to interpolate the pupil dilation response curve over the missing datapoints. Finally, to smooth the pupil data, we applied a rolling average with a sample width of five bins.
The time course of pupil dilation was statistically analyzed using GCA (see Mirman, 2014), as implemented in the R (version 4.3.1; R Core Team, 2023) package lme4 (Bates et al., 2015). This is in line with the methods of McLaughlin and Van Engen (2020, p. 153), who use GCA as it allows for (1) analysis of full pupil size and all data in the time course without having to average across trials, (2) indirect testing of peak pupil dilation by examining the slope and shape of a GCA model, and (3) reducing noise in the data that comes from averaging pupil dilation responses across trials for individual subjects. The time-course data were analyzed by modeling the
Self-reported effortfulness and accent exposure measures were included as predicting factors in additional exploratory linear mixed-effects models examining static pupillometry measures. We did this by deriving a set of static measures from the pupil time-series data, consisting of three measures calculated individually for each participant and trial. Each of these measures approximately corresponded to the curvilinear aspect captured by each of the three polynomial terms. The first measure was mean pupil dilation (calculated based on the average pupil size within the area of interest), the second was peak pupil dilation (derived based on the maximum pupil dilation within the area of interest), and the third was pupil dilation peak latency (quantified as the time at which pupil size reached its peak). These were implemented to (1) directly determine the impact of accent on each of these measures and (2) test the effect of exposure across participants (e.g., within a given accent) on pupil dilation response.
3 Results
3.1 Accent exposure ratings
As an initial confirmation of participants’ familiarity with the selected accents, we first analyzed the data from the self-reported accent exposure questionnaire. Figure 2 shows participants’ reported accent exposure ratings averaged across exposure in work settings, social settings, and in the media (see Appendix A for the full questionnaire). As expected, participants reported receiving the most exposure to their own accent (Southern British English; M = 5.94), a relatively high degree of exposure to American English (M = 4.54), and much less exposure to Chinese-accented English (M = 2.28) and Glaswegian English (M = 1.69). Interestingly, participants reported more exposure on average to Chinese-accented English than to Glaswegian English.
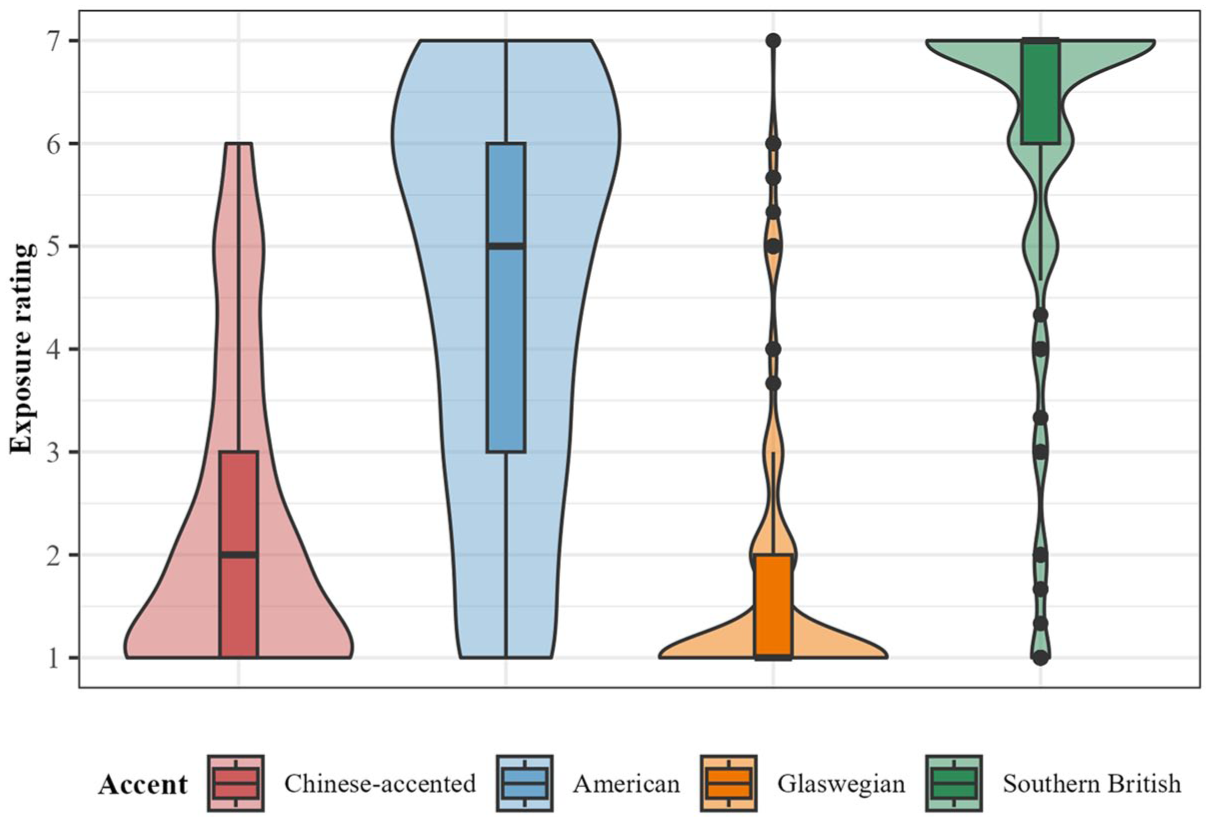
Mean exposure ratings by accent averaged across domains.
A simple linear mixed-effects regression model was fit to the exposure ratings, with composite
Results from this model revealed exposure ratings for Southern British English to be significantly higher than those for the other three accents. A post hoc pairwise comparison with the Tukey adjustment conducted between accents using emmeans (Lenth, 2024) revealed significant differences in reported exposure ratings between all four accents (Table 1).
Results of Pairwise Comparison Examining the Effects of Accent on Exposure Rating.
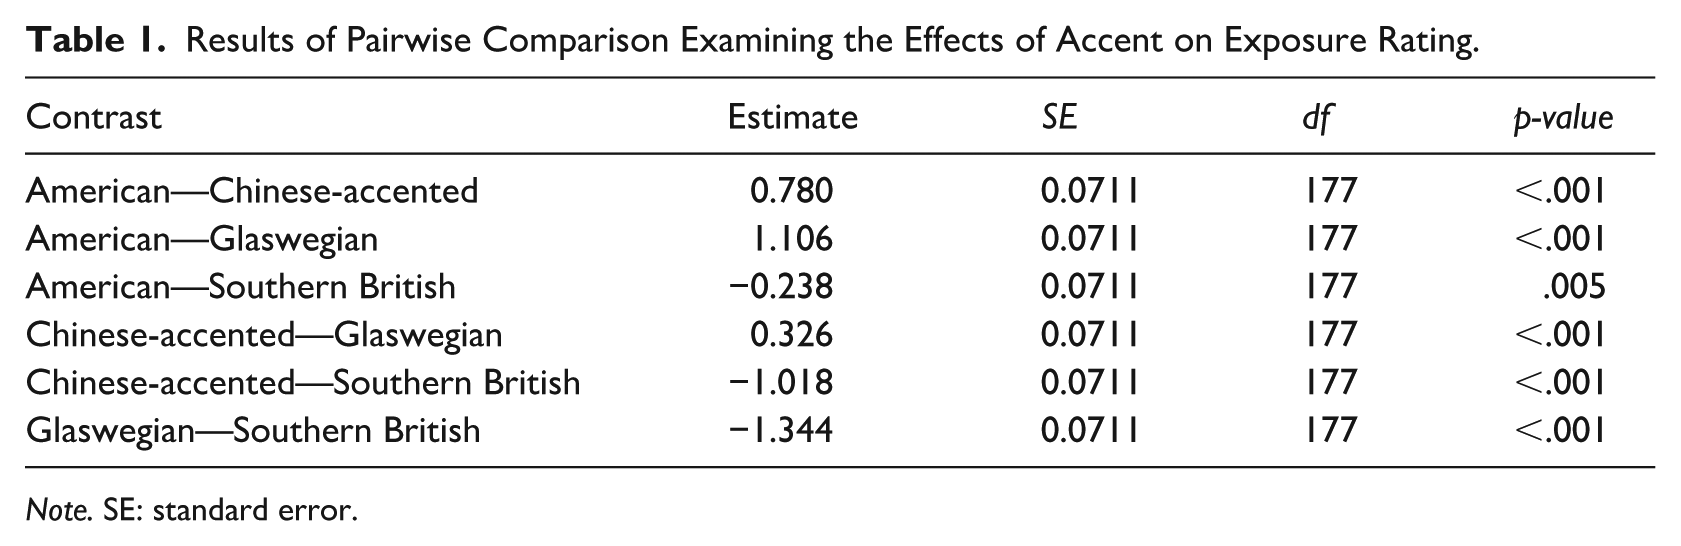
Note. SE: standard error.
Similar patterns were found for exposure ratings across domains (Figure 3), with high exposure to Southern British English reported across work, social, and media settings. Participants also reported relatively high exposure to American English across domains: not only did participants report high media exposure to American English (even exceeding that of Southern British English) but also considerable amounts of in-person input to American English in social and work settings. On the contrary, exposure ratings for Glaswegian English were consistently the lowest of all the accents across all three domains.
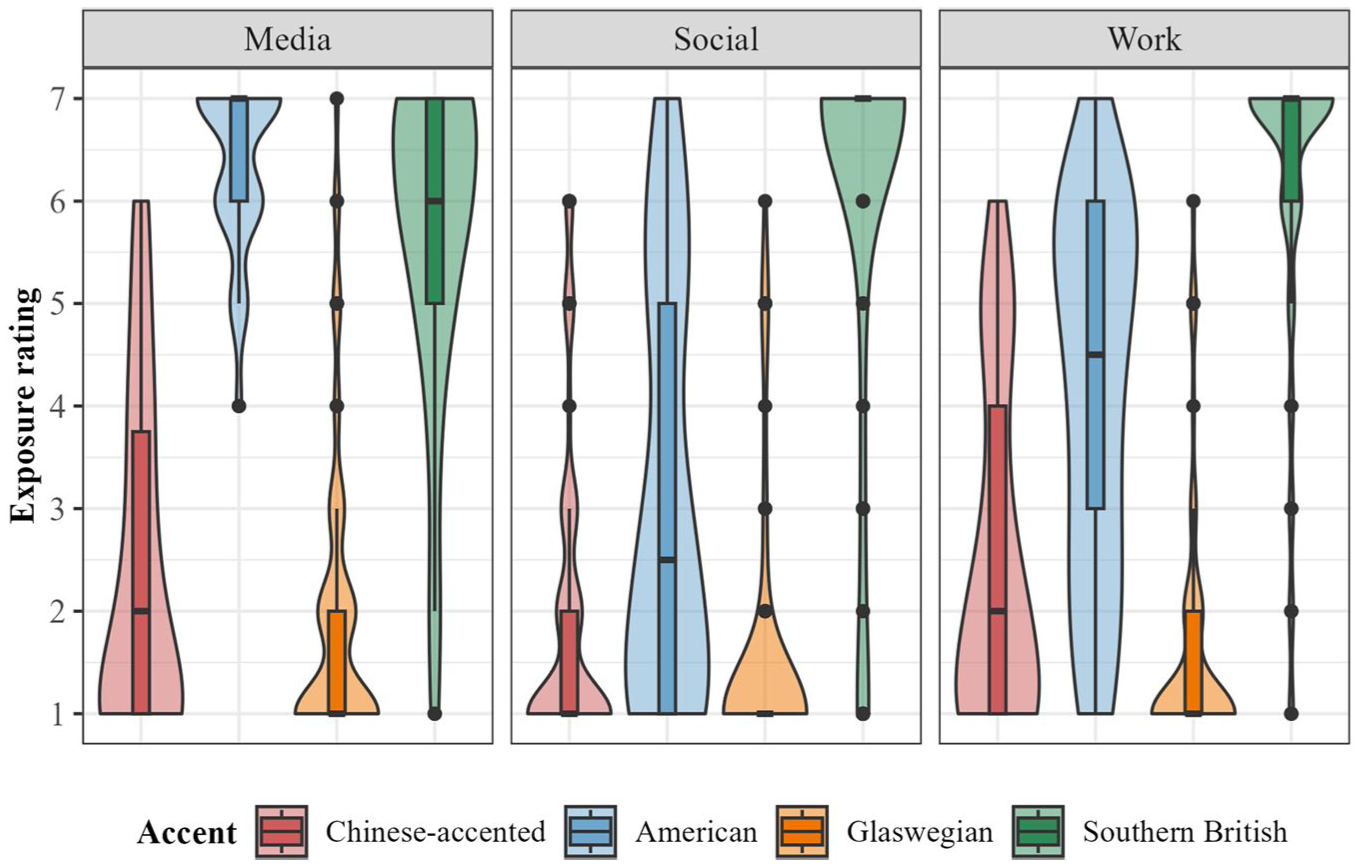
Accent exposure ratings by accent and social domain.
In sum, these results confirm our intuitions regarding Southern British English as a local and familiar L1 accent, American English as a non-local yet relatively familiar L1 accent, Glaswegian English as a non-local, less-familiar L1 accent, and Chinese-accented English as a less-familiar L2 accent. In the next section, we analyze whether participants’ differing exposure to these accents was also reflected in their subjective effortfulness ratings.
3.2 Effortfulness ratings
A total of 2,400 ratings were gathered across all accents in the effortfulness rating task, with each accent receiving an average of 600 ratings (range = 560–624) and each participant providing between 4 and 16 ratings per accent. Figure 4 shows the results from this task by accent. As expected, Chinese-accented sentences were rated as the most effortful and Southern British English the least effortful to understand. Comparing the two non-local L1 accents, both American English and Glaswegian English were rated as more effortful than Southern British English and less effortful than Chinese-accented English. American English was rated as slightly less effortful than Glaswegian English. This result aligns with the findings presented in the previous section, which showed that participants reported greater overall exposure to American English than to Glaswegian English.
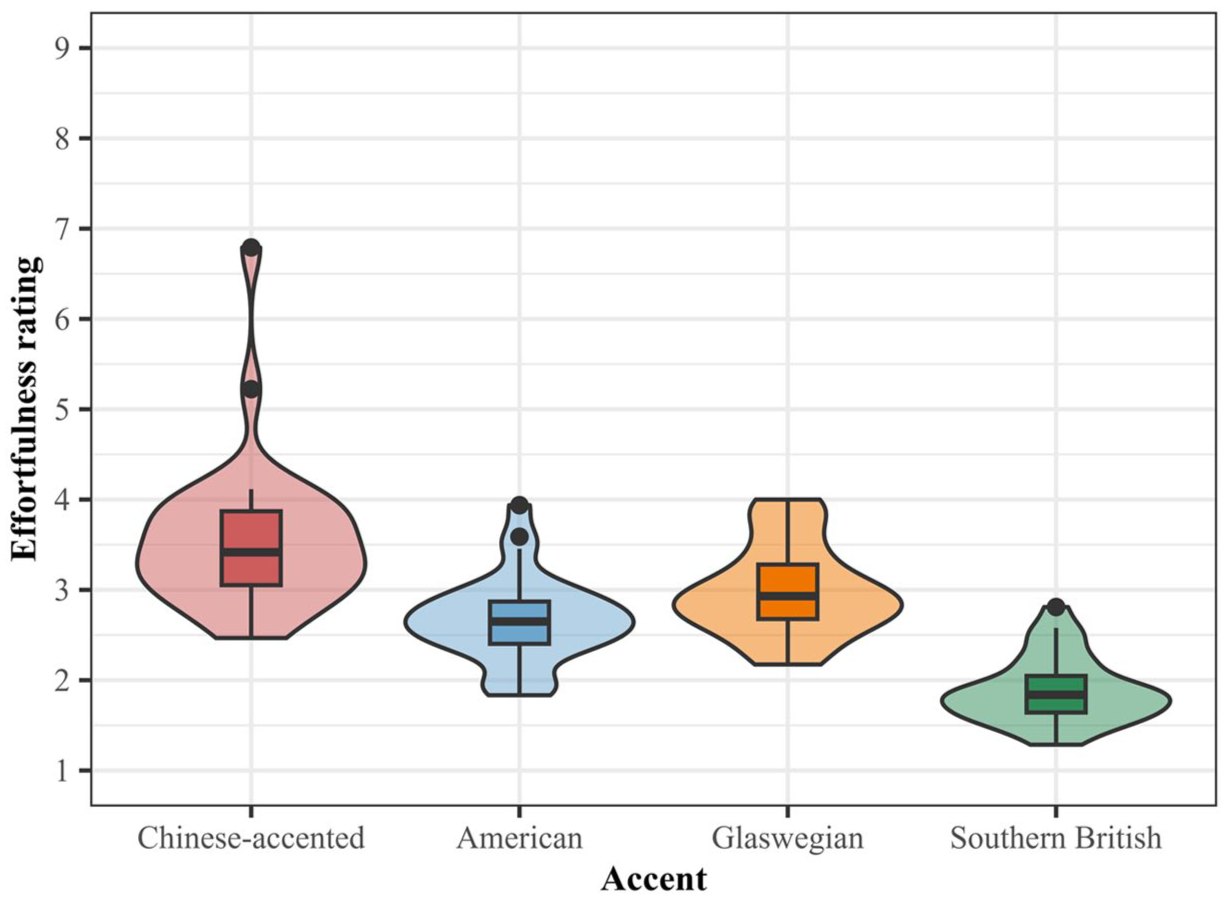
Subjective effortfulness ratings by accent.
Like for the exposure ratings, a simple linear mixed-effects regression model was run on these data to determine whether the four accents significantly differed in terms of their perceived effortfulness. This model included
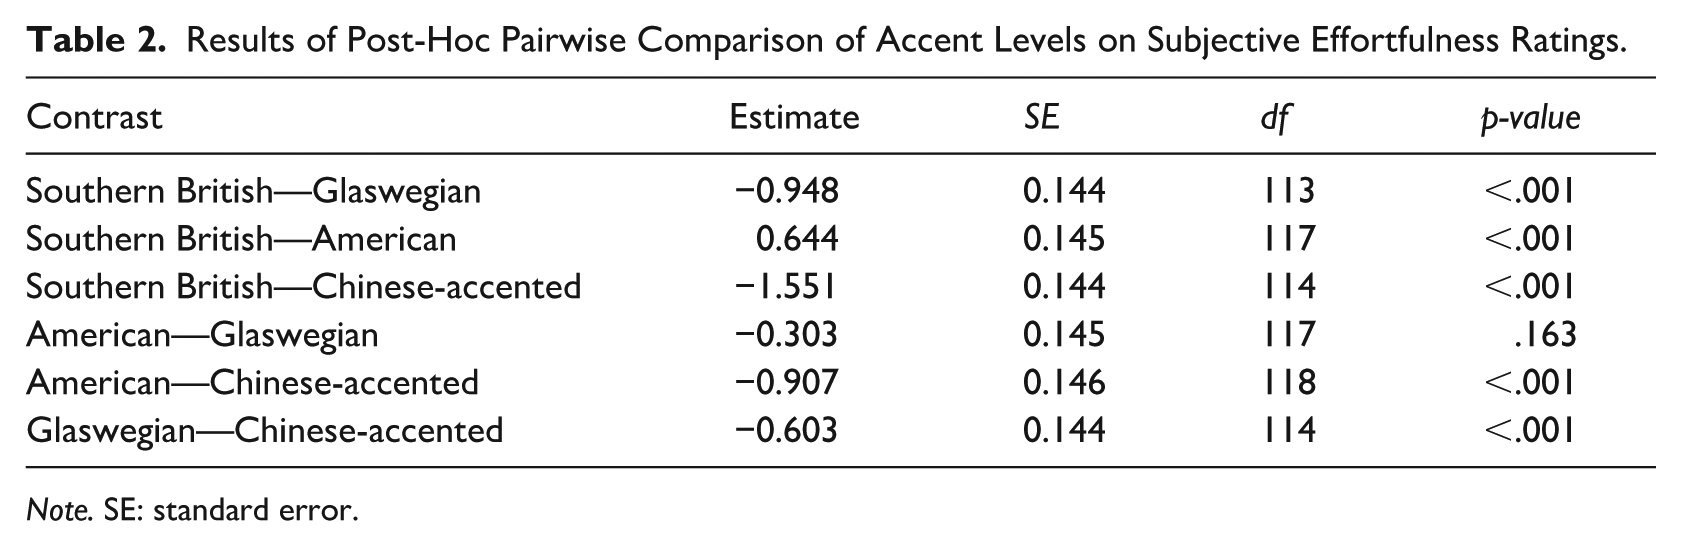
Model results showing Southern British English to be rated as significantly more effortful than the other three accents prompted us to run a post hoc pairwise comparison with Tukey adjustment to determine whether similar results were found between other accents. As shown in Table 2, significant differences in effortfulness ratings were found between American and Chinese-accented English (β = –0.907, SE = 0.146, p < .001) and between Glaswegian and Chinese-accented English (β = –0.603, SE = 0.144, p < .001), yet not between American and Glaswegian English (β = –0.303, SE = 0.145, p = .1636). In sum, the results in this section show effortfulness ratings to be highest for the L2 Chinese-accented English, lowest for the local, L1 Southern British English, and roughly similar for the non-local L1 American and Glaswegian English accents. In the next section, we compare these four accents in terms of their objective effortfulness, as operationalized through online pupil dilation response in the pupillometry task.
Results of Post-Hoc Pairwise Comparison of Accent Levels on Subjective Effortfulness Ratings.
Note. SE: standard error.
3.3 GCA results
In this section, we report results from comparisons between accent pairs, presenting both overall differences and specific differences in curvilinear response patterns. Figure 5 shows results for the averaged pupil dilation response time-course data by speaker accent. The trends displayed in this figure appear to support our prediction that non-native speech would elicit a larger pupil dilation response than native Southern British English speech, as shown by the higher peak for Chinese-accented English compared with Southern British English. Comparing the three native accents, American and Glaswegian English elicited overall larger pupil dilation responses compared with Southern British English. However, despite what we predicted, American English shows a notably larger pupil dilation response than Glaswegian English. Of the four accents tested, Southern British and Glaswegian English display the most similar overall pupil dilation patterns, although Glaswegian is shown to have elicited a slightly later and higher peak response.
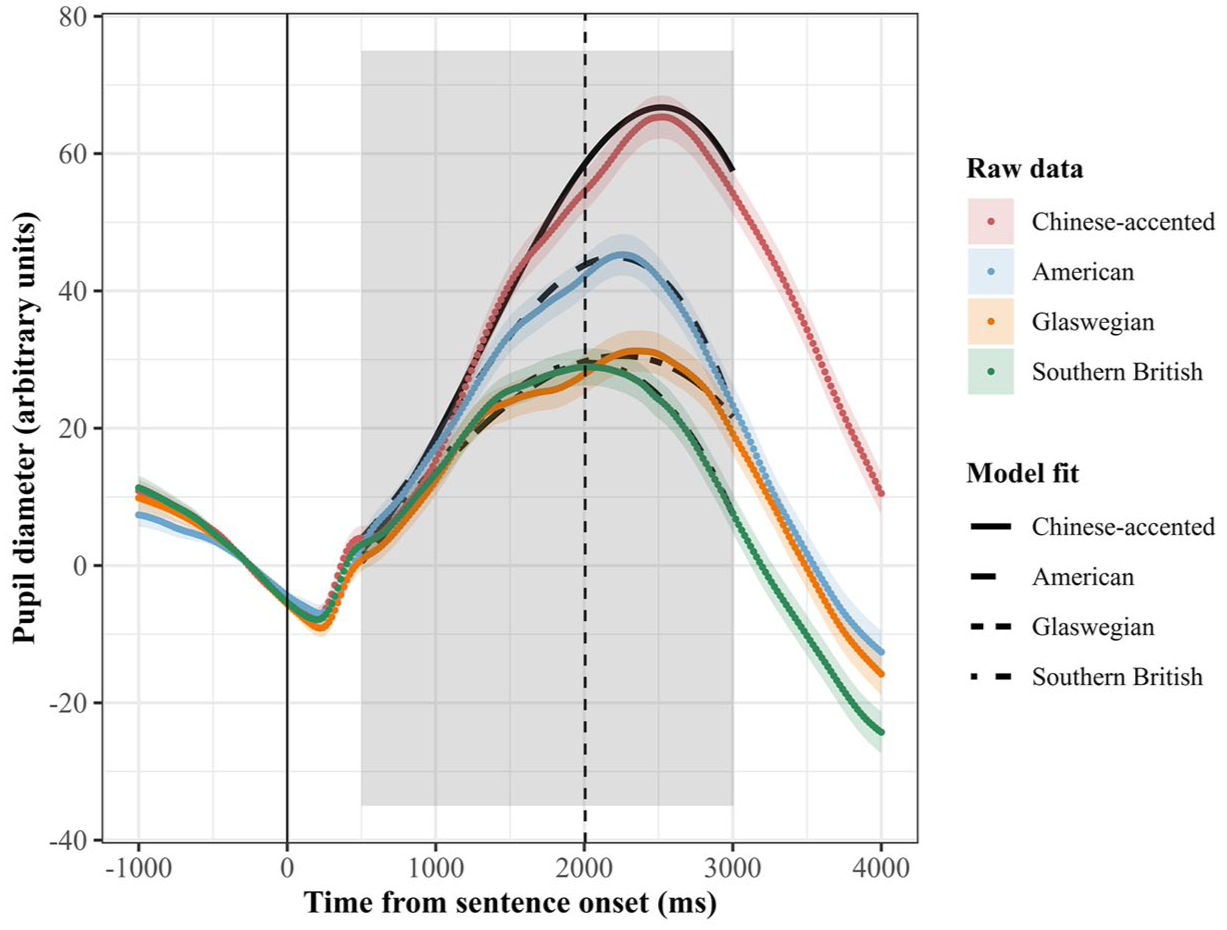
Global pupil dilation response time-course data by speaker accent.
To determine whether these observed results were supported statistically, we ran a mixed-effects linear regression model which included main effects for
Results from this Growth Curve Model revealed significant effects of accent on overall pupil dilation as well as in interaction with all three polynomial terms (see Appendix B for full model results). To determine specific differences in pupil dilation curves across the four accents, we ran pairwise comparisons on the main effect of Accent and its interaction with each of the polynomial terms (see Mirman, 2014, pp. 97–99). These comparisons allowed us to assess whether each pair of accents differed in specific curvilinear aspects of the response curve: overall magnitude (baseline effect of Accent), the slope (ot1), the inflection point (ot2), and the peak shape of the curve (ot3).
Results from this analysis (shown in Table 3) revealed several nuanced differences in the shape and timing of pupil response curves across accents. As expected, the non-native Chinese-accented condition elicited the largest overall pupil dilation (β = –22.97, SE = 5.15, p < .001) and the steepest increase in dilation over time (ot1) relative to Southern British English (β = –188.02, SE = 23.097, p < .001). This finding replicates the results of McLaughlin and Van Engen (2020) in showing non-native speech to elicit a larger pupil dilation response than familiar native speech. A novel finding here is that Chinese-accented English was also found to elicit significantly steeper pupil dilation responses compared with the non-local L1 American (β = 125.77, SE = 23.98, p < .001) and a larger magnitude (β = –21.27, SE = 5.36, p < .001) and steeper curve compared with Glaswegian English accents (β = –149.21, SE = 23.98, p < .001). In contrast, more subtle differences were found between the three native accents. Although overall pupil dilation did not differ significantly between native accents, American English tended to fall in between Southern British English and the Chinese-accented English in terms of magnitude. Significant differences did, however, emerge in the shape and timing of the pupil response curves. The slope of the dilation curve (ot1) was steeper for American English compared with Southern British English (β = –62.24, SE = 23.96, p = .046), although not steeper than the curve for Glaswegian English (β = –23.43, SE = 23.97, p = .762). However, Glaswegian did show a significantly flatter overall curve (ot2) compared with American English (β = 34.29, SE = 12.83, p = .038), suggesting a more prolonged period of peak dilation. Finally, differences in peak latency (ot3) were observed, with Glaswegian English eliciting an earlier peak dilation than Chinese-accented (β = 25.57, SE = 7.66, p = .004) and American English (β = 21.46, SE = 7.62, p = .025).
Pairwise Contrasts Between Listener Groups for Intercepts and Orthogonal Terms.
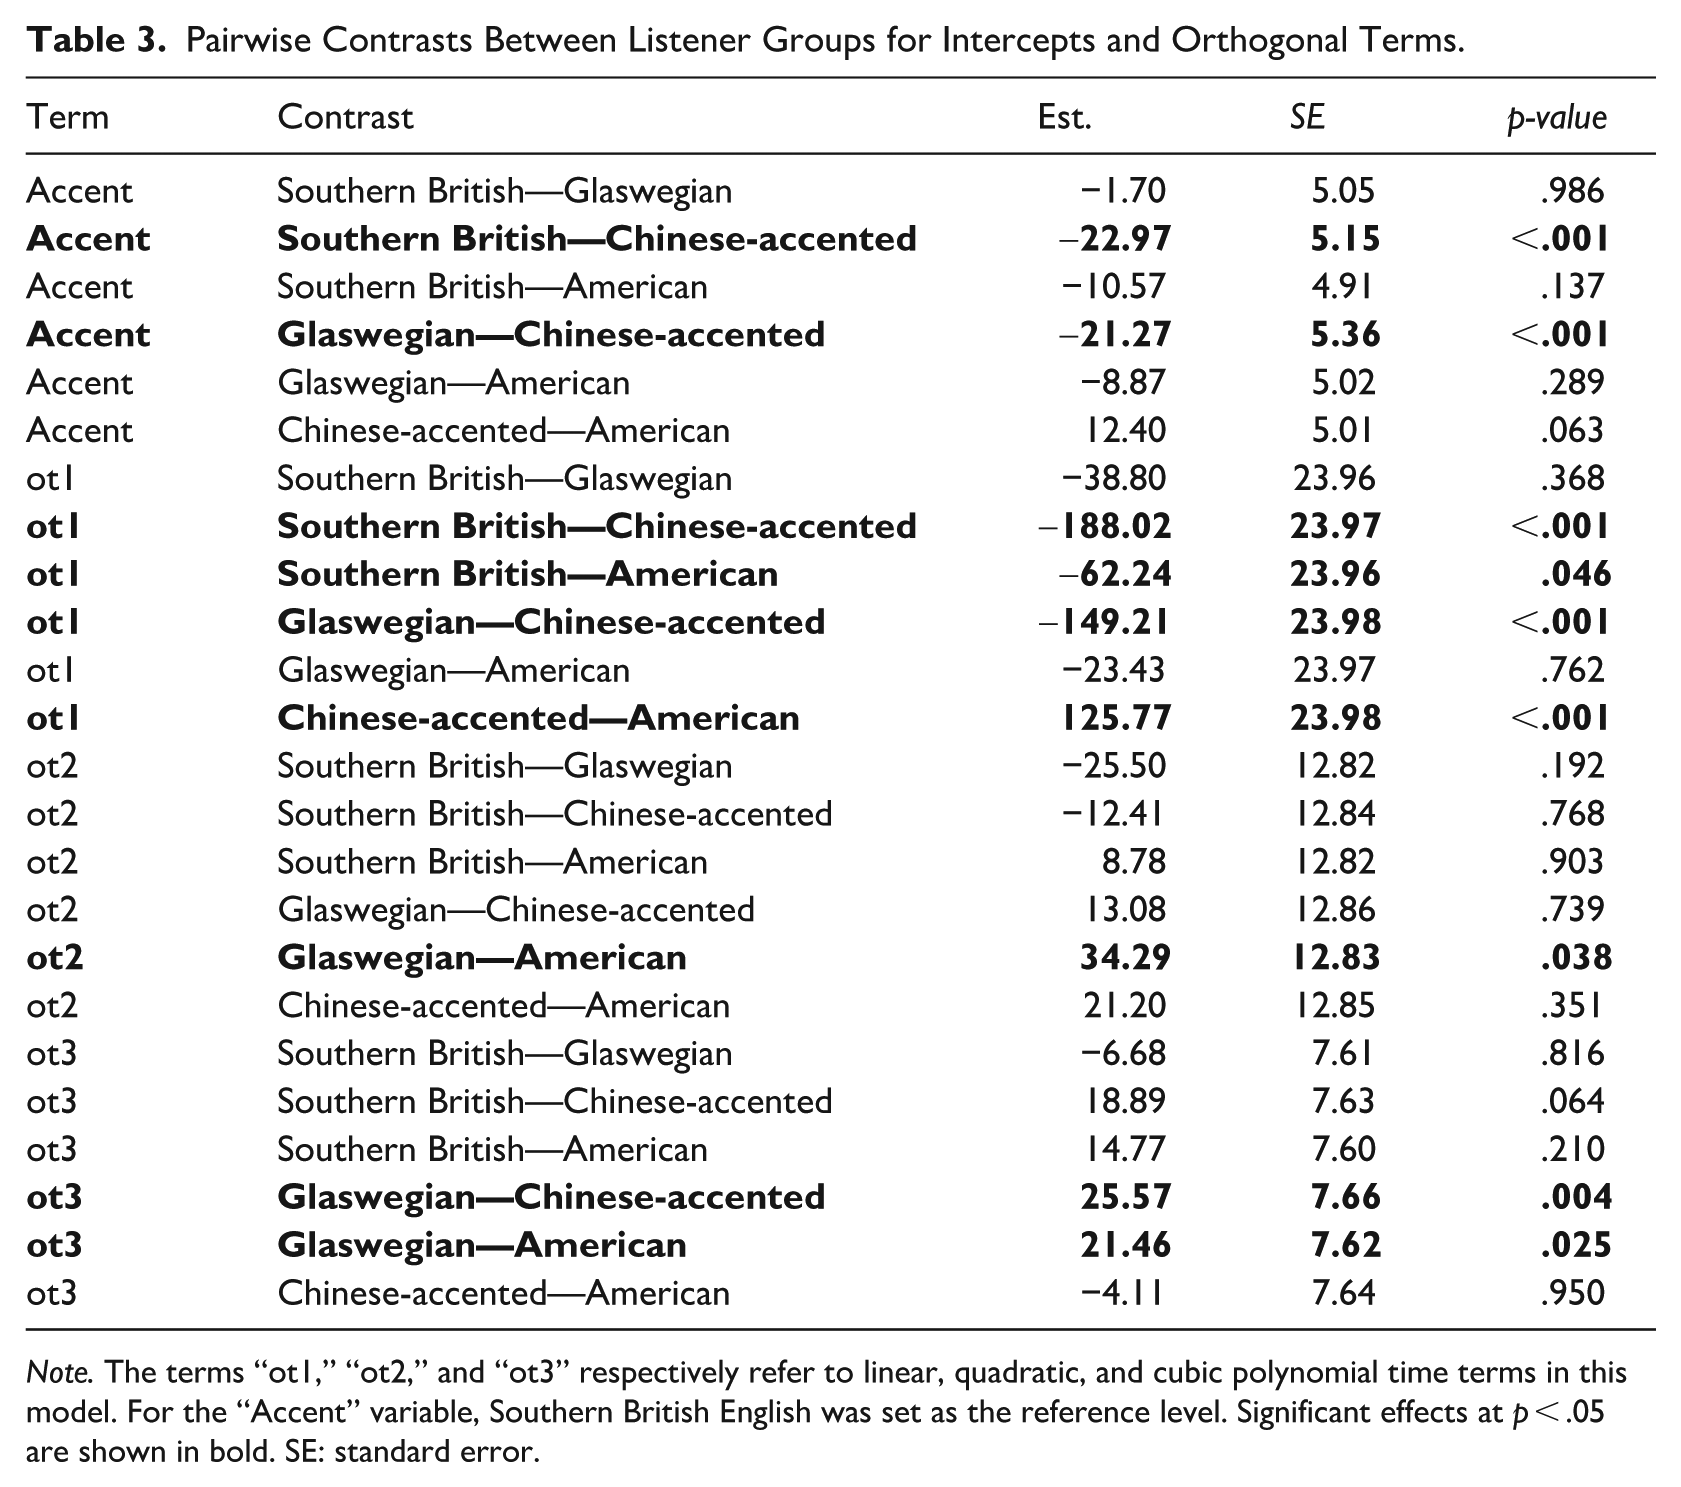
Note. The terms “ot1,” “ot2,” and “ot3” respectively refer to linear, quadratic, and cubic polynomial time terms in this model. For the “Accent” variable, Southern British English was set as the reference level. Significant effects at p < .05 are shown in bold. SE: standard error.
Together, two main findings can be taken from these results. First, non-native Chinese-accented stimuli incurred larger pupil dilation responses compared with native-accented stimuli. Second, although both American and Glaswegian English incurred numerically larger overall dilation responses compared with the local Southern British English, these non-local accents elicited different kinds of pupil responses, varying in peak amplitude, shape, and timing. In the following section, we further investigate accent exposure as factors that might account for the differences between these two non-local accents.
3.4 Testing effects of accent exposure on static dilation measures
We were also interested in examining if self-reported exposure to an accent was a better predictor of pupil dilation response than accent category. That is, do participants who are more regularly exposed to an accent show smaller pupil dilation responses, regardless of the accent? To examine this question, we ran three exploratory linear mixed-effects models with static measures of pupil dilation per trial as their respective outcome variables (
To assess the significance of main effects and interaction terms across the three static measure models, we conducted a series of model comparisons using log likelihood-ratio tests with the anova() function in R. Given that the results are parallel for all static measures, for brevity we report the result of these comparisons here and refer the reader to Table B1 in Appendix B for the full results of the model comparisons. Starting from the most complex model above, we first tested whether excluding the interaction term between
To determine whether the static measures differed significantly by accent, we ran separate pairwise comparisons on each static measure model. As shown in Table 4, these results generally align with the overall pattern observed in the larger GCA model (see Table B2 in Appendix B for full results). Chinese-accented English significantly differed from the native accents across all three static measures. Among the three native accents, Southern British and American English were found to differ only in mean pupil dilation, whereas no differences were found for any of the static measures between Southern British and Glaswegian English or between American and Glaswegian English. The fact that American English showed a significantly higher mean pupil size than Southern British English, yet not significantly higher than Glaswegian English, suggests that Glaswegian is intermediate between Southern British and American English in terms of the processing effort it incurred.
Summarized Results from Pairwise Comparisons between Accents for Static Dilation Measures.
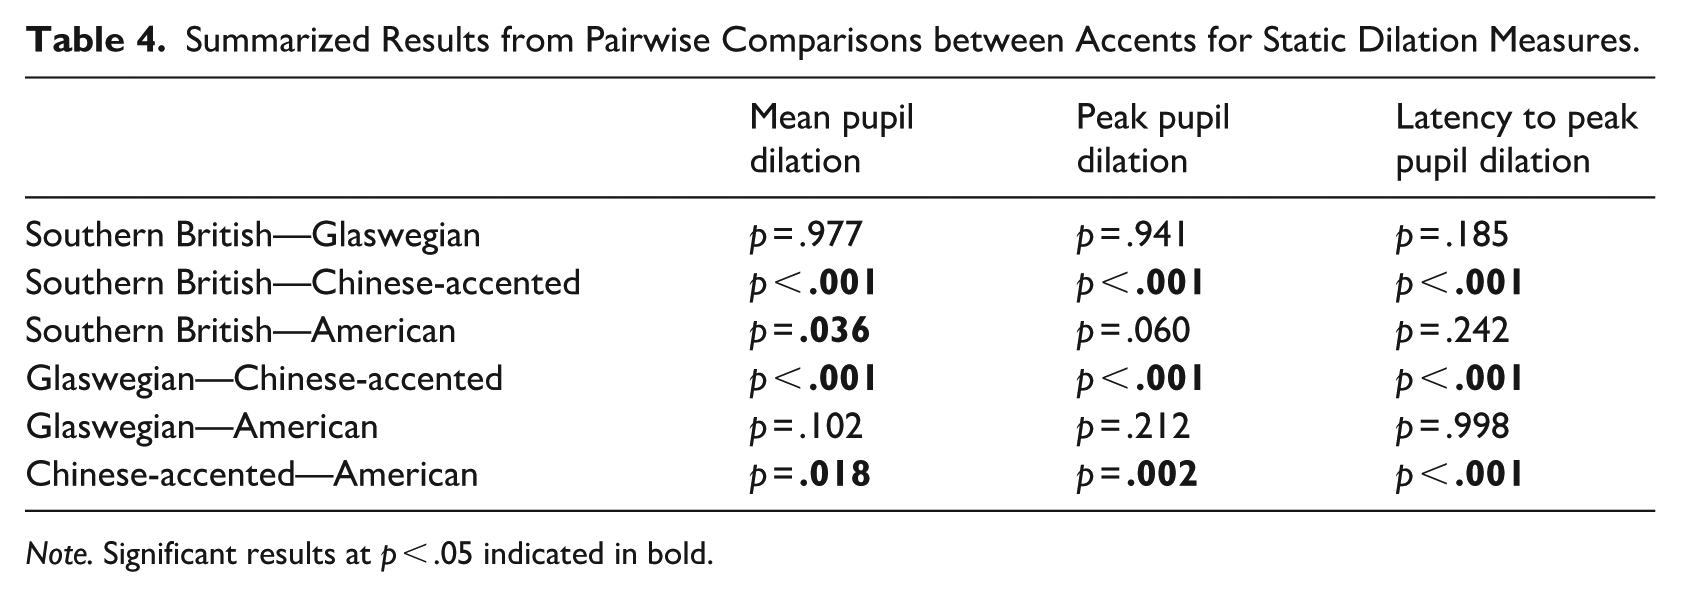
Note. Significant results at p < .05 indicated in bold.
4 Discussion
In this study, we set out to investigate whether accurate comprehension of different native and non-native accents incurs differences in cognitive effort, as measured through pupil dilation responses in speech processing. The main hypothesis of this study was that, compared with familiar L1 speech, less-familiar L1 speech would require more cognitive effort to accurately process but less effort than L2 speech. Supporting evidence would thus show that listeners’ pupil dilation response is greater when listening to less-familiar native accents than when listening to a familiar L1 accent, but smaller than when listening to an L2 accent. We additionally wanted to assess how different levels of accent familiarity influence cognitive load, which we tested by including an L1 accent, American English, a variety that we presumed participants would have extensive exposure to through media. This contrasted with Glaswegian English, a regional accent within the United Kingdom that is notoriously difficult for Southern British English listeners to process (Adank et al., 2009) and encountered relatively rarely in the media (Smith et al., 2014).
First, these intuitions regarding the familiarity of accents to our participants were confirmed by the results of the accent exposure measures, which showed participants to report high levels of exposure to Southern British English and American English, moderate exposure to Chinese-accent English, and low exposure to Glaswegian English. In terms of subjective effortfulness ratings, participant responses also followed the expected hierarchy, with Chinese-accented English rated as most effortful, followed by Glaswegian English, American English, and finally Southern British English. For pupil responses, we found that Chinese-accented speech evoked a larger response compared with native Southern British English, in keeping with the results of McLaughlin and Van Engen (2020). Interestingly, although listeners showed an overall smaller dilation response in the processing of all L1 accents compared with Chinese-accented speech, this pattern did not clearly follow the effortfulness hierarchy observed in the subjective measures. Whereas listeners showed a significantly larger overall dilation response (static measure) for American versus Southern British English, the difference in dilation response for Glaswegian compared with Southern British English did not reach significance. Although there were no significant differences in overall pupil dilation between the American English and Glaswegian conditions, the presence of significant differences between the accents’ quadratic and cubic polynomial time terms suggests listeners processed these accents differently. Specifically, Glaswegian English elicited a significantly flatter trajectory and later peak compared with American English, despite the two accents receiving comparable ratings on the subjective effortfulness measures. Interestingly, there were no significant differences between the respective shape and size of the pupil dilation response curves for Glaswegian and Southern British English, despite listeners showing less exposure to Glaswegian English, as well as providing higher subjective effortfulness ratings. Before discussing the implications of the pupil dilation results, we first discuss the implications of our findings for self-reported effortfulness and listener exposure across accents. Our results suggest that significant exposure to an accent through media, or even in social interaction, does not necessarily equate to lower subjective effortfulness ratings for this accent. This pattern is most apparent when considering the discrepancy between self-reported exposure to Chinese-accented English and subjective effortfulness in processing this accent. Although Southern British English listeners in the current study reported more exposure to Chinese-accented than to Glaswegian English, they judged Chinese-accented English as requiring more effort to process. This may provide tentative evidence for the notion that L2 speech is often more difficult to process, possibly due to the irregularities with which it diverges from a native accent, as predicted by the Different Processes Hypothesis (Thomas et al., 2022, 2025). Because our study was not set up to test the specifics of the Perceptual Distance Hypothesis (Clarke & Garrett, 2004), these results do not allow us to draw firm conclusions regarding the relative validity of this theory compared with the Different Processes Hypothesis. At a naive level, however, the Different Process Hypothesis predicts that we should see a binary differentiation in pupil dilation response between Chinese-accented English and all three L1 accents. On the other hand, the Perceptual Distance Hypothesis would have predicted similar shapes in the pupil dilation responses for American, Glaswegian, and Chinese-accented English, but possibly with different amplitudes based on how perceptually distant these accents are from Southern British English. Instead, we found a more complicated pattern where different components of the pupil dilation response differed across accent type. We return to a discussion of these different components below.
Further evidence for a discrepancy between subjective listening effort and prior exposure was found for American English. Overall, participants reported receiving high amounts of exposure to American English, particularly in media, where they reported hearing more American than Southern British English speech. This result provides an interesting case in which locality may be dissociated from familiarity, potentially motivating the investigation of these as distinct dimensions in future cross-dialectal perception research. Nonetheless, participants rated American English as significantly more effortful to process compared with Southern British English. This result parallels Smith et al.’s (2014) finding that perceptual challenges can arise even in the processing of an accent to which listeners receive extensive exposure in the media. This may also offer some support for the claim that media exposure is not sufficient for gaining native-like abilities to process a non-local L1 accent (see Nycz, 2019). Moreover, the fact that our participants reported receiving in-person exposure to American English in work and social contexts yet still rated this accent as effortful may suggest that, unlike immersive, everyday exposure to a second dialect (e.g., Kunkel, 2025; Walker, 2018), occasional, ambient exposure to a non-local L1 accent does not result in perceptual adaptation toward a non-local L1 accent.
With regard to the pupil dilation results, our findings are first consistent with previous studies showing that L2-accented speech (Chinese-accented English) requires more cognitive resources to process compared with speech in a listener’s own L1 accent (Southern British English; e.g., Goslin et al., 2012; Porretta et al., 2017; Porretta & Tucker, 2019; Romero-Rivas et al., 2015; Yi et al., 2014), even in situations where the speech itself is accurately comprehended (McLaughlin & Van Engen, 2020). Crucially, we found this pattern to generalize to a different listener population (U.K. English speakers), suggesting higher listening effort to be an inherent property of L2 speech processing. To ensure this effect is a function of the accents in question rather than being driven by listener responses to the specific speakers used for the stimuli in this study, future work could seek to replicate this finding with a wider range of speakers of Mandarin Chinese or other L1s.
The Chinese-accented speech was also rated as the most “effortful” by listeners and the native Southern British speech the least, suggesting a positive correlation between subjective effortfulness ratings and pupil dilation (as an index for cognitive load) for these two accents. However, the relationship between reported effortfulness in listening and pupil dilation response is less straightforward for less-familiar L1 accents than for L2 accents (see also Winn et al., 2018 on the weak link between subjective and objective measures of effort). In our study, listeners rated Glaswegian English roughly as effortful to understand as American English. In contrast, American speech elicited a significantly steeper pupil-dilation curve compared with Southern British English, whereas no such difference emerged between Glaswegian and Southern British English. A further difference showed Glaswegian to have evoked a longer pupil dilation response, as observed through a flatter dilation curve, compared with American English. These results point to the possibility that the different kinds of pupil responses evoked by American and Glaswegian English (i.e., peak amplitude versus peak duration) may index different aspects of the cognitive process and listening load (e.g., Beatty & Lucero-Wagoner, 2000). Although we did not directly measure peak duration as a static measure, previous work has suggested that a longer pupil dilation response may correspond to a more sustained processing effort over time (Porretta & Tucker, 2019). Zekveld et al. (2011) further suggested that a lower peak amplitude but relatively longer pupil dilation response in their study might have reflected “less deep” but sustained speech processing (p. 507). In the context of the present results, it is possible then that Glaswegian-accented speech was not processed as “deeply” but was processed more slowly than American English speech, corresponding to a longer peak dilation response.
Another potential source for the larger peak dilation amplitude elicited by American versus Glaswegian English may reside in the fact that pupil responses do not just index a single cognitive mechanism. Although pupil dilation responses to auditory stimuli are often examined as an index for “cognitive load,” pupil dilation can vary due to a range of input factors and individual listener factors (see Zekveld et al., 2018 for an overview). For example, a larger dilation response can result from affective valence of lexical items in both a first and second language (e.g., Toivo & Scheepers, 2019; Yao et al., 2023). Relatedly, pupil dilation has also been shown to be due to emotional arousal (e.g., Bradley et al., 2008). Surprisal and the unexpectedness of stimuli, together with salience (e.g., Ankener et al., 2018; Boswijk et al., 2020), have also been shown to result in larger dilation response. Furthermore, it is not yet known how exactly these different factors jointly affect pupil dilation responses (Winn et al., 2018; Zekveld et al., 2018). It seems plausible then that a combination of these factors could explain the larger mean amplitude (static measure) as well as the steeper slope found for American English relative to Glaswegian English. Although our data unfortunately do not allow for conclusive explanations to be drawn as to which of these factors best accounts for the results (nor why we found different pupil dilation response patterns in response to the two less-familiar L1 accents tested), we provide here some initial speculation as to a possible explanation of these differences. One possibility, for instance, is that Southern British English listeners in our study showed a larger dilation response when listening to American English stimuli due to listeners’ positive attitudes toward this accent. Hiraga (2005), for example, showed that British English participants rated standard American English consistently highly on both status and solidarity, whereas Received Pronunciation (an accent very similar to Southern British English) only received a high rank on status but not solidarity. This positive orientation toward standard American English may have increased positive emotional arousal, which resulted in a larger pupil dilation response. How exactly these different inputs and individual factors (including acoustic similarity between accents, as discussed earlier) affect pupil dilation should be investigated more systematically in future work.
An additional possibility is that the subjective effortfulness measures are less reflective of processing effort compared with automatic pupil dilation responses. This interpretation is supported by work showing weak correlations between subjective and objective measures of processing effort (Winn et al., 2018). For instance, it could be the case that the subjective effortfulness ratings were influenced by general social stereotypes about which accents are generally more intelligible than others, regardless of whether these beliefs reflect listeners’ actual level of cognitive effort. In our case, it is possible that listeners found it difficult to accurately gauge effortfulness and thus relied in their judgments on broader cultural stereotypes regarding American English as a standard accent and Glaswegian English as an accent that has a popular reputation for being difficult to comprehend (see Adank et al., 2009). Similar patterns are found in research showing that listeners’ speech intelligibility can be less accurate when they are led to believe a speaker is a non-standard speaker of an accent (e.g., Babel & Russell, 2015; Kutlu et al., 2022; Rubin, 1992). In a similar vein, it is possible that, in the current study, listeners’ social expectations of the Glaswegian English speaker are the main driver of the higher effortfulness rating for that variety, even though the involuntary physiological pupillary response suggests that Southern British English listeners seem to expend a similar amount of effort in processing Glaswegian and Southern British English. Future work should seek to disentangle the effects of stereotypes on both subjective responses and physiological responses like pupil dilation.
Despite the speculative nature of the discussion above, the results of this study do allow us to make several conclusions regarding the processing of L2 and regionally accented L1 speech. First, this study has shown that accurately understood less-familiar L1-accented speech requires more cognitive resources to process as compared with speech in a native and/or local accent. Crucially, this can be the case even in the processing of relatively familiar accents, as was found for American English. Relatedly, we found that relatively frequent exposure to a variety does not guarantee that subjective effortfulness ratings of this variety will be lower, nor does it guarantee reduced cognitive load in speech processing. Furthermore, just because two varieties are judged subjectively as being comparably effortful to understand does not mean that they evoke the same type of pupil response, as shown when comparing American to Glaswegian English. Our study was not set up to directly examine the different predictions of the Perceptual Distance Hypothesis and Different Processes Hypothesis with regard to differences in processing L1- and L2-accented speech. Future work would seek to quantify a distance metric for speaker accents (e.g., ACCDIST; Huckvale, 2004) to more directly examine whether processing of an accent is mediated by the perceptual distance of that accent to one’s own and how exposure affects this. Our current findings that L2 Chinese-accented English elicited a greater cognitive cost despite being more familiar than Glaswegian English suggest tentatively that exposure alone might not be sufficient to overcome the cost of processing an accent that is perceptually more distant to one’s own. This possibly suggests a greater influence for perceptual similarity than exposure.
The results of our current study also highlight the potential for future work employing pupillometry as an online measure for examining the processing of speech across accents. Specifically, more work should be done in the future to tease apart the roles of timing, shape, and magnitude of pupil response in the perception of accented speech. Finally, the accents in our current study were treated as ideologically neutral. However, sociolinguistic research has shown that accents carry ideological baggage and affective information that can influence both subjective ratings and physiological responses such as automatic eye movements and brain activity (e.g., D’Onofrio, 2018; Kutlu et al., 2022; Weissler & Brennan, 2020). Future sociolinguistic work could benefit from using pupillometry techniques to shed light on how socio-indexical factors play into online language processing.
5 Conclusion
This study supports previous research showing that even when speech is accurately comprehended, the cognitive effort required to process it can vary based on the accent in which it is produced. Our findings show that this pattern applies not only to L2 accents but also to less-familiar regional accents of listeners’ native language. Furthermore, we found that different regional accents can vary in their cognitive processing demands and that online measures of processing effort do not necessarily align with subjective effortfulness ratings or self-reports of accent exposure. These results highlight the utility of pupillometry as a sensitive tool for capturing real-time speech processing dynamics that may be obscured by less automatic measures. Future work should build on these findings through further investigation of how different components of pupil dilation responses may reflect unique aspects of processing effort, particularly as relating to the processing of accented speech. Such work will help to construct more comprehensive models of accent speech processing that integrate cognitive mechanisms, sociolinguistic exposure, and higher-level processes such as affect and expectation.
Footnotes
Appendix A
Appendix B
Full Specifications for Linear Mixed-Effects Regression Model Testing
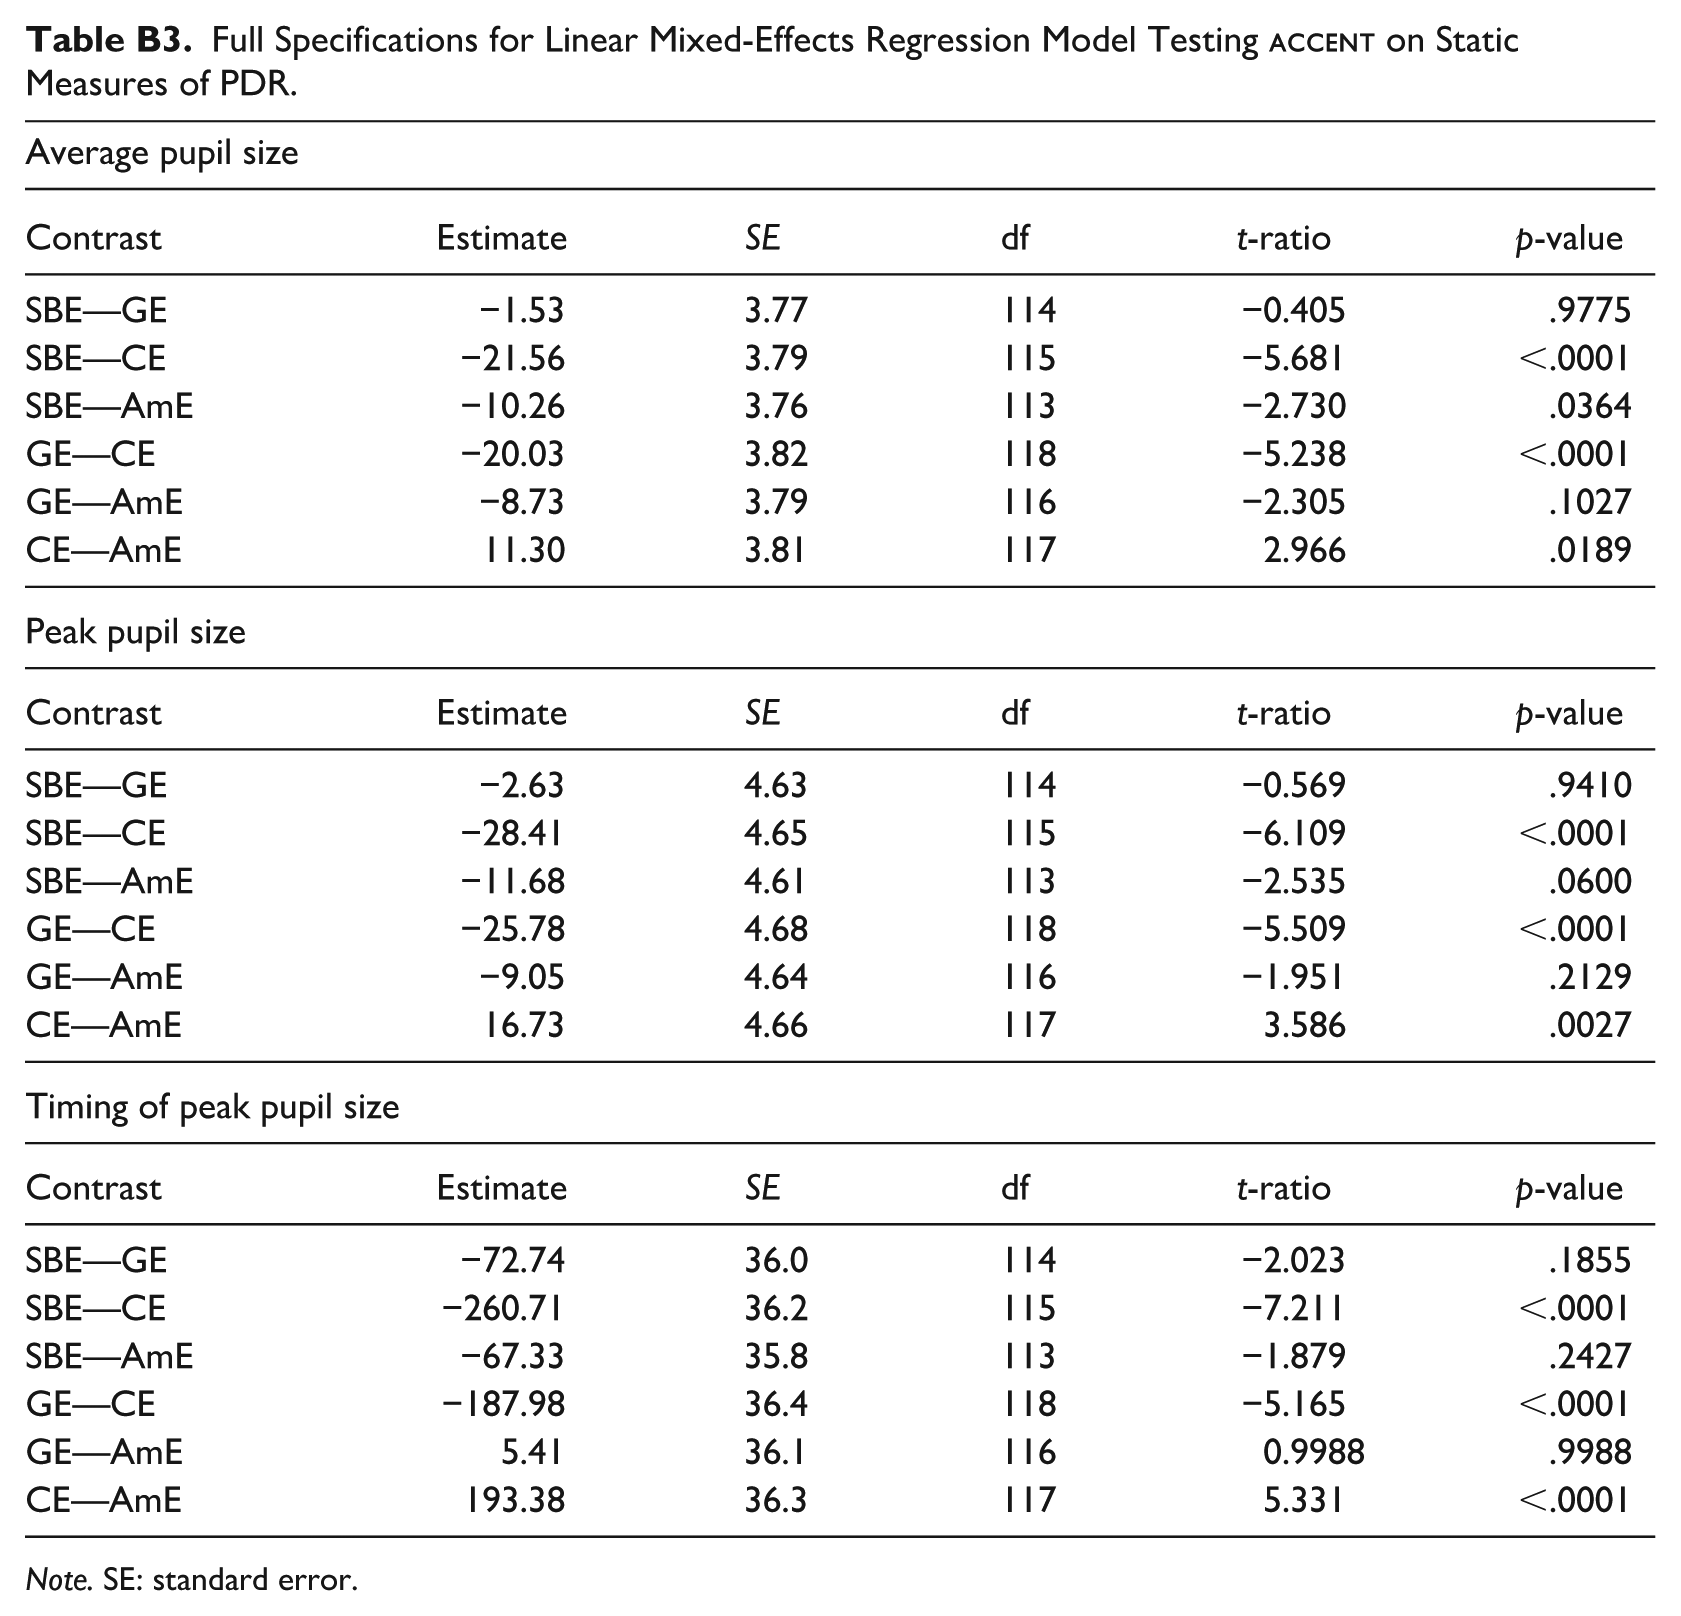
| Average pupil size | |||||
|---|---|---|---|---|---|
| Contrast | Estimate | SE | df | t-ratio | p-value |
| SBE—GE | −1.53 | 3.77 | 114 | −0.405 | .9775 |
| SBE—CE | −21.56 | 3.79 | 115 | −5.681 | <.0001 |
| SBE—AmE | −10.26 | 3.76 | 113 | −2.730 | .0364 |
| GE—CE | −20.03 | 3.82 | 118 | −5.238 | <.0001 |
| GE—AmE | −8.73 | 3.79 | 116 | −2.305 | .1027 |
| CE—AmE | 11.30 | 3.81 | 117 | 2.966 | .0189 |
| Peak pupil size | |||||
| Contrast | Estimate | SE | df | t-ratio | p-value |
| SBE—GE | −2.63 | 4.63 | 114 | −0.569 | .9410 |
| SBE—CE | −28.41 | 4.65 | 115 | −6.109 | <.0001 |
| SBE—AmE | −11.68 | 4.61 | 113 | −2.535 | .0600 |
| GE—CE | −25.78 | 4.68 | 118 | −5.509 | <.0001 |
| GE—AmE | −9.05 | 4.64 | 116 | −1.951 | .2129 |
| CE—AmE | 16.73 | 4.66 | 117 | 3.586 | .0027 |
| Timing of peak pupil size | |||||
| Contrast | Estimate | SE | df | t-ratio | p-value |
| SBE—GE | −72.74 | 36.0 | 114 | −2.023 | .1855 |
| SBE—CE | −260.71 | 36.2 | 115 | −7.211 | <.0001 |
| SBE—AmE | −67.33 | 35.8 | 113 | −1.879 | .2427 |
| GE—CE | −187.98 | 36.4 | 118 | −5.165 | <.0001 |
| GE—AmE | 5.41 | 36.1 | 116 | 0.9988 | .9988 |
| CE—AmE | 193.38 | 36.3 | 117 | 5.331 | <.0001 |
Note. SE: standard error.
Acknowledgements
We would like to thank the audiences from the Experimental Linguistics Research Group at Queen Mary University of London, the 2024 Colloquium of the British Association of Academic Phoneticians (2024) and at the 19th Conference on Laboratory Phonology (LabPhon 19), and particularly Jane Stuart-Smith and Sam Kirkham, for their helpful comments on earlier versions of this study. We would also like to thank Drew McLaughlin for allowing us to use the original stimuli from their study. We also thank the speakers who recorded the stimuli for this study. Finally, we thank the associate editor of Language & Speech, Cynthia Clopper, as well as two anonymous reviewers, for their insightful comments on earlier versions of this article. All remaining faults are our own. This research was partly funded by research startup funds to AJC from the School of the Arts at QMUL.
Author contributions
M.B. [co-first author]: Conceptualization; Data curation; Investigation; Methodology; Software; Visualization; Writing—original draft; Writing—review & editing.
S.K. [co-first author]: Conceptualization; Data curation; Investigation; Methodology; Software; Visualization; Writing—original draft; Writing—review & editing.
R.L.: Data curation; Formal analysis; Software; Visualization; Writing—review & editing.
A.J.C.: Conceptualization; Funding acquisition; Methodology; Project administration; Supervision; Writing—original draft; Writing—review & editing.
Funding
The authors disclosed receipt of the following financial support for the research, authorship, and/or publication of this article: Participant funds were supported by A.J.C.’s Research Start-Up Funds from the School of the Arts at Queen Mary University of London.
Declaration of conflicting interest
The authors declared no potential conflicts of interest with respect to the research, authorship, and/or publication of this article.
Ethical considerations
The Queen Mary Ethics of Research Committee approved this study protocol (reference: QMERC22.298) on 1 September 2022.
Consent to participate
Respondents gave written consent for review and signature before participating.