
Abstract
Animal models are widely used for studying diabetes in translational research. However, methods for induction of diabetes are conflicting with regards to their efficacy, reproducibility and cost. A comparison of outcomes between the diabetic models is still unknown, especially full-term pregnancy.To understand the comparison, we analyzed the streptozotocin (STZ)-induced diabetes at three life-different moments during the neonatal period in Sprague–Dawley female rats: at the first (D1), second (D2) and fifth (D5) day of postnatal life. At adulthood (90 days; D90), the animals were submitted to an oral glucose tolerance test (OGTT) for diabetic status confirmation. The diabetic and control rats were mated and sacrificed at full-term pregnancy for different analyses. Group D1 presented a higher mortality percentage after STZ administration than groups D2 and D5. All diabetic groups presented higher blood glucose levels as compared to those of the control group, while group D5 had higher levels of glycemia compared with other groups during OGTT. The diabetic groups showed impaired reproductive outcomes compared with the control group. Group D1 had lower percentages of mated rats and D5 showed a lower percentage of a full-term pregnancy. Besides that, these two groups also showed the highest percentages of inadequate fetal weight. In summary, although all groups fulfill the diagnosis criteria for diabetes in adult life, in our investigation diabetes induced on D5 presents lower costs and higher efficacy and reproducibility for studies involving diabetes-complicated pregnancy.
Introduction
Diabetes mellitus (DM) is a chronic and multifactorial disorder that involves continuous medical care, requiring blood glucose control to reduce injuries. The International Diabetes Federation estimates the diabetes prevalence in the adult (20–79 years) population, and it may increase to 9.9% or 628 million people in 2045. 1 Pre-gestational diabetes is termed pre-existing diabetes, states Type 1 or Type 2 (DM2) DM (DM1 and DM2 respectively), which are diagnosed before pregnancy. 2 Pre-existing diabetes is also one of the most common chronic diseases that affect pregnancy. A cohort study conducted in the UK found that 1 in 250 pregnancies had pre-gestational diabetes. 3 DM in pregnancy is a public-health risk, and is increasing in several countries. 4 The US government states that 2–10% of pregnancies are affected by gestational DM (GDM) every year, and about 50% of women presenting gestational diabetes will develop DM2 diabetes. 5
Pregnancy complicated by diabetes has an increased risk of pregnancy complications, such as the increased risk of spontaneous abortion and Cesarean section, and adverse birth outcomes (congenital anomalies and perinatal mortality).6,7 Since human studies have ethical issues and uncontrollable variables as limitations such as socioeconomic, nutritional and genetic factors, animal models are used to understand the physiological mechanisms of diabetes and its complications. 8 Due to its chemical properties, in particular, high stability streptozotocin (STZ) is the agent of choice for experimental diabetes models 9 because of its beta-cytotoxic action. Rakieten et al. described STZ as a diabetogenic agent in rats and dogs. 10 It can cause necrosis in pancreatic beta (β)-cells inducing insulin deficiency, 11 reproducing the glycemia and some metabolic alterations similar to those observed in DM1, DM2, or GDM in humans, but these results are dependent on animal age, STZ dose and administration route. 12
Studies in pregnant rats with STZ-induced diabetes before mating (40 mg STZ/kg body weight, intravenous route (i.v.)) showed hyperglycemia and absence of insulin synthesis and secretion similar to untreated human DM1. 13 Aiming to reproduce the glycemic levels observed in the DM2 population, Portha et al. were the first to induce diabetes in rats in the neonatal period using STZ. 14 The newborns received STZ on the first day of birth (100 mg/kg/, i.v.) and after four days, they presented higher glycemia, lower serum insulin levels, and decreased pancreatic content, confirming the diabetogenic action. On day 5 of life, these animals showed an abrupt decrease in blood glucose and an increase in insulin levels similar to those of non-diabetic animals due to a partial recovery of their pancreatic function. However, even with the restoration of pancreatic function, the animals still presented with glucose intolerance and decreased insulin response in adulthood. 14 In another study, Triadou et al. showed diabetes induction in the neonatal period stimulates the glycemic repercussions of human GDM. 15 Thus, over the last decade, STZ injection during the neonatal period has become a model widely used for experimental diabetes.16–18
Although many studies are performed using models with diabetes induced during the neonatal period, the criteria for inclusion of diabetic animals are unclear. In our laboratory, Dallaqua et al. considered rats that have presented with glycemia above 139 mg/dl at three time points in oral glucose tolerance tests (OGTTs) during pregnancy as mildly diabetic status, trying to approach an inclusion parameter routinely employed in the clinical practice. 19 However, Santos et al. considered that the cut-off point for mild diabetes classification is two or more values above 139 mg/dl during pregnancy, 20 while Gallego et al. included diabetic rats presenting glycemia above 200 mg/dl in two or more time points. 18 Since each experimental model presents limitations that are not sufficiently explored in the papers, it is important to know how each model performs before choosing the most appropriate and efficient method for understanding the reproductive outcomes of diabetes. Thus, this study aimed at evaluating STZ-induced diabetes at three different moments of the neonatal period in rats to compare the blood glucose levels during pregnancy in the adult life, and maternal and fetal repercussions at the end of pregnancy, so as to understand the most effective and ethical diabetic model for reproducing hyperglycemic status and outcomes of human pre-existing diabetes in Sprague Dawley rats.
Material and methods
Animals
Sprague Dawley female rats, obtained from the Multidisciplinary Center for Biological Research (CEMIB) of the University of Campinas (Unicamp), Brazil, were kept in polypropylene cages, a maximum of three rats/cage, and were maintained at Botucatu Medical School, São Paulo State University (UNESP), Brazil. The controlled laboratory conditions were: temperature (22 ±2°C), humidity (50 ±10%) and a 12-hour light-dark cycle, with ad libitum access to a commercial diet (Purina® rat chow; Brazil) and filtered water. The procedures and animal handling were performed following the guidelines provided by the Brazilian College of Animal Experimentation in agreement with the International Guiding Principles for Biomedical Research Involving Animals promulgated by the Society for the Study of Reproduction and were authorized by the Ethical Committee for Animal Research of the UNESP, Brazil (Process Number 1158-2015).
Obtaining of female pups
The female pups used in this study were obtained from 55 non-diabetic female rats mated overnight at 90 days of life with non-diabetic male rats. In the subsequent morning, the presence of sperm in the vaginal smear was designated as day 0 of pregnancy. Pregnant rats were randomly assigned for group composition by draw and, during pregnancy, the females were kept in individual polypropylene cages (435 mm × 290 mm × 150 mm) with environmental enrichment. Around day 21 of pregnancy, the rats had a vaginal delivery. Eight pups per dam were kept with their dams until weaning, considering the highest number of females wherever possible. The excess pups were euthanized by decapitation.
STZ-induced diabetes
The experimental design is shown in Figure 1. Diabetes was induced by STZ (Sigma-Aldrich, St. Louis, MO, USA) in the neonatal period of life. After obtaining pups, STZ diluted in citrate buffer (0.10 M, pH 4.5, Sigma-Aldrich) was injected into the female offspring for diabetes induction, subcutaneously (s.c.). Control animals were injected only with citrate buffer (vehicle) under similar conditions to that performed for the diabetic group. STZ was administered in female pups after birth by experimental groups below:
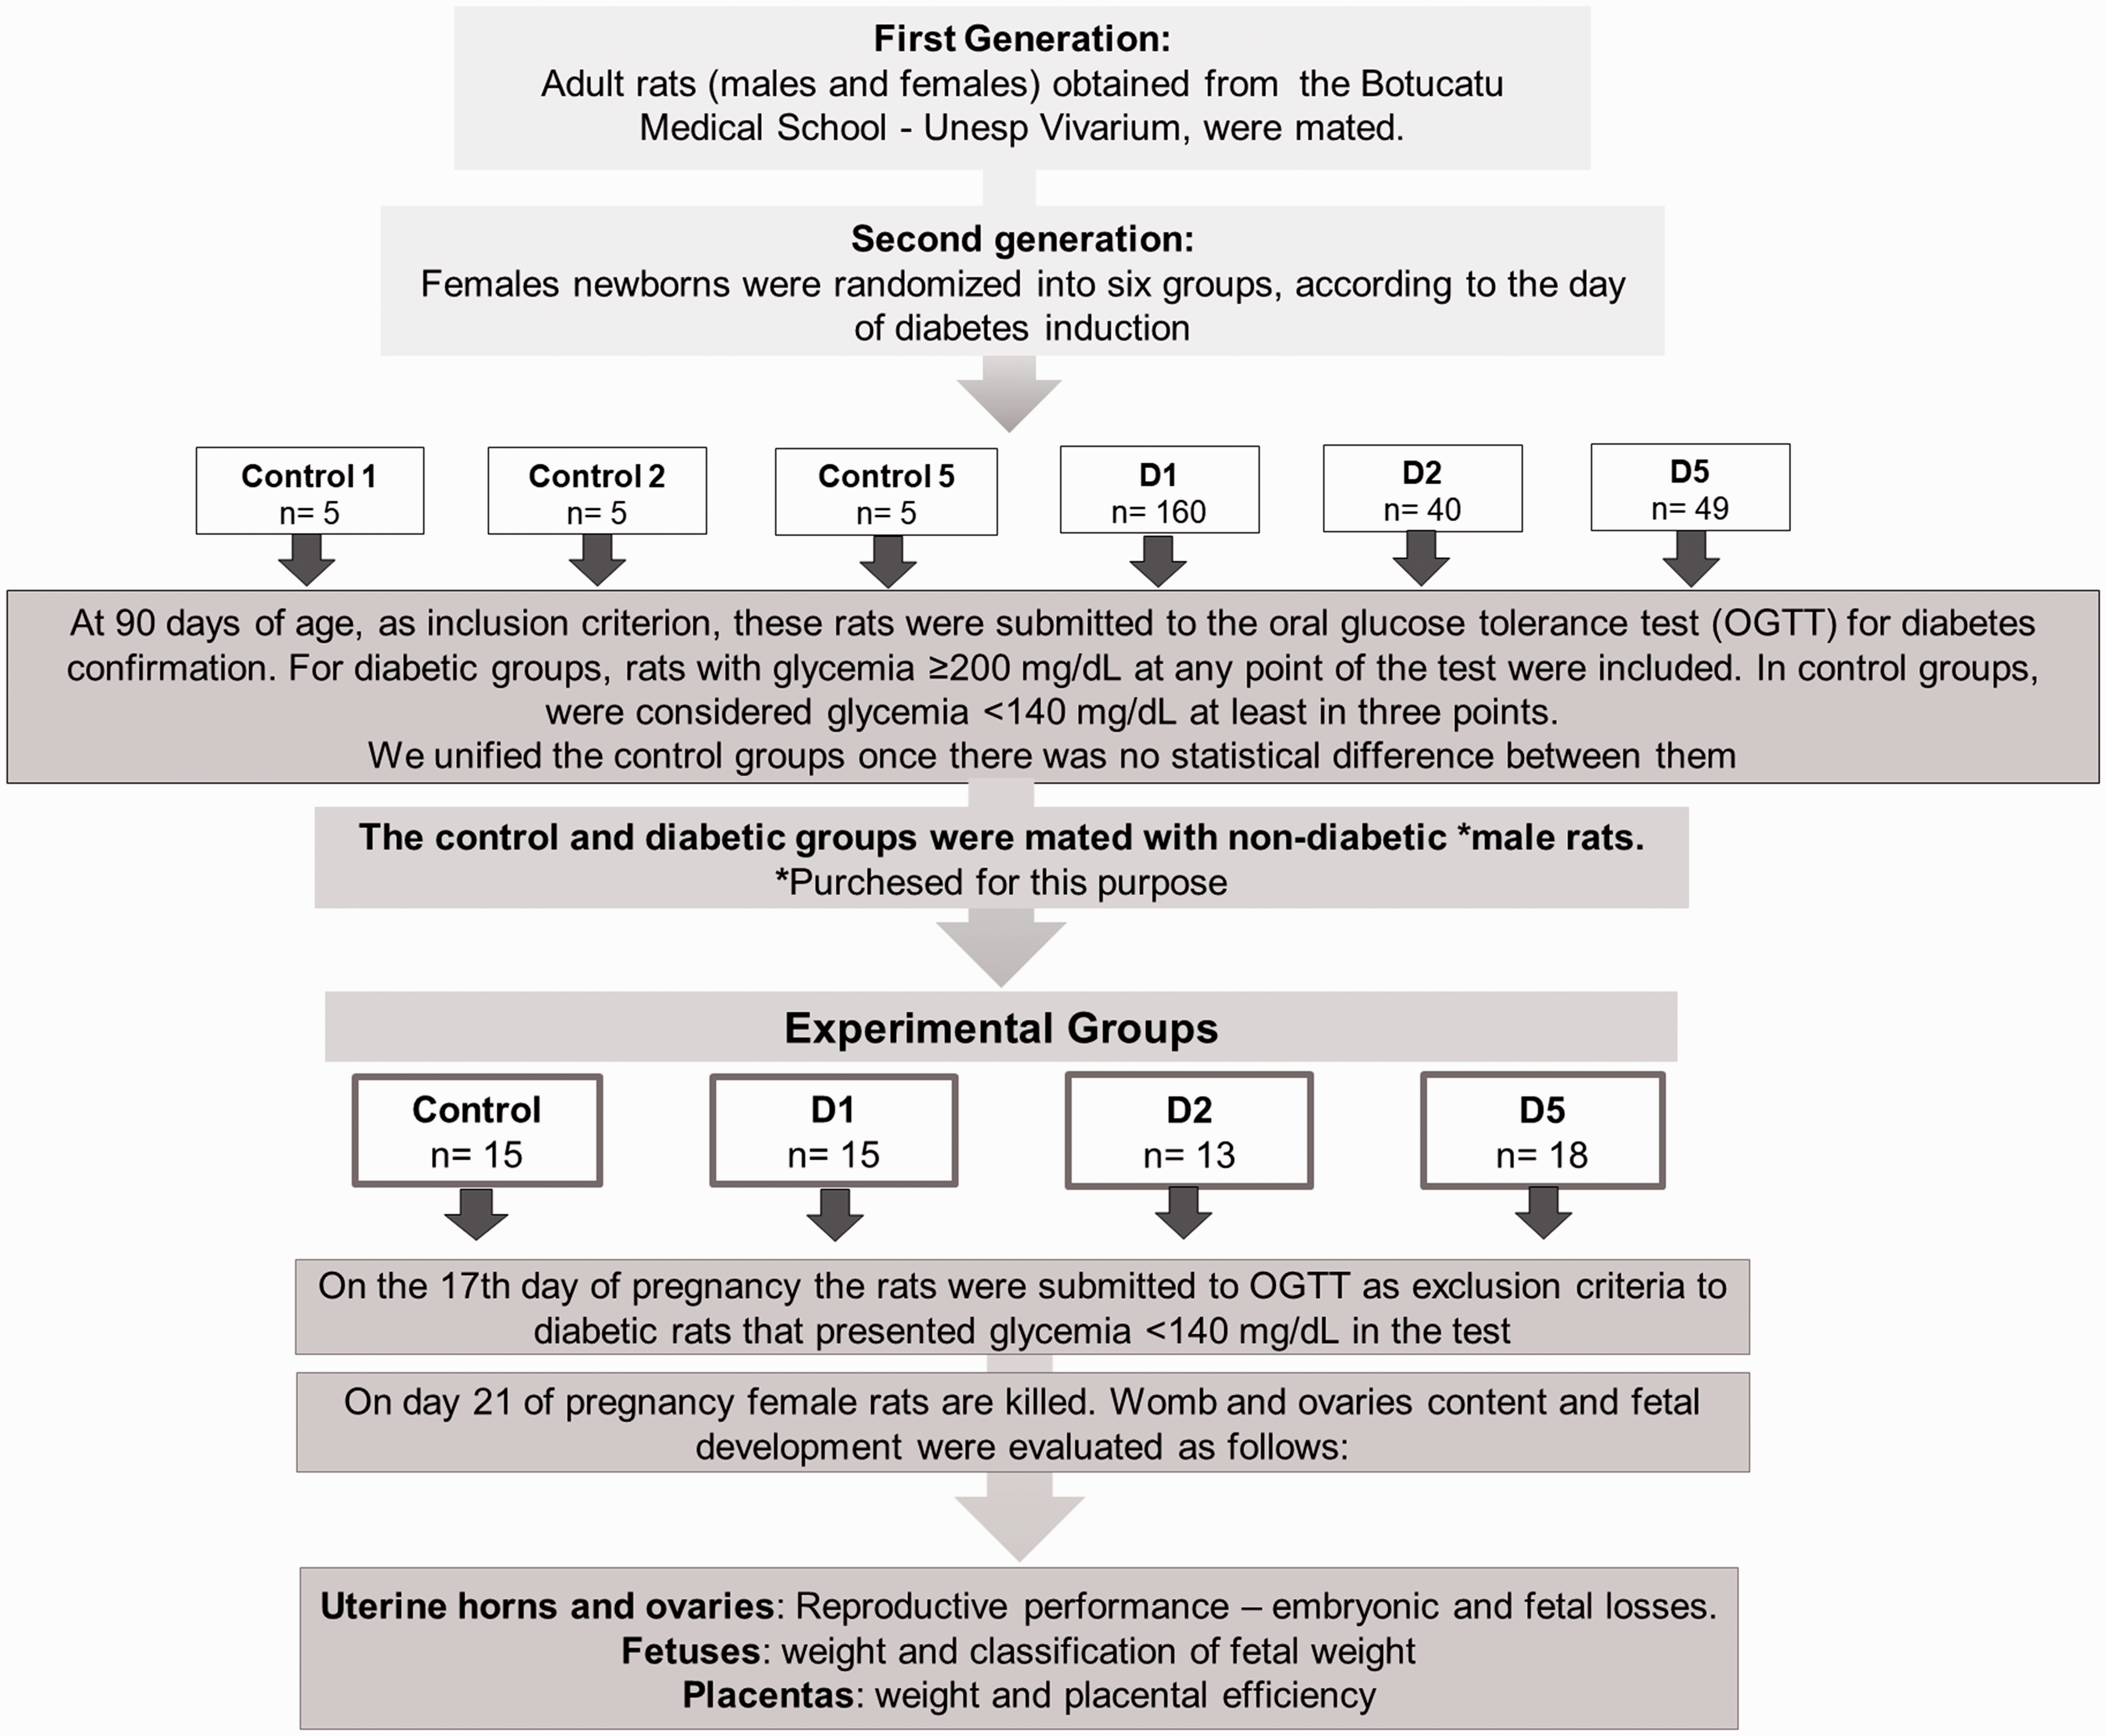
Flowchart of experimental design for diabetes induction or citrate buffer on the neonatal period in different days of life (day 1, day 2, or day 5).
Control Day 1: given citrate buffer at the first day (0 h postnatal) of life;
Control Day 2: given citrate buffer on the second day (24 h postnatal) of life;
Control Day 5: given citrate buffer on the fifth day (96 h postnatal) of life;
STZ Day 1 (D1): given STZ on the first day (0 h postnatal) of life (100 mg/kg);
STZ Day 2 (D2): given STZ on the second day (24 h postnatal) of life (100 mg/kg);
STZ Day 5 (D5): given STZ on the fifth day (96 h postnatal) of life (70 mg/kg).
After STZ administration, the rats were monitored daily to examine the mortality rate. After weaning, the female rats were kept in polypropylene cages (435 mm × 290 mm × 150 mm) with environmental enrichment, a maximum of three rats/cage until adulthood (90 days of life). At 90 days of life, all animals were submitted to an OGTT to confirm the diabetic state. The animals have fasted for 6 h and a drop of blood was collected from the tail of the rats for glycemic determination (time 0). The rats then received an intragastric (gavage) glucose solution (0.2 g/ml) at a dose of 2.0 g/kg body weight; 30, 60 and 120 min after glucose overload, the blood glucose levels were determined. As an inclusion criterion for diabetic groups, only rats with fasting glycemia (time point 0) under 300 mg/dl and glycemia in the OGTT ≥200 mg/dl during at least one time point were included. For control groups, the inclusion parameters were fasting glycemia (time point 0) under 100 mg/dl and glycemia <140 mg/dl during at least two time points in OGTT. Also, glucose response during OGTT was evaluated by the estimation of the total area under the curve (AUC) using the trapezoidal method. 21 After the confirmation of diabetes via OGTT, five animals from each group were randomly selected by the draw for glycated hemoglobin (HbA1c) analyses following manufactured instructions (Rat Hemoglobin HbA1c Assay kit, #80300, Crystal Chemical®, USA).
Pregnancy protocols
Five days after the OGTT test, non-diabetic and diabetic female rats were mated with non-diabetic males (ratio 3:1). Then, after a positive diagnosis of pregnancy, the rats were placed in individual cages and kept under controlled conditions.
On day 17 of pregnancy (corresponding to the period of 24–28 weeks of human pregnancy), the rats were submitted to the OGTT and AUC estimation, as previously described, to verify the influence of pregnancy on glycemic parameters. At the end of the pregnancy (day 21), the dams were weighed, anesthetized with sodium thiopental (Thiopentax®, Cristália, Brazil) intraperitoneal (i.p.) route (120 mg/kg) and euthanized by decapitation. The dams that presented no live fetuses at the end of pregnancy were not considered in the reproductive analyses. To evaluate maternal and fetal outcomes, the uterine horns and ovaries from each rat were dissected and weighed. The ovaries were then used for counting the number of corpora lutea as an indirect parameter for oocyte evaluation. The gravid uterus was dissected to count the number of dead and live fetuses, resorption (embryonic death) and implantation sites. When the implantation sites were visually undetectable, Salewski reagent was used. 22 The percentage of embryonic loss before implantation (pre-implantation percentage loss) was calculated by (number of corpora lutea – number of implantations) × 100/number of corpora lutea, and the percentage of embryonic loss after implantation (post-implantation loss percentage) was calculated by (number of implantations – number of live fetuses) × 100/number of implantations. 23
Additionally, the fetuses and placentas were also withdrawn from the uterine horns and individually weighed. The fetuses were classified as small for gestational age (SGA) when their weight was smaller than the mean fetal body weight of the control group – 1.7 × standard deviation (SD), classified as appropriate for gestational age (AGA) when their weight was within the range of mean control value ±1.7 x SD and considered large for gestational age (LGA) when their weight was greater than the mean body weight of the control group +1.7 x SD. The placental efficiency was calculated by using the ratio between the fetal and the placental weight. 24
Statistical evaluation
For the calculation of the sample size for full-term pregnant rats in this experiment, the average level of implantation number was estimated in rats with mild diabetes obtained in our laboratory. Considering a reduction of 10% and with a power of 80%, the minimum number obtained was 13 animals per group. Results are presented as the mean ± SD or percentage (%). Gamma distribution with repeated measures and one-way ANOVA followed by Tukey's Multiple Comparison Test was used for blood glucose comparison in the OGTT. For AUC, maternal reproductive outcomes, one-way ANOVA followed by Tukey's Multiple Comparison Test was used. Fisher’s Exact Test was applied to compare proportions. The embryonic and fetal loss percentages were calculated by Poisson Distribution. p-values < 0.05 were considered as the limit of statistically significant difference.
Results
Mortality percentage after STZ injection and included rats in adulthood
Of the 15 control rats, no rat died following the citrate buffer solution procedure on the days STZ was given to groups D1, D2 and D3. In group D1, of the 160 female newborns who started the experiment, 120 of them died after the injection of STZ. Of the 40 female newborns in-group D2, 10 died. In group D5, eight newborns died out of 49. At 90 days of age, after OGTT to evaluate the inclusion and exclusion criteria for rats in both the control and diabetic groups, it was verified that all rats that received citrate buffer were included in the control group. In group D1, 30 rats had blood glucose levels compatible with the inclusion criterion, 21 for group D2 and 34 for group D5. Regarding the positive pregnancy diagnosis, the same 15 rats had sperm in the vaginal smears, 20 rats had a positive diagnosis in group D1, 17 in group D2 and 28 in group D5. As for the percentage of rats with full-term pregnancy (day 21 of pregnancy), the control group had 15 rats, group D1, 17 rats with fetuses and three without fetuses, group D2 showed 13 with fetuses and four without fetuses, and group D5 presented 20 dams with fetuses and eight without them (Figure 2).
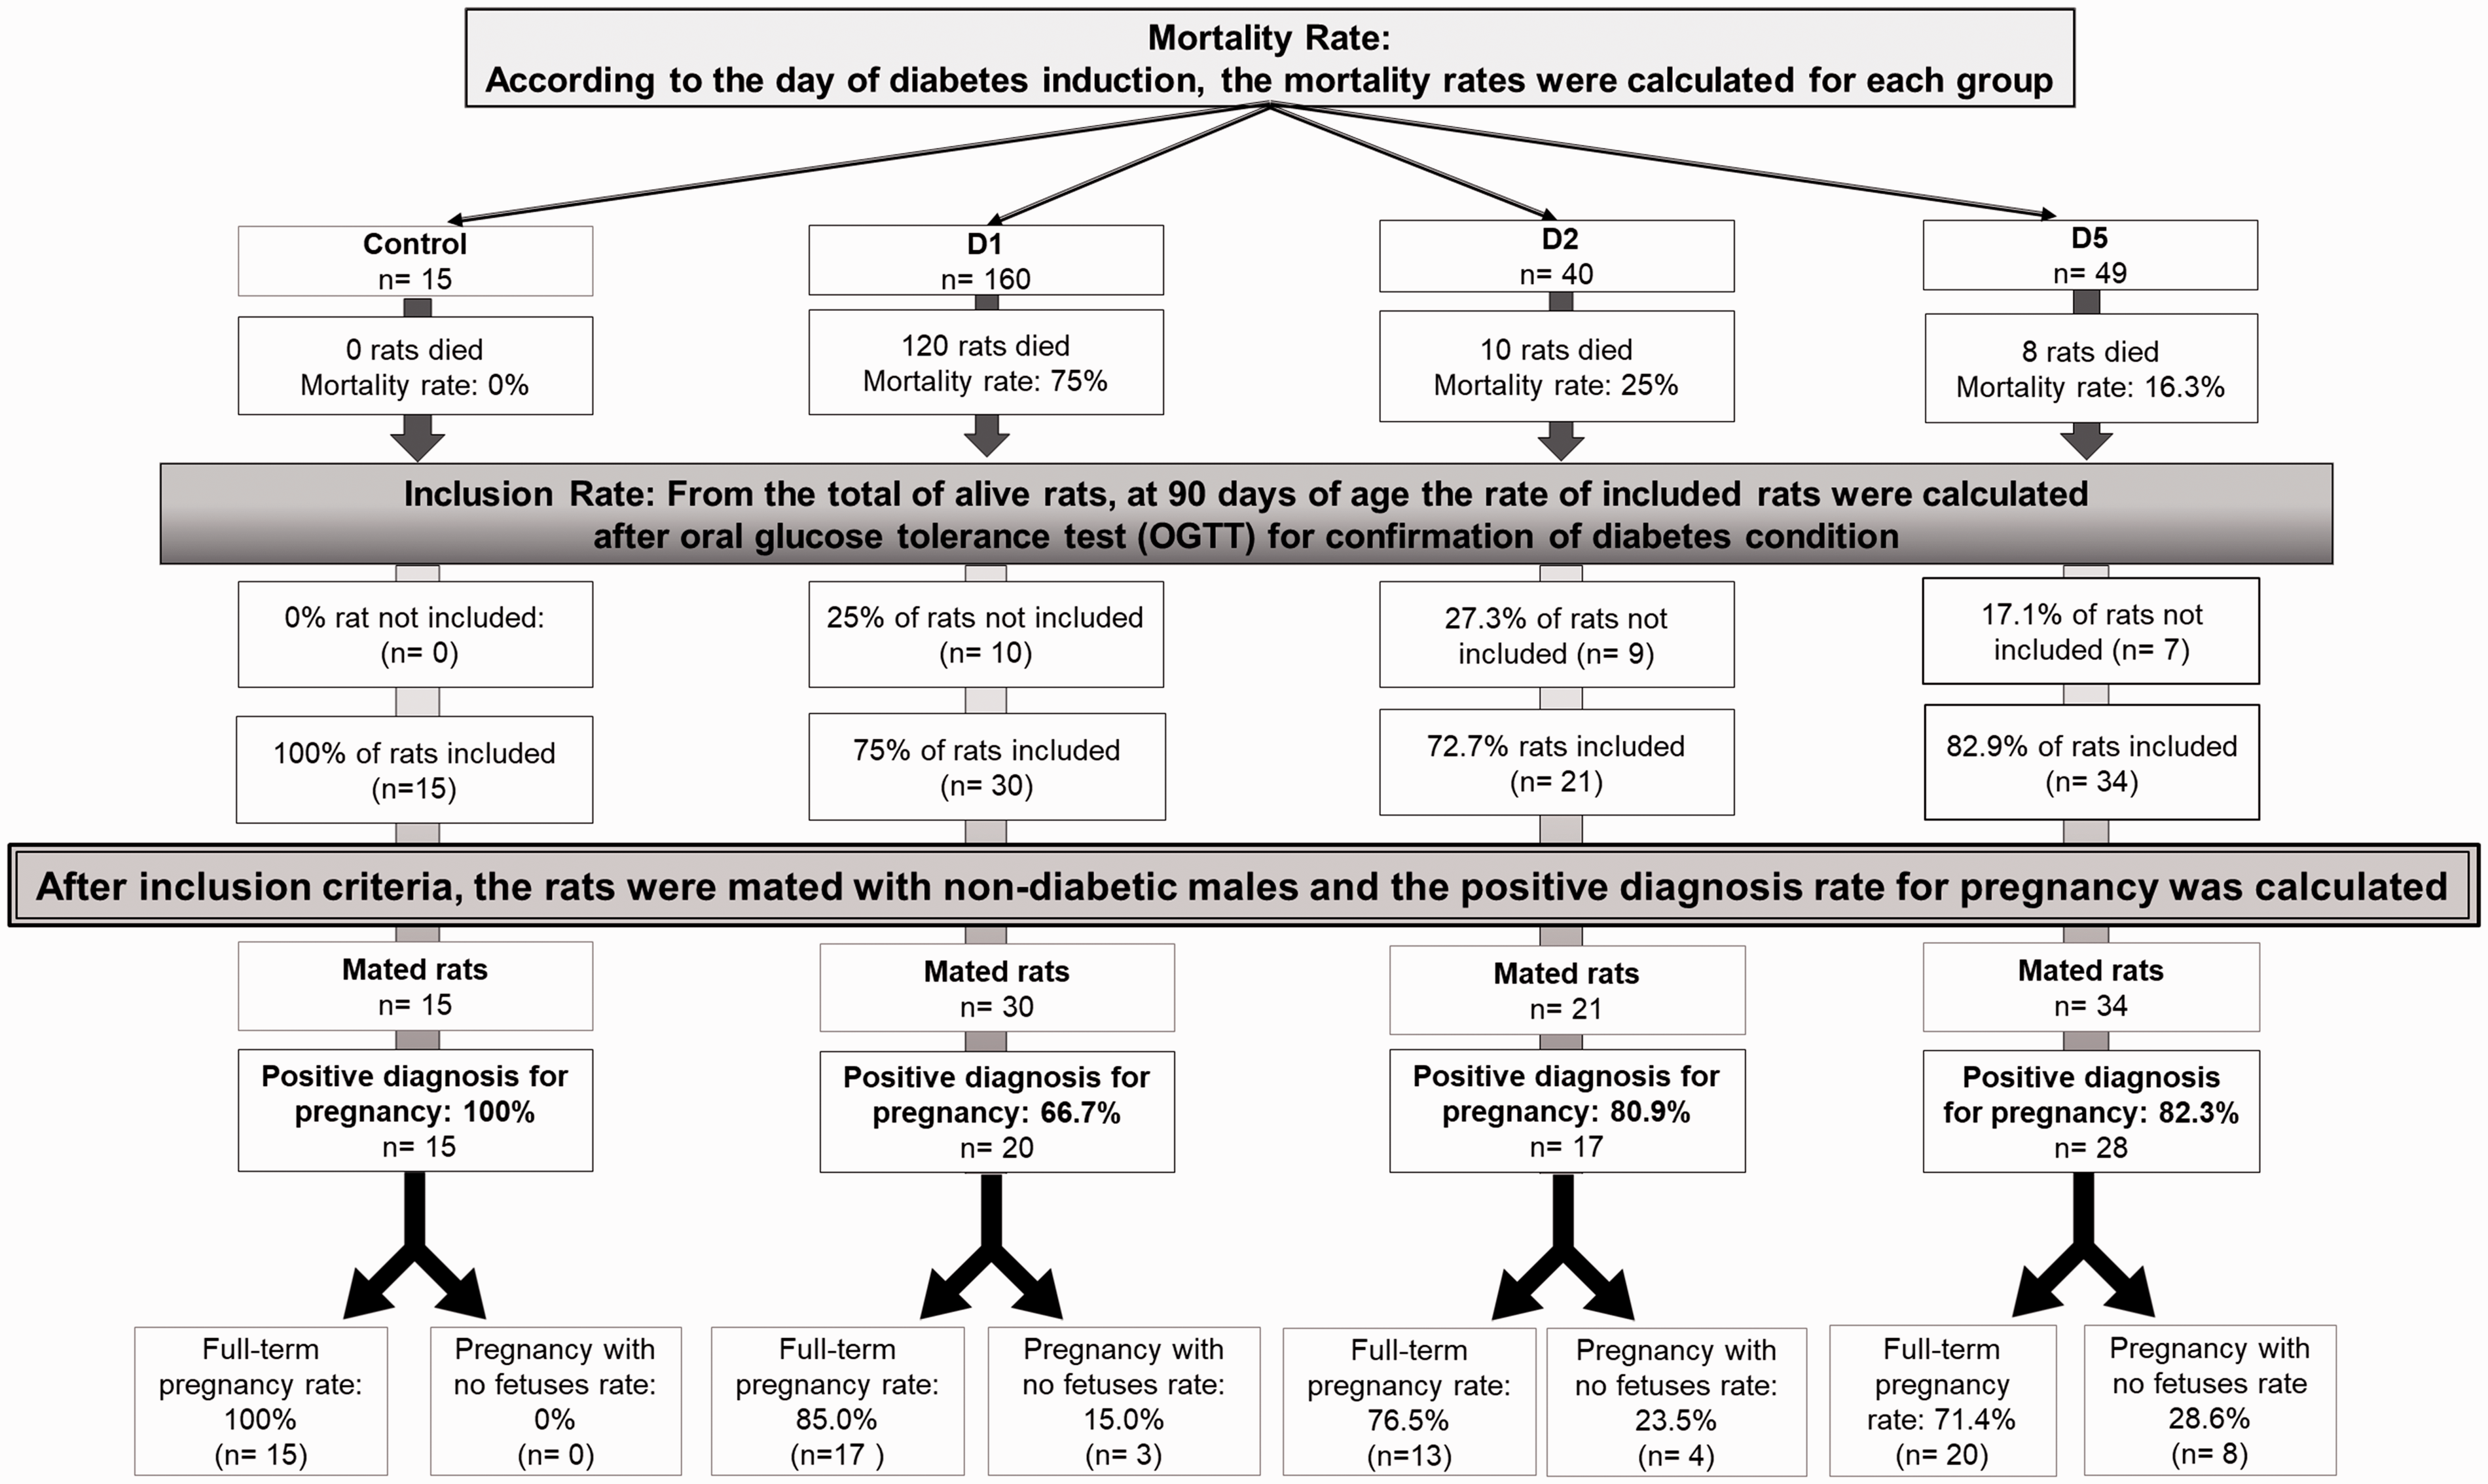
Flowchart of experimental results of diabetes induction at different days of life (days 1, 2, and 5) of female rats.
Glucose tolerance and AUC analyses at adulthood
Figure 3 represents the OGTT and AUC from different groups. In adulthood, OGTT was performed to verify glucose tolerance status in all groups. There were no glycemic differences among control groups (1, 2 and 3). These animals were then grouped and presented as a single control group. The diabetic groups showed higher glycemia at all time points of OGTT and higher AUC compared with the control group. Group D1 showed lower blood glucose at fasting and 60 min after the glucose challenge in relation to glycemic levels of groups D2 and D5. After 30 min of glucose overload, group D5 presented higher glycemia in relation to group D2. Moreover, group D5 also had higher AUC as compared to those of group D2. The percentage of HbA1c was higher in all diabetic groups compared to the control group. However, there was no difference in HbA1c percentage among diabetic groups (Figure 4(a)). There was a positive correlation between the percentages of HbA1c and the values of AUC (Figure 4(b)).
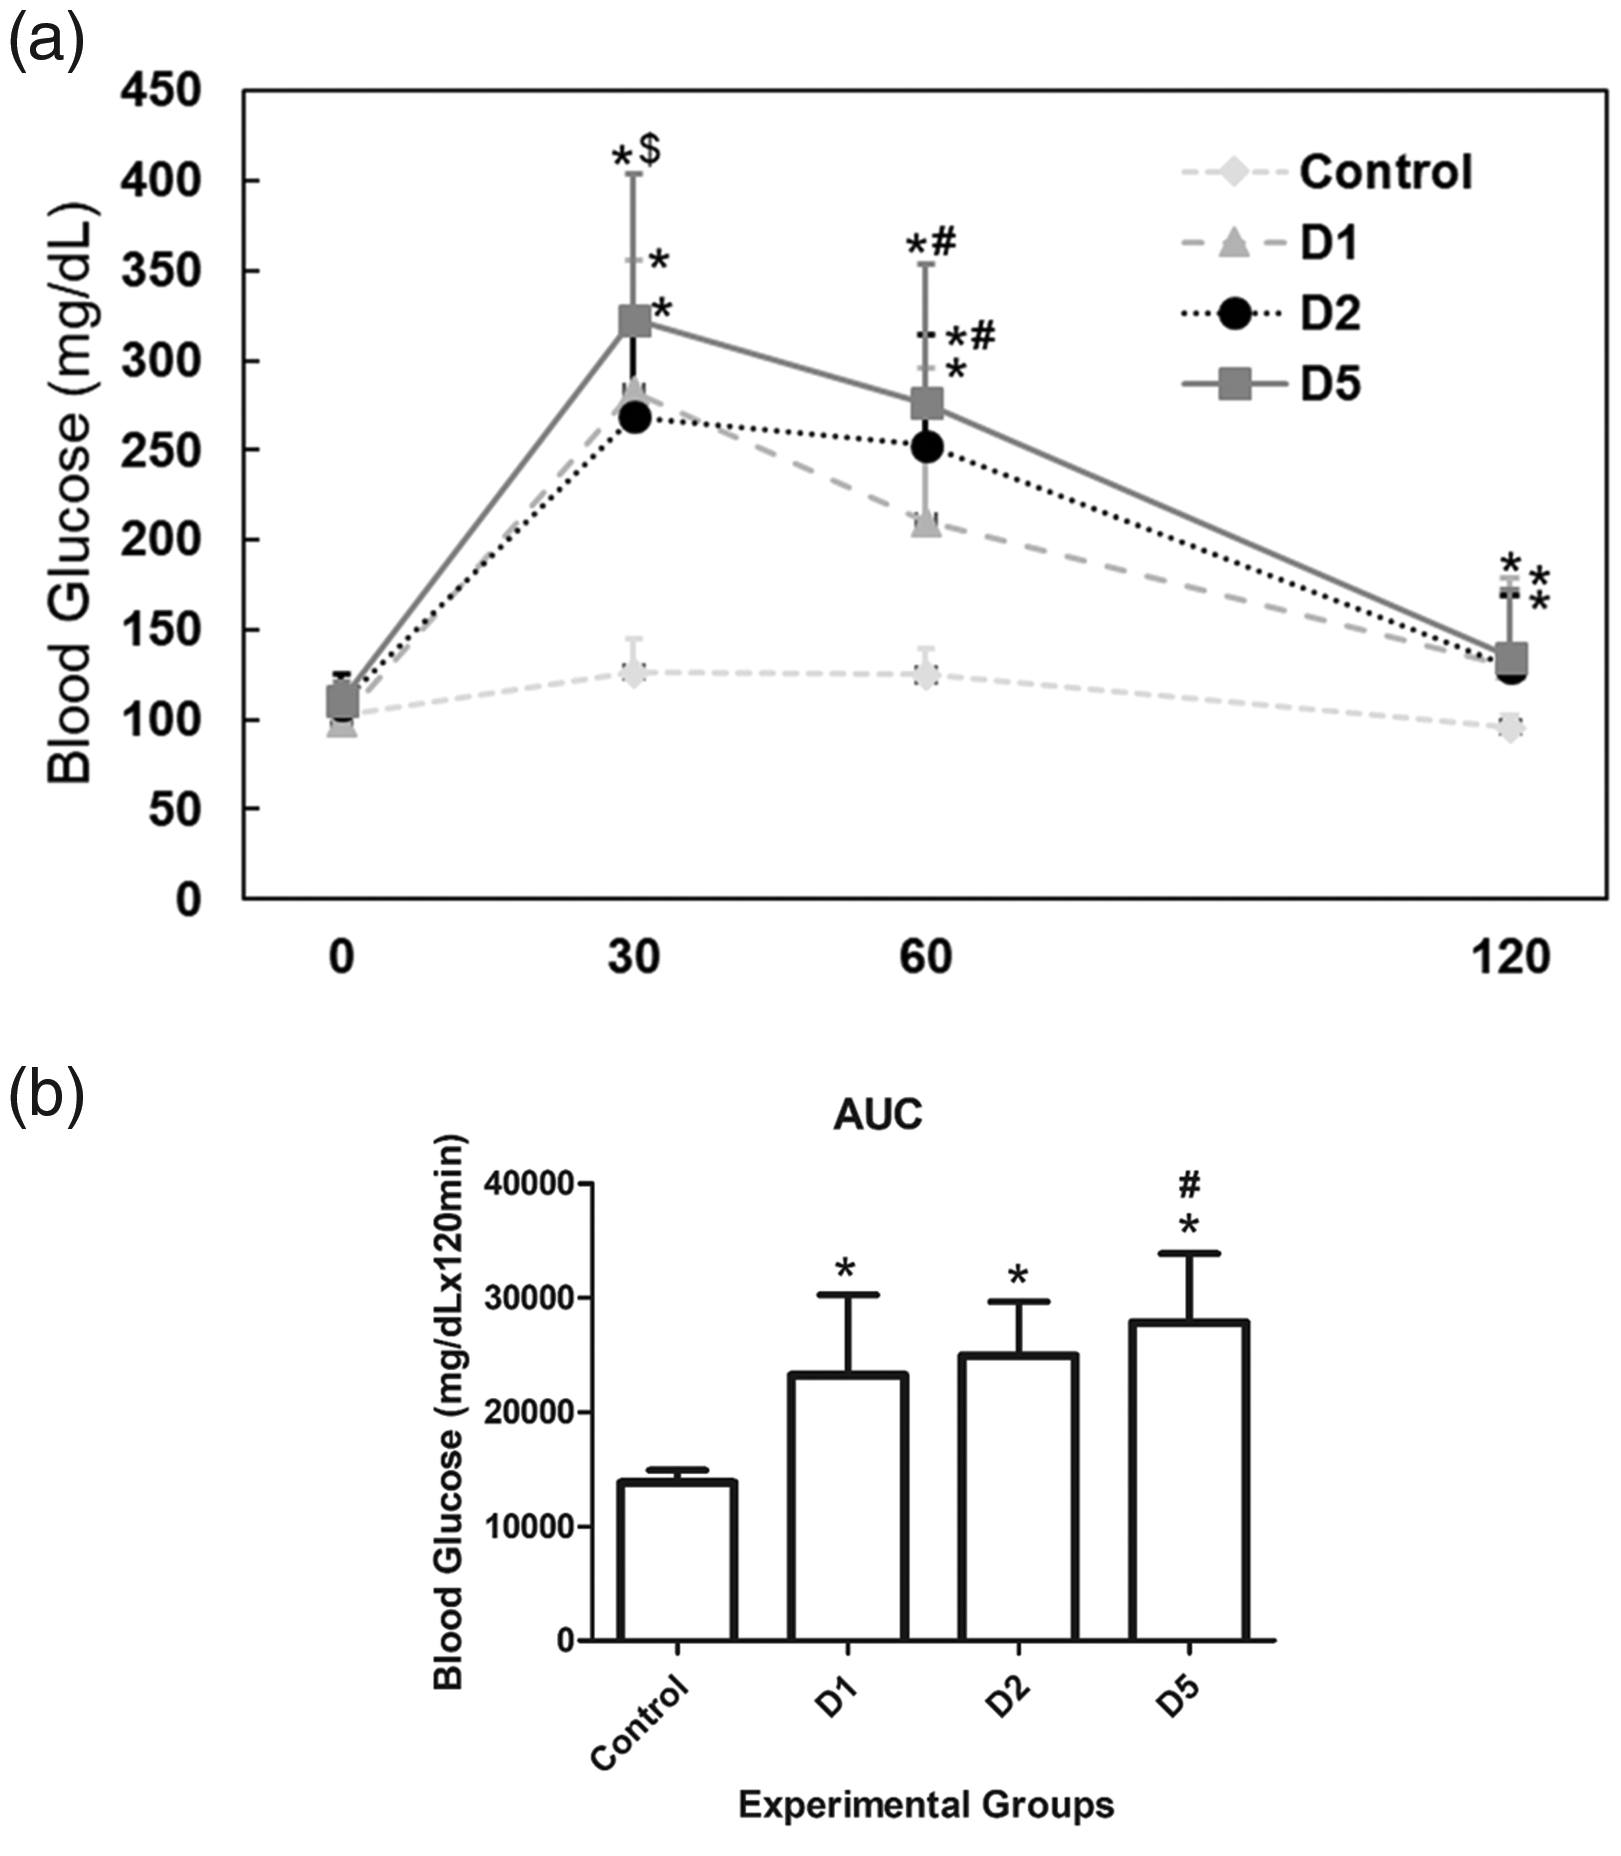
(a) Blood glucose levels in the oral glucose tolerance test (OGTT) and (b) the area under the curve (AUC) in adulthood before pregnancy. Control, non-diabetic; D1, streptozotocin (STZ) given on the first day of life; D2, STZ given on the second day of life, and D5, STZ given on the fifth day of life. Values are expressed as mean ±SD
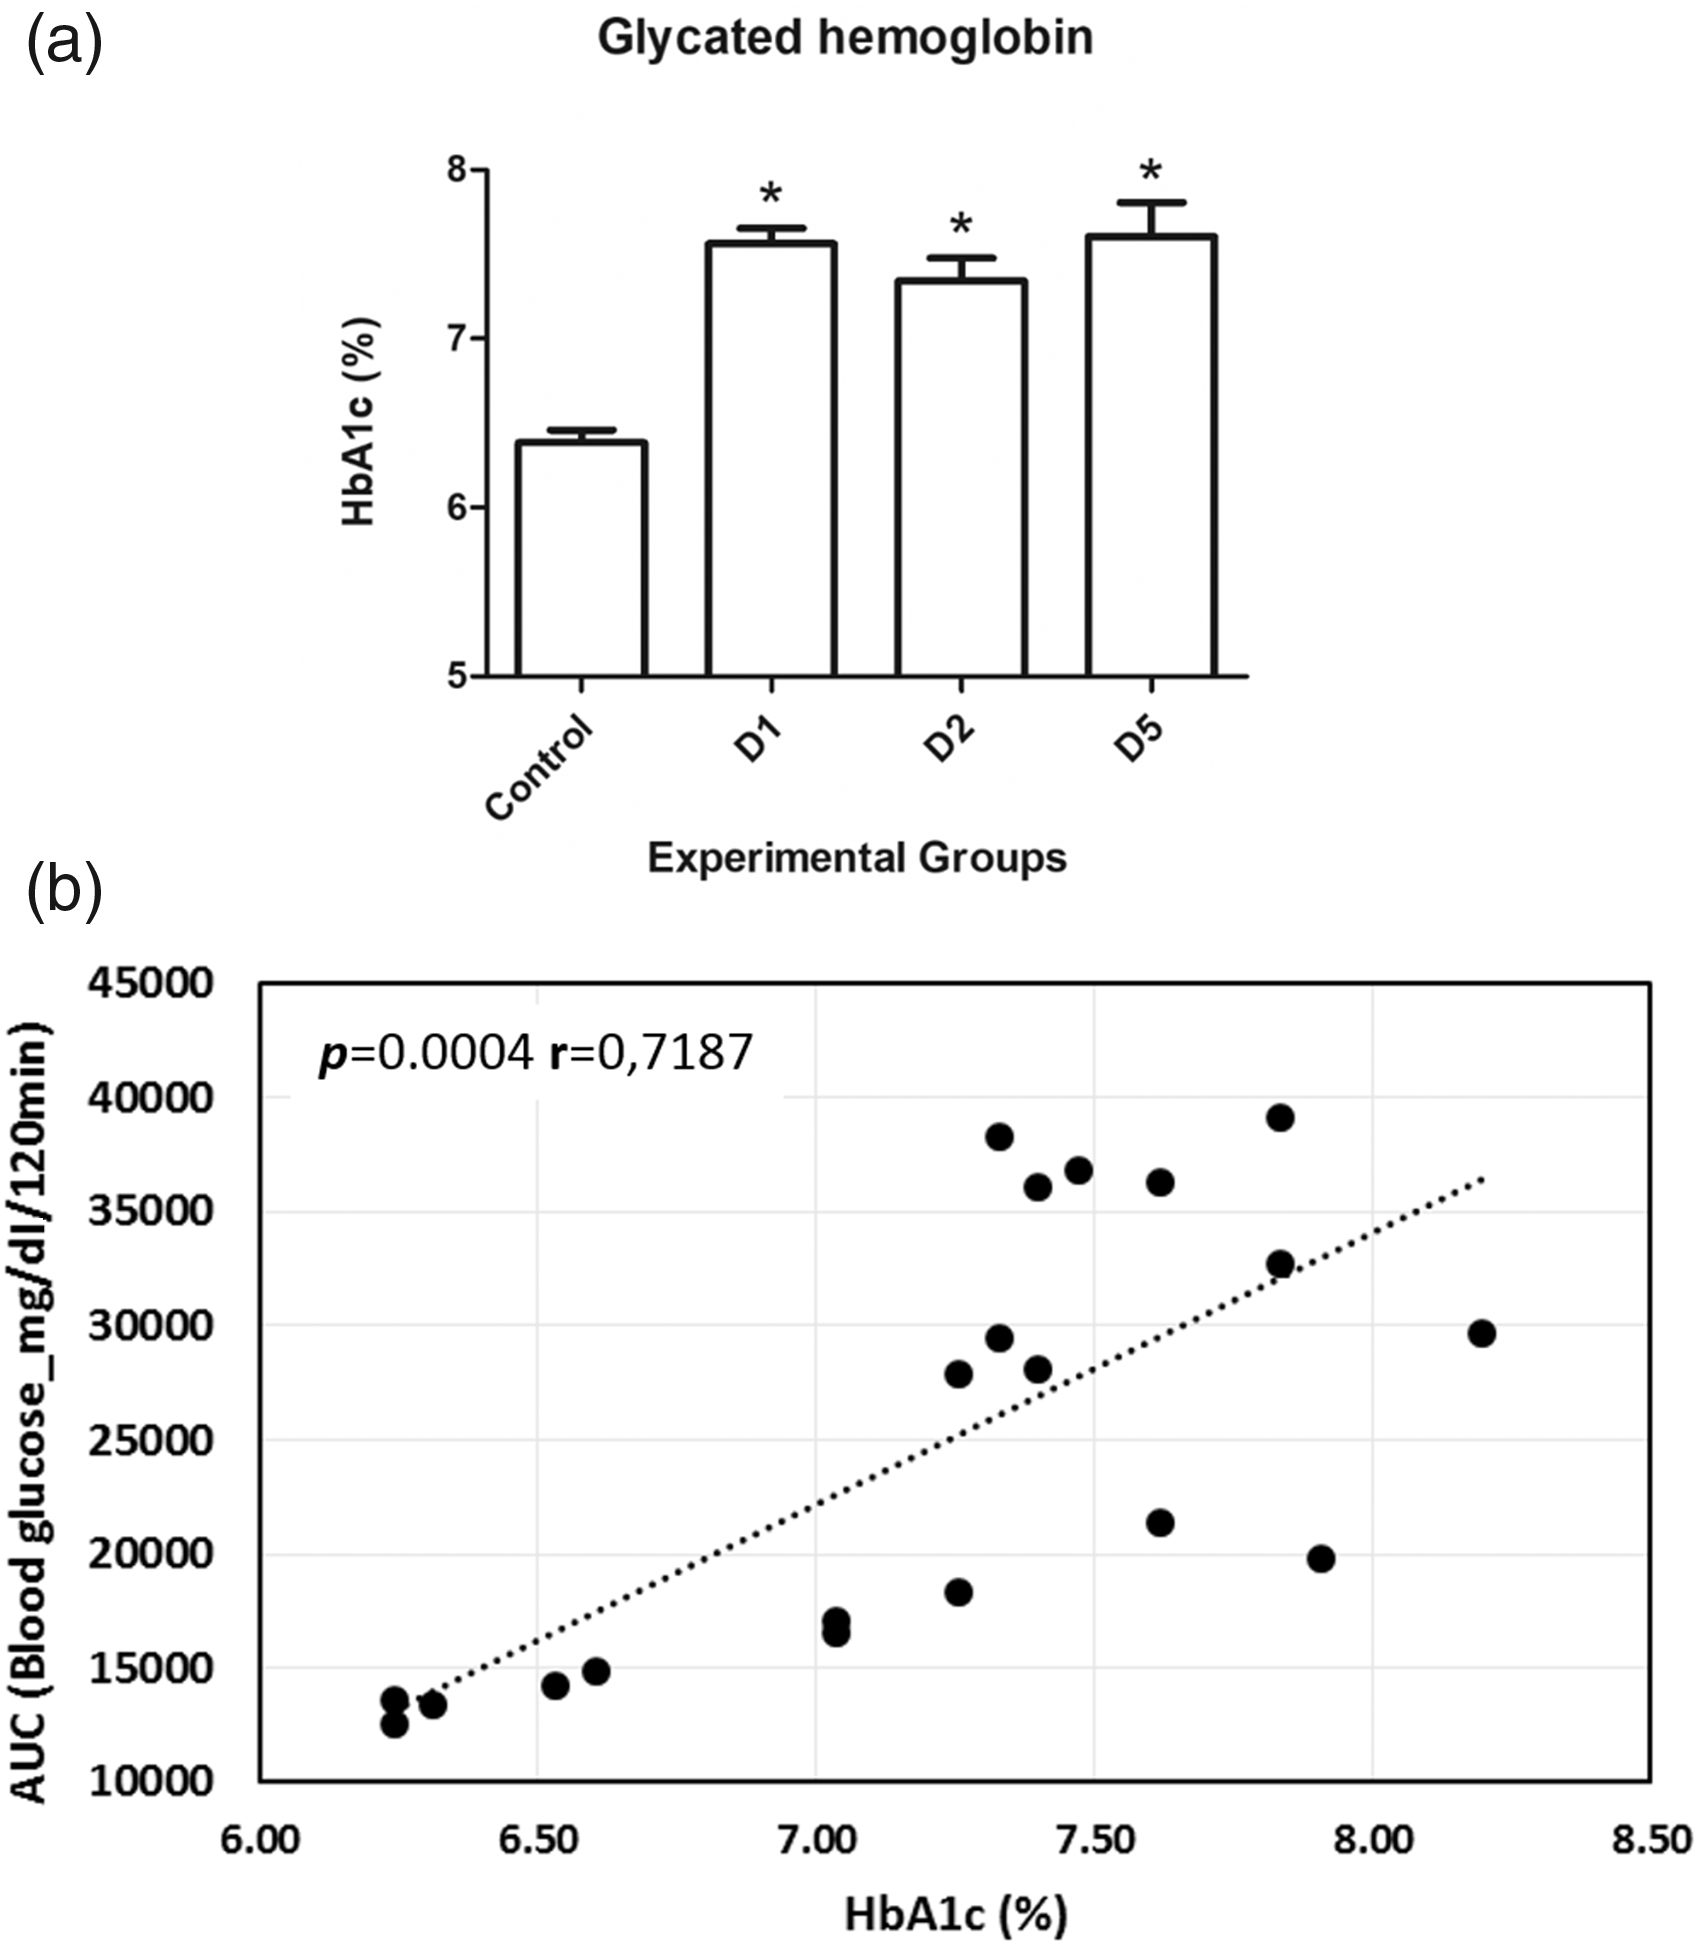
(a) Glycated hemoglobin (HbA1c) percentage and (b) Pearson’s correlation between HbA1c percentage and the area under the curve (AUC) in adulthood before pregnancy. Control, non-diabetic; D1, streptozotocin (STZ) given on the first day of life; D2, STZ given on the second day of life, and D5, STZ given on the fifth day of life. Values are expressed as mean ±SD.
Positive diagnosis of pregnancy percentages
After OGTT, the rats from the diabetic and control groups were mated. Group D1 presented with the lowest percentage of positive diagnosis for pregnancy (66.7%) compared to the control group (100.0%) (Figure 2).
OGTT and AUC during pregnancy
On day 17 of pregnancy, all pregnant rats were once again submitted to OGTT (Figure 5). The diabetic groups presented higher glycemic levels (Figure 5(a)) and AUC (Figure 5(b)) at 30- and 60-min time points compared with the control group. After 30 min, groups D1 and D5 showed higher glycemic levels in relation to group D2. At the end of the test, group D5 presented greater glycemia than group D2, which had a lower glycemic level compared with the groups D1 and D5. The individual analysis of OGTT showed that all D1 animals presented at least one point above 200 mg/dL. In group D2, 53.8% of animals presented at least one point above 200 mg/dl, 23.1% presented glycemia between 140 and 200 mg/dl in the OGTT, and 23.1% presented values under 140 mg/dl. In group D5, 94.4% presented at least one point above 200 mg/dl and 5.6% presented glycemia between 140 and 200 mg/dl through the test.
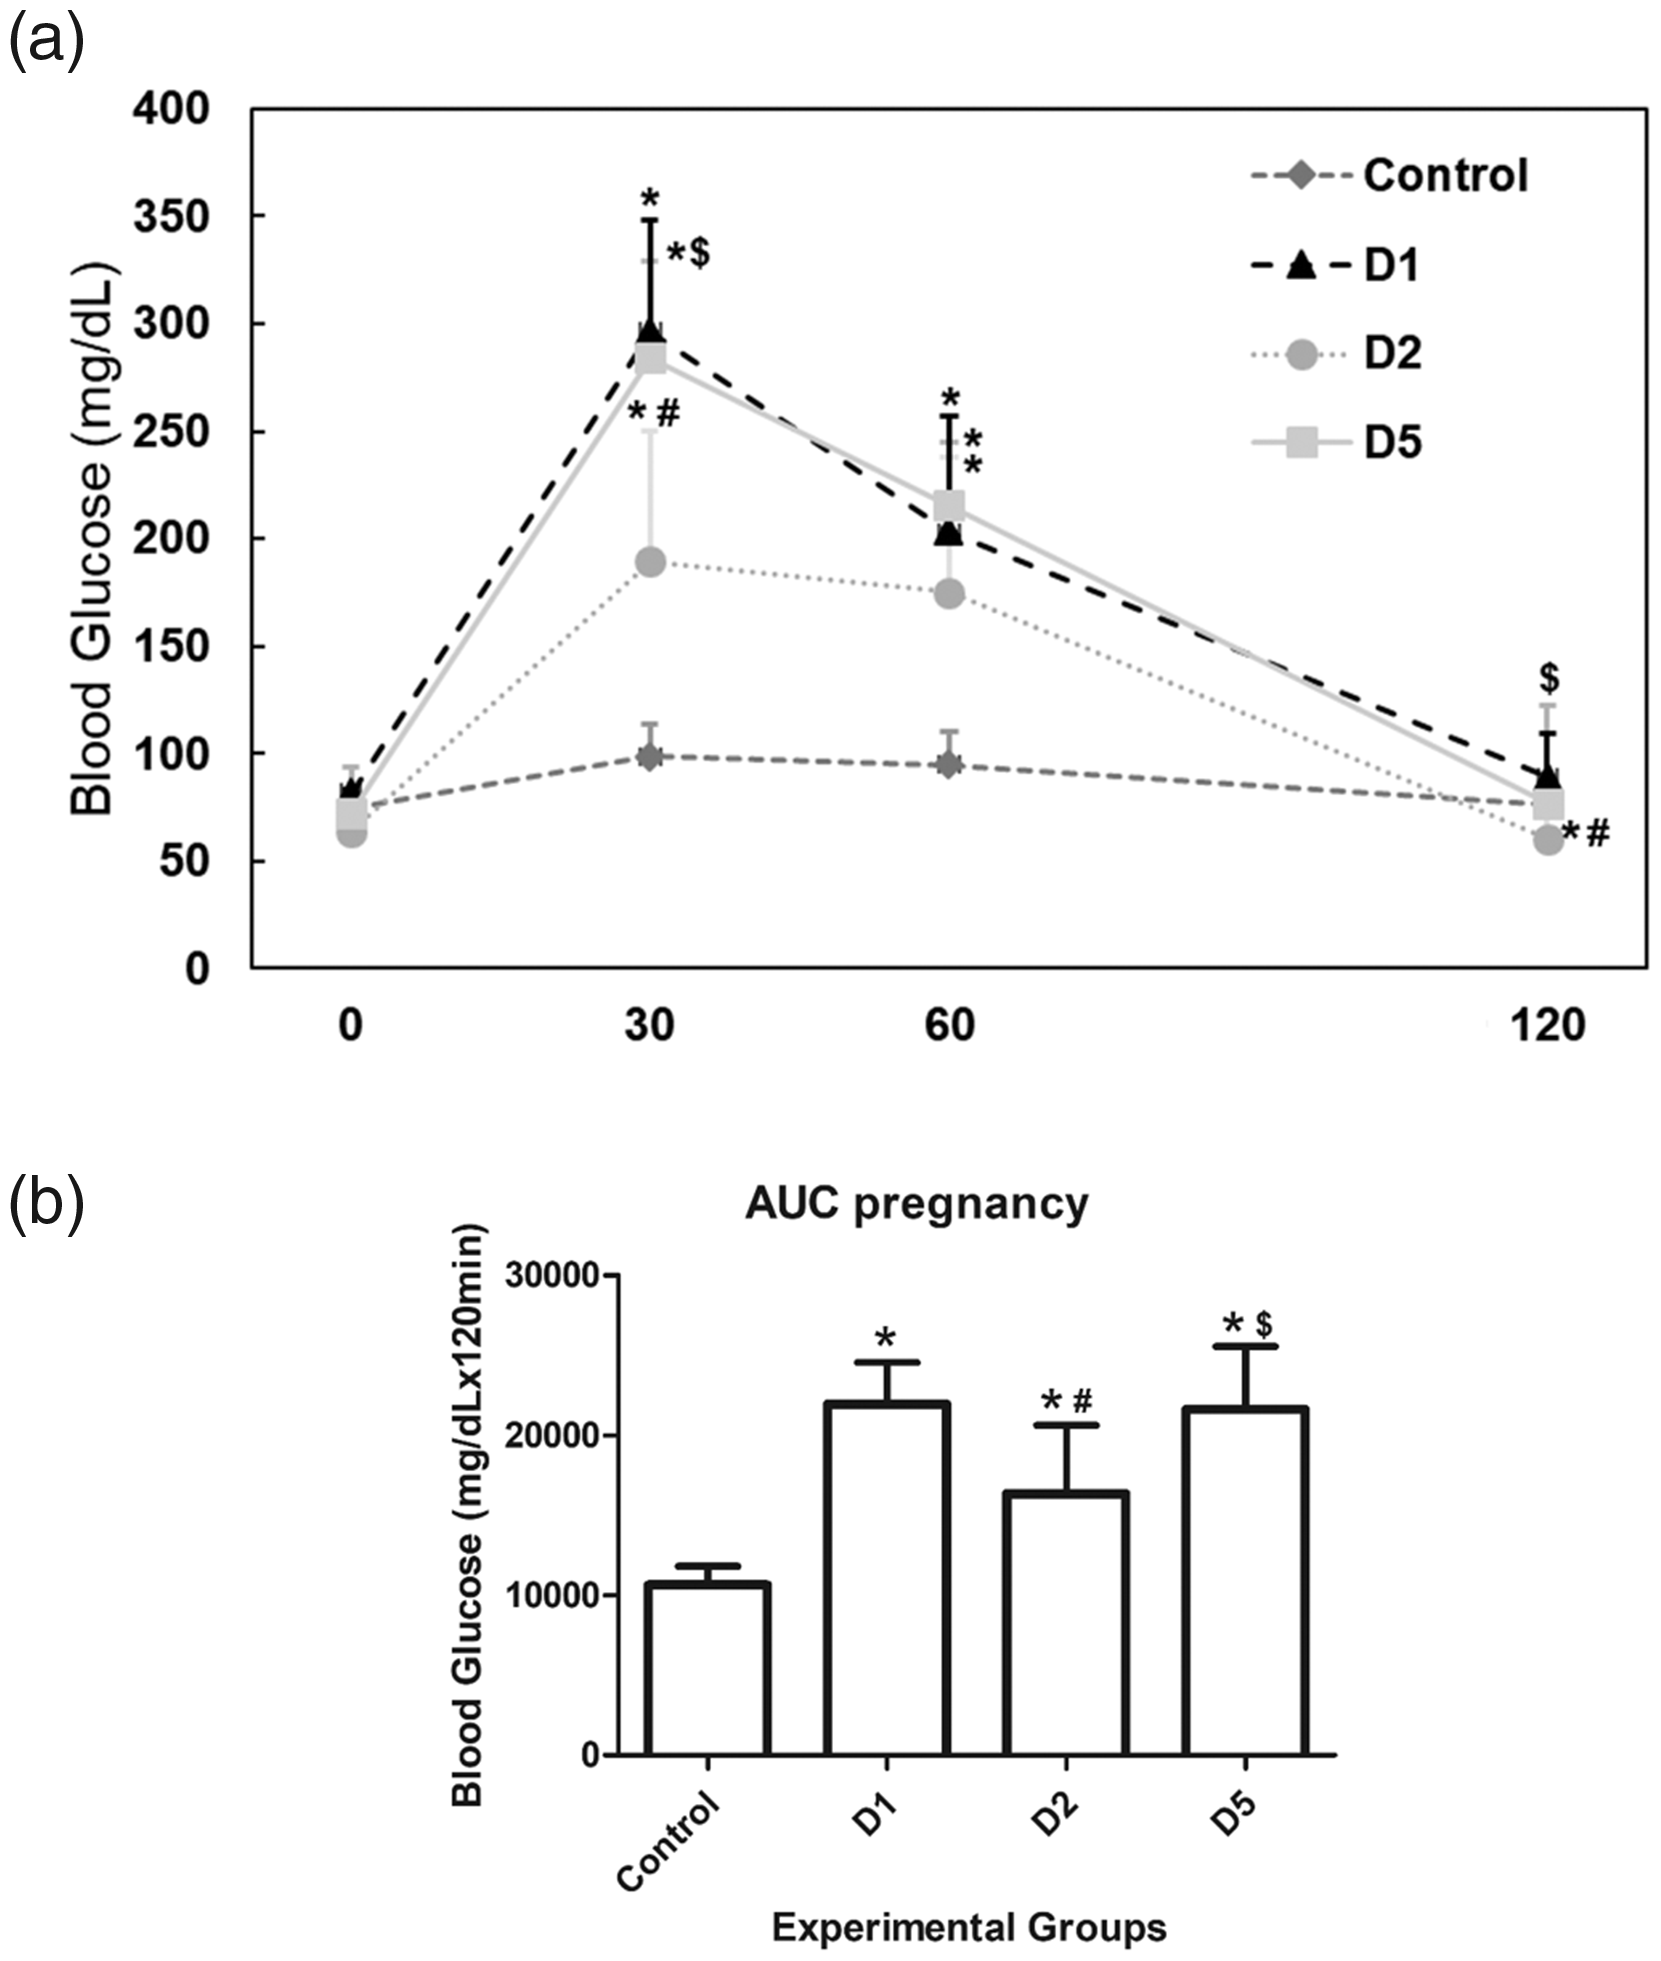
(a) Blood glucose levels in the oral glucose tolerance test (OGTT) and (b) the area under the curve (AUC) during pregnancy. Control, non-diabetic; D1, streptozotocin (STZ) given on the first day of life; D2, STZ given on the second day of life, and D5, STZ given on the fifth day of life. Values are expressed as mean ±SD.
Maternal performance and fetal outcomes
Of group D1, 85.0% reached full-term pregnancy, 76.5% of D2 and 71.4% D5. Only group D5 had a significantly decreased percentage of full-term pregnancy compared with the control group (Figure 2).
Table 1 shows the reproductive parameters of diabetic and control groups. There was a significant decrease in the number of corpora lutea in groups D2 and D5 in comparison to the control group, and between groups D2 and D1. The total number of implantations was lower in group D2 compared with the control group. All diabetic groups had a reduced number of live fetuses in relation to the control animals. There was an increase in the total number of embryonic deaths in group D1 in comparison to the control group. Group D1 also presented a higher percentage of pre-implantation embryonic losses in comparison to those of control and D5 groups. All diabetic groups presented a higher percentage of post-implantation losses and litter weight in relation to those of the control group. The fetal weight was lower in groups D1 and D5 compared with the control group. The placental weight was lower and placental efficiency was higher in groups D2 and D5 in relation to the control and D1 groups. The percentages of fetuses classified as AGA in the D1 and D5 groups were lower than the control and D2 groups. The percentages of fetuses as SGA and LGA in groups D1 and D5 were higher than the control and D2 rats (Table 1).
Repercussions of neonatally diabetic models induced at the first (D1), second (D2) and fifth (D5) days of life on reproductive outcomes and fetal growth of rats.
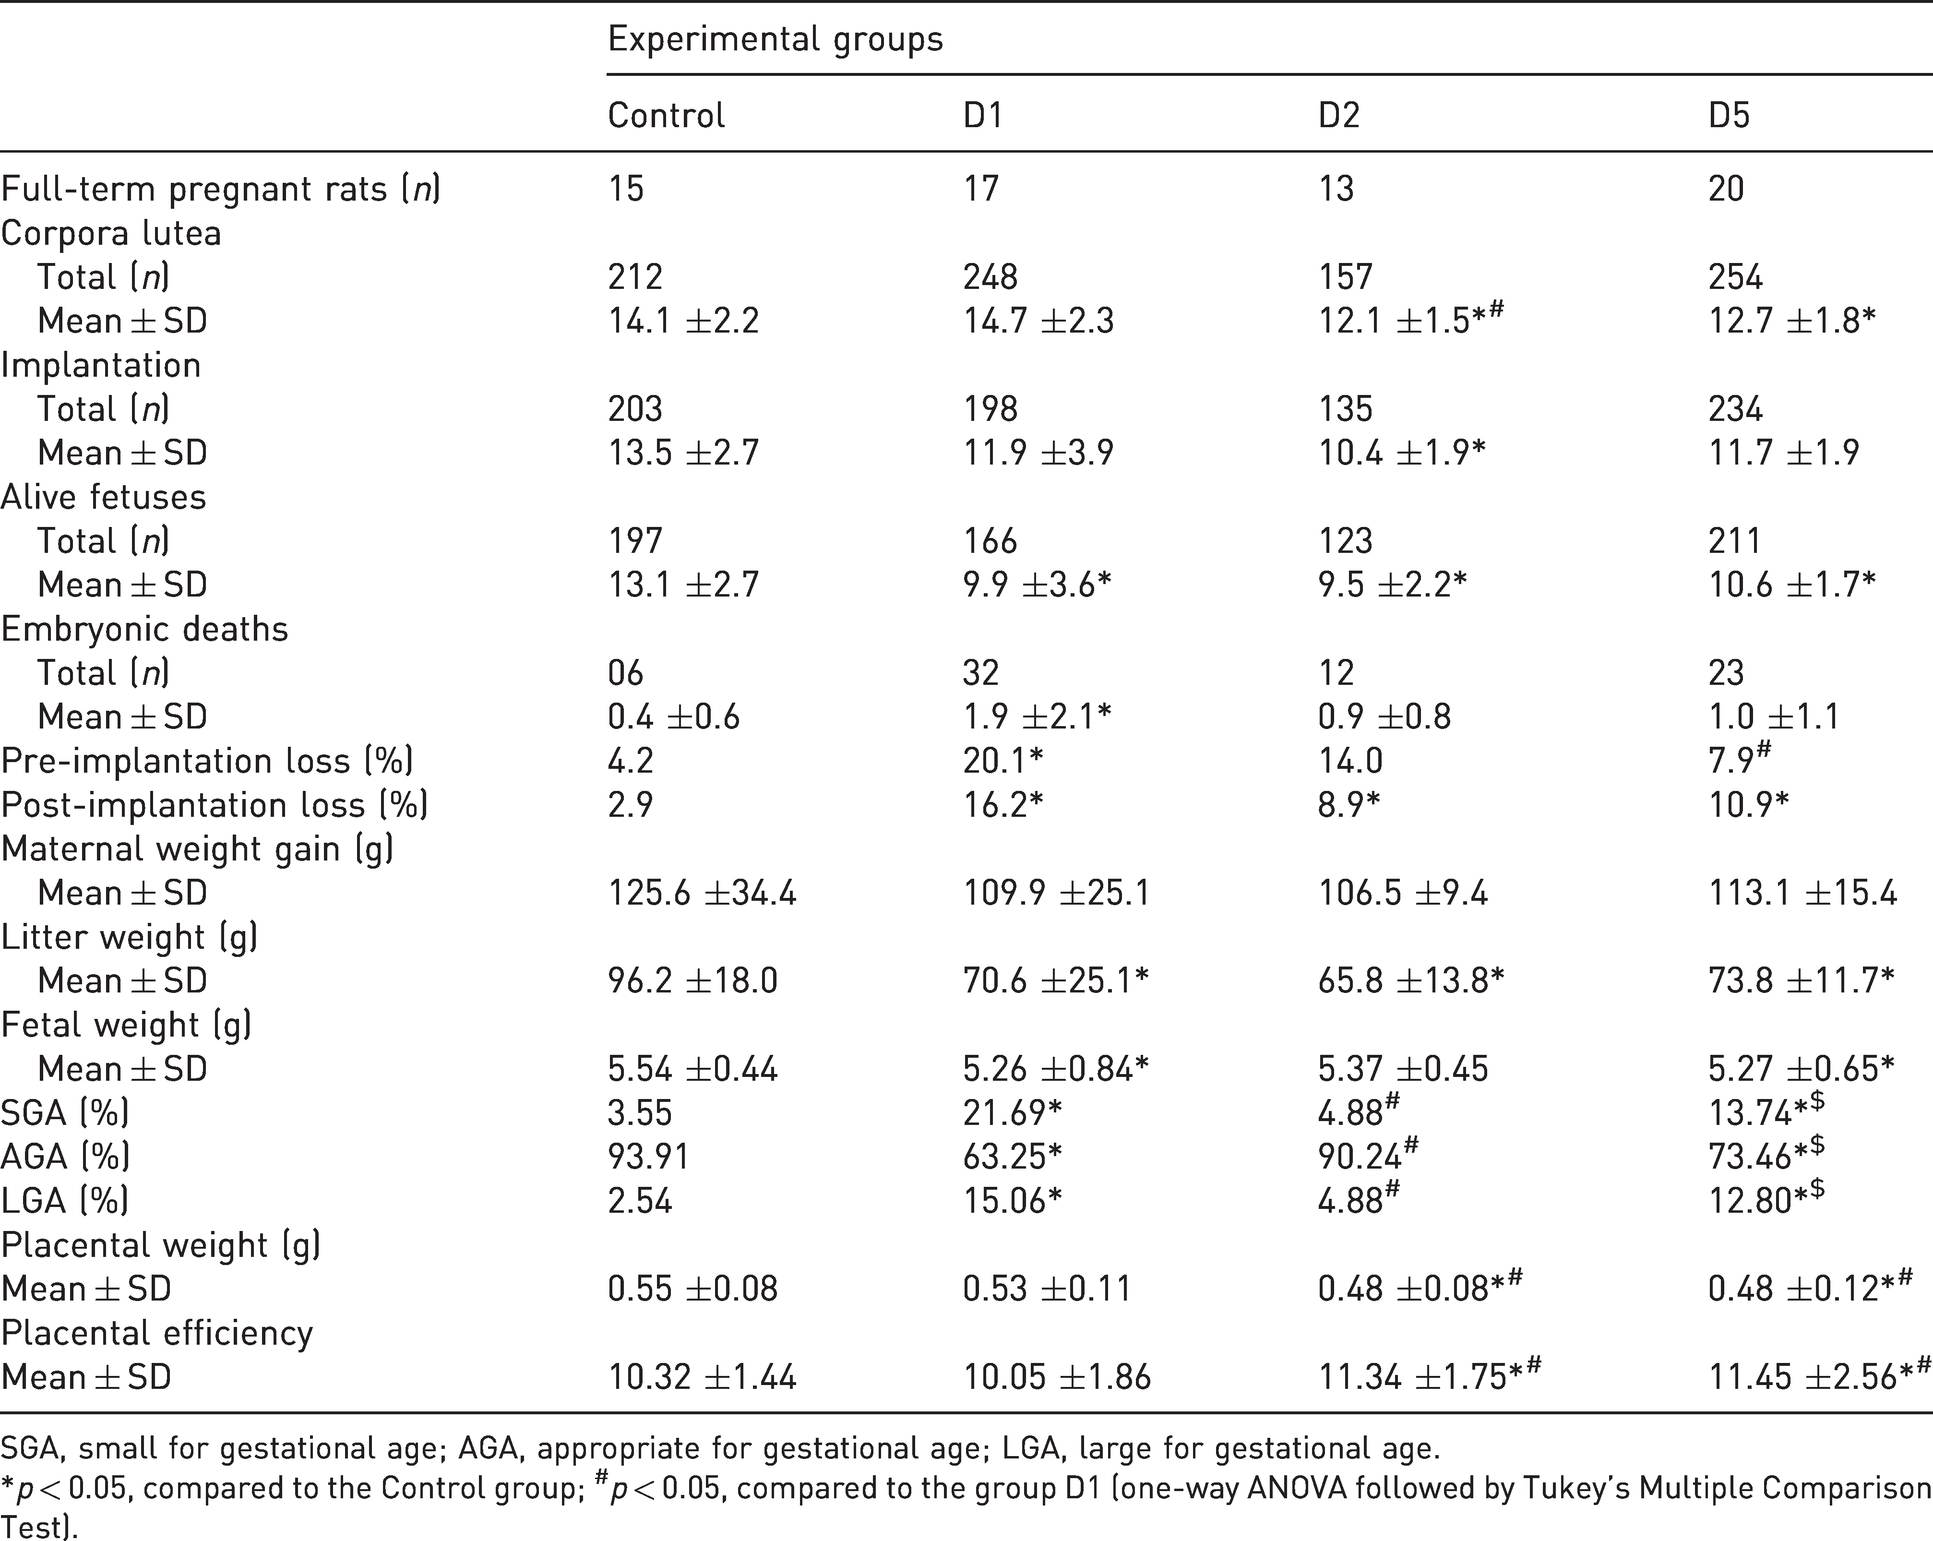
SGA, small for gestational age; AGA, appropriate for gestational age; LGA, large for gestational age.
*p < 0.05, compared to the Control group; #p < 0.05, compared to the group D1 (one-way ANOVA followed by Tukey’s Multiple Comparison Test).
Discussion
The choice of the STZ-induced diabetes model is relevant to having a better understanding of the mechanisms involved in diabetic pathogenesis. We demonstrated that the induction of diabetes on the fifth day of life is the best model to simulate impaired glycemic and maternal outcomes observed in diabetes with a lower mortality percentage after STZ chemical induction. Two of the major concerns associated with this choice of method to reproduce diabetic conditions are ethical and cost issues, considering the number of animals and chemical agents used. Our data show that mortality percentages diverge according to the day of life in which the induction of diabetes occurs. The animals submitted to diabetes induction at birth had a low survival rate (25.0%) after STZ administration when compared to induction at second (75.0%) and fifth (83.7%) days of life. Considering the mortality percentage after STZ injection, Portha et al. showed that diabetes induction at birth (100 mg/kg of STZ/kg body weight, i.v.) caused an animal mortality percentage to rise from 30 to 50%. 14 Another study performed by Béquer et al. using STZ-induced diabetes in female rats (100 mg/kg, i.p.) on the second or fifth day of life had a mortality percentage of 95% on day 5. 17 The highest mortality percentage observed in our study was in group D1, and it was higher than those observed by Portha et al. 14 Alterations in the administration route and/or animal lineage might be responsible for these different results. However, our models with induction performed on the second and fifth days of life had a lower mortality percentage as compared to the Béquer et al. study 17 using the same route. This fact might be due to a lower dose of STZ given to new-borns in our study. Thus, the present study shows that induction on the second and fifth days of life was effective concerning the reduction of mortality percentages, lower number of animals used and the costs involved in these methods.
Since the success percentage for mild diabetes induction, STZ administration on day 5 of life had the best results; it presented a higher number of included animals and higher glycemia per minute during OGTT. Diagnostic criteria and classification of diabetes for humans are defined according to the Amercian Diabetes Association guidelines, 2 which uses fasting glycemia, OGTT, or HbA1c levels as parameters. However, in rats, there is no standardization for the classification of glucose intolerance or diabetes using fasting glycemia, OGTT, or HbA1c levels. Many experimental studies using the OGTT to evaluate mild diabetes describe no values considered for the diabetic classification in non-pregnant25,26 and pregnant rats.27,28 Thus, this issue is one of the primary focuses of the present study, besides an adequate diabetes model during pregnancy.
As discussed earlier, over the years, our research group has been planning different classifications to represent the changes seen in diabetic women. About fasting glycemia, our team has previously demonstrated that it is not a good parameter in rats because they do not represent the pancreatic alterations observed in STZ-induced diabetic rats, since fasting glycemia levels in diabetic rats are not different from control rats.18,20 Thus, in the present study, OGTT results before pregnancy were used as a diagnostic criterion for mild diabetes, and a glucose level ≥200 mg/dl at least one point throughout the test was opted as mild diabetes classification. To complement the OGTT, HbA1c levels of some samples were also addressed. The diabetic rats, independent of the diabetes induction period, presented with higher levels of HbA1c. Besides, all rats from diabetic groups presented levels above 7%, while the rats from the control group presented levels below 7%. There was a positive correlation between the HbA1c levels and AUC values, showing that the OGTT criterion chosen for this experiment (at least one point ≥ 200 mg/dl) can be used as a parameter for diabetes classification in rats, as well as the AUC, since that the HbA1c may be a gold standard but it presents a more expensive cost for many research laboratories.
When the OGTT before pregnancy and on day 17 of pregnancy was compared, some diabetic animals showed an improved glucose response during pregnancy. Despite these glycemic changes, the animals continued presenting similar reproductive outcomes as observed in animals with abnormal OGTT. These findings show that the induction day and the glycemic status before pregnancy determined the maternal outcomes. All diabetic animals presented a reduction in litter weight because of the decrease in the number of live fetuses and an increase in the percentage of post-implantation losses. These outcomes are related to repercussions observed in humans, such as increased miscarriage percentage 29 and fetal deaths in a diabetic pregnant woman. 30 Despite the alterations, we observed differences in fertility percentage among the STZ-induced diabetic models. The D1 rats presented a lower percentage of mating and a higher percentage of pre-implantation embryonic losses, D2 animals had a lower number of implantation and corpora lutea, which is an indirect parameter for the number of the released oocytes, and the same results were verified in D5 rats.
It is important to understand that the ovarian development continues during the postnatal period in rodent females, and structural organization of the ovary is not fully established in the first days of postnatal life 31 since significant changes occur in the first three days of life. Thus, an injury, such as hyperglycemia, caused by the induction of diabetes in the neonatal period might be detrimental to adequate ovarian development. This fact could be related to the difficulty of the mating of D1 rats and the lower number of oocytes in D2 and D5 rats. However, in D1 mated rats, there were no abnormal numbers of oocytes, indicating that induction of diabetes in the neonatal period impairs the ovary by different pathways. Regardless of the number of oocytes, D1 animals presented significant preimplantation losses. This could be explained by maternal hyperglycemia being able to program physiological and metabolic changes by affecting glucose transport (GLUT), which causes intracellular glucose alterations and cellular death by apoptosis at the blastocysts,32,33 contributing to the impairment of remaining cells in the differentiation process, which may, in turn lead to fetal malformations and deaths, consistent with our findings. Thirteen GLUT-like proteins are present and characterized in mammals. 34 The ovaries of sheep 35 and rats 36 express GLUT-1, 3 and 4, and GLUT-1, 3, 5, 8 and 13 are constitutively expressed in humans, whereas GLUT-2 and 7 are not expressed in human granulosa cells. 37 Nevertheless, there are differences in the expression profile between species. Intra-ovarian factors, such as estradiol (E2), insulin growth factor (IGF), interleukin-1β and gonadotropin, 36 are involved in follicular development and maturation and ovulation. 38 Diabetes-induced models D1 and D5 presented abnormal fetal growth, as seen in fetuses of diabetic mothers. 39 Although there was a higher percentage of fetuses classified as LGA in these groups, an increase in the percentage of fetuses as SGA was also observed. Experimental models present fetuses classified as SGA. In contrast, clinical outcomes show diabetes-induced fetal macrosomia, and this difference is attributed to short pregnancy time in the rat and differences in the percentages of adipose tissue in rat fetuses. 8 Despite this issue, it is known that glucose is extremely important for the fetal development period. 40 However, high glycemic levels seen in rats during pre-pregnancy and pregnancy lead to an exacerbated glucose transport to fetuses, which causes disrupted fetal growth. The fact that the D2 group showed no difference from the control about fetal growth might be due to lower glycemic intensity as demonstrated by OGTT and AUC in the pre-pregnancy period and during pregnancy. Another factor involved in fetal growth is the placenta. Several experimental studies of diabetes showed damaged maternal–fetal exchanges.23,28 Our data show a reduced placental weight and increased placental efficiency in groups D2 and D5. These results indicate that these parameters should be used with caution to evaluate placental alterations in diabetic neonatal models because they may not represent the current damage related to the placental function.
In summary, the methods for the induction of diabetes using STZ are quite extensive in the literature. However, no studies compare different methods of neonatal diabetes in rats during pregnancy. Although all groups fulfill the diagnosis criteria for diabetes in their adult life, according to our investigation, only groups D2 and D5 presented better survival and fertility percentages. D1 model was not effective for studying pregnancy and presents high percentages of mortality and low fertility percentage. However, it could be the most appropriate for infertility studies. During pregnancy, the D2 group presented intermediate glycemic levels, and negative effects on fetal growth were not present.
It is necessary to highlight the limitations of this study because the results found are related to only one strain of rats and inbred and outbred strain characteristics may determine different findings. Another limiting factor to be considered is the fact that this study did not evaluate the expression or labeling of the GLUT (GLUT-2) in different tissues to evaluate the action of STZ in the three experimental groups. In addition, it should be noted that GLUT-2 can be expressed to a greater or lesser degree in different organs and presents species-specific differences. In conclusion, the animals presenting diabetes induced on the fifth day of life show deleterious effects on maternal reproductive outcomes and fetal growth, lower mortality percentage and greater success percentage in induction, showing that it is the most appropriate model to be used in studies involving diabetes-complicated pregnancy and fetal programming in Sprague Dawley rats considering the experimental conditions performed.
Footnotes
Acknowledgments
The authors thank Mr Danilo Chaguri, the technician responsible for the Laboratory of Experimental Research in Gynecology and Obstetrics, for the handling of the animals and assistance in laparotomies; to Ana Paula Martins de Campos (PIBIC/CNPq fellowship-Process Number 38069) for collecting the data and to Dr José Eduardo Corrente for the contribution in statistical analysis.
Declaration of Conflicting Interests
The author(s) declared no potential conflicts of interest with respect to the research, authorship, and/or publication of this article.
Funding
The author(s) disclosed receipt of the following financial support for the research, authorship, and/or publication of this article: Conselho Nacional de Desenvolvimento Científico e Tecnológico.
Author contribution
YKS and DCD designed the study. LLSN, LFA, APC, and EK collected the data. YKS, DCD, EK, CAM, VGP, LFA, and GTV interpreted the data. YKS, DCD, EK, CAM, VGP, BK, GTV, and VH drafted the work and performed final revision of the intellectual content. All authors were responsible for critical revisions of the paper. All authors approved the final version of the manuscript.