
Abstract
Several studies based on in vivo or in vitro models have found promising results for the noble gas argon in neuroprotection against ischaemic pathologies. The development of argon as a medicinal product includes the requirement for toxicity testing through non-clinical studies. The long exposure period of animals (rats) during several days results in technical and logistic challenges related to the gas administration. In particular, a minimum of 10 air changes per hour (ACH) to maintain animal welfare results in extremely large volumes of experimental gas required if the gas is not recirculated. The difficulty with handling the many cylinders prompted the development of such a recirculation-based design. To distribute the recirculating gas to individually ventilated cages and monitor them properly was deemed more difficult than constructing a single large enclosure that will hold several open cages. To address these concerns, a computational fluid dynamics (CFD) analysis of the preliminary design was performed. A purpose-made exposure chamber was designed based on the CFD simulations. Comparisons of the simulation results to measurements of gas concentration at two cage positions while filling show that the CFD results compare well to these limited experiments. Thus, we believe that the CFD results are representative of the gas distribution throughout the enclosure. The CFD shows that the design provides better gas distribution (i.e. a higher effective air change rate) than predicted by 10 ACH.
Introduction
Several studies based on in vivo or in vitro models have found promising results for the noble gas argon in neuroprotection against ischaemic pathologies, as summarised in review papers.1–3 The development of argon as a medicinal product includes the requirement for toxicity testing through non-clinical studies.
This study observed the effect of an argon-rich atmosphere on rats for several days. The long exposure period results in technical and logistic challenges related to the administration of the gas. In particular, a minimum of 10 air changes per hour (ACH) to maintain animal welfare following accepted guidelines 4 results in extremely large volumes of experimental gas required if the gas is not recirculated. The large cost and difficulty with handling the many cylinders prompted the development of such a recirculation-based design. To distribute the recirculating gas to individually sealed cages and monitor them properly was deemed more difficult than constructing a single large enclosure for each group that would hold several open cages.
A challenge to the enclosure design was the adequate distribution of gas to each cage such that the argon dose is kept within specified limits, adequate oxygen is supplied for animal well-being and contaminants produced by the rats are removed. To facilitate gas distribution, supply and return headers (relatively large tubes) are proposed to serve each cage. Two key concerns arose from this design regarding the micro-environment of the animals: (a) excessive gas velocity from the supply that would disturb the animals, and (b) local dead zones that would not receive adequate ventilation. Indeed, the guidelines state that ‘Direct exposure of animals to air moving at high velocity (drafts) should be avoided as the speed of air to which animals are exposed affects the rate at which heat and moisture are removed from an animal’. 4
To address these concerns, a computational fluid dynamics (CFD) analysis of the preliminary design was performed. CFD is the general term for techniques that discretise space and time to solve the equations of motion for fluids. Although this technique can be very complex, requiring experts to implement, standardised commercial software has been available for more than 20 years, and with computational power becoming less expensive, CFD is now regularly used in many industries. Indeed, the use of computer modelling for assessing and optimising animal housing ventilation has been noted, 4 but to our knowledge, this technique has rarely been used in practice.5–10 Thus, we thought that presenting the results from this analysis could be of interest.
Validation experiments providing point measurements of oxygen concentration while refilling an ambient air-filled chamber with a nominal mixture of 75%/25% nitrogen/oxygen were also performed by measuring oxygen concentration over time. In this article, the CFD results are presented in quantitative terms that are compared to the experimental measurements and through visualisations.
Methods
Enclosure design
The exposure system is based on the principle of individually ventilated cages. Figure 1 shows the supply headers and the relative position of a cage. The exposure enclosure was constructed of polyvinyl chloride with clear Plexiglas doors to allow observation of the animals. The volume is approximately 1 m3 (1.3 m ×0.5 m × 1.5 m) and holds 20 (nominally 14.8 L each) cages in five rows. Supply and return headers, large enough such that pressure drop along the tube is negligible to serve each cage equally, consist of tubes 8 cm in diameter centred over the cages to distribute a fresh gas supply and are placed along the back wall for the gas return. An important design constraint for the placement of the headers was access to the cages by technicians for handling the animals on a daily basis. Drilled into the supply header for each cage are three evenly spaced 20 mm holes facing downward into the cage for the supply and two holes facing outward placed one on either side of the cage to avoid that any fresh gas would go directly to the return without first entering the cage.
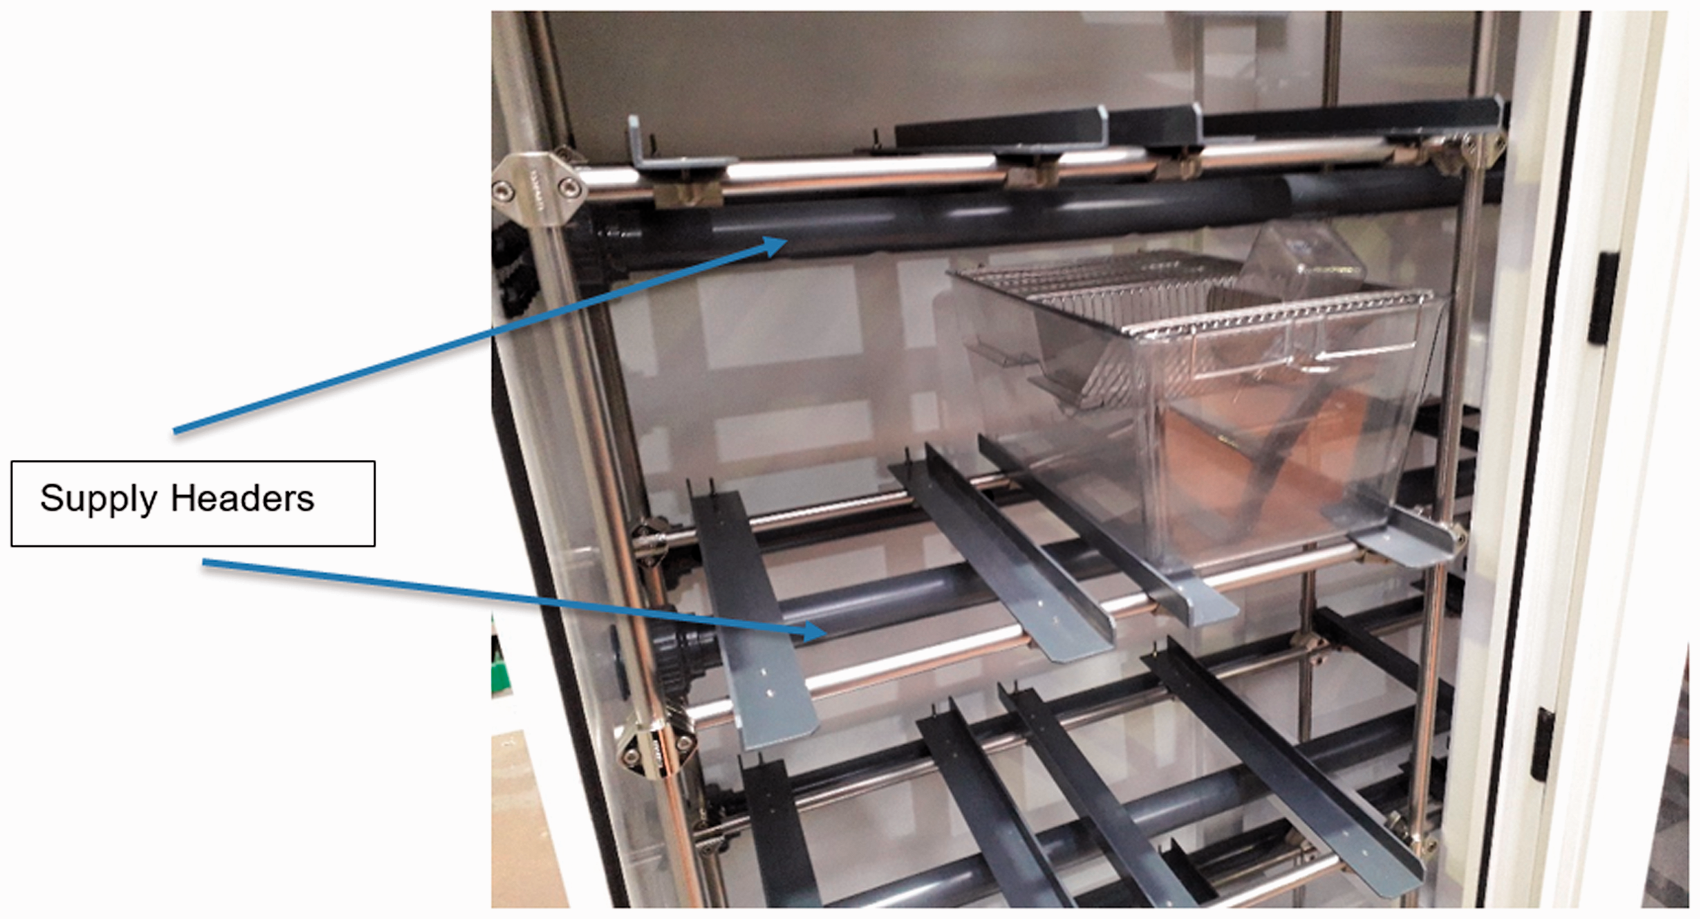
Interior of the enclosure. Supply headers are indicated. Return headers are not easily visible along the back wall. Each row of supply and return headers is connected in parallel with a large-volume tank to ensure that the flow is equal in each row.
CFD
The CFD analysis was performed using the widely used commercial package Fluent v.17.2 (ANSYS, Inc., Canonsburg, PA). The computational space represented a single cage, the supply and return apertures and the associated dead space around the cage (see Figure 2). The model did not encompass the complete enclosure because the computational power required would be infeasible and the design itself had not been fixed when the CFD simulations were performed. The CFD model was different from the prototype that was subsequently constructed in that the supply and return holes were not precisely the same in number and location and the diameter of the headers was reduced to 5 cm to allow for easier access to the cages. Furthermore, the CFD model did not include the top grill and water bottle of the cage (see Figure 1), the litter material on the bottom of the cage or the rats themselves. The simulations follow a filling of the enclosure at 170 L/min (10 ACH), holding atmospheric air with a 75%/25% argon/oxygen mixture, though as will be explained, the results are applicable to all operational modes.
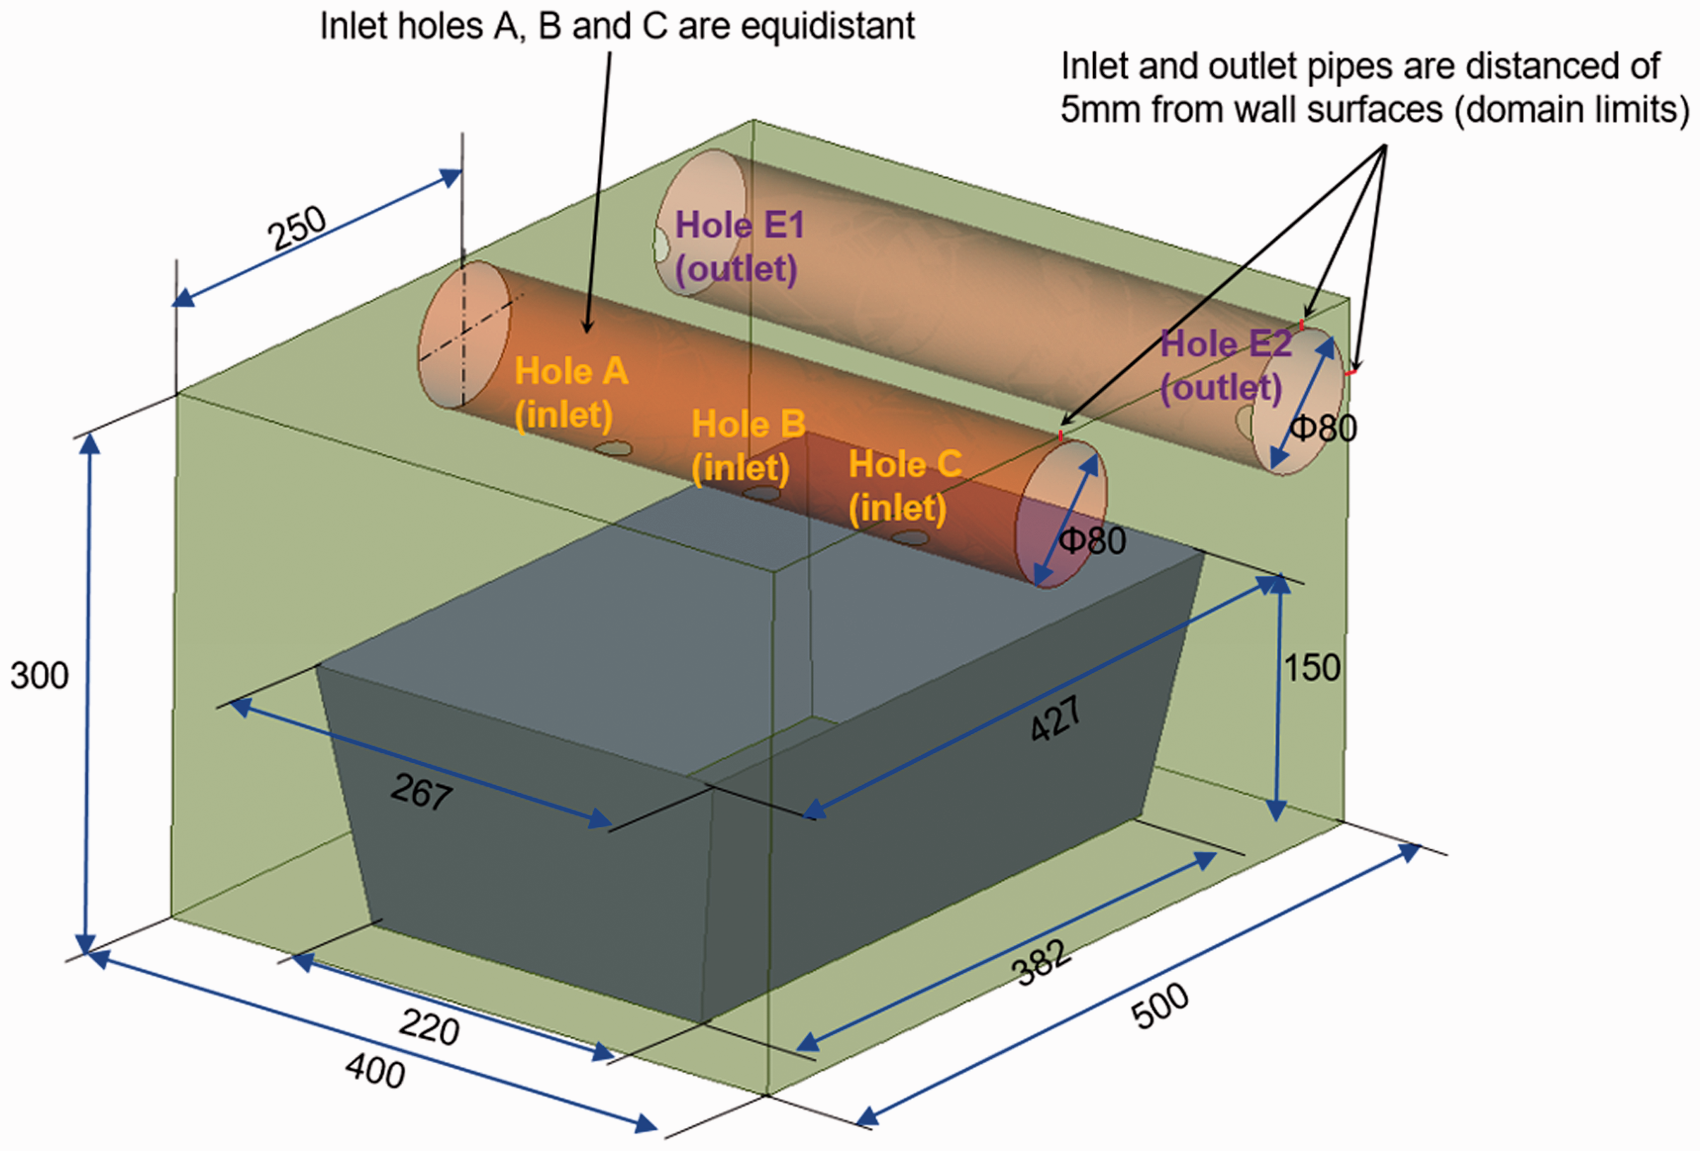
Computational space. Note that to mimic the complete enclosure, the return apertures between the cages were modelled as half-circles, and periodic boundary conditions were imposed on the right and left of computational surfaces. The dimensions are in millimetres.
Within Fluent, transient CFD simulations were performed using the finite volume solver with second-order accurate discretisation schemes for all terms. Pressure–velocity coupling was achieved using the SIMPLE algorithm and the k-ε turbulence model, where k is the turbulent kinetic energy and ε is the rate of dissipation of turbulence energy. The theoretical framework and correlation constants for the turbulence model are provided in the Fluent Theory Guide. 11 The initial conditions are uniform air and zero velocity. The boundary conditions included no slip and no penetration at the walls and uniform velocity profiles at the gas supply and return holes. Periodic boundary conditions (normal spatial derivatives set to zero) were applied to the right and left computational surfaces to simulate a single cage, thereby greatly reducing the computational resources required. The computational applied flow rate was 8.5 L/min (1/20 of the overall rate of 170 L/min for the enclosure). The grid comprised 1.5 million cells.
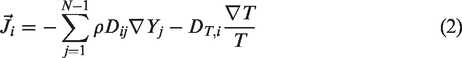
The convection and diffusion of the gaseous species was solved according to with the following equation:

Theoretical fully mixed model
The ventilation micro-environment in the CFD cage model described previously will be compared to the standard of 10 ACH. The calculation of ACH is a measure of how many times the air within a defined space is replaced. For the enclosure, this is simply:


Validation experiments
Validation experiments were performed based on measured oxygen concentration while filling the enclosure, originally filled with ambient air, with nominally 75%/25% nitrogen/oxygen mixture (measured at 23.8% oxygen). Thus, the relevant signal was oxygen content measured with an oxygen sensor (MiniMP 5200; Servomex, Crowborough, UK) with the probe placed within a single cage approximately in the centre, 20 mm above the bottom. The sample flow rate to the sensor was 500 cm3/min. A two-point calibration of the sensor with 100% nitrogen (0% oxygen) and ambient air (20.9% oxygen) was performed on the same day as the experiments. Data were recorded at 1 Hz (GL840; Graphtec, Yokohama, Japan). Total gas flow into the enclosure was set at approximately 170 L/min (10 ACH for the 1 m3 enclosure) as measured by a thermal mass flow meter (Series 4000; TSI, Inc., Shoreview, MN). The test was repeated with the sensor in the bottom-left cage and the top-right cage to investigate homogeneity between cages.
Results
Experimental validation
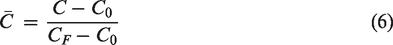
The experimental concentration data and the CFD results were normalised according to equation (6):
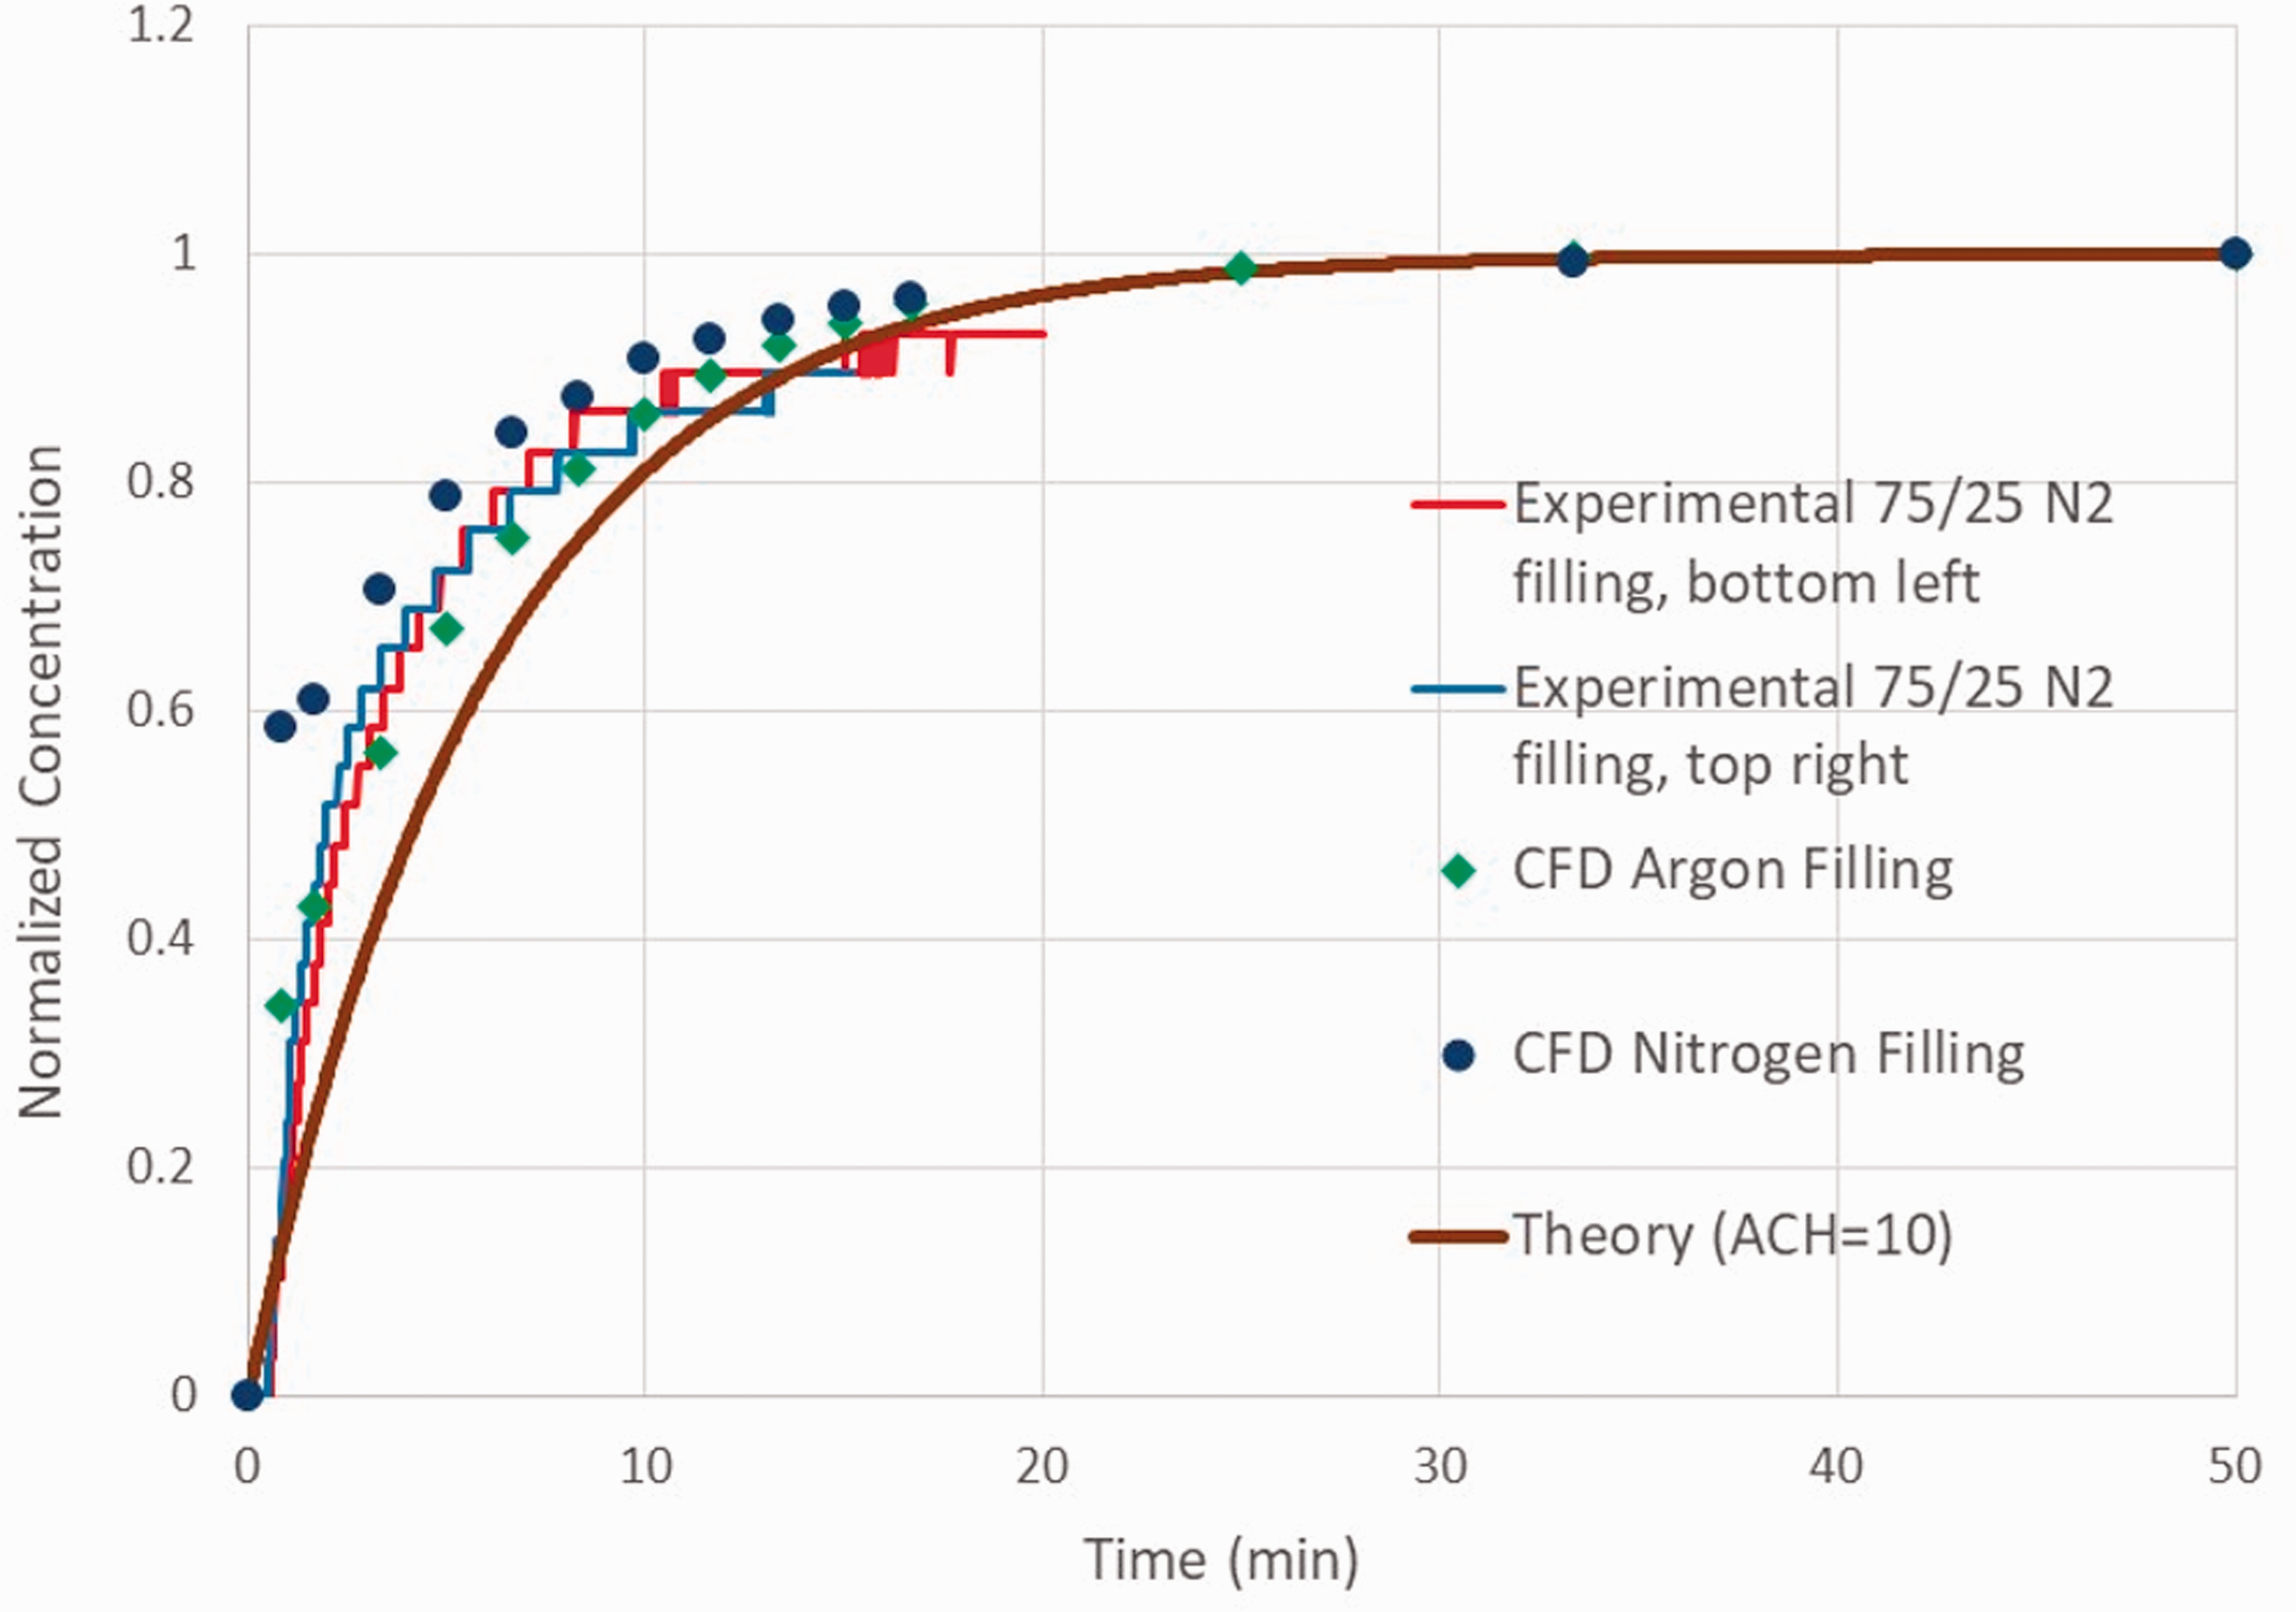
Change in the normalised oxygen mole fraction comparing experiment, CFD and theoretical results.
Velocity
A representative colour contour plot of the velocity at the plane 20 mm above the bottom of the cage in the computational space is shown in Figure 4. At this level of the rat pups, the maximum velocity (0.0232 m/s) is <0.1 km/h. The velocity distribution in the mid-plane and the side computational surfaces is shown in Figure 5. Note that the highest velocity (red) is in the return hole. Figures 4 and 5 are at 1200 seconds from the start of the simulation. The velocity distribution in the space is transient but becomes steady after about 2500 seconds.
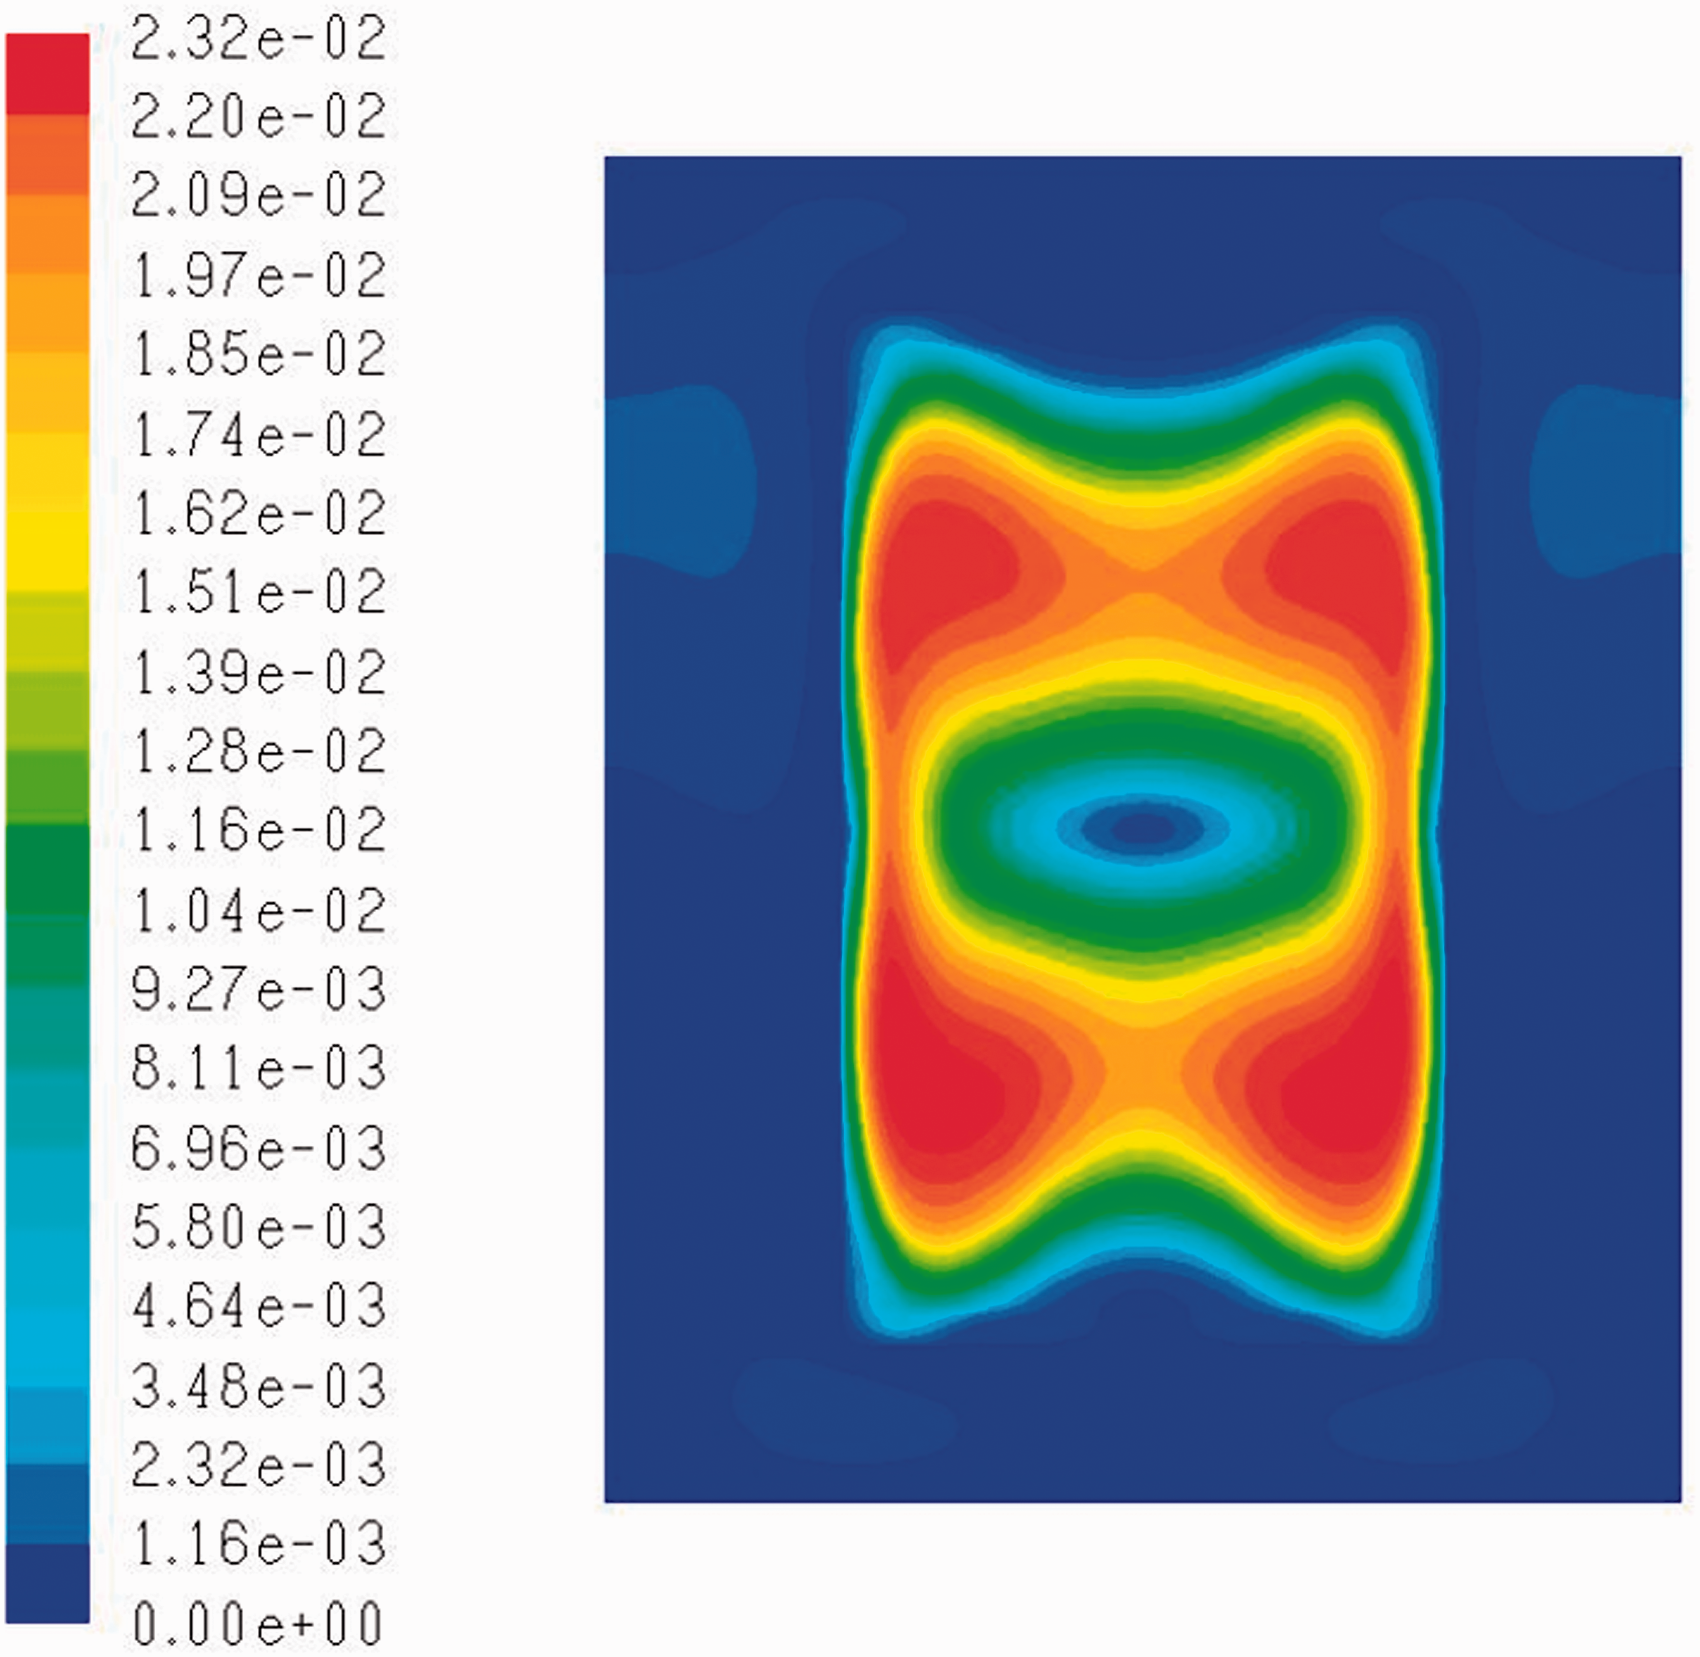
Velocity magnitude (m/s) 20 mm above the bottom of the cage. Note the very low velocity (blue) exterior to the cage.
Velocity (m/s) in the mid-plane and along the sides of the computational space. Note that the highest velocity (red) is in the return holes.
Argon filling
A colour contour plot of the argon concentration fraction of the computational space is shown in Figure 6. This image is at 1200 seconds. The high concentration supply jets of incoming gas are evident. The uniform colour green (between Ar fractions of 0.732 and 0.734) within the cage indicates that the cage atmosphere is fully mixed without dead zones.
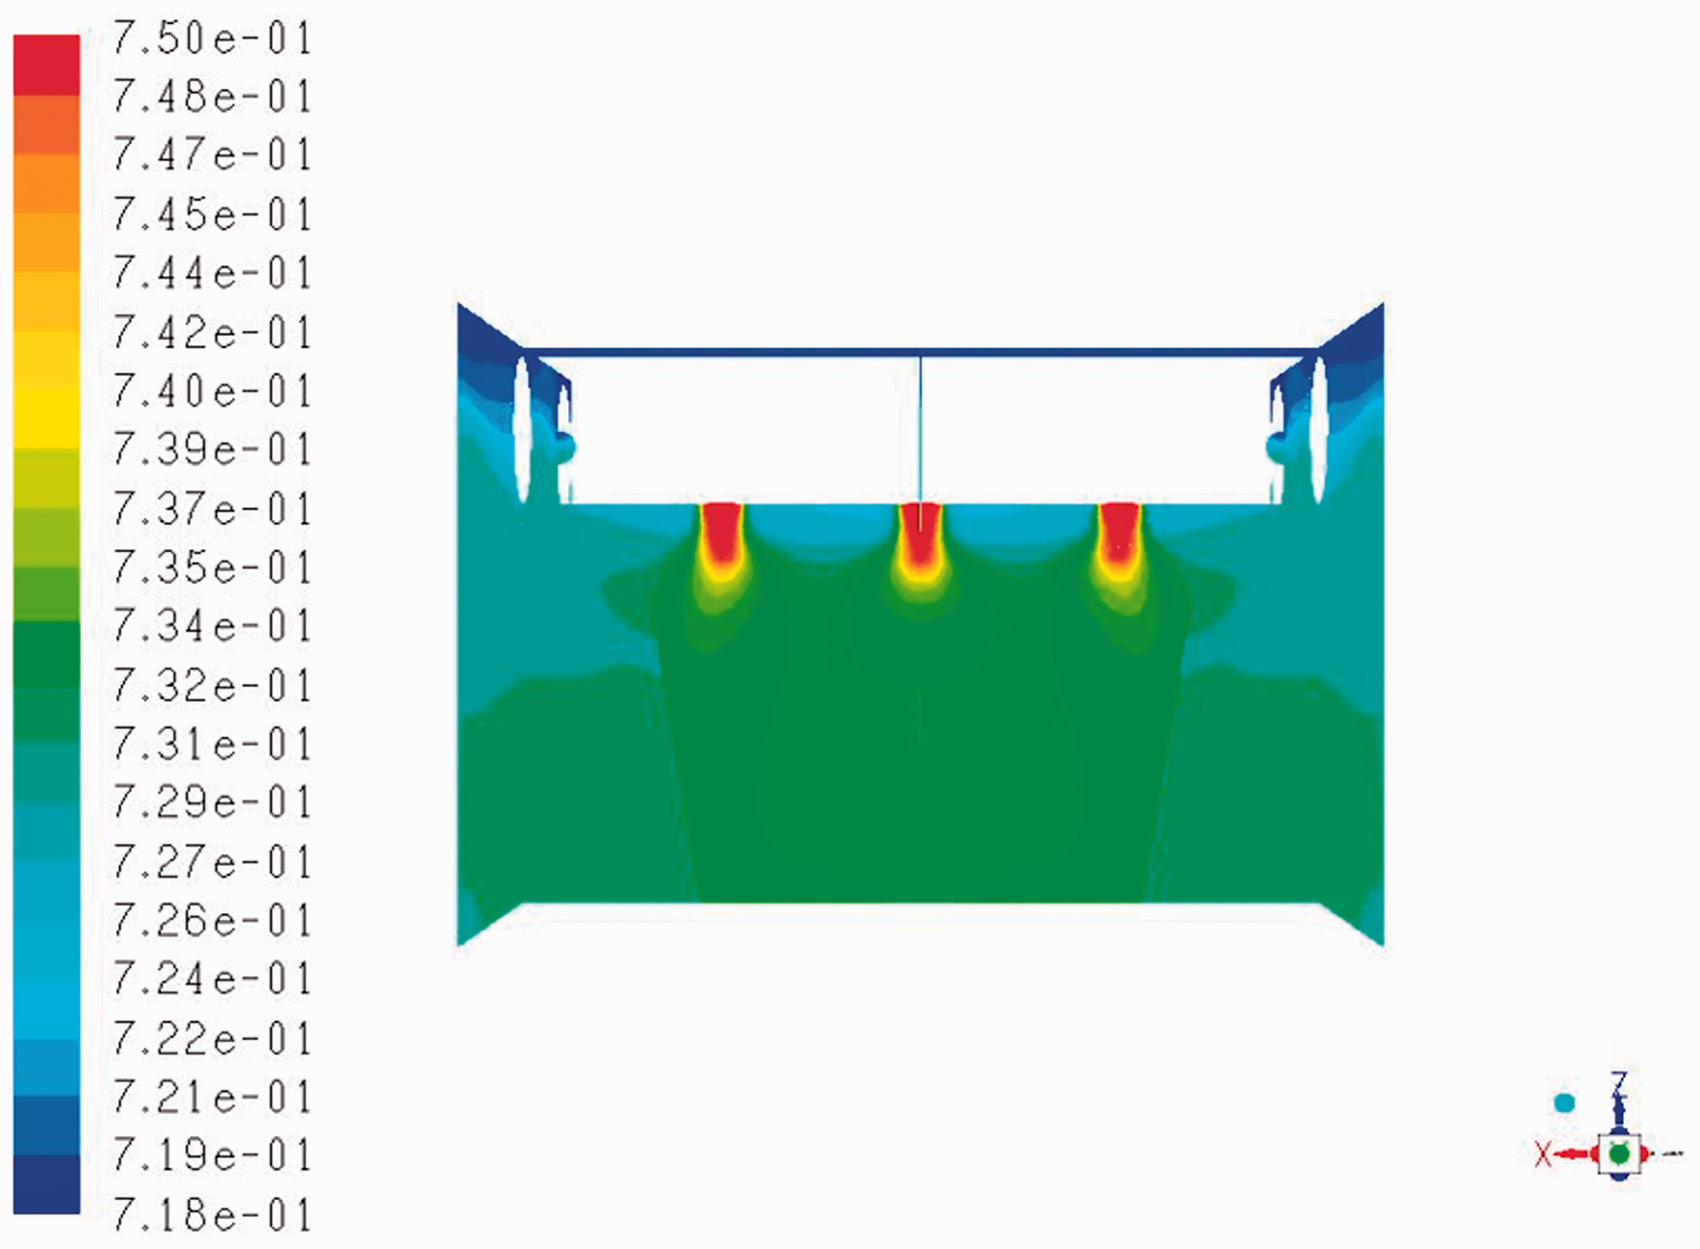
Argon mass fraction in the mid-plane of the cage after 1200 seconds. Note the maximums in the supply apertures and the uniform fraction in the cage. The dead zones above the cage are the slowest to fill.
Gas clearance
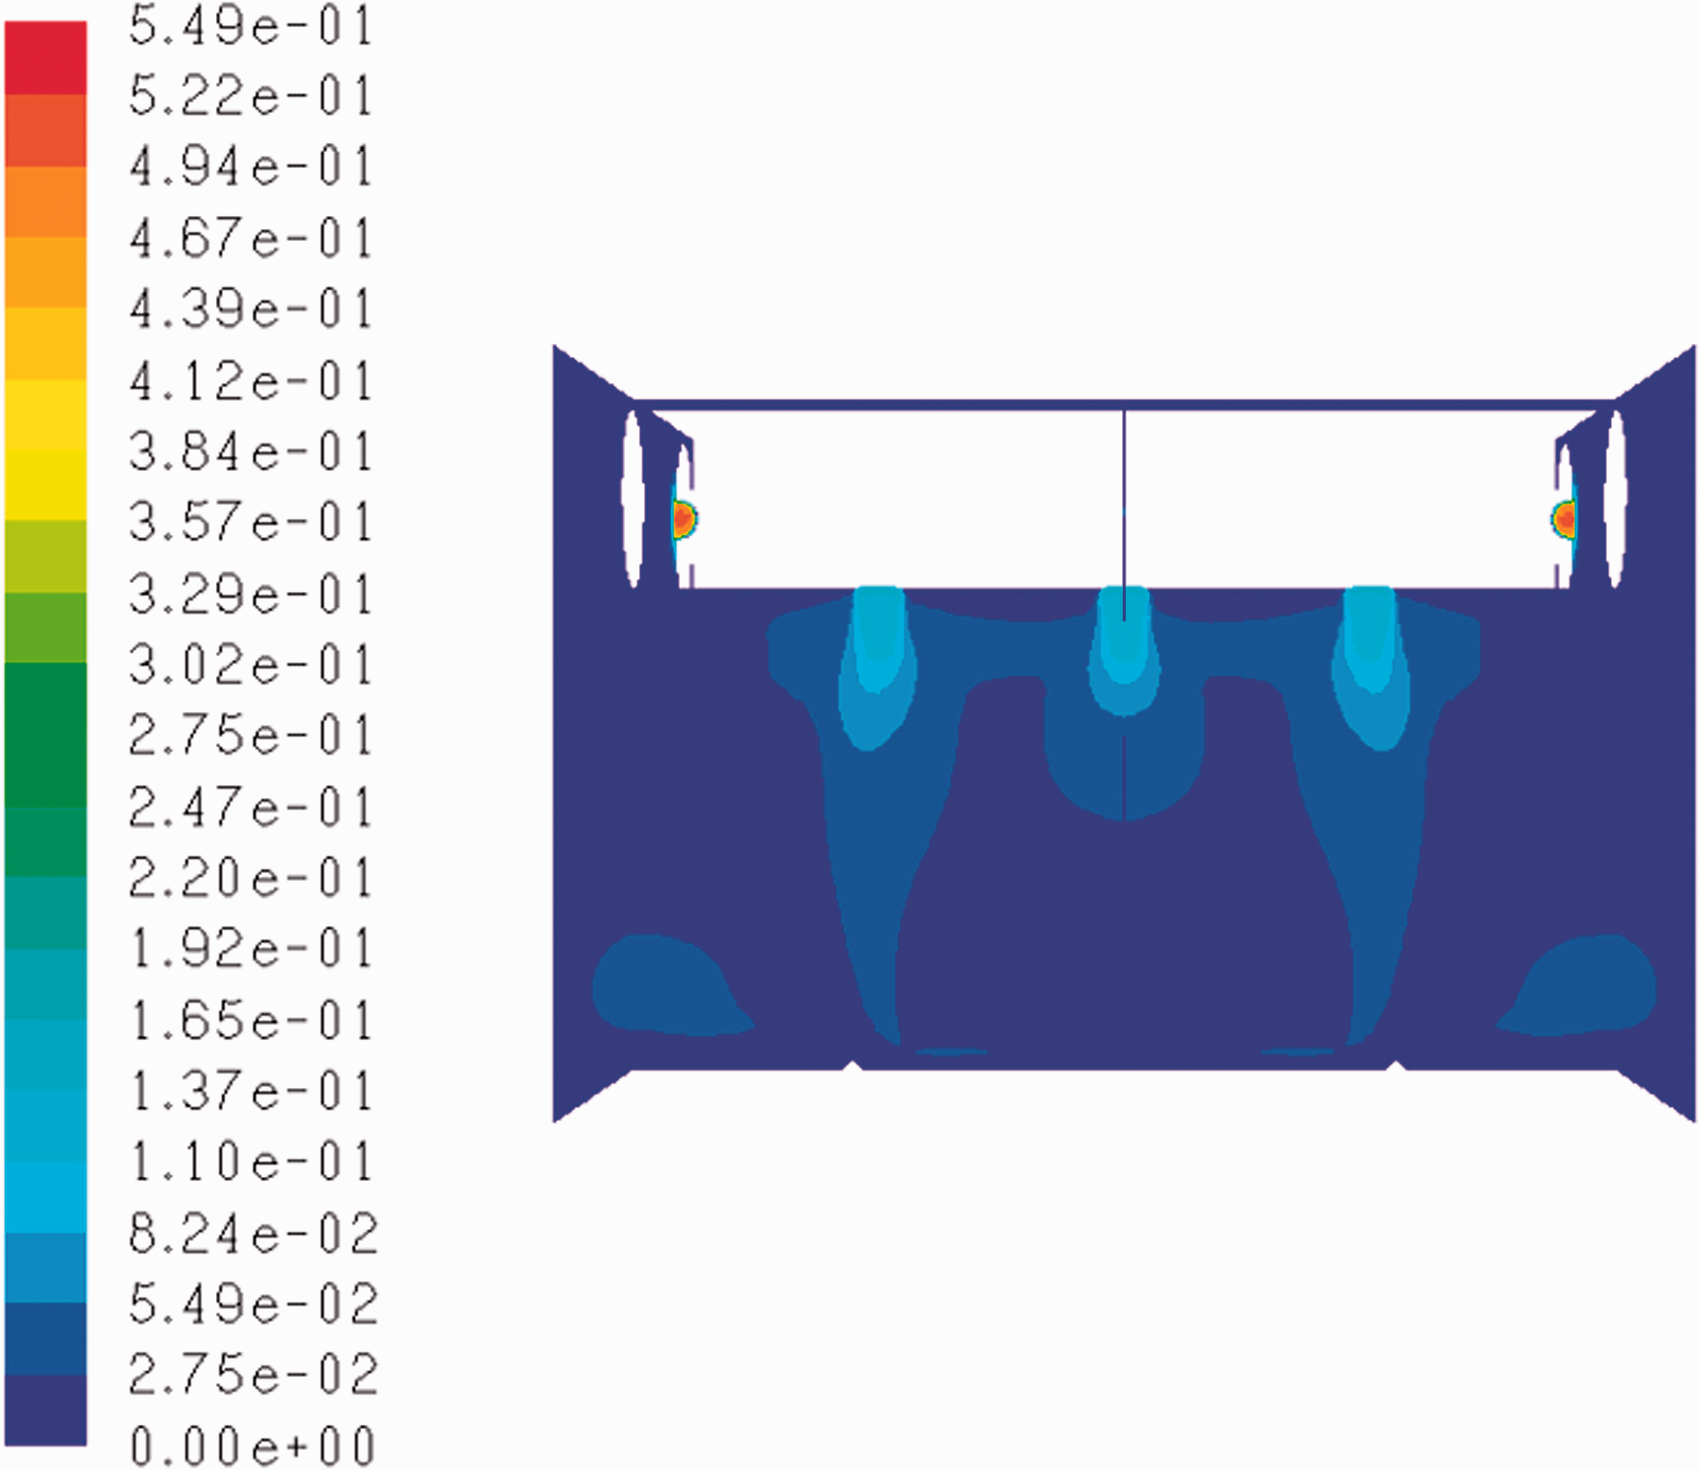
A representative colour contour plot of the nitrogen mass fraction at the mid-plane of the computational space at 1200 seconds is shown in Figure 7. The low (zero) concentration supply jets of incoming gas are evident. The variation of green within the cage indicates that the cage atmosphere shows some minor variation (fractional difference of 0.004 or 0.4%). This almost negligible variation with no obvious dead zones implies that contaminant clearance will be satisfactory.
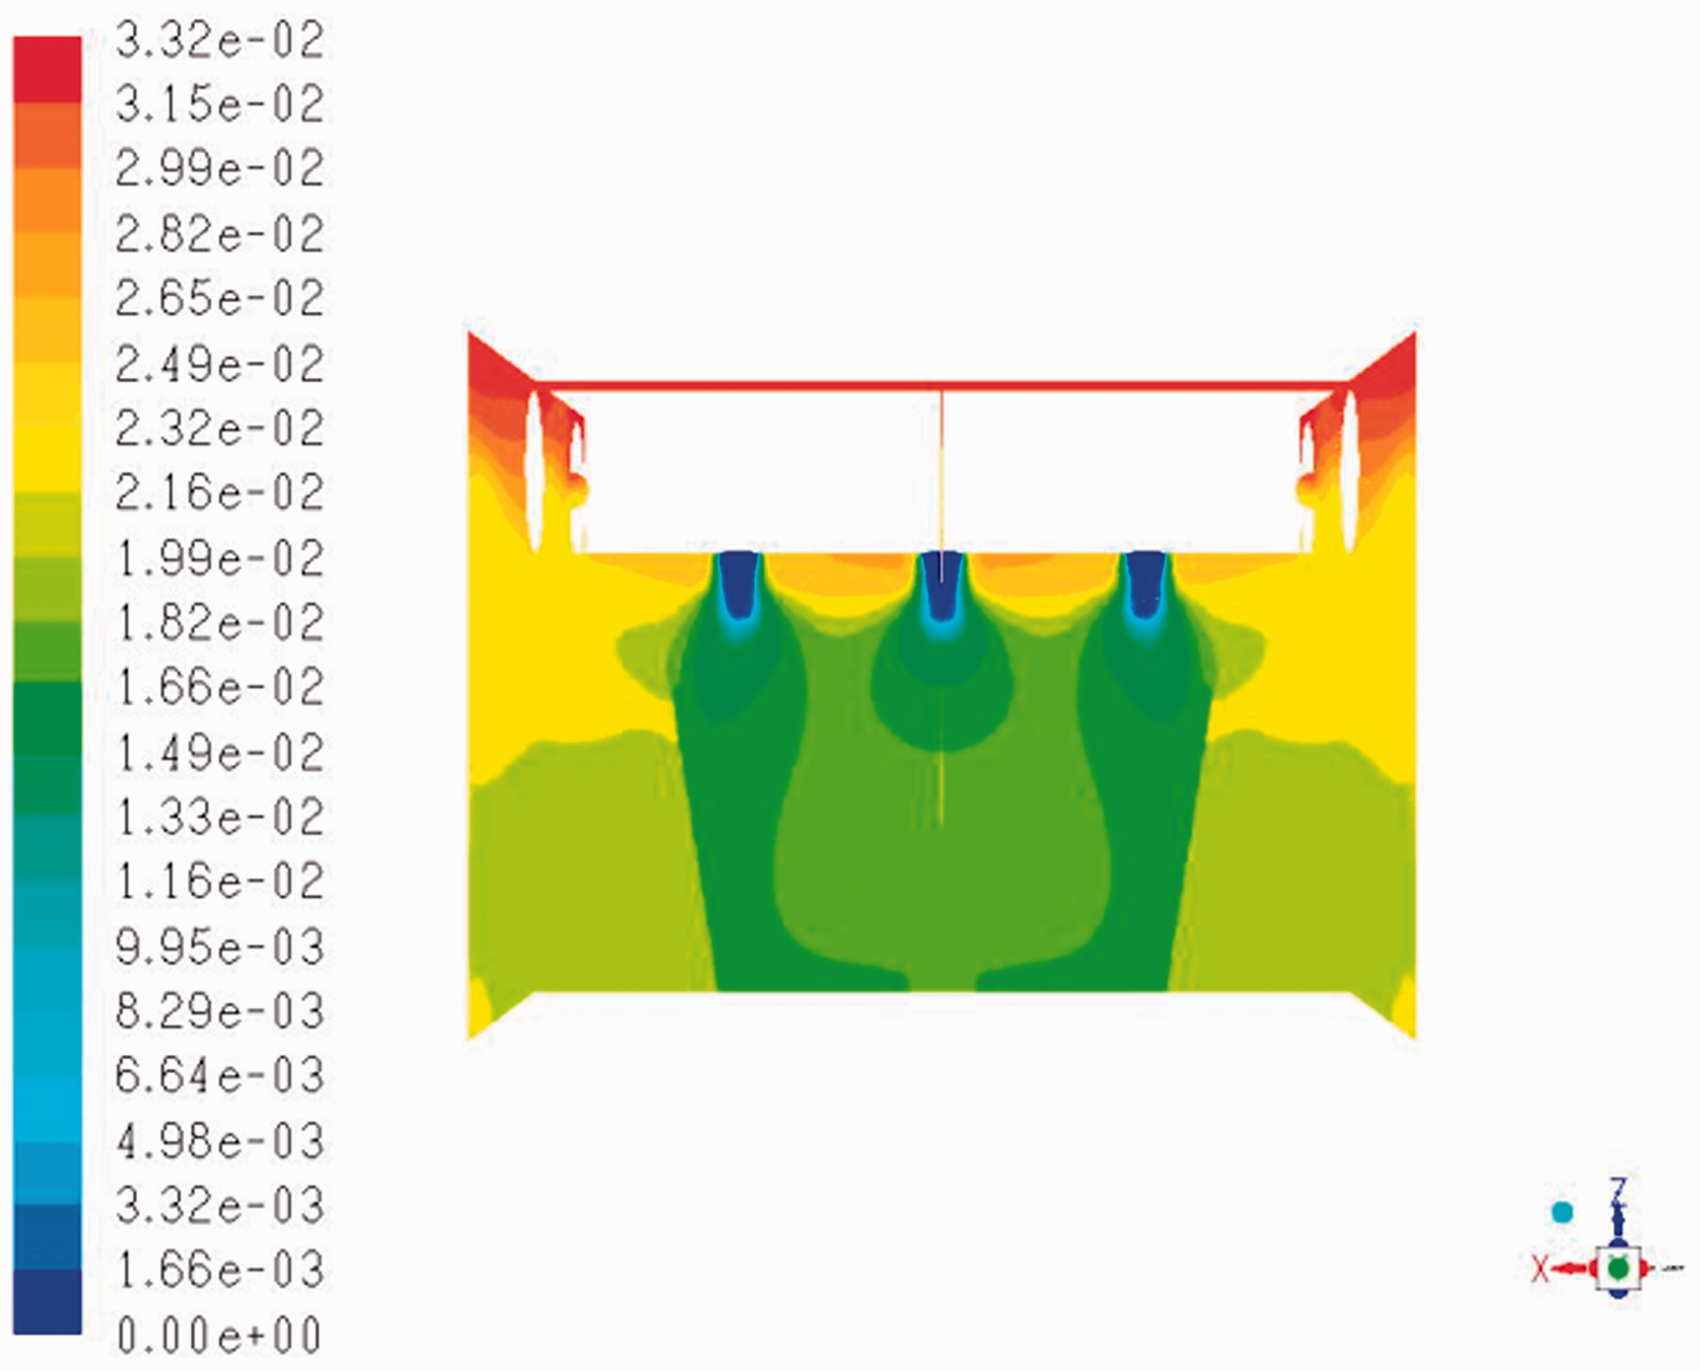
Nitrogen mass fraction in the mid-plane of the cage after 1200 seconds. Note the minimums in the supply apertures and the relatively uniform fraction in the cage.
Discussion
A CFD analysis of the preliminary design of an enclosure for a non-clinical toxicity study proposed to expose rats to an argon atmosphere has been performed. Comparisons of the simulation results, to point measurements of oxygen at two cage enclosure positions while filling, show that the CFD curves compare very well to these limited experiments. Furthermore, the time constants calculated and measured are all consistently below the 6-minute value for ACH = 10. The real time for a complete air change (five time constants) is about 18 minutes as measured: 10 and 20 minutes for the nitrogen and argon CFD results, respectively. The CFD results may reflect a real difference due to the density differences of the gas mixtures. However, these differences between gases should be negligible in terms of animal safety. Thus, we believe that the CFD results, backed up with limited confirmatory experimental data, are representative of the gas distribution throughout the enclosure.
The CFD analysis confirms that the design provides better gas distribution (i.e. a higher effective ACH) than under the assumption of fully mixed gas in the enclosure. The optimised distribution is indicated in the flow visualisation by the dead zones located outside of the cages (i.e. the blue zone above the cage in Figure 6). In addition, as shown in Figures 4 and 5, the maximum velocity of <0.1 km/h should not disturb the animals.
Flow visualisation is one of the traditional subfields of data visualisation, which is a research field in itself, covering a wide variety of applications with many different research and engineering goals and user types. Consequently, the spectrum of flow visualisation techniques is very rich, spanning multiple dimensions of technical aspects, such as two- and three-dimensional techniques, and techniques for steady and time‐dependent data. 13 The examples of flow visualisation shown in Figures 4–7 indicate that the gas distribution is suitable for the proposed study, optimising the gas exposure and animal welfare before building the enclosure. In particular, the gas velocity within the cage is low, and the fresh gas is well distributed. Furthermore, for this toxicological application, the visualisation can provide understanding, and therefore ultimate approval by competent authorities for the overall experimental approach, much more persuasively than only the point measurements of gas concentration that were the practical alternative.
The limitations to this study include the reduction in computational space to one cage without animals and surrounding dead space and the omission of the physical details (e.g. top grill and water bottle) as indicated previously. The top and bottom boundary conditions were considered as walls, while in reality there is space for exchange between the rows of cages. We were not able to perform a physical experiment with argon at the required flow rate. However, the expected difference between the gas mixtures is expected to be insignificant, as indicated by the CFD results in Figures 3. The physical system beyond the geometry could also have been investigated in more detail. However, in practice, the experimental data with real cages were sufficiently close to the theoretical model that this additional work was not warranted. In particular, a thermal analysis (including humidity) might have reduced the number of tests required to assure that the design was well suited for animal welfare.
In conclusion, in the argon toxicity study described herein, CFD provides visualisation of the gas administration in fine detail that is very difficult to obtain experimentally. Thus, when combined with physical concentration measurements, it provides confidence in the suitability of the design and a methodology for documentation to be provided to competent authorities.
Footnotes
Declaration of Conflicting Interests
The author(s) declared no potential conflicts of interest with respect to the research, authorship and/or publication of this article.
Funding
The author(s) received no financial support for the research, authorship and/or publication of this article.