
Abstract
Subcutaneous tumour xenograft volumes are generally measured using callipers. This method is susceptible to inter- and intra-observer variability and systematic inaccuracies. Non-invasive 3D measurement using ultrasound and magnetic resonance imaging (MRI) have been considered, but require immobilization of the animal. An infrared-based 3D time-of-flight (3DToF) camera was used to acquire a depth map of tumour-bearing mice. A semi-automatic algorithm based on parametric surfaces was applied to estimate tumour volume. Four clay mouse models and 18 tumour-bearing mice were assessed using callipers (applying both prolate spheroid and ellipsoid models) and 3DToF methods, and validated using tumour weight. Inter-experimentalist variability could be up to 25% in the calliper method. Experimental results demonstrated good consistency and relatively low error rates for the 3DToF method, in contrast to biased overestimation using callipers. Accuracy is currently limited by camera performance; however, we anticipate the next generation 3DToF cameras will be able to support the development of a practical system. Here, we describe an initial proof of concept for a non-invasive, non-immobilized, morphology-independent, economical and potentially more precise tumour volume assessment technique. This affordable technique should maximize the datapoints per animal, by reducing the numbers required in experiments and reduce their distress.
In preclinical oncology studies, subcutaneous tumour models are used to investigate the pharmacology of anti-cancer agents. These animal models rely on an estimation of the tumour volume, which can be estimated visually. Two methods of assessing tumour volume are typically used: calliper and in vivo imaging-based methods. In vivo imaging-based methods are generally more accurate than calliper measurements,1–3 but are laborious and dependent upon animal immobilization. Calliper methods are widely used, but rely on the measurement of characteristic lengths (length, width and/or height). In an effort to improve accuracy, 3D visual scanners demonstrate increased accuracy, and are minimally disruptive to the animals, but have limitations with regard to speed of image acquisition and animal manipulation.4,5 We propose the first stages of an off-the-shelf technique, which should overcome the problems of implementation observed until now, reducing both the number of animals needed and their distress.
Animals
Eighteen tumour-bearing NSG mice were used from several pre-existing experiments. No extra animals were employed specifically for this study. The mice were selected to reflect diverse morphologies and sizes. The methods of animal handling, maintenance and euthanasia (by cervical dislocation) were compliant with UK Home Office legislation, the Animal Scientific Procedures Act 1986 (ASPA), and with the AstraZeneca Global Bioethics policy. All experimental work was outlined in project licence 40/3483 which had gone through the AstraZeneca Ethical Review Process.
Materials and methods
Three calliper measurements were taken post-necropsy: width w, length l and depth d. The tumour is assumed to be either ellipsoid (
We used an off-the-shelf 3D time-of-flight (3DToF) camera (SoftKinetic DepthSenseDS325 Professional; SoftKinetic, Brussels, Belgium). This device provides both a visual HD720p image and a 240 × 320 pixel depth map. The camera captures continuous frames at 25 fps. We then randomly capture six frames and calculate their arithmetic rolling average. The method was calibrated using four clay mice with known tumour volumes.
Results
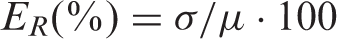
Inter-experimentalist variability introduces significant error. Three different expert experimentalists measured the same tumours with ellipsoid and spheroid methods. Figure 1a presents the data in relative deviation from the mean:
(a) Inter-experimentalist variability for clay and animal models. Errors range from 3% to 14% in (oversized) clay models and 2% to 25% in real mouse xenografts. (b) 3DToF tumour depth map example for (oversized) clay mouse. (c) 3DToF tumour region depth map example for a small mouse xenograft.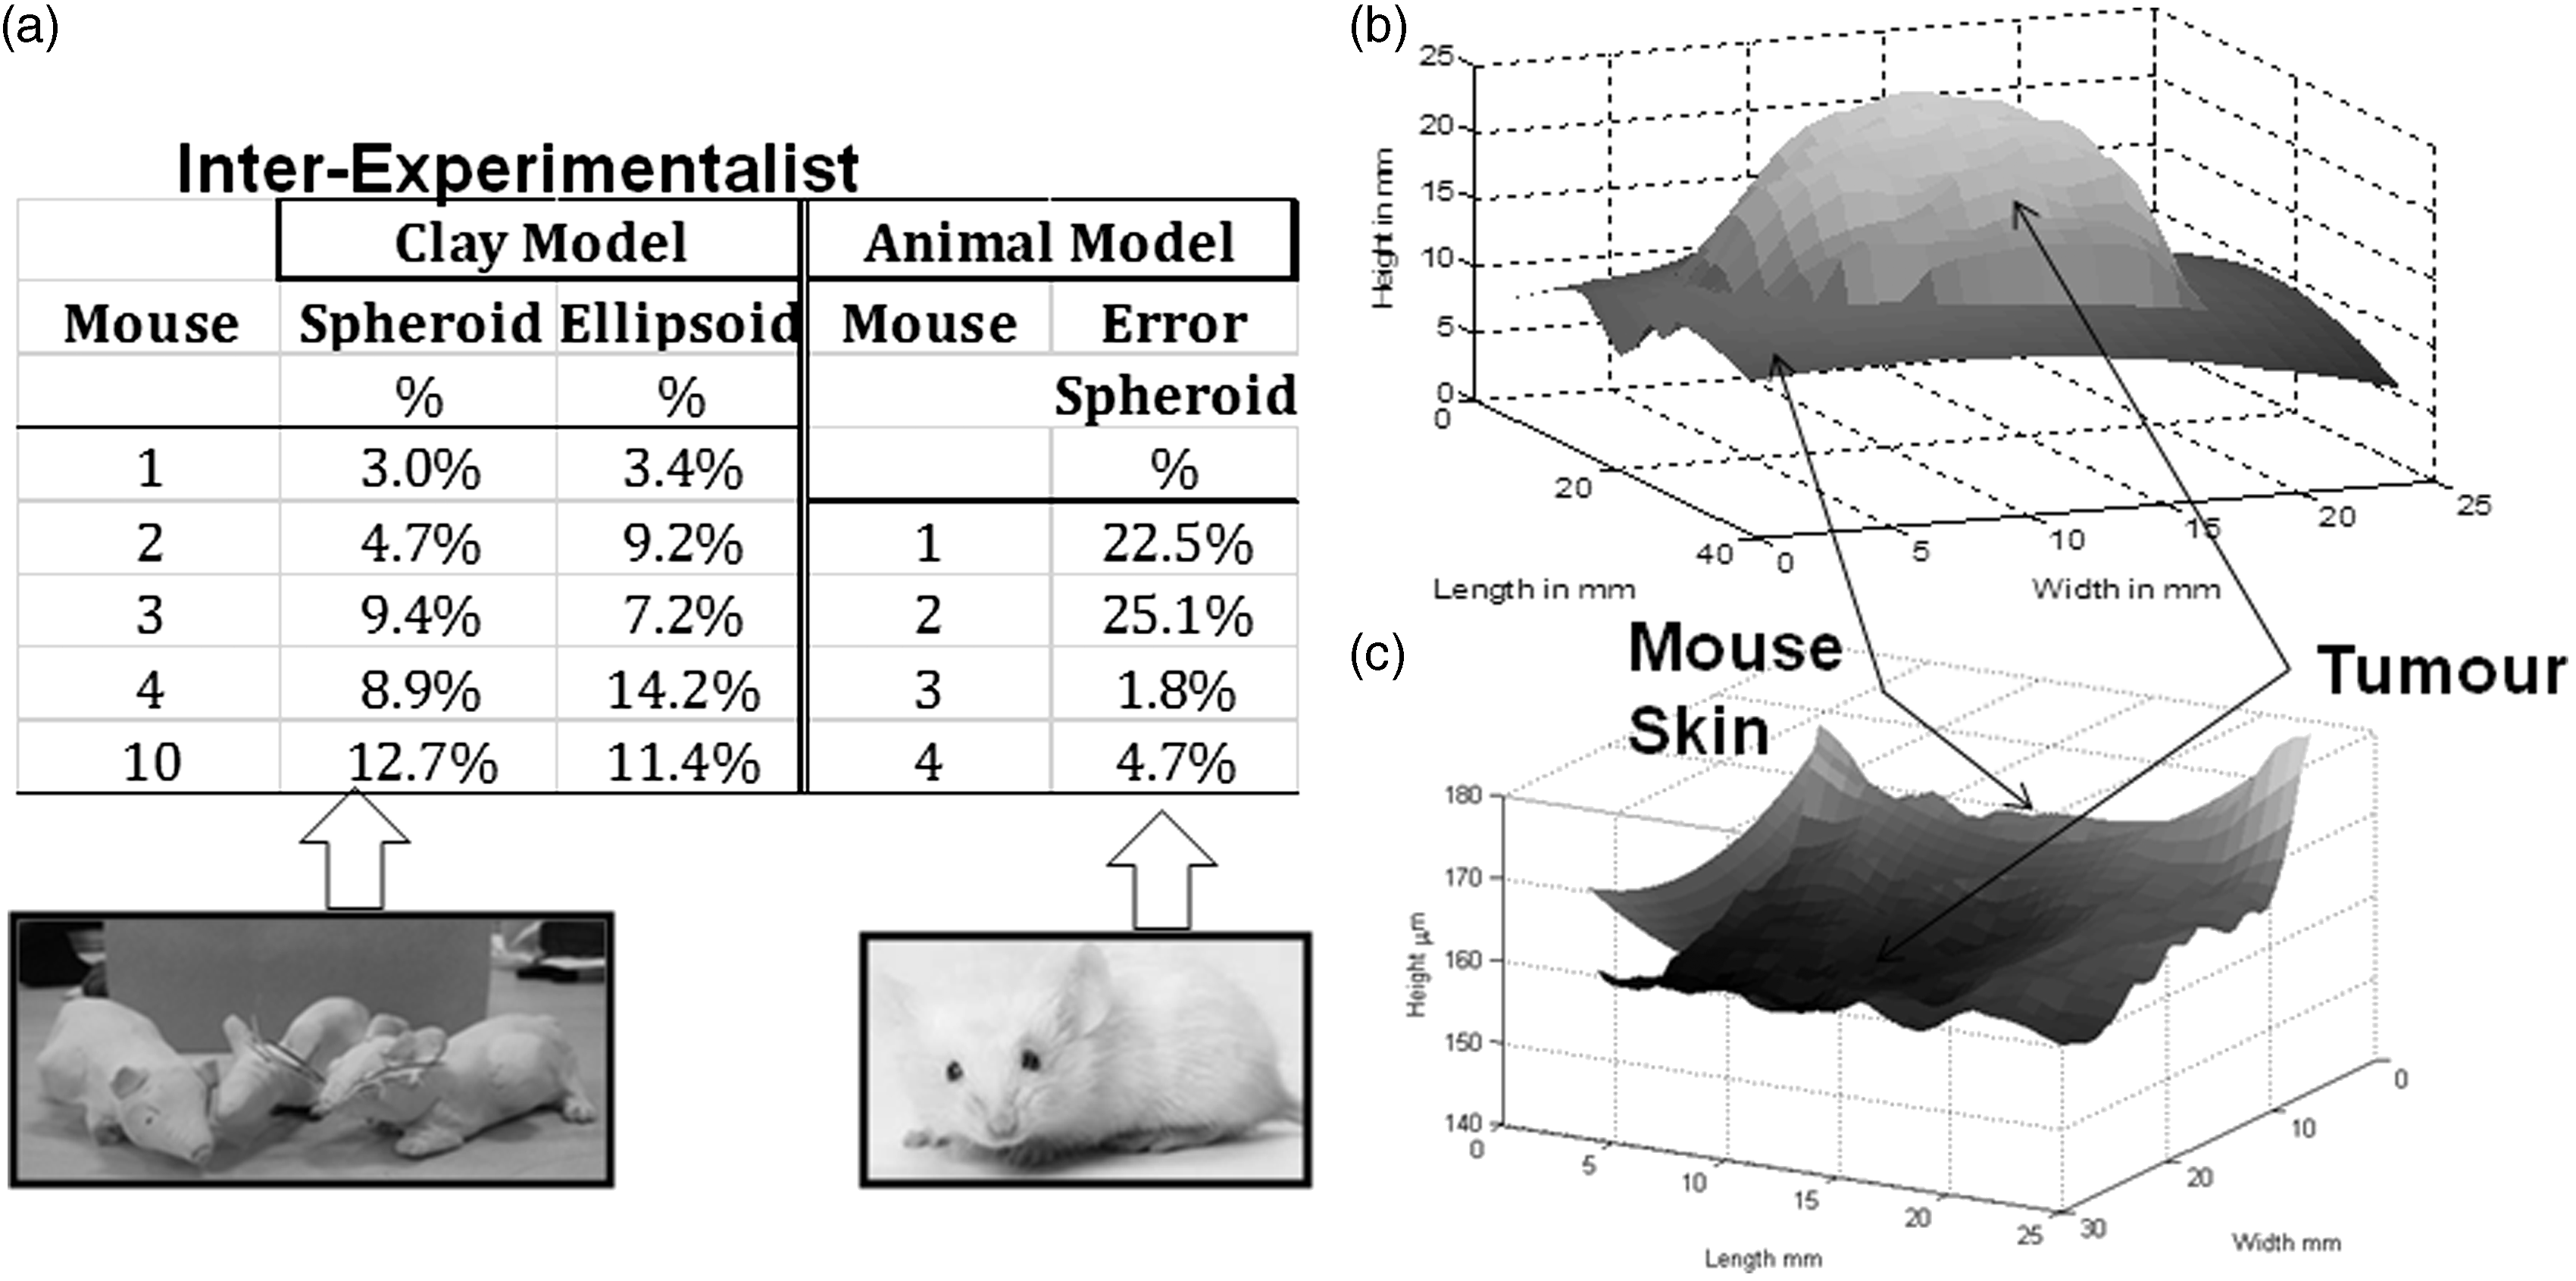
Deviations from the mean for the regularly-shaped clay tumours were between 3 and 14% for calliper methods. The clay mouse showed a narrower deviation from the mean (1.8%), consistent with the fact that the tumour was close to being spherical.
Experiments: calliper versus 3DToF
For each mouse, three characteristic lengths of tumours were measured using an electronic calliper. The mice were then sacrificed and imaged using the 3DToF camera. The tumours were then excised and weighed as part of the normal protocol of the study.
Semi-automated image analysis was applied to the 3DToF-acquired depth maps. The camera was designed to detect hand gestures and we found the depth maps it generated to be very noisy.
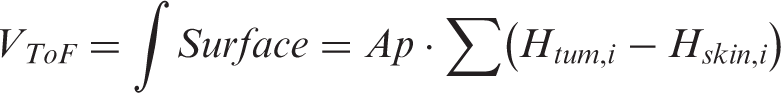
The area of the depth map corresponding to the mouse flank was manually cropped and the tumour region was outlined to distinguish it from the background (i.e. the animal’s flank). A parametric quadratic surface of the type:
Hand-made clay mouse models were used as a basis for the calibration and parameterization of the camera and method. These had tumours with regular shapes and slightly exaggerated sizes of 1–2 cm3. The results using the 3DToF method compared with calliper measurements are presented in Figure 2a. Error is calculated relative to the true volume as measured using weight:
Tumour volume results. (a) Results of volume estimation error (y-axis) of the 4 clay mice (x-axis) for the 2 calliper methods and 3DToF. (b) Results of animal models. Solid lines represent ranges of human physiological densities (tumour xenografts should be between them). Dashed/dotted lines are fits of the 3 methods. Markers are individual measurements.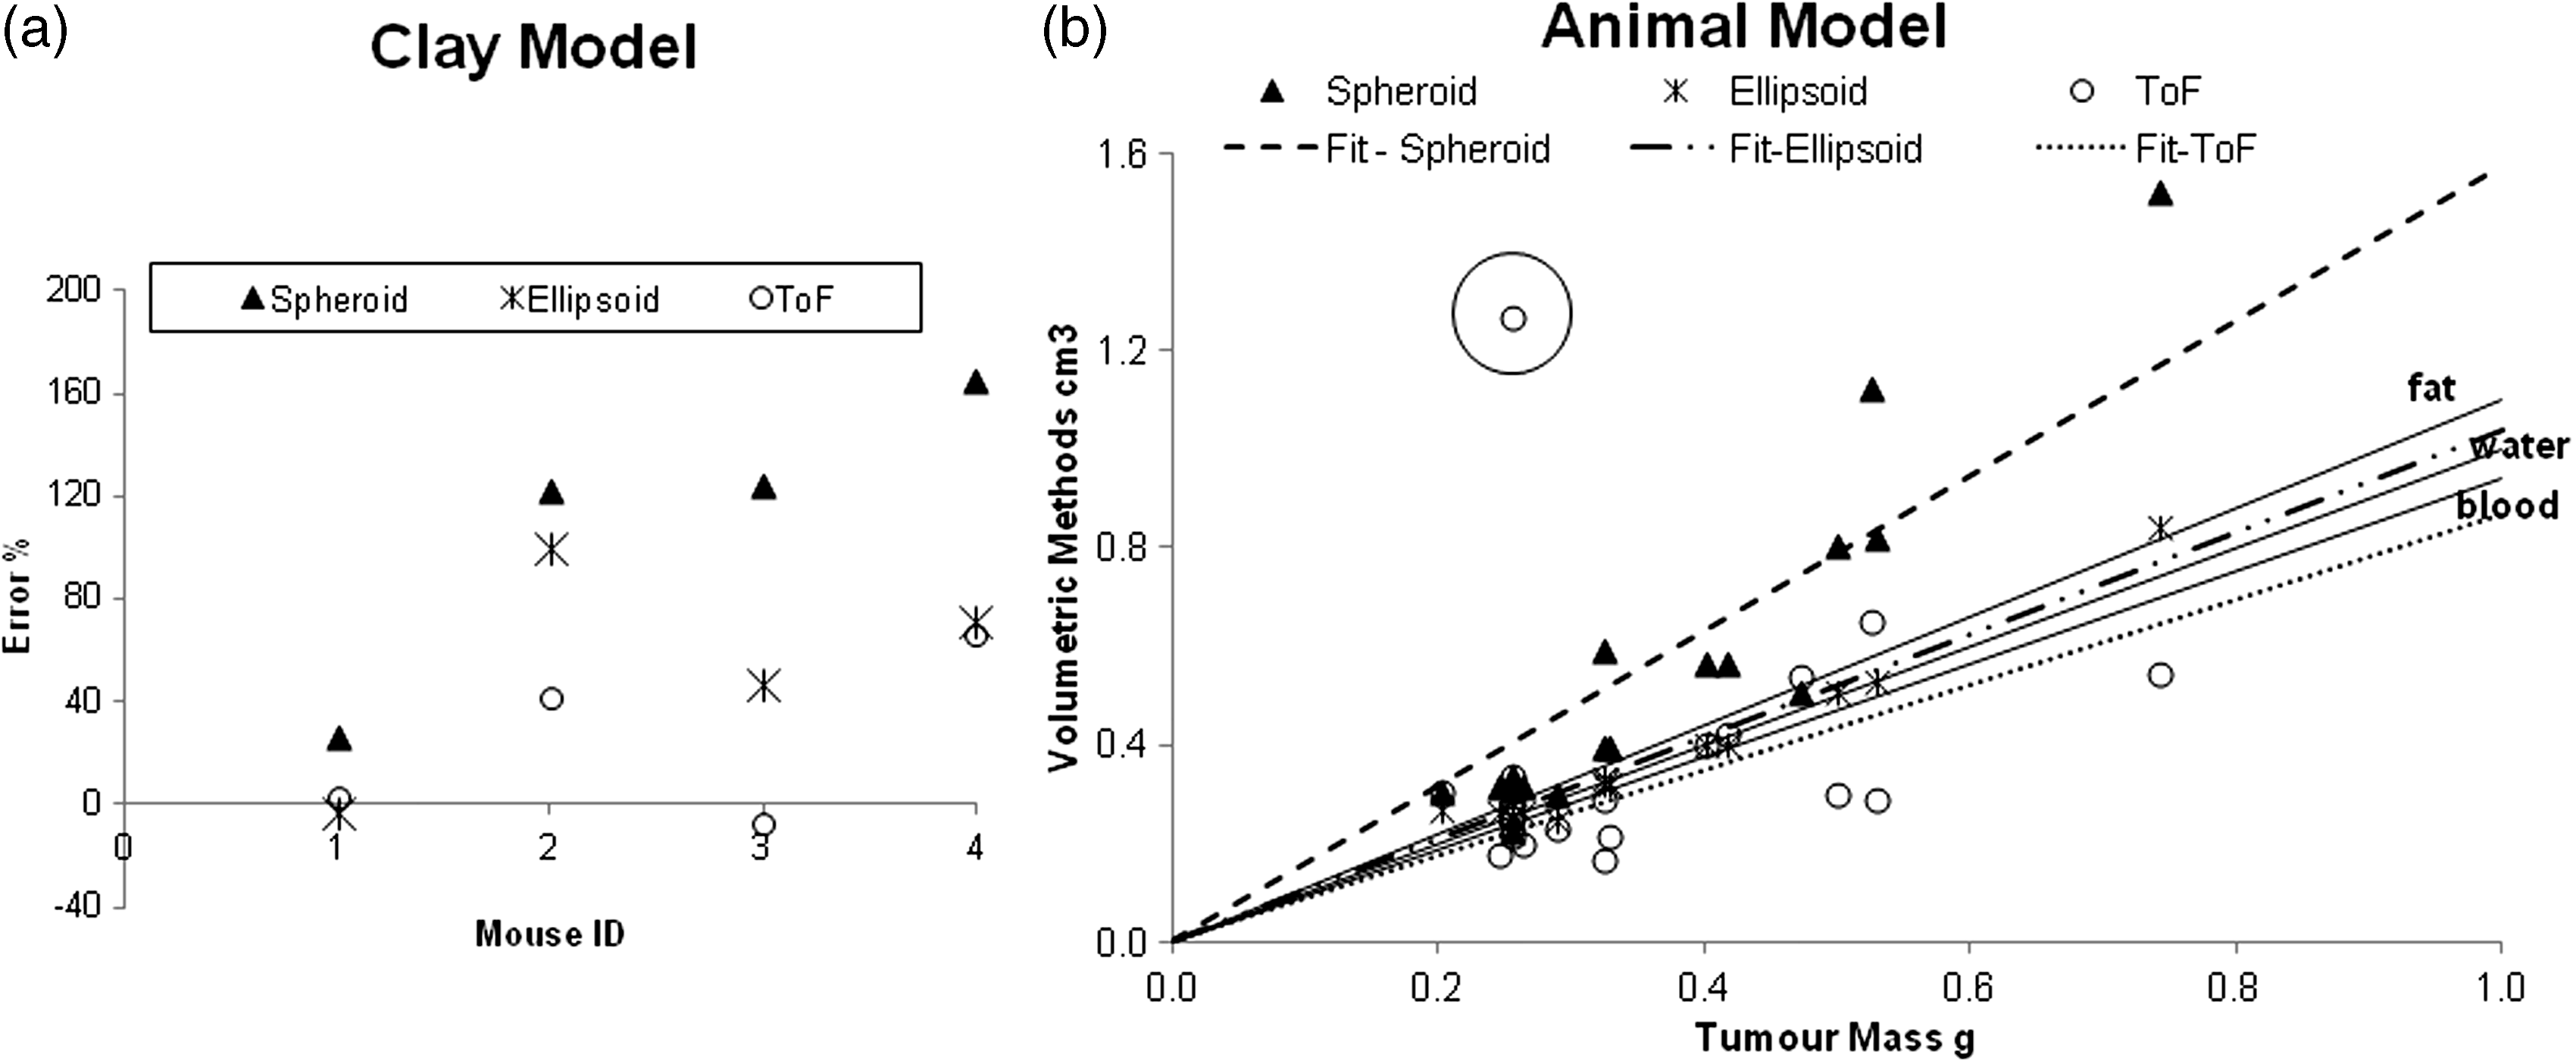

Tumour volume measurements in real mice are plotted against weight in Figure 2b. Three density lines are also shown (covering all physiological densities observed in mammals, 0.9 g/mL [fat] and 1.06 g/mL [plasma]). We assumed 1 g/cm3 as our baseline measure. Figure 2b contains linear fits with a forced zero y-intercept of the datapoints with slopes of 0.63, 0.96 and 1.15 g/cm3 (37%, 4%, −15% of error) for spheroid, ellipsoid and 3DToF methods, respectively.
Tumour volumes studied range from as small as 0.2 g (treated tumours) to 0.8 g (control tumours), which conforms to the calliper confident detection range. Our studies should therefore be representative of any pharmacological study. The spheroid method is quite accurate with small tumours (in earlier development they are mostly spherical). However, larger tumours show a bias, with errors of up to +114%. We infer from this that large tumours tend to be flatter rather than spheroidal, which is consistent with visual inspection of the tumours. On the other hand, the ellipsoid method is more accurate, with error rates mostly below +34% and within the range of possible densities. Finally, 3DToF presents a distribution either side of the 1 g/cm3 line. Although for very small tumour sizes the 3DToF surface data are too noisy and lead to a scattered distribution, the overall trend leads towards a relatively accurate slope value.
The circled point on Figure 2b represents a clear outlier. From examination of the depth images, this datapoint corresponds to a particularly noisy depth map returning invalid outputs (not-a-numbers, NaN), where the mouse was too close to the device, and lying beyond the detection confidence dictated by the camera software developer’s kit (SDK).
In general terms, calliper methods overestimate tumour volume, whereas the 3DToF approach when using the low-cost depth camera currently underestimates it slightly.
Although the ellipsoid method outperforms the current 3DToF, we believe our approach shows sufficient promise to warrant further investigation. The 3DToF technique as described suffers from noisy depth data. However, there are much more accurate low-cost 3D cameras currently entering the market (e.g. Fuel 3D, http://www.fuel-3d.com/) which will substantially improve accuracy.
Due to the high levels of noise, the animal’s flank and the tumour outline are currently estimated by manual tracing, which introduces an element of human variability. Development of a robust automated technique for this stage of the analysis would be needed for the effective practical application of the technique.
Significant further development would be needed in order to be able to obtain tumour measurements in a live mouse, particularly one that is free to roam.
Conclusion
The 3DToF method represents an initial demonstration of the concept that a non-invasive, low-cost and potentially more precise method based on off-the-shelf technology could be developed. Such a method should enhance experimental sensitivity by minimizing both experimentalist error and systematic inaccuracy (see supplementary material which can be found online with this article at http://lan.sagepub.com). The camera could be installed online or on the scale, automatically registering both weight and volume. More accurate measurements, including track of the morphology, would thereby be obtained daily. This would multiply time points, which would improve the statistical power of the tumour growth data, requiring the use of fewer animals to identify mathematical models. At the same time, visual image analysis could be used to identify external signs (such as rashes or ulceration). In summary, more sophisticated hardware combined with advanced image analysis could provide a non-disruptive, robust and accurate method for subcutaneous tumour volume measurement, which would significantly reduce the number of animals needed.
Footnotes
Acknowledgements
We give thanks to Jennifer Hare and Amar Rahi, experimentalists at AstraZeneca, for their dedicated work and to Alessandro de Moura for his advice.
Declaration of conflicting interests
The authors disclose no potential conflicts of interest.
Funding
This work has been financially supported by AstraZeneca and by the ‘Network for Integrated Cellular Homeostasis’ as a Marie Curie Action (FP7-PEOPLE-2011-ITN-289384).
References
Supplementary Material
Please find the following supplemental material available below.
For Open Access articles published under a Creative Commons License, all supplemental material carries the same license as the article it is associated with.
For non-Open Access articles published, all supplemental material carries a non-exclusive license, and permission requests for re-use of supplemental material or any part of supplemental material shall be sent directly to the copyright owner as specified in the copyright notice associated with the article.