
Abstract
The objective of this study was to evaluate the changes in electroencephalographic (EEG) power spectrum in response to decapitation of anaesthetized rats, in order to assess the nociception or otherwise of this procedure. Ten young adult male Sprague-Dawley rats were anaesthetized with halothane in oxygen and anaesthesia was maintained at a stable concentration of halothane between 1.20% and 1.25%. The rat’s head and neck were placed through the opening of a small animal guillotine so that the blade of the guillotine was positioned over the atlanto-occipial joint of the rat’s neck. The EEG was recorded in a five-electrode montage, bilaterally. After recording a 15 min baseline the rat was decapitated by swiftly pressing the guillotine blade and the EEG recording was continued until the signal was isoelectric on both channels. Changes in the median frequency (F50), 95% spectral edge frequency (F95) and total power of the EEG (Ptot) were used to investigate the effects of decapitation. During the first 15 s following decapitation, there were significant increases in the F50 and F95, and a decrease in the Ptot compared with baseline values. There was a clear window of time immediately following decapitation where changes in the EEG frequency spectrum were obvious; these changes in the EEG indices of nociception could be attributed as responses generated by the rat’s cerebral cortex following decapitation.
Several different methods of euthanasia have been proposed for use in laboratory animals in biomedical research (e.g. injectable anaesthesia, decapitation, cervical dislocation, CO2 asphyxiation, etc.). 1 Decapitation has the advantage that it has no effect on subsequent analytical procedures. 2 This is not the case with chemical methods such as a drug overdose. Despite its common use, the humaneness of decapitation of conscious animals is debatable.2–5 The question of whether brain activity continues after decapitation and, if so, for how long, has been considered essential for determining the acceptability of this procedure. These questions have been addressed in a number of studies involving different animal species including rats.2,6–10 Studies utilizing electroencephalographic (EEG) recordings have been used to map the brain following decapitation. Conversion from high voltage slow activity to low voltage fast activity (LVFA) and desynchronization, a shift in EEG activity toward high frequency, have been reported as typical EEG responses following the decapitation of conscious animals. These changes in EEG activity persist between 8 and 29 s in all species after decapitation 5 and, are followed by the onset of isoelectric EEG.
Interpretation of these post-decapitation EEG changes in terms of conscious arousal and potential pain perception, and as a response to noxious stimulation, has not been simple. Other studies have demonstrated that LVFA pattern EEG activity can be seen during rapid eye movement sleep/anaesthesia and also during anticholinergic premedication. 4 Critics have concluded that an LVFA pattern of continued EEG activity following decapitation is not necessarily indicative of conscious pain perception.3,11
Recently, a series of experiments using a minimal anaesthesia model have documented EEG changes in different species of animals in response to a variety of noxious stimuli, including slaughter of calves by ventral neck incision.12–15 These studies have demonstrated that the EEG can provide a reliable response to noxious stimuli under minimal anaesthesia. These EEG responses are thought to be the result of subconscious processing of pain stimuli by the cerebral cortex. 13 This neurophysiological method has the advantages that it minimizes the effects on the EEG of extraneous cerebrocortical electrical activity and that it is less detrimental to the welfare of experimental animals which are anaesthetized and therefore unconscious throughout the study.5,13 A number of derived variables have been used to indicate changes in the EEG in response to noxious stimuli. Median frequency (F50) and 95% spectral edge frequency (F95) are the frequencies below which 50% and 95%, respectively, of the total power of the EEG (Ptot) are located. Total EEG power is the area under the power spectrum curve. For further details of these variables see the review by Murrell and Johnson. 13
The aim of the present study was to evaluate the changes in the EEG power spectrum of rats in response to decapitation under minimal halothane anaesthesia in order to assess the possibility that this method of euthanasia is perceived as noxious by animals subjected to it.
Materials and methods
Animals
This study was approved by the Massey University Animal Ethics Committee (protocol number 09/45). Ten Sprague-Dawley young adult male rats were included in the study. Body weight of rats at the time of arrival is 245–310 g; and age was between 85 and 110 days. The animals were obtained from the Small Animal Production Unit, Massey University, NZ. Groups of two rats, housed in ventilated, polycarbonate cages with wire lids and aspen chip bedding, were moved to the research laboratory daily and used for the experiments carried out that day. Vendor health reports indicate that the rats were free of known pathogens. Commercial rat chow (rat diet 86, Feed Processing Unit, Massey University, NZ) and water were provided ad libitum. Free access to food and water were available until the time of induction of anaesthesia. The room temperature was maintained at 22℃. Light/dark ratio was 12/12 h. Plastic tunnels and large aspen blocks were provided as enrichment to all rats.
Anaesthesia
The rats were placed into a perspex custom-built induction chamber and anaesthesia was induced with 2% halothane (Halothane-Vet, Merial NZ Ltd, Manukau City, NZ) in oxygen (2 L/min). Once each rat was unconscious (assessed by visual inspection and loss of head righting reflex), orotracheal intubation was carried out with an 18-gauge cannula using a transtracheal illumination technique. 16 The tracheal cannula was connected to a T-piece breathing circuit and anaesthesia was maintained with halothane in oxygen. The rats were ventilated using an intermittent positive pressure ventilator (V valve ventilator; Vetronics, Bioanalytical Systems Inc, West LaFayette, IN, USA), and the end-tidal CO2 tension was maintained between 4.60 and 5.92 kPa (35 mmHg and 45 mmHg). The precision vaporizer (Fluothane; MedSource Ltd, Ashburton, NZ) was adjusted to maintain end-tidal halothane tension between 1.2% and 1.25%. None of the rats showed any movement responses during electrode placement at this minimal plane of anaesthesia (see review by Murrell and Johnson for details on minimal anaesthesia model 13 ). Airway gases were sampled continuously from the end of the endotracheal tube connected to the breathing circuit, using an anaesthetic gas analyzer (Hewlet Packard M1025B, Hewlet Packard, Hamburg, Germany). Rectal temperature was monitored continuously in all animals using a digital thermometer and was maintained between 37℃ and 38℃ with the aid of a circulating warm water blanket heating device.
The rat’s head and neck were placed through the opening of a small animal guillotine so that the blade of the guillotine was positioned over the atlanto-occipial joint of the rat’s neck. In addition, the head of the rat was secured in a stereotaxic frame. This frame reduced the movement of the head during decapitation and provided tension to the neck to ensure that the cut edges of the incision did not make contact with each other after the neck was cut.
EEG recording
EEG was recorded using five subcutaneous, 27-gauge stainless-steel needle electrodes (Viasys Healthcare, Surrey, UK). These were positioned to record two channels of EEG, one from the left and one from the right side of the rat’s head. Inverting electrodes were located over the zygomatic processes of the left and right frontal bones, with non-inverting electrodes positioned over the left and right mastoid processes and one ground electrode located caudal to the occipital process.
The EEG electrode cables were fed into two identical breakout boxes, one for each channel, each plugged into a physiological signal amplifier (Iso-Dam Signal Amplifiers; World Precision Instruments, Sarasota, FL, USA). The signals were amplified with a gain of 1000× and a band pass of 0.1–100 Hz, and recorded on a Powerlab 4/20 data acquisition system (Powerlab/4sp; AD Instruments Ltd, Sydney, Australia), which digitized the signal online at a rate of 1.0 kHz.
Once the rats were stabilized under anaesthesia and EEG recording was started, a 15 min baseline EEG was recorded. At the end of the 15 min the rat was decapitated using the small animal guillotine, via a neck cut at the atlanto-occipital joint. The EEG was recorded until the signal was isoelectric on both EEG channels.
Analysis of EEG data
Data were stored on Apple personal computers and were analysed after the recordings were completed. Recordings were inspected visually and classified into one of three categories; active EEG (normal cerebrocortical activity in anaesthetized rats), transitional EEG (trace with an amplitude of less than half of that of pre-decapitation EEG) and isoelectric (trace with an amplitude of <1/8 of that of active EEG with little to no low-frequency component).14,17 F50, F95 and Ptot were calculated for consecutive non-overlapping one-second epochs, using purpose-written software (Spectral Analyser; Craig Johnson, Massey University, Palmerston North, NZ, 2002).
Data were multiplied using a Welch window and fast Fourier transformation applied to each epoch, generating sequential power spectra with one-hertz frequency bins. Data from the first 30 s of baseline were compared with data from 5 s intervals after decapitation. A single mean value for each EEG variable (F50, F95 and Ptot) was calculated for each of these time periods in each rat. Any out-of-range data resulting from movement artefact during decapitation were excluded from analysis.
Statistical analysis
Statistical analysis of data was carried out using Prism 4c (Graph Pad Software Inc, San Diego, CA, USA). The distribution of the EEG data was tested for normality (Shapiro-Wilk, Kolmogorov-Smirnov, Anderson-Darling and Cramér-von Mises tests) and residuals of data were found to be normally distributed. Data from each channel of EEG recording were analysed separately. A repeated measures analysis of variance was carried out to compare 5 s blocks of EEG recorded post-decapitation with that recorded during baseline for F50, F95 and Ptot. Statistical significance was assumed when P < 0.05. Dunnett’s post-tests for multiple comparisons were carried out when P < 0.05, comparing EEG recorded during the baseline and after decapitation periods to find the differences. EEG data were displayed as percentage changes from pre-treatment values. Results were expressed as mean ± SE.
Results
EEG traces from three rats were excluded from analysis due to unacceptable levels of contamination. Active EEG was present from 8 s to 11 s (mean ± SE; 9.7 ± 0.4 s) prior to the onset of transitional EEG. Isoelectric EEG occurred at a mean duration of 15 s (range 14 s to 17 s) following decapitation (Figure 1).
Example of raw electroencephalogram (EEG) of anaesthetized rat demonstrating the change in EEG signals following decapitation. *Note the large movement artefact during decapitation.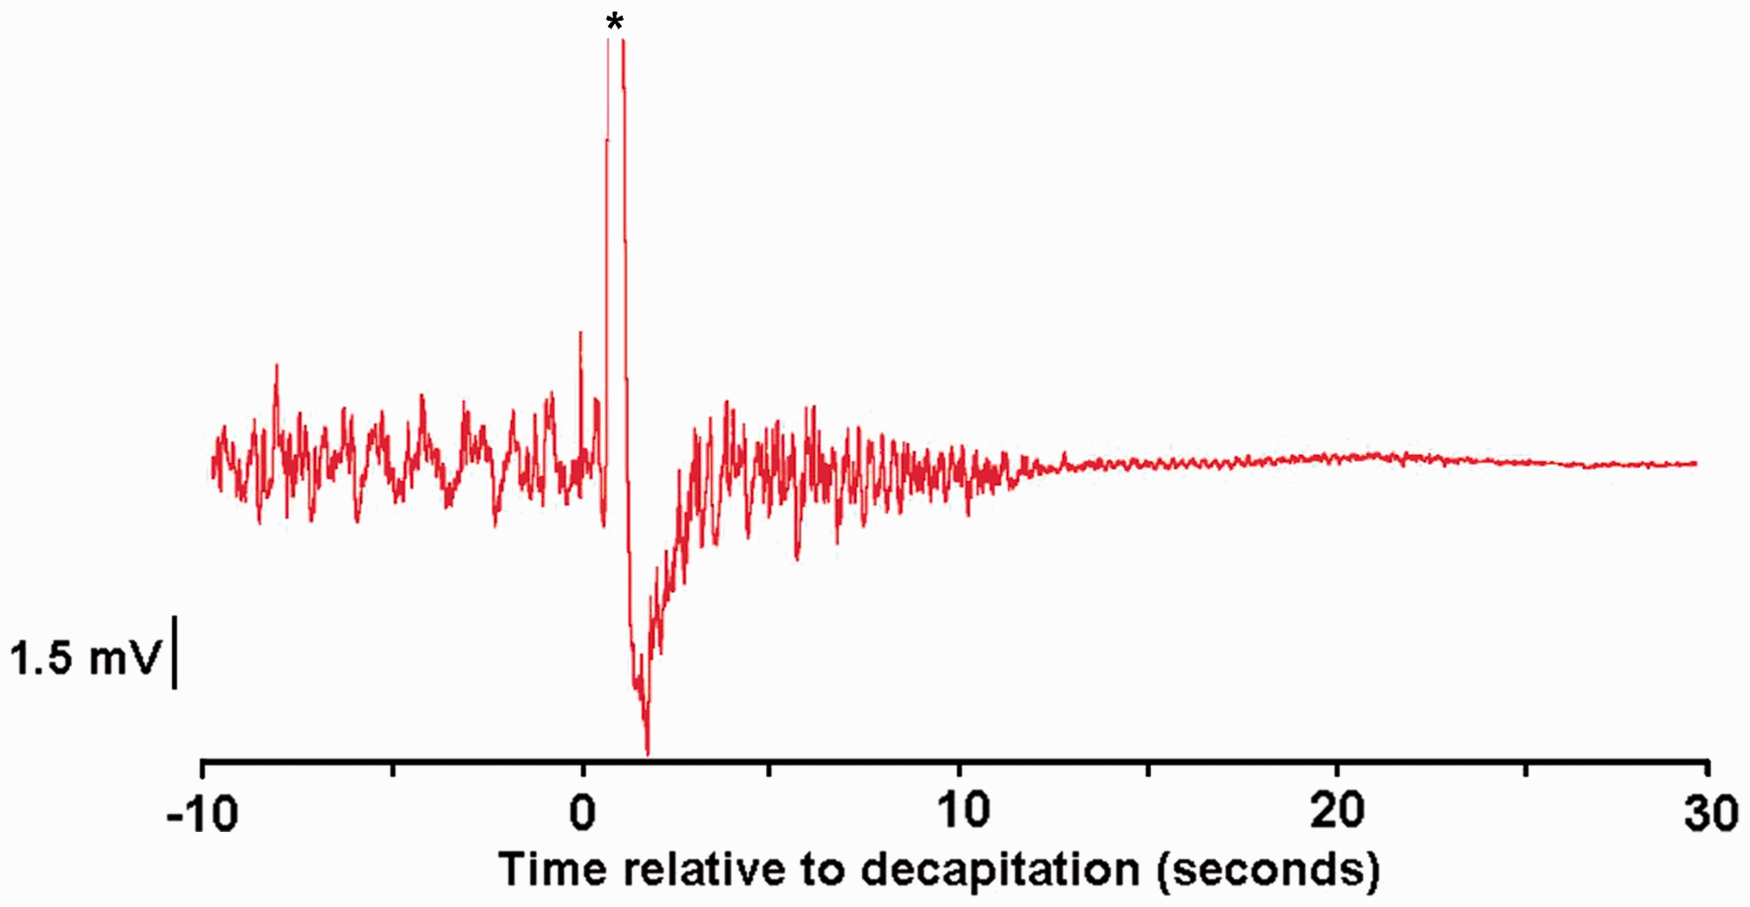
Mean F50 increased by 39.2 ± 16% (P = 0.007) 5 s following decapitation. By 10 s after decapitation, this increase had reduced to 31.4 ± 14% and was no longer statistically significant (P = 0.058). At 15 s after decapitation there was again a significant increase of 51.7 ± 13.3% (P = 0.004) (Figure 2).
Mean ± SE median frequency of electroencephalogram (EEG) (Hz) expressed as percent of baseline values, of seven rats at 5, 10 and 15 s following decapitation. *Value differs significantly (P < 0.05) from the baseline value.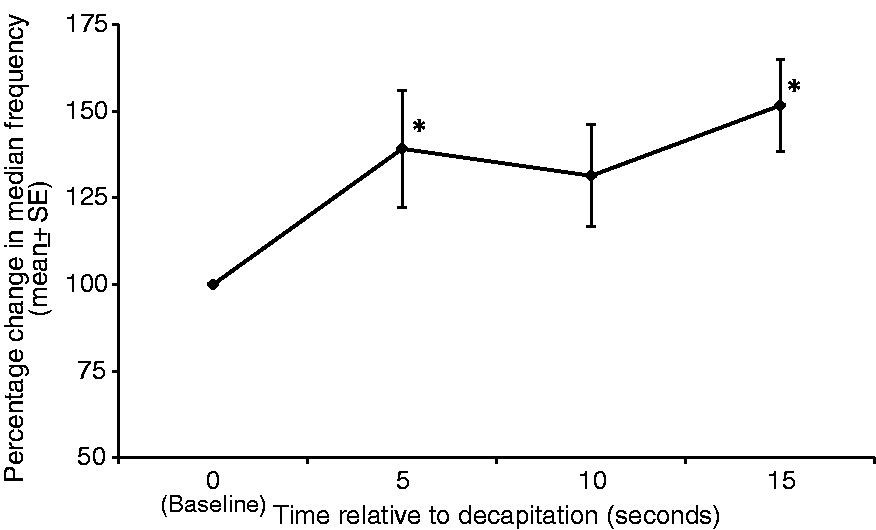
Mean F95 increased significantly compared with baseline, with increases of 3.2 ± 1.2% (P = 0.0002), 5.6 ± 1.2% (P = 0.0105) and 7.3 ± 1.6 % (P = 0.01) at 5, 10 and 15 s, respectively (Figure 3).
Mean ± SE 95% spectral edge frequency of electroencephalogram (EEG) (Hz) expressed as percent of baseline values, of seven rats at 5, 10 and 15 s following decapitation. *Value differs significantly (P < 0.05) from the baseline value.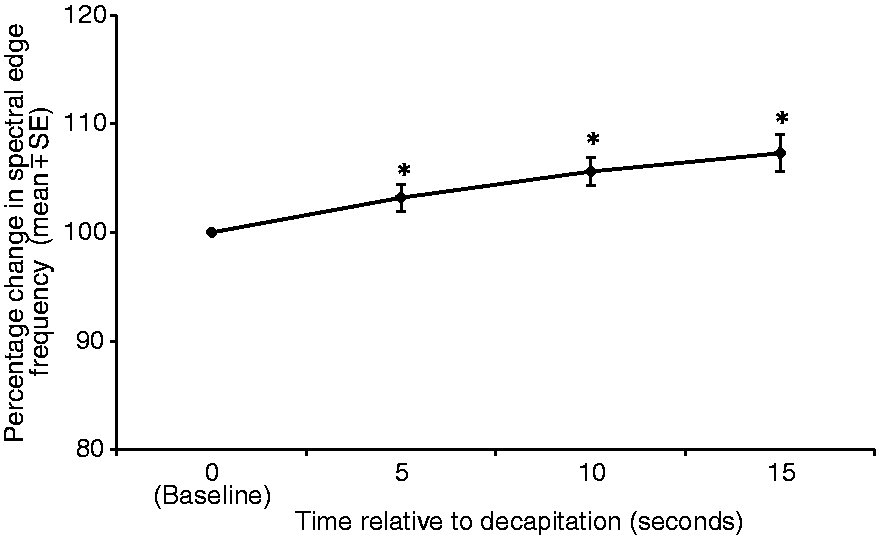
Mean Ptot decreased significantly compared with baseline, with decreases of 27.4 ± 13% (P = 0.001), 75.9 ± 5.7% (P = 0.0002) and 90.5 ± 2.1% (P = 0.00005) at 5, 10 and 15 s, respectively (Figure 4). No significant difference was found in EEG variables (mean F50, F95 and Ptot) recorded in two channels from the left and right sides of the head.
Mean ± SE total electroencephalographic (EEG) power (µv2) expressed as percent of baseline values, of seven rats at 5, 10 and 15 s following decapitation. *Value differs significantly (P < 0.05) from the baseline value.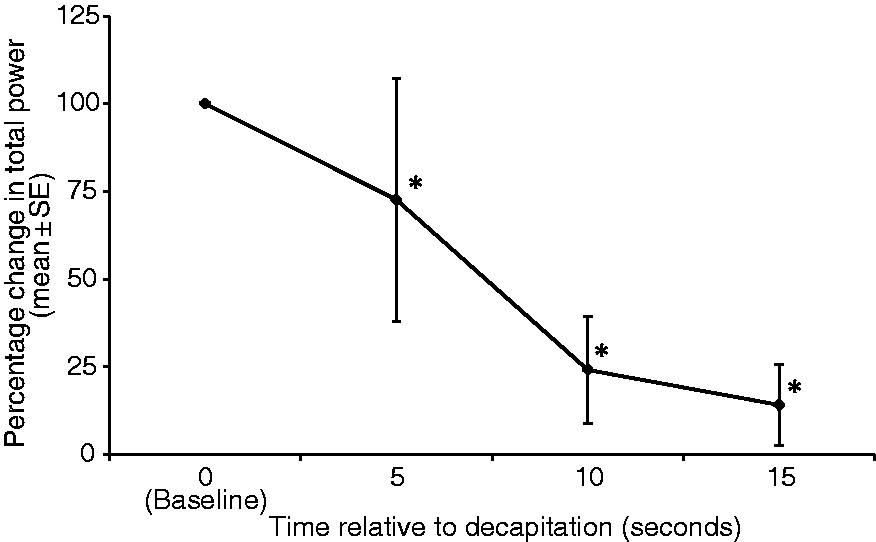
Discussion
The aim of this study was to assess changes in the EEG power spectrum in anaesthetized rats following decapitation. Significant increases in F50 and F95 and a decrease in Ptot of the EEG were found under minimal anaesthesia. Similar changes in the EEG power spectrum in response to noxious stimulation have been demonstrated previously in a number of animal studies using the minimal halothane anaesthesia model.14,15,18–20
F50 and F95 of the EEG power spectrum increased significantly following decapitation of rats in the current study, but both these indices are independent of the total power of the EEG trace and so should be interpreted with caution in situations where Ptot is markedly reduced. In the present study, EEG remained active for a mean duration of 9.7 s, followed by a period of transitional EEG that proceeded to an isoelectric pattern by 15 s after decapitation. Changes in F50 and F95, beyond the development of transitional EEG, are less likely to represent the cortical function accurately as they will be influenced to a greater extent by extraneous electrical noise. For this reason, increases in F50 and F95 occurring later than 10 s after decapitation were not interpreted as reliable indicators of an EEG response to noxious stimulation. Significant increases in F50 and F95 were found during the first 10 s after decapitation. These are consistent with responses to noxious stimulation found in other studies15,19,21,22 and can be interpreted as such.
A significant and a gradual decrease in the Ptot was observed in the current study and was similar to the reductions in the power component of specific EEG frequency bands (1–100 Hz and 13–100 Hz) after decapitation of both conscious and anaesthetized rats reported in a recent study. 8 In that study, the relationship between EEG power and level of consciousness fitted an exponential decay function, and the authors opined that this change in EEG power over time could be due to a gradual reduction in consciousness reflecting a loss of cerebral function following decapitation. In the present study the onset of isoelectric EEG at a mean duration of 15 s accompanied by the steep fall in Ptot were indicative of a cessation of cerebral activity.
EEG responses of calves to slaughter by ventral neck incision without prior stunning 14 have demonstrated a time frame of nearly 34 s post-cut prior to the onset of insensibility. During this interval the response to the neck cut demonstrated that this could be perceived as painful by a conscious animal. The results of the present study appear to be similar, with an interval of nearly 10 s after decapitation where the EEG was active. Increases in F50 and F95 occurred during this period as responses generated by the cerebral cortex. Decapitation of both anaesthetized and awake rats has been demonstrated to cause comparable EEG changes. These responses are indicative that unanaesthetized rats would be likely to perceive decapitation as painful prior to the onset of insensibility.
The spinal cord has an important function in the mechanism of general anaesthesia. 23 Separation of the spinal cord from the brain may alter the level of anaesthesia in the minimal (stable plane) anaesthesia model used in the present study, which in turn may contribute to the EEG changes seen during decapitation. However, further studies should be conducted to determine the mechanism by which changes in the EEG power spectrum are generated in response to decapitation in rats.
This is the first study in rats that has examined quantitative changes in EEG frequency spectrum in response to decapitation. Objective changes in the EEG frequency spectrum in response to noxious stimulation have been shown to correlate well with behavioural responses to pain in awake subjects.12,24 In the present study, decapitation of rats generated responses in EEG indices that have been linked to nociception across a number of different species of animals, including rats.
Footnotes
Funding
This research received no specific grant from any funding agency in the public, commercial, or not-for-profit sectors.