
Abstract
Only limited evidence exists on how to best make the effective yet broad concept of formative assessment (FA) accessible to teachers. Thus, this study investigated the effects of two differently structured FA approaches (curriculum-embedded assessment [CE] vs. planned-for-interaction assessment [PI]) on implementation outcomes over time. A total of N = 118 mathematics teachers participated in a six-session professional development program offered over one school year and implemented one of the two approaches in their classrooms. Implementation success was assessed via teachers’ self-reports. Hierarchical linear models for repeated measurement revealed higher ratings for CE for the initial phase of implementation. Over time, differences between the approaches decreased for feasibility and cooperation, but remained quite constant in terms of acceptability, fidelity and perceived learning outcome. The approaches did not significantly differ regarding sustainability. Thus, for implementing FA, it seems worthwhile to provide teachers with clear guidelines and an explicit structure.
Keywords
Introduction
Educational research has repeatedly proven that several theoretical concepts have the potential to improve teaching and learning (Hattie, 2023; Slavin et al., 2021). One of the most prominent theoretical frameworks for evidence-based innovations is formative assessment (FA), which aims to provide assessment-based, individualized teaching (Lee et al., 2020). Even though the general structure of FA—which involves cycles of assessment, feedback and tailored instruction—seems simple, reviews on FA have concluded that although positive effects are well documented, implementation in the classroom is challenging, and teachers need support in translating the broad concept of FA into instructional action (Klute et al., 2017; Lane et al., 2019; Lee et al., 2020). However, little is known about the most effective ways to make this broad concept accessible to teachers. In particular, to our knowledge, no direct comparison of different FA approaches has been conducted yet that would provide valid insights into how they can best be designed for meaningful and sustainable implementation.
Within the different conceptualizations of FA (Bennett, 2011; Shavelson, 2006; van der Kleij et al., 2015), a key aspect that differs between FA approaches is the degree of formalization and structure of the FA cycle. For example, Shavelson (2006) differentiates between the clearly structured approach of curriculum-embedded assessment (CE) and the more flexible concept of planned-for-interaction assessment (PI). As such, introducing these differently structured FA approaches to teachers might offer specific advantages: Whereas highly structured approaches with clear guidelines for classroom activities could help teachers implement FA initially (Andersson & Palm, 2018; Lane et al., 2019), approaches that are easier to adapt and more flexible to use may be better suited for long-term implementation of FA (Goertzen et al., 2023; Yin et al., 2008).
Thus, this study compared, from the teachers’ perspective, the short- and long-term implementation success of two differently structured FA approaches. To this end, over the course of one school year, N = 118 first- and second-grade teachers took part in a professional development (PD) program aimed at preparing them to implement FA. In a quasi-experimental design, the two conditions only differed with respect to the FA approaches’ degree of structure and formalization and, accordingly, the material provided.
Different Approaches to FA
FA is an effective framework for promoting school learning (Klute et al., 2017; Lane et al., 2019; Lee et al., 2020). The main idea of FA is to use assessment information about a student’s learning level and progress to subsequently inform future decisions in the learning process in terms of individualized feedback and adaptive teaching (Wiliam & Thompson, 2008). Meta-analyses (Klute et al., 2017; Lane et al., 2019; Lee et al., 2020) suggest that the effectiveness of FA strongly depends on how teachers implement it in their day-to-day teaching.
To evaluate how teachers can best be supported in implementing FA successfully and sustainably in their classes, we find it reasonable to differentiate FA approaches according to their degree of formalization and structure. As such, we drew on the classification proposed by Shavelson (2006), who described three anchor points of structuring along a continuum from highly structured to spontaneous. The most structured anchor point with the highest level of prior planning is CE, where assessments are used to elicit “goal-directed teachable moments” (Shavelson et al., 2008, p. 301). While different forms of implementation exist, the main idea is to integrate assessments into the curriculum at prespecified junctures of knowledge acquisition (Heritage, 2007; Shavelson, 2006). The second anchor point, namely PI, is slightly more flexible, as it primarily takes place during the regular course of instruction. Here, teachers deliberately plan which questions to ask during classroom discussions that will best contribute to obtaining valuable information about a student’s learning level (Heritage, 2007; Shavelson, 2006). The third point is described as spontaneous on-the-fly assessment; this, however, is difficult to evaluate due to its unsystematic application.
Measuring Implementation Success From the Teacher’s Perspective
To evaluate the implementation of the differently structured approaches, we oriented toward Proctor et al.’s (2011) conceptual model of implementation research that was adapted for educational contexts by Baffsky et al. (2022). This model suggests that crucial implementation variables include cooperation, feasibility, acceptability, fidelity, sustainability, and perceived learning outcome, which is supported by empirical evidence. For instance, studies have shown that collaboration and cooperation among colleagues constitute a key strategy for successful and sustainable implementation processes (Andersson & Palm, 2018; Hebbecker & Souvignier, 2018; Prenger et al., 2022). Similarly, the acceptability of an innovation is closely linked to teachers’ intentions to implement it (Renko et al., 2020), the frequency and quality of implementation (Hondrich et al., 2016) and actual innovation use (Lakin & Shannon, 2015). Furthermore, higher perceptions of feasibility are associated with increased innovation use (Andersson & Palm, 2018; Hebbecker et al., 2022; State et al., 2017). Fidelity of implementation, however, is related to better student outcomes (Crawford et al., 2012; Pas et al., 2019) and discussed as an explanation for varying or absent effects on student outcomes in the context of FA (Boström & Palm, 2023; Yin et al., 2008).
Implementing FA Into School Practice Needs Support for Teachers
Successfully and sustainably implementing FA into the classroom means that teachers must acquire the theoretical concept, put it into practice, and then reflect on their experiences (Figure 1). In this context, theoretical models of teacher professional growth emphasize that, fundamentally, teachers need to have positive experiences when applying new concepts (Clarke & Hollingsworth, 2002). Furthermore, the long-term goal of implementing a new concept is for teachers to gradually internalize it—adopting and applying it competently and flexibly, while considering the specific teaching context (e.g., Duffy, 1993).
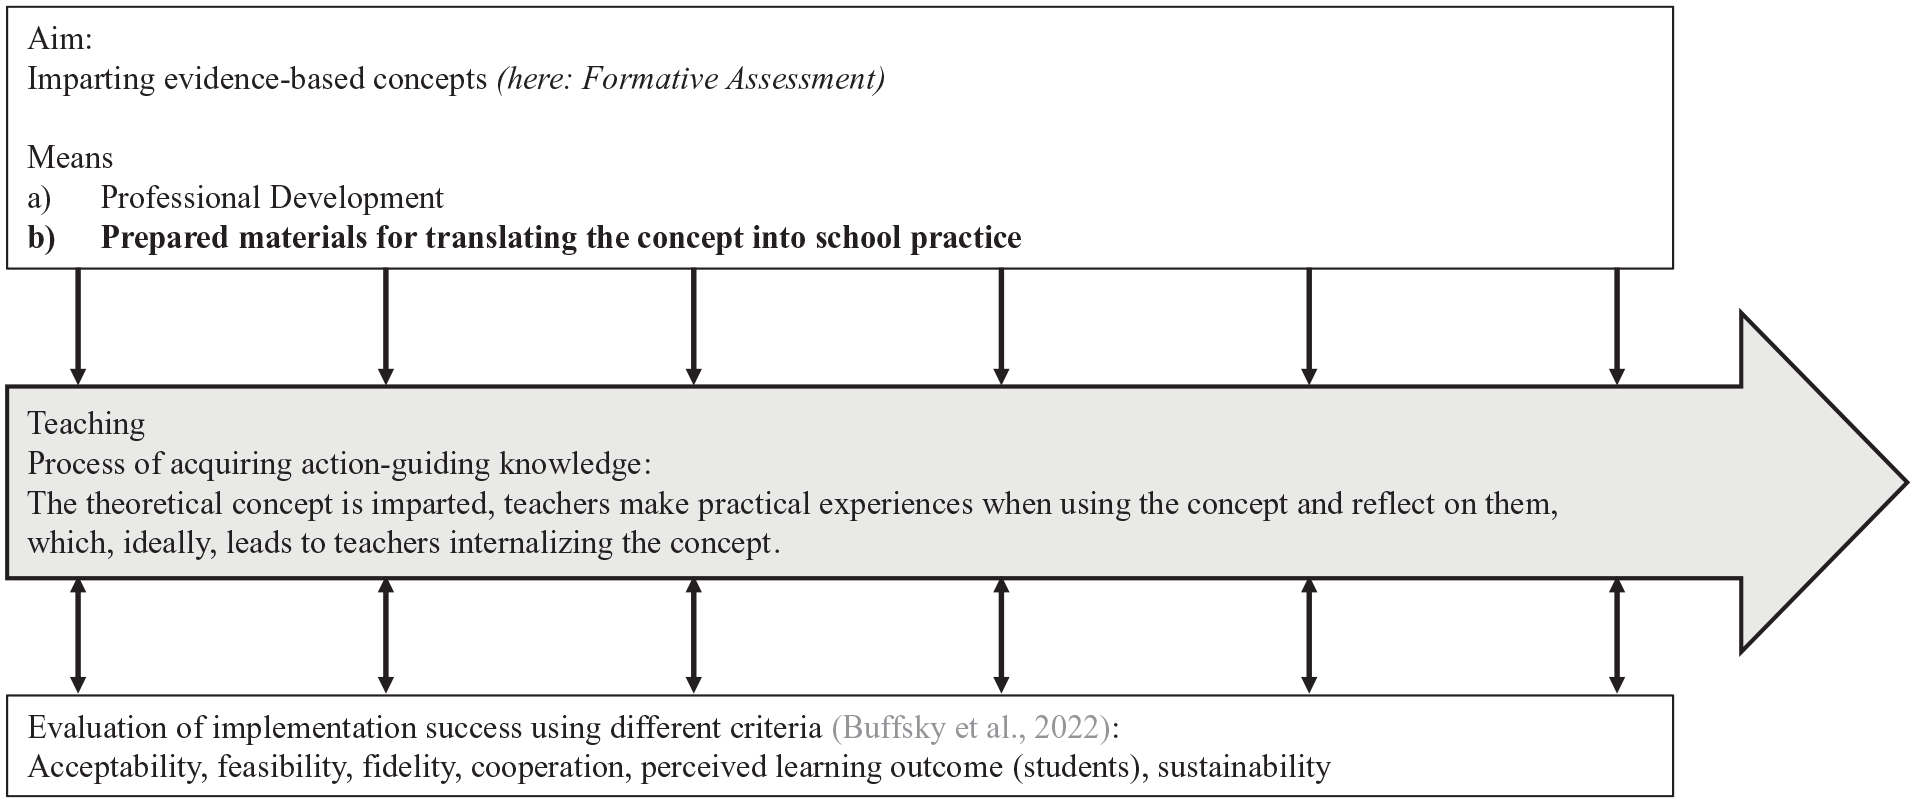
Illustration of the Implementation Process
Research suggests that for successfully implementing FA, teachers should be provided with support, such as accompanying PD and prepared materials (Andersson & Palm, 2018; Heitink et al., 2016; Lane et al., 2019; Lee et al., 2020; Yin et al., 2008). To ensure teachers feel confident and able to put FA into practice, PD activities should be designed such they can be immediately applied in the classroom while they explain the underlying theoretical mechanisms of FA (Andersson & Palm, 2018). Giving teachers scaffolding in the form of concrete classroom practices, such as ready-to-use material, can encourage teachers to adopt new behaviors (Heitink et al., 2016; Lane et al., 2019; Yin et al., 2008).
However, it lacks evidence of how formalized FA cycles should be to best make the concept accessible to teachers. While highly structured approaches that tightly specify processes and procedures in class could facilitate implementation by making teachers feel competent to carry out FA (Andersson & Palm, 2018; Lane et al., 2019), less structured approaches may allow teachers to adapt the concepts to their own routines and reflect on the core principles of FA, eventually leading to a more intense internalization of the concept (Goertzen et al., 2023; Yin et al., 2008). When studying the implementation success of these approaches, teachers’ perceptions are likely to be influenced by the state of implementation (whether FA is new or familiar to them) and the extent to which they have internalized the concept, making a process perspective particularly relevant.
Expected Short-Term Effects
Focusing on initial implementation processes, an intervention’s higher degree of structure should have a facilitating effect. For instance, innovations that are less complex, easy to handle, and offer a high degree of clarity are more likely to be implemented (Schrader et al., 2020). Furthermore, the less time an intervention requires, the more acceptable and feasible (State et al., 2017) teachers perceive it to be. Focusing on FA elements, it has been shown that, compared with less structured support and feedback materials, a rather structured, online-based diagnostic tool led to comparable levels of acceptability ratings (Ehlert et al., 2022; Hebbecker et al., 2022) but higher feasibility ratings (Hebbecker et al., 2022) as well as greater innovation use (Hebbecker & Souvignier, 2018). Providing ready-to-use materials that can be immediately implemented in the classroom can also help improve implementation fidelity (Hondrich et al., 2016). Likewise, teachers were found to highly value concrete FA teaching activities that made them feel confident. Consequently, activities that were perceived as viable and less costly were more frequently implemented (Andersson & Palm, 2018). Thus, highly structured concepts comprising specific guidelines for realizing FA in the classroom may help teachers act confident in the classroom and feel secure in adopting FA (Andersson & Palm, 2018; Lane et al., 2019).
Expected Long-Term Effects
The ultimate goal of such an implementation effort is to have teachers use an innovation over the long term (Petermann, 2014; Proctor et al., 2011). Sustainable change appears to be challenging, especially in the context of FA (Lane et al., 2019; Lee et al., 2020). From this view, an FA that is more flexible, such as the PI approach, might pay off. An innovation’s adaptability and flexibility are considered key facilitating factors for successful implementation (Schrader et al., 2020). In the context of innovations and school development, the high degree of autonomy and, with greater practice, possibly also an increased experience of competence, appear to be particularly significant (Nguyen et al., 2021; Schellenbach-Zell & Gräsel, 2010). Furthermore, an effective long-term use of FA may benefit from teachers reflecting on the fit between the proposed concept and their own routines, adapting practices flexibly to the respective circumstances at school and ultimately internalizing FA (Bennett, 2011; Goertzen et al., 2023; Yin et al., 2008). Thus, teachers may continue to use FA practices that are presented as more flexible.
The Present Study
Our goal was to examine the effects of two differently structured FA approaches on different outcome variables over the implementation period of one school year. More specifically, we compared the effects of the more structured curriculum-embedded (CE) assessment approach and the less structured planned-for-interaction (PI) assessment approach at the teacher level.
Teachers in both groups implemented one of the two FA approaches in their mathematics classrooms. Both approaches were based on “learning progressions” (Duncan & Rivet, 2018; Furtak, 2012) for primary school mathematics education. These learning progressions represent typical pathways that students usually undergo when acquiring basic mathematical content, and they represent the groundwork upon which students’ competencies were systematically assessed. To effectively prepare teachers for translating the FA cycle into concrete action, they participated in a PD program on assessment-based, individualized mathematics instruction covering six sessions throughout the school year. While this PD program was parallel in both groups, the approaches differed regarding the formalization of the FA cycle. Specifically, in the CE group, the classroom implementation was tightly guided (using prepared, written task sets for assessment that were identical for all students), whereas in the PI group, teachers were given more flexibility in realizing the concept in their mathematics classrooms (holding planned, focused conversations for assessment with students they selected).
Teachers rated the implementation success at six measurement points (for the variables acceptability, feasibility) and five measurement points (for the variables fidelity, cooperation, perceived learning outcome) throughout the school year, and at the end of the year, they also rated the sustainability of the implementation (Figure 2).
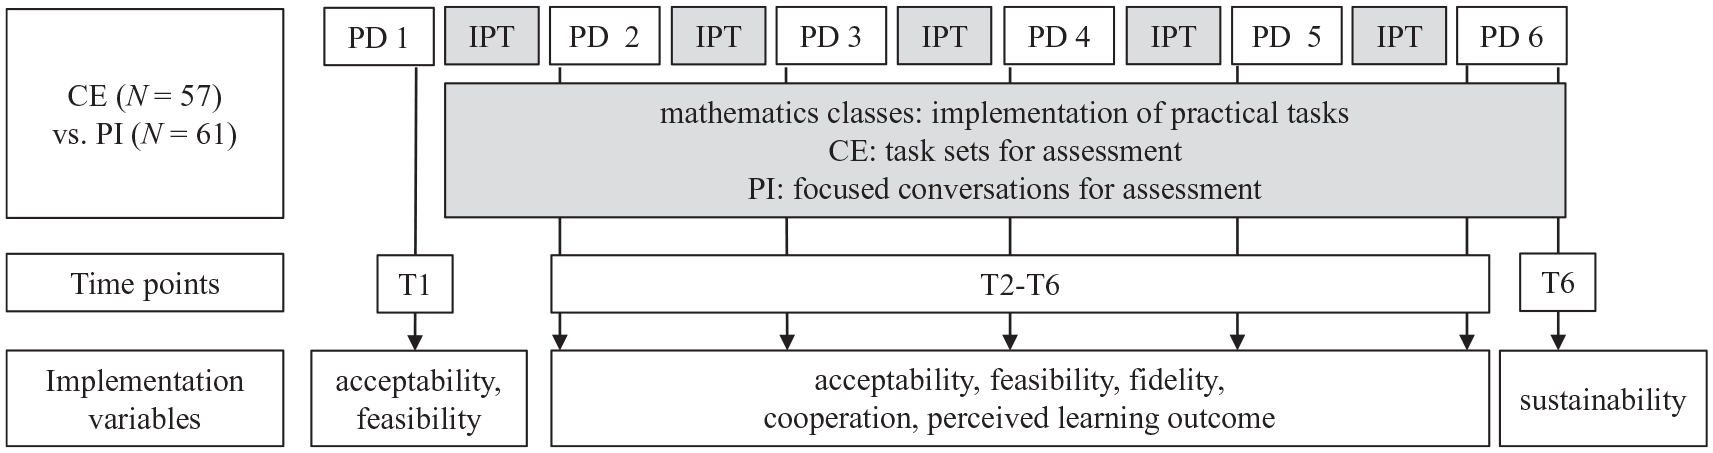
Study Design and Measurement Time Points
Research Question and Hypotheses
This study examines how two differently structured FA approaches (CE vs. PI) affect different implementation outcomes over the implementation process of one school year. The following hypotheses were posed:
Method
Sample
Initially, 125 first- and second-grade teachers from public schools in both urban and rural areas in mid-western Germany participated in the study. Only data from teachers who attended at least two PD sessions were analyzed. Therefore, the final sample consisted of N = 118 teachers from 37 schools. Teachers were on average M = 40.95 years old (SDAge = 10.06, MinAge = 25, MaxAge = 62), had an average teaching experience of M = 13.14 years (SDteaching experience= 9.34, Minteaching experience = 0, Maxteaching experience = 36), and were predominantly female (95.6%). Of the sample, 97.5% had studied elementary education with 87.3% having studied mathematics as a subject; 2.5% (N = 3) were social educationalists. In total, 39.0% of the participants taught in the first grade, 48.3% in the second grade, 5.1% in inter-year grades, and 7.6% could not be assigned to a specific grade. An overview of the sociodemographic data, separated by groups, as well as a comprehensive classification of our research methodology according to Saunders et al. (2009) can be found in the Supplemental Material in the Open Science Framework (https://osf.io/5fd7h/).
Design
The study design was a quasi-experimental intervention study with repeated measurements (Figure 2). The recruitment of participants was carried out in close cooperation with two district governments. These governments informed the school administrations in their respective districts about the project and informed us which schools would be participating. Guidelines regarding the number of participating teachers were established in advance, ensuring an equal number of teachers participated across both district governments. The selection of teachers was the responsibility of the school administrations, with the restriction that the teachers had to be teaching a first- or second-grade class during the implementation period or worked as social educationalists. Subsequently, teachers were randomly assigned at the school level to one of the two conditions (CE vs. PI). To increase practicability and avoid teachers exchanging ideas and materials of the different approaches, all teachers at one school were in the same condition (CE: 57 teachers from 18 schools, PI: 61 teachers from 19 schools, average number of teachers per school: 2.97). Teachers of both conditions participated in a six-session PD program lasting throughout the school year. Between the PD sessions, they implemented the respective FA approach in their classes (see Treatment section for details).
First, at T1, teachers anticipated the acceptability and feasibility of the FA. Then, at the beginning of each PD session, they evaluated the implementation of their FA in the recent practice phase (T2–T6). In that way, we continuously measured implementation success at five or six measurement points (five measurement points for fidelity, cooperation, perceived learning outcome; six points for acceptability and feasibility). At the last measurement point, teachers indicated how sustainable they thought it would be to continue implementing the FA in their classes.
Treatment
Teachers were supported in implementing FA in their classes via the PD program and prepared material. Between the PD sessions, they implemented the respective FA approach (CE: using written task sets for assessment, PI: conducting focused conversations for assessment). While the PD sessions were mostly parallel, the FA approaches differed in their structure and materials provided. Whereas the CE approach was highly structured and directive in how to realize FA in the classroom, the PI approach provided teachers more flexibility regarding the design of the classroom activities. A summary of the FA approaches’ similarities and differences is provided in the appendix.
PD Program
Throughout the school year, teachers of both groups participated in a PD program (six sessions, total contact time: 24 hr). While Sessions 1, 2, and 6 were held face-to-face; Sessions 3, 4, and 5 were realized in a digital format due to the COVID-19 pandemic. For organizational and geographical reasons, two identical PD trainings were held for each condition. Trainings were given by tandems of trained mathematics educationalists. The PD sessions focused on two main aspects: the mathematical content, covering arithmetic topics for the first and second school grade (understanding numbers, understanding operations, process-related competencies), and the content essential to implementing FA (e.g., providing assessment-based differentiated instruction, adapting tasks, providing feedback). In both groups, activities alternated between case-based inputs, practice phases, and reflection phases.
Teachers were also introduced to the assessment concept they were to implement in their classes. In both groups, teachers prepared for implementing the assessment methods in their classrooms and reflected on the suitability and possible adjustments they could make in the next session. For this, teachers in CE were trained in selecting, adapting and using different assessment tasks and interpreting written documents to systematically assess all students’ learning levels, whereas teachers in PI learned how to flexibly conduct focused conversations for assessment, including reflecting on a specific tasks’ diagnostic value, anticipating student responses and developing further prompts.
Material
To support teachers in implementing FA, they were given material to assess their students’ competencies and tailor their instruction to students’ needs. Teachers in CE received prepared written task sets for assessment. These task sets consisted of tasks covering different competence domains (e.g., recognizing numbers on the number line) within one key topic (e.g., understanding numbers). Different task sets existed for first grade (number range of up to 20) and second grade (number range of up to 100). Task sets were compiled and adjusted by the teacher and then equally delivered to all students at the same time. The teacher then evaluated the results using a prepared evaluation table and competency grid.
In contrast, teachers in PI were given a set of cards for assessment to support them in conducting focused conversations for assessment. Each card comprised a list of content-related competencies the students should have, a task of high diagnostic value to start the conversation and suggestions for valuable observations and specific prompts the teacher could give. Sets of cards were available for the same key topics and competence domains as in CE. Teachers planned the conversations in advance. In class, all students could work on the same basic task while the teachers entered into deeper conversations with individual students or a group of students they selected.
Teachers in both groups used the assessment results for adaptive instruction. To provide instruction that was closely aligned with each student’s achievement level, teachers were provided with support suggestions (the same for both groups) that closely matched the assessed competence domains. Teachers could decide on the support setting: Most teachers integrated the suggestions into their regular math classes; that is, based on the assessed competencies, they selected support activities that were applicable for small groups or the whole class. If organizational conditions allowed, teachers also used the support suggestions in remedial teaching, especially with low-achieving students.
Measures
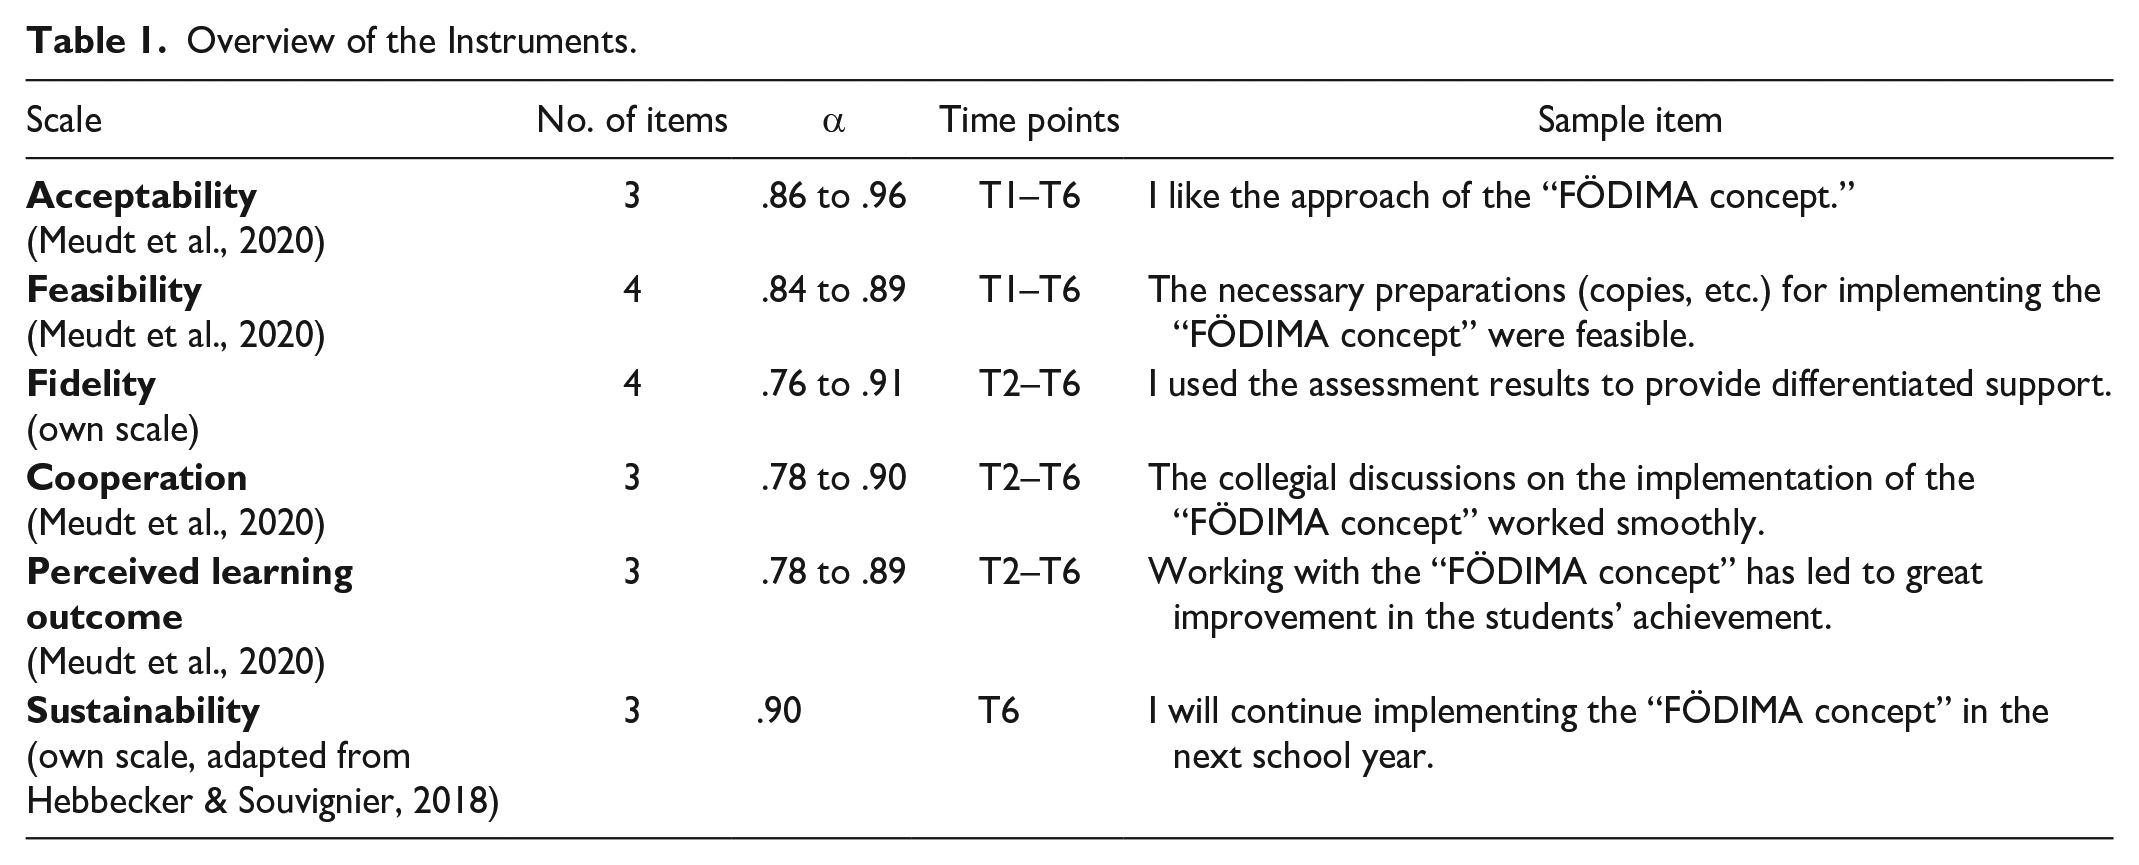
To examine the effects of the different FA approaches at the teacher level over the course of the school year, we used self-reports in which teachers evaluated their FA implementation in the recent practice phase (T2–T6). Acceptability and feasibility were additionally rated at T1 in an anticipatory fashion, such that teachers had been introduced to the FA concept and the material but had not yet tried out the concept in class. Sustainability was rated at T6. All items were rated on a 6-point Likert-type scale ranging from 1 = “does not apply at all” to 6 = “applies exactly.” Apart from small linguistic adjustments at T1, items were identical at all measurement points. Items were adapted for mathematics instructions and often referred to the concept of providing assessment-based, differentiated mathematics instruction using the provided material. In both groups, this was referred to as the “FÖDIMA concept,” regardless of the FA approach the teachers were implementing. By using this broad term as well as encouraging teachers to refer to the recent practice phase, we assume that the items reflect both teachers’ comprehensive evaluation of the concept and their specific reaction to the particular content and material. Because teachers completed the surveys during the PD sessions, we decided to use short scales. An overview of the instruments is displayed in Table 1.
Overview of the Instruments.
Data Analysis
For Hypotheses 1 and 2, a hierarchical linear model for repeated measures (with measurement time points nested in persons) was estimated for each outcome variable using the lme4 package (Bates et al., 2015) in R. The treatment variable was dummy coded with the CE group, which represented the reference category (0 = CE, 1 = PI). We specified contrast effects in which the mean values at each measurement point were compared with the baseline. Therefore, measurement time points were also dummy coded using the first measurement point as reference category. Group differences were tested including the group variable (T1/T2) and the cross-level interactions between treatment variable and measurement time points (T2-T6/T3-T6) in the model. Random intercepts were specified. The model in variable notation (exemplary for acceptability) accordingly was as follows:
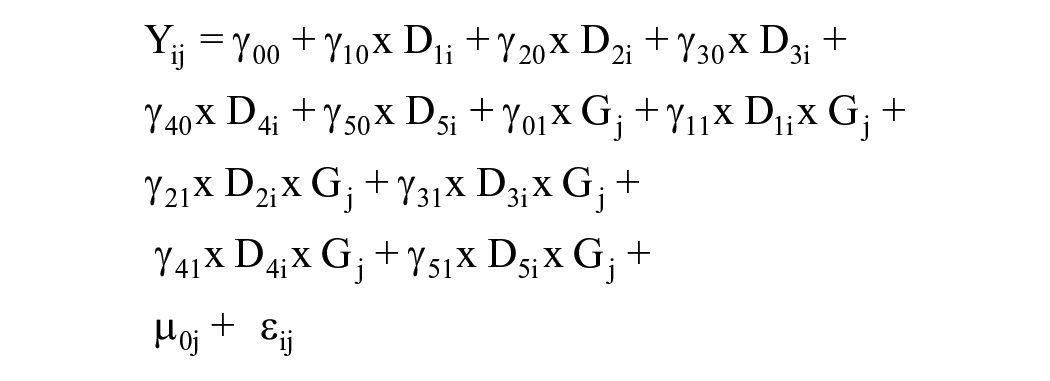
Regression weights at baseline (γ00) refer to the CE teachers’ responses at the first measurement point. The regression weights T2 to T6 (γ10 – γ50) or T3 to T6 (γ10 – γ40), respectively, refer to the difference in the respective implementation variables compared with the baseline in CE for the specific measurement points. “Group” variables (γ01) refer to the difference between CE and PI at baseline. All interaction variables (γ11 – γ51) refer to the difference in change between CE and PI at a specific measurement point. Thus, regression weights for change in PI can be obtained by adding the weights of CE (γ10 – γ50) and the weights of PI for the matching interaction variables (γ11 – γ51).
For sustainability (H3), a Wilcoxon rank-sum test was conducted, as the data were non-normally distributed (as indicated by a significant p value <.001 in the Shapiro–Wilk normality test).
A substantial amount of missing data emerged for all outcome variables at all measurement points (acceptability: T1: 11.9%, T2: 28.8%, T3: 39.8%, T4: 39.8%, T5: 49.2%, T6: 31.4%; feasibility: T1: 11.9%, T2: 28.0%, T3: 40.7%, T4: 40.7%, T5: 49.2%, T6: 31.4%; fidelity: T2: 29.7%, T3: 42.4%, T4: 39.8%, T5: 50.0%, T6: 32.2%; cooperation: T2: 31.4%, T3: 40.7%, T4: 39.8%, T5: 50.0%, T6: 32.2%; perceived learning outcome: T2: 39.8%, T3: 43.2%, T4: 42.4%, T5: 50.8%, T6: 33.1%, sustainability: T6: 33.1%). As missing data could have arisen due to random factors, such as teachers being ill or participating in other school events, we decided to use latent factor scores for scale building employing the full information maximum likelihood (FIML) procedure. Latent factor scores were grand-mean z-standardized. Due to estimation difficulties, factor scores were built based on mean values (implying all items contribute equally to the respective factor score) and restricting all intercepts to zero. 1 Factor determinacy indices (FDIs) were adequate for research purposes (Gorsuch, 1983). However, to test the results’ robustness given the considerable estimation difficulties, we conducted the analyses with different samples; that is, we analyzed data from teachers that attended at least three or four PD sessions. Apart from slight differences in p-values and small deviations regarding perceived learning outcome, results were stable. We provide the results for the additional analyses in the Supplemental Material.
We report Hedges’s g
Results
Mean values and standard deviations per group for all outcome variables are displayed in Table 2. An illustration of the ratings for each implementation variable over time for CE versus PI is provided in Figure 3.
Means and Standard Deviations for All Implementation Variables.
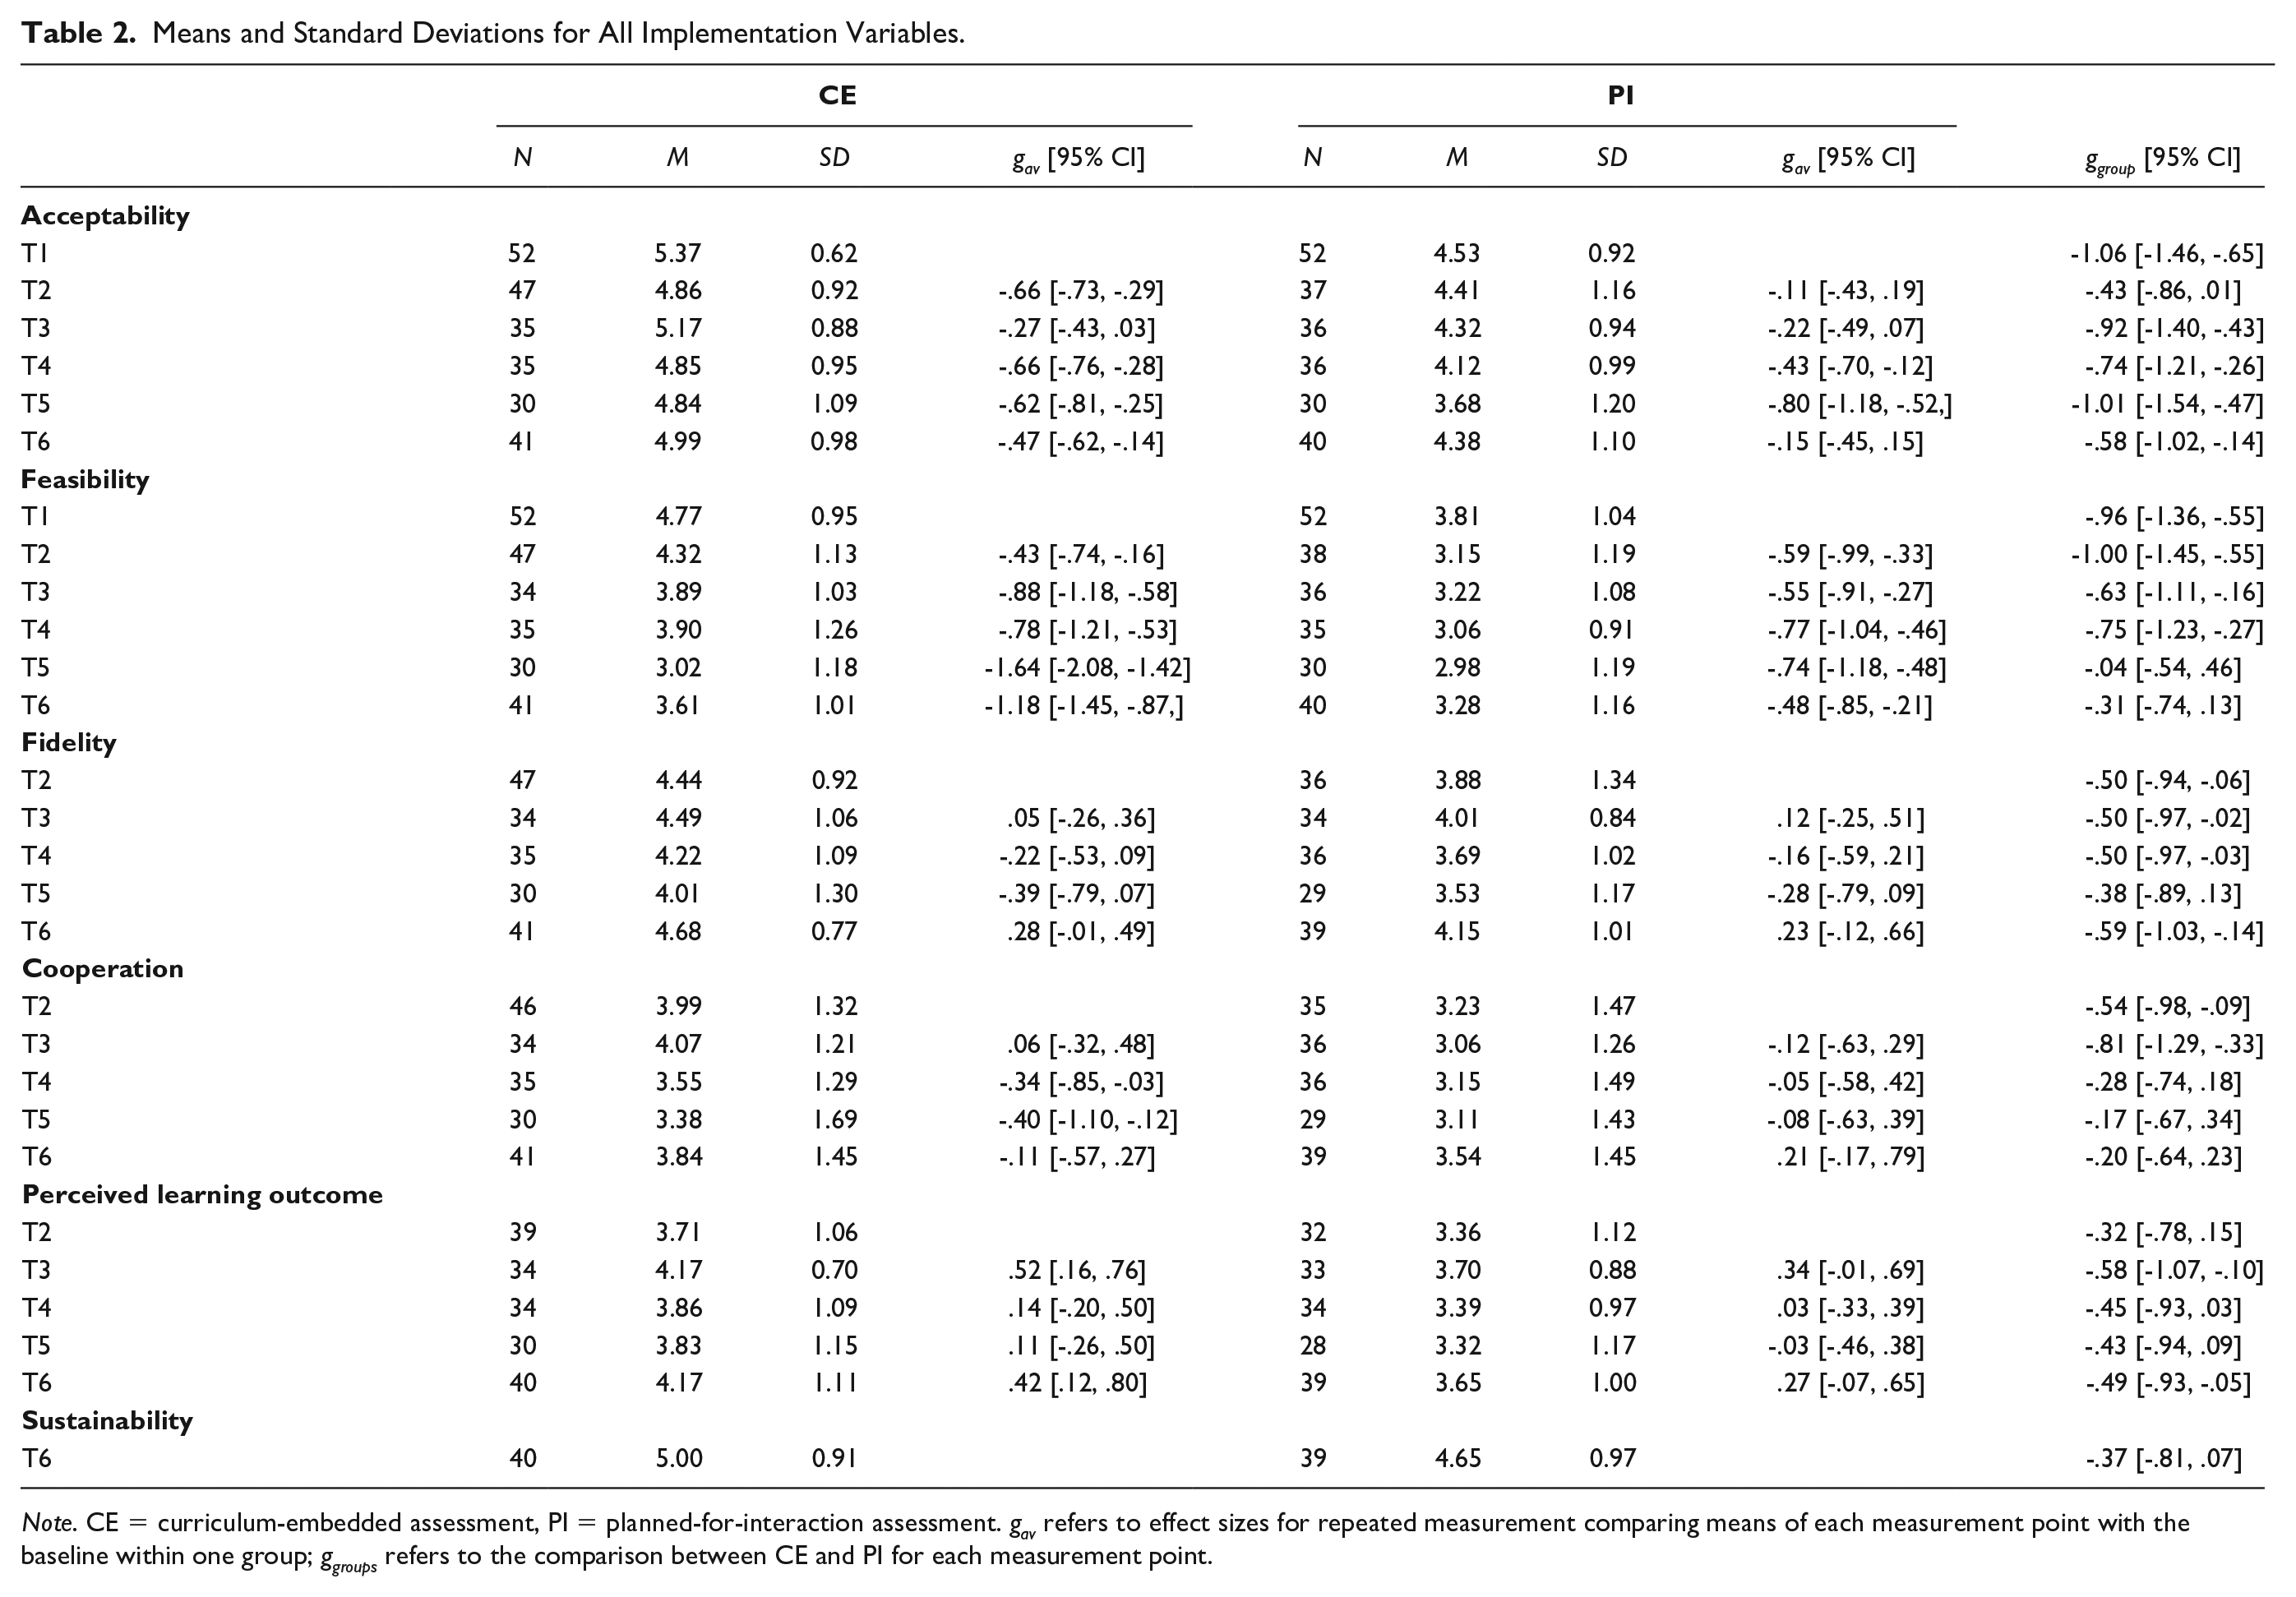
Note. CE = curriculum-embedded assessment, PI = planned-for-interaction assessment. gav refers to effect sizes for repeated measurement comparing means of each measurement point with the baseline within one group; ggroups refers to the comparison between CE and PI for each measurement point.
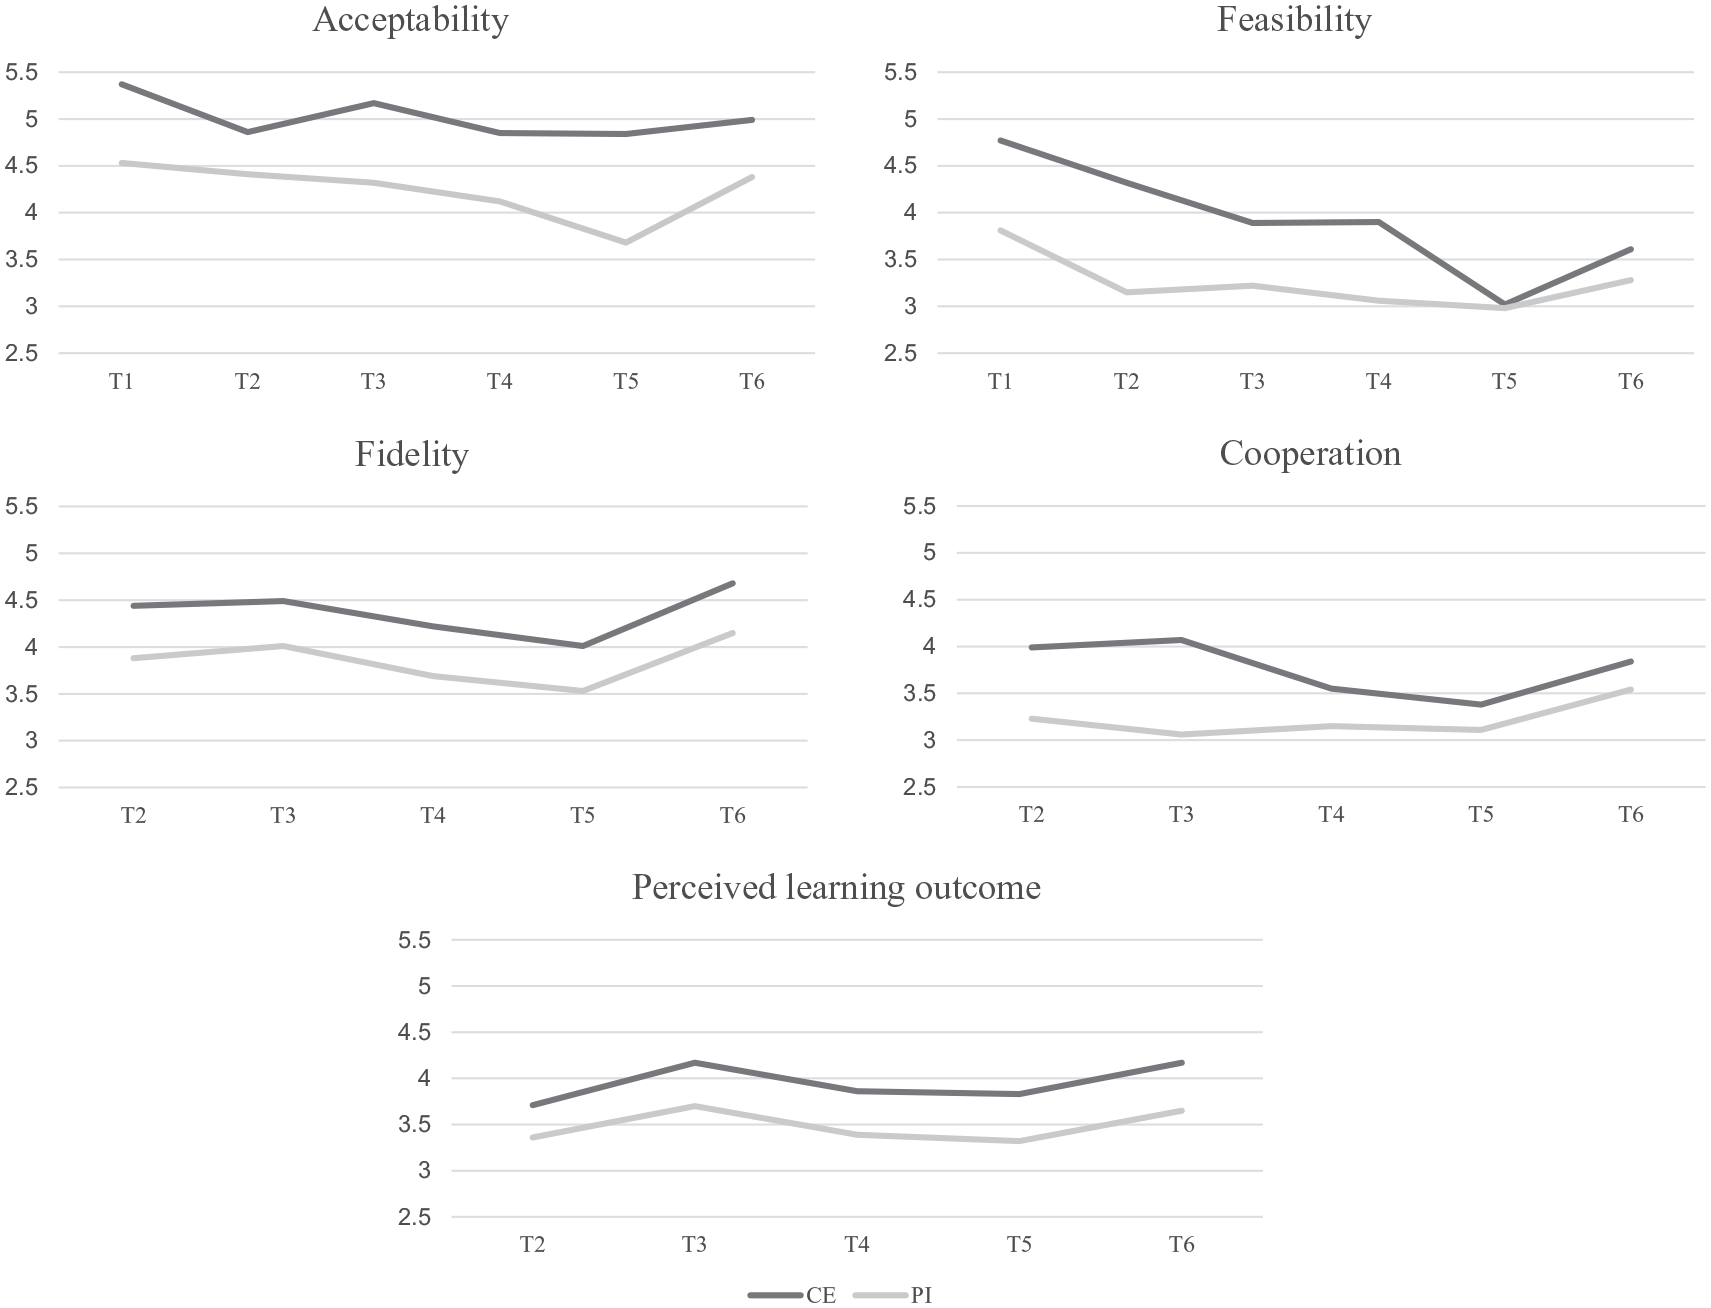
Ratings for the Implementation Variables in CE and PI for All Points of Measurement
Hierarchical linear regression analyses were conducted for each implementation variable. Complete model results are provided in Table 3 (acceptability and feasibility; T1–T6) and Table 4 (fidelity, cooperation, and perceived learning outcome; T2–T6).
Model Results for Acceptability and Feasibility.
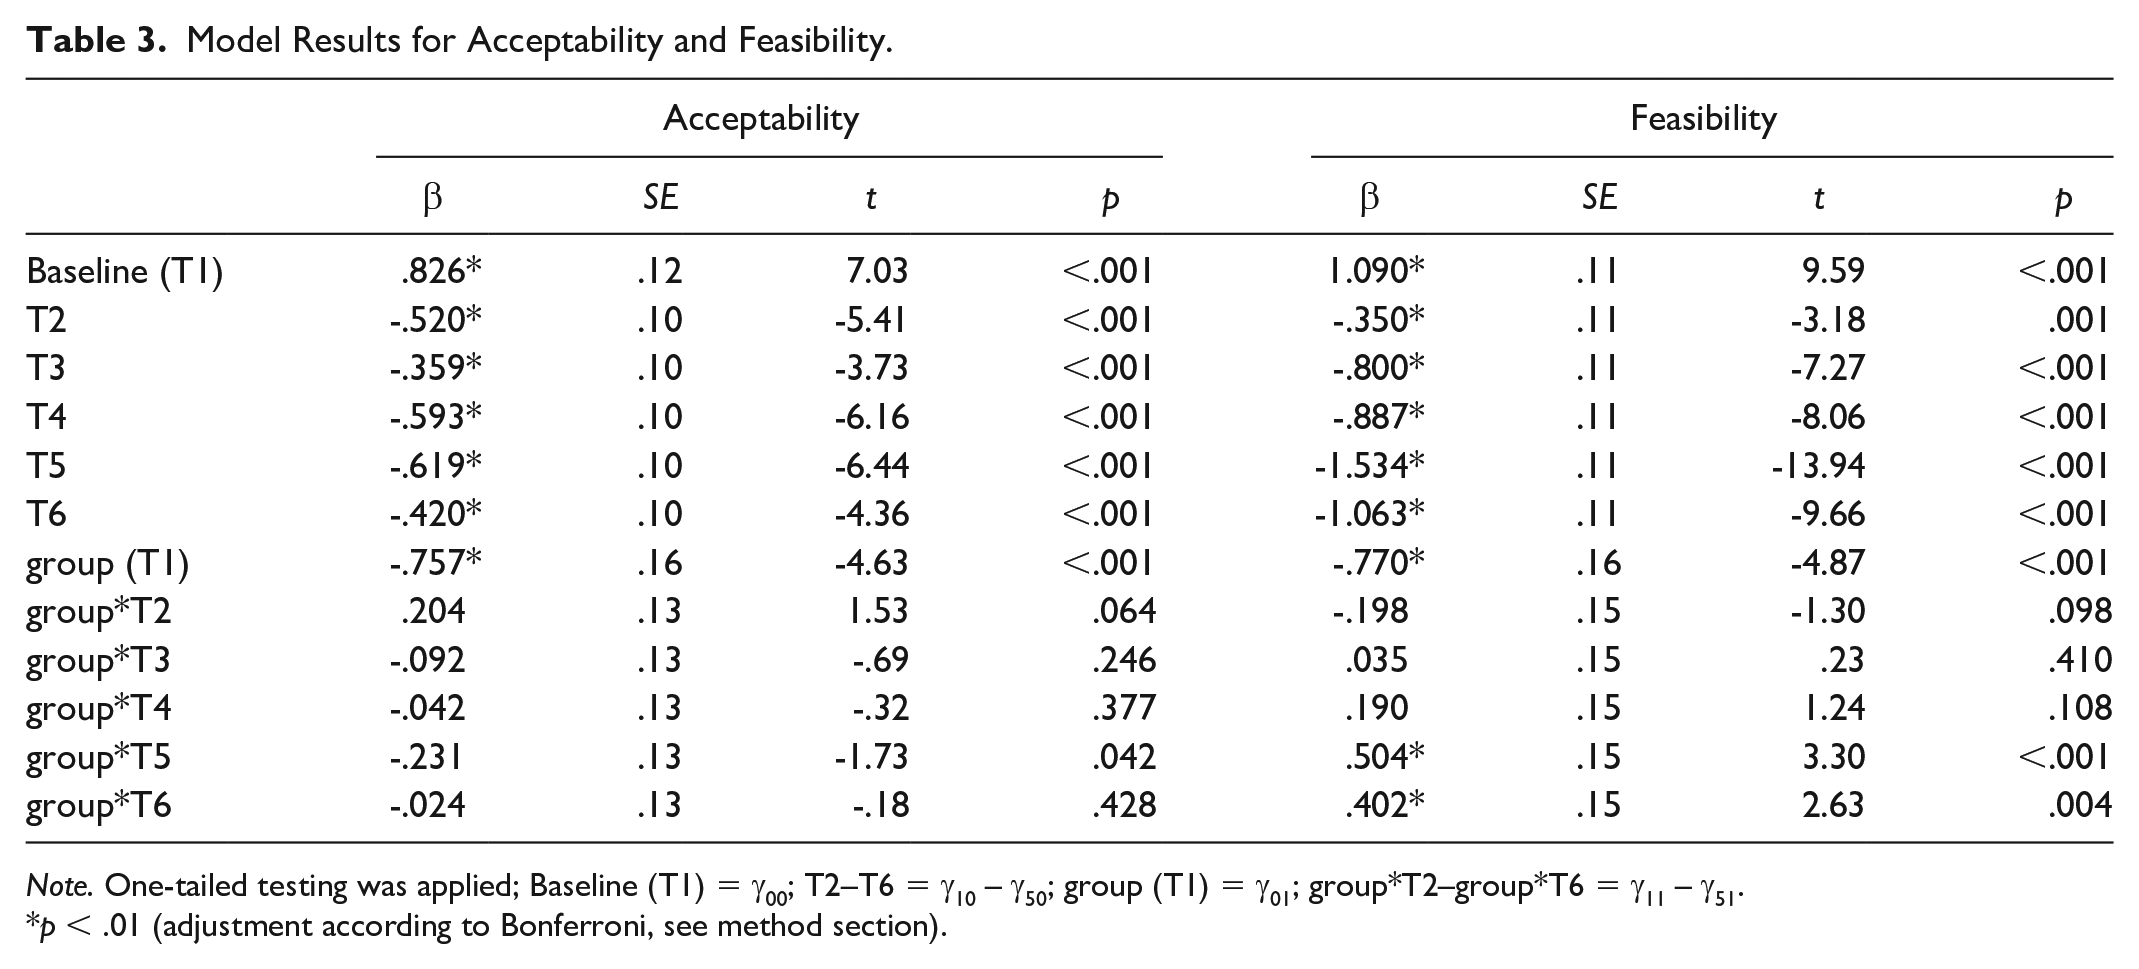
Note. One-tailed testing was applied; Baseline (T1) = γ00; T2–T6 = γ10 – γ50; group (T1) = γ01; group*T2–group*T6 = γ11 – γ51.
p < .01 (adjustment according to Bonferroni, see method section).
Model Results for Fidelity, Cooperation, and Perceived Learning Outcome.
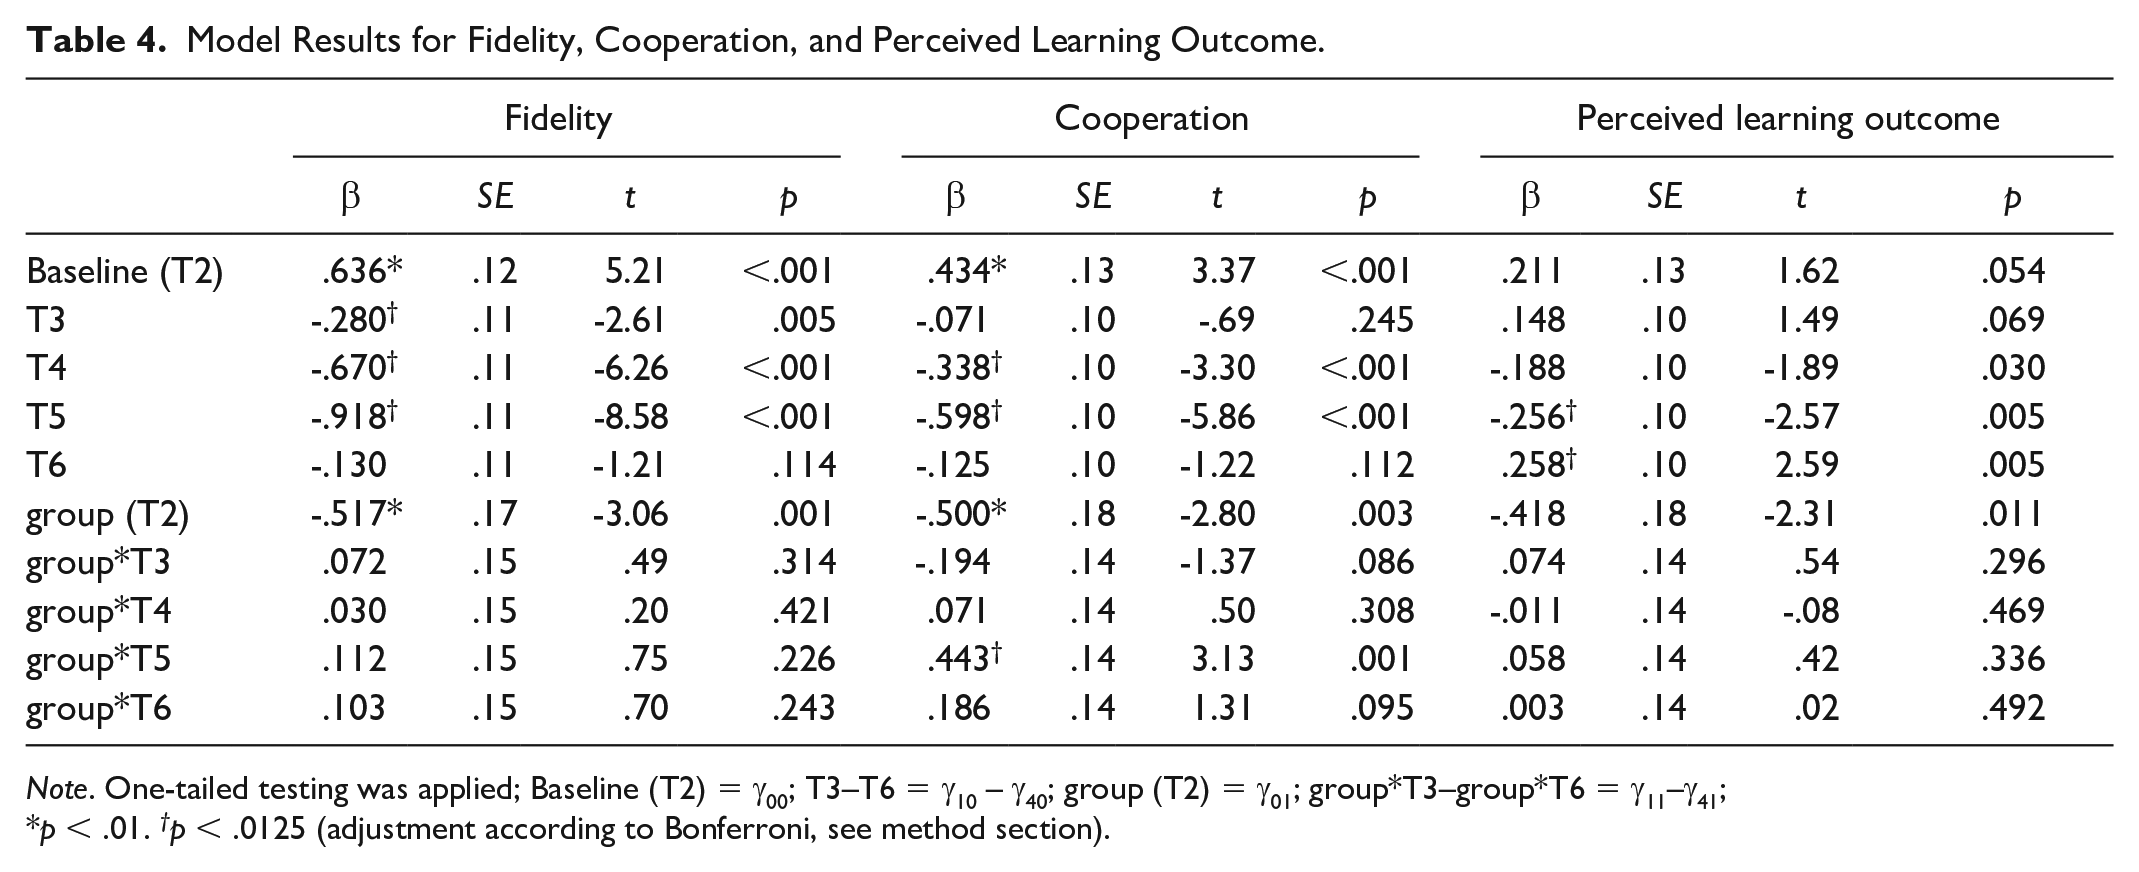
Note. One-tailed testing was applied; Baseline (T2) = γ00; T3–T6 = γ10 – γ40; group (T2) = γ01; group*T3–group*T6 = γ11–γ41;
p < .01. †p < .0125 (adjustment according to Bonferroni, see method section).
Regarding the initial implementation phase (H1), effects were significantly higher for CE compared with PI at baseline for all implementation variables (acceptability: β = −.757, p <.001; feasibility: β = −.770, p < .001; fidelity: β = −.517, p = .001; cooperation: β = −.500, p = .003), except for perceived learning outcome (β = −.418, p = .011). This advantage of CE was also stable for the second measurement point. While at the second measurement point both groups showed a lower rating on all variables (except for perceived learning outcome), these declines did not significantly differ between the groups.
Effects in both groups were then examined for the later measurement points (H2). The development patterns were, in part, specific to the different implementation variables, but they also indicated a general trend: For all variables, significant decreases were found in the CE group for most of the measurement points. These decreases were most pronounced at T4 and T5, and less so at T6. For perceived learning outcome, however, we found a significant increase at T6 (β = .258, p = .005).
Comparing the development of CE and PI, only a partially consistent pattern emerged. For feasibility, fidelity, cooperation and perceived learning outcome, decreases tended to be lower for PI than CE. However, these effects were only significant for feasibility at T5 (β = .504, p < .001) and T6 (β = .402, p = .004) and cooperation at T5 (β = .443, p = .001). For some measurement points, we found an even greater (but nonsignificant) decrease for PI (feasibility: T2, cooperation: T3, perceived learning outcome: T4). Differences for perceived learning outcome were almost negligible. For acceptability, the decrease was slightly higher for PI than CE, but no significant effects were found.
For sustainability (H3), mean values were higher for CE (M = 5.00) than PI (M = 4.65). However, the Wilcoxon rank sum test revealed no significant differences between the approaches (z = 1.69, p = .091, r = .16).
As the results not only represent a comprehensive evaluation of the concept but also relate to the specific content and material, we extended our analyses by averaging effect sizes for group comparisons for the first two measurement points and then also for the last two measurement points. In doing so, we aimed to get a better understanding of how teachers’ evaluations developed as variations caused by the specific topics were compensated for. In general, results suggest constant effects in favor of CE across time for acceptability (T1/T2: g = −.75, T3: g = −.92, T4: g = −.74, T5/T6: g = −.80), fidelity (T2/T3: g = −.50, T4: g = −.50, T5/T6: g = −.49), and perceived learning outcome (T2/T3: g = −.45, T4: g = −.45, T5/T6: g = −.46). In contrast, differences between CE and PI decreased for feasibility (T1/T2: g = −.98, T3: g = −.63, T4: g = −.75, T5/T6: g = −.18) and cooperation (T2/T3: g = −.68, T4: g = −.28, T5/T6: g = −.19).
Discussion
In this study, we aimed to investigate how FA can best be made accessible to teachers. Specifically, we compared the effects of two differently structured FA approaches (CE vs. PI) at the teacher level over the course of one school year. When implementing the approaches in their math classes, teachers were supported with ongoing PD, which was parallel between conditions but differed somewhat because of the approaches’ differences in structure. Throughout the school year, teachers rated implementation success at various measurement points. In line with Hypothesis 1, effects on all outcome variables (acceptability, feasibility, fidelity, cooperation), except for perceived learning outcome, were higher for CE in the initial phase of implementation. Hypothesis 2 was only partly confirmed: While teachers eventually rated the implementation variables for PI slightly better (compared with initial ratings) on a descriptive level, these changes were small, rarely significant and seemed to reflect a smaller decrease in ratings on the outcome variables. Here, when compensating for some situational instabilities, some outcome-specific trends emerged, representing rather constant differences between PI and CE for acceptability, fidelity, and perceived learning outcome but decreasing differences for feasibility and cooperation. Sustainability (measured at T6) did not significantly differ between the groups, thereby confirming Hypothesis 3.
Despite the partly outcome-specific development patterns, our results indicate some general trends: (a) in a head-to-head comparison, the more structured approach showed advantages, especially at the beginning of the implementation process, and (b) the teachers’ perceptions of the two FA approaches only weakly converged. We end by carefully discussing the slightly negative trend for both approaches in view of our study design.
First, regarding short-term effects, our results clearly highlight the benefits of highly structured FA approaches when implementing them into school practice. For the initial phase of implementation, the tighter CE guidelines led to better outcomes in various domains, and, thus, teachers rated this approach as having better acceptance and feasibility and affected actual teacher behavior (fidelity), and cooperation among colleagues. Our results, thereby, reflect and extend previous evidence on how to design effective FA approaches (Andersson & Palm, 2018; Hebbecker et al., 2022; Hebbecker & Souvignier, 2018; Hondrich et al., 2016). The provided CE-based assessments seem to have helped teachers act and feel confident in the classroom, thereby fulfilling the goal that concepts and teaching material are linked to everyday practice and ready to use (Heitink et al., 2016). In contrast, the PI-based approach involves more abstraction and may, therefore, require even more practical guidance to ensure that teachers perceive this approach positively and use it with high levels of fidelity. Practical teaching considerations might also be pivotal here. While PI-based assessments require individual or small group settings, CE seems better applied to lessons involving the whole class and, thus, is less time-consuming (State et al., 2017).
Regarding long-term effects, the hypothesized responses we expected teachers to have in their perceptions of PI and CE were only partially verified, and they tend to refer to smaller decreases in the outcome variables for PI rather than better PI ratings over time. However, as studies have shown that more flexible approaches do have some specific advantages (Goertzen et al., 2023; Schellenbach-Zell & Gräsel, 2010; Schrader et al., 2020) and because teachers in our study also wished to sustainably implement both approaches, it is worth examining the interplay between the approach’s specific design and implementation conditions. As such, and probably most important, is that one school year might be too short for teachers to comprehensively evaluate the success of implementation. Research on PD has yielded evidence that implementation processes may take years to achieve the desired effects (Desimone, 2002). When it comes to comprehensive frameworks such as FA, where implementation requires substantial changes in teaching activities and attitudes toward learning, this might be particularly true. In this context, Marshall and Drummond (2006) also spoke of adopting the “spirit of FA” which involves considering FA as an integral part of school practice rather than simply embedding a set of assessments (DeLuca et al., 2019; Gotwals & Cisterna, 2022). However, meeting this expectation within one school year may be difficult. Specifically, internalizing the concept can only occur once teachers translate the concept into concrete action and gradually gain confidence with applying it in the classroom. Here, it is possible that by embedding assessment tasks, teachers in CE had their first positive experiences with FA at an early stage of implementation, resulting in early reflection processes, whereas these changes may have taken longer to manifest in the PI approach. In other words, applying a specific instrument (here: providing students with the written task sets for assessment) may be easier than establishing instructional activities that strongly depend on the teacher’s knowledge and the quality of implementation, as is needed for PI-based questioning and discussion practices (Desimone & Garet, 2015). Similarly, teachers in the PI group may not have had sufficient resources or were not sufficiently aware of the effort required to adapt the approach to their specific circumstances. Thus, future PD programs could explicitly discuss ways to adapt the FA approach to local conditions (e.g., students’ needs) and integrate it into one’s own routine (Penuel et al., 2007). Overall though, for the PI approach’s flexibility to pay off, a longer implementation period might be needed. Thus, the positive development of feasibility and cooperation that we found for the PI approach at the end of the implementation period may indicate the start of a process in which these benefits gradually become evident.
Regardless of the extent of structuring, both approaches tended to show a negative trend for almost all outcome variables. Although these changes occurred on an acceptable to high level, these results highlight the challenge of sustainably disseminating innovations in the school context (Slavin et al., 2021) and suggest that continuous support is needed so that teachers not only perceive an innovation to be acceptable and feasible at the outset, but also that they gain positive practical experiences in class which then reinforce their positive attitudes (Clarke & Hollingsworth, 2002). Nonetheless, characteristics of the study’s design should also be acknowledged when interpreting the results.
As such, although we implemented a comprehensive concept, the material provided and the topics covered in PD were inherently content specific, which may have affected teachers’ perceptions at specific points of measurement. For instance, when participating in PD, teachers highly value when the provided material matches the topics they will teach in class, and they perceive any lack of congruence (for instance, as induced by mandatory curriculum pacing) as a barrier to implementation (Buczynski & Hansen, 2010; Desimone & Garet, 2015). Thus, some of the content in this study simply may not have met teachers’ expectations and needs, thus leading to less positive attitudes at respective points of measurement. As such, occasional deviations in the outcome variables’ development (for instance, the relatively low ratings at T5) may occur without severe consequences for the entire implementation process. Furthermore, for acceptability and feasibility, ratings at T1 represent an anticipatory evaluation before implementing the concept in the classroom and may, therefore, represent a very high standard of comparison. When teachers start to become familiar with a plausible and evidence-based concept, they may show initially positive attitudes. Yet, applying this concept in the “real world” and translating the idea into concrete teaching activities may entail some difficulties, resulting in somewhat lower ratings for the subsequent measurement points.
Limitations and Implications for Future Research
This study’s strength lies in its high ecological validity, as we were able to longitudinally evaluate the intervention’s implementation success under the real conditions of school practice. However, investigating effects in the field comes along with challenges. For instance, we had to deal with high rates of missing data mainly caused by illness, other school events or dropout. Although latent modeling allows for estimating effects for incomplete data, effects should be interpreted with caution given the large standard deviations. Furthermore, our study design only allowed for assessing implementation success via teachers’ self-reports, which can, of course, be biased due to social desirability, or retrospective recall, among others. While the assessment of teachers’ perceptions (e.g., acceptability, feasibility) inherently relies on self-reports, especially for assessing implementation fidelity, however, more objective assessment strategies would be desirable.
When drawing conclusions on the design of effective FA approaches, some limitations must be considered. For example, when teachers evaluate an innovation’s implementation success, they are likely to simultaneously evaluate the concept and the circumstances under which it is implemented, such that these evaluations may interfere. Thus, it may be fruitful to examine the relationships between outcome variables and other context factors, that is, collective self-efficacy. Given the varying conditions facing schools as well as the specific characteristics of our study (e.g., COVID-19 pandemic), generalizing the effects to other settings appears limited, although our sample size can be considered substantial compared with other longitudinal intervention studies. Furthermore, in our study, we focused on teachers’ overall assessment of two differently structured FA approaches, omitting possible interactions between the teachers’ individual prerequisites (i.e., teaching experience, attitudes, knowledge) and the innovation offered. Yet, the more expertise the teacher has, the more they may value the autonomy of the PI approach (Desimone, 2002). Thereby, a worthwhile pathway for future research and practice may be to study differential effects and, if applicable, offer “differentiated PD” (e.g., Antoniou & Kyriakides, 2013; Desimone & Garet, 2015).
The present study was designed to provide a direct comparison of approaches with varying degrees of structure. It seems possible—if not certain—that ultimately a combination of highly structured and more flexible elements may be key to the long term, sustainable implementation of FA. The design of such a combination (e.g., whether different components should be introduced sequentially) presents a valuable perspective for future research. While the current findings suggest that approaches with a higher degree of formalization should be introduced first, followed by increased flexibility, further testing of this assumption is still needed.
Practical Implications
Successful PD should help teachers become familiar with the theoretical principles of FA, translate the concept into instructional action and, ultimately, facilitate long-term implementation. The results of our study suggest that when designing PD, it might be worthwhile to initially implement FA approaches with a higher level of formalization. When directly compared, the highly structured concept was more positively perceived by teachers, thus facilitating instructional changes. For teachers to change their instructional behavior and use FA in practice, providing them with explicit guidelines and ready-to-use material seems pivotal. Offering intensive and continuous PD with ongoing reflection processes can further help teachers gain positive practical experiences. For an FA approach with more flexibility to pay off, an even longer implementation period may be needed. Our results suggest that teacher PD should account for that fact that FA entails a long, multi-stage process in which teachers first need an explicit structure to initiate changes in classroom behavior and then gradually become confident to flexibly adapt the concept to their specific conditions.
Supplemental Material
sj-docx-1-jte-10.1177_00224871251350680 – Supplemental material for Implementing Formative Assessment Into School Practice: A Matter of Structuring the Intervention?
Supplemental material, sj-docx-1-jte-10.1177_00224871251350680 for Implementing Formative Assessment Into School Practice: A Matter of Structuring the Intervention? by Larissa Aust, Jeanne-Celine Linker, Luise Eichholz, Jana Schiffer, Marcus Nührenbörger, Christoph Selter and Elmar Souvignier in Journal of Teacher Education
Footnotes
Appendix
Similarities and Differences Between the Two Groups.
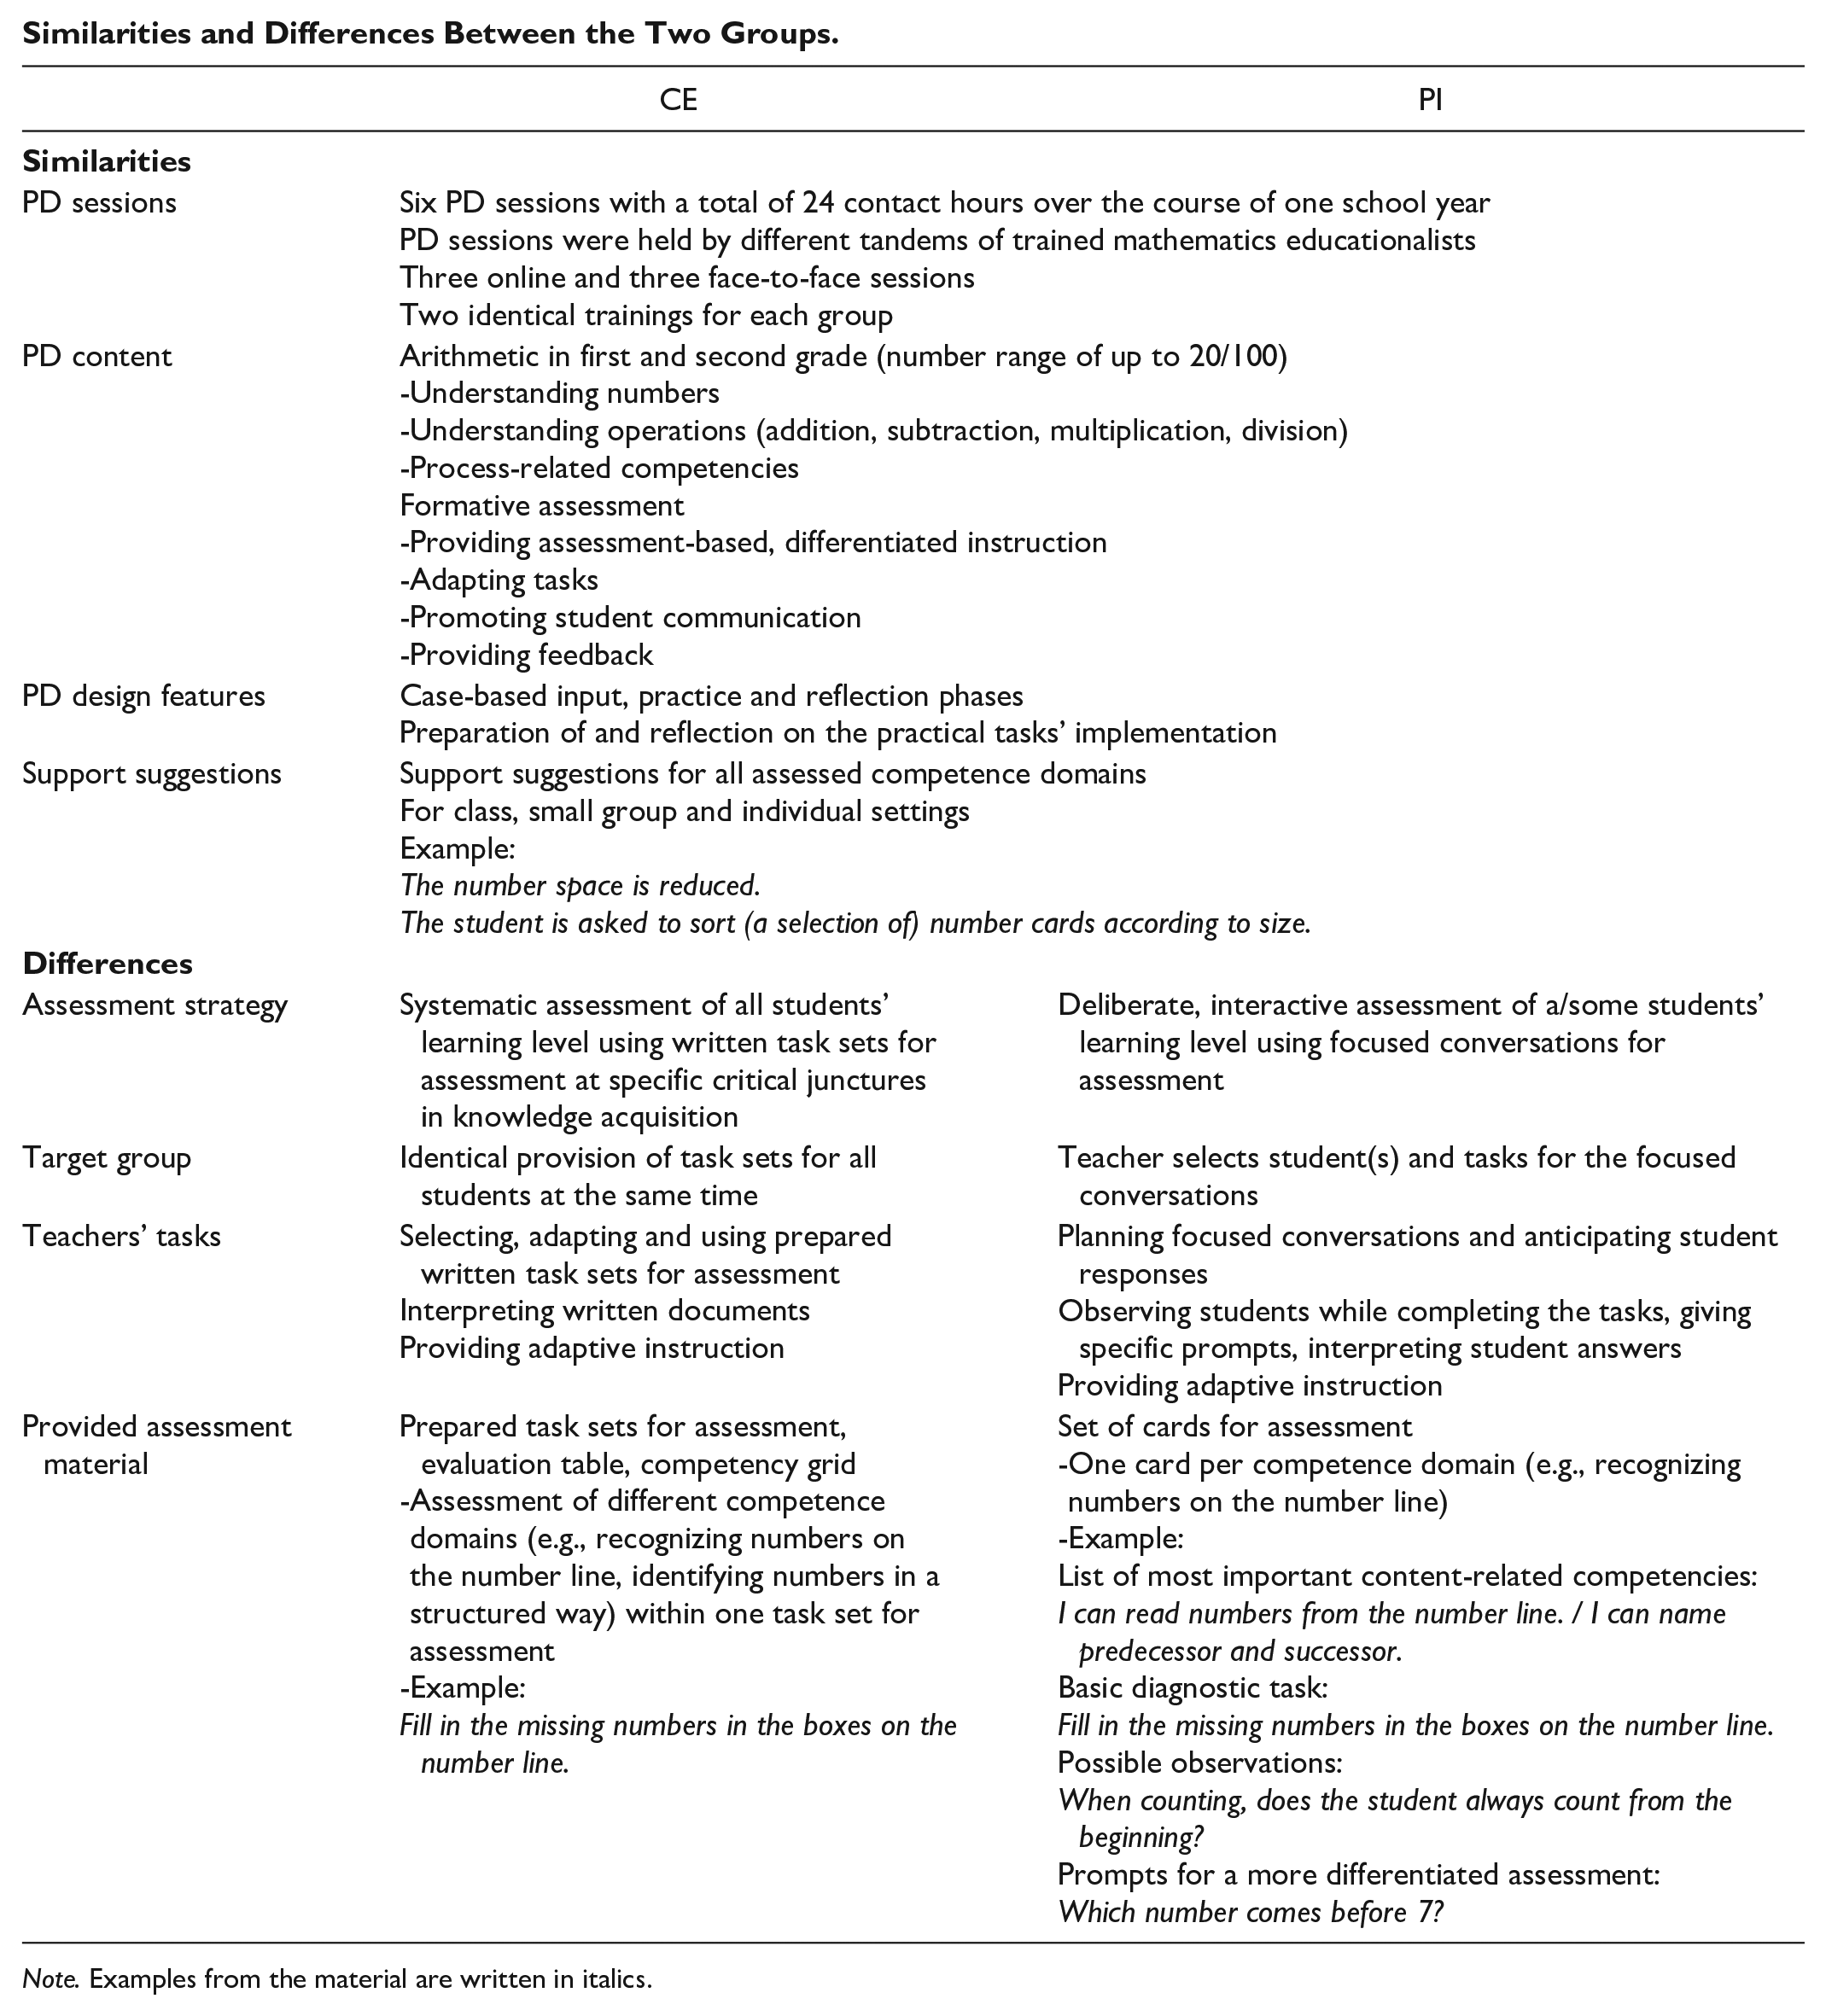
| CE | PI | |
|---|---|---|
|
|
||
| PD sessions | Six PD sessions with a total of 24 contact hours over the course of one school year PD sessions were held by different tandems of trained mathematics educationalists Three online and three face-to-face sessions Two identical trainings for each group |
|
| PD content | Arithmetic in first and second grade (number range of up to 20/100) -Understanding numbers -Understanding operations (addition, subtraction, multiplication, division) -Process-related competencies Formative assessment -Providing assessment-based, differentiated instruction -Adapting tasks -Promoting student communication -Providing feedback |
|
| PD design features | Case-based input, practice and reflection phases Preparation of and reflection on the practical tasks’ implementation |
|
| Support suggestions | Support suggestions for all assessed competence domains For class, small group and individual settings Example: The number space is reduced. The student is asked to sort (a selection of) number cards according to size. |
|
|
|
||
| Assessment strategy | Systematic assessment of all students’ learning level using written task sets for assessment at specific critical junctures in knowledge acquisition | Deliberate, interactive assessment of a/some students’ learning level using focused conversations for assessment |
| Target group | Identical provision of task sets for all students at the same time | Teacher selects student(s) and tasks for the focused conversations |
| Teachers’ tasks | Selecting, adapting and using prepared written task sets for assessment Interpreting written documents Providing adaptive instruction |
Planning focused conversations and anticipating student responses Observing students while completing the tasks, giving specific prompts, interpreting student answers Providing adaptive instruction |
| Provided assessment material | Prepared task sets for assessment, evaluation table, competency grid -Assessment of different competence domains (e.g., recognizing numbers on the number line, identifying numbers in a structured way) within one task set for assessment -Example: Fill in the missing numbers in the boxes on the number line. |
Set of cards for assessment -One card per competence domain (e.g., recognizing numbers on the number line) -Example: List of most important content-related competencies: I can read numbers from the number line. / I can name predecessor and successor. Basic diagnostic task: Fill in the missing numbers in the boxes on the number line. Possible observations: When counting, does the student always count from the beginning? Prompts for a more differentiated assessment: Which number comes before 7? |
Note. Examples from the material are written in italics.
Declaration of Conflicting Interests
The author(s) declared no potential conflicts of interest with respect to the research, authorship, and/or publication of this article.
Funding
The author(s) disclosed receipt of the following financial support for the research, authorship, and/or publication of this article: This work was supported by the German Federal Ministry of Education and Research [grant numbers 01NV2102A and 01NV2102B]. Funding source had no other involvement.
Note to Open Science
The study’s analysis plan was preregistered in the Open Science Framework (https://osf.io/pzfd7). The data, reproducible codes and the supplemental material are available via the following link: ![]()
ORCID iDs
Supplemental Material
Supplemental material for this article is available online.
Notes
Author Biographies
References
Supplementary Material
Please find the following supplemental material available below.
For Open Access articles published under a Creative Commons License, all supplemental material carries the same license as the article it is associated with.
For non-Open Access articles published, all supplemental material carries a non-exclusive license, and permission requests for re-use of supplemental material or any part of supplemental material shall be sent directly to the copyright owner as specified in the copyright notice associated with the article.