
Abstract
Disparities exist in autism identification and service access in U.S. public schools. Over- or under-identification of autism may limit access to appropriate services. This study examined racial and ethnic differences in autism identification, general education inclusion, and service access in the California education system and examined trends in autism identification by race and ethnicity in special education from 2008 to 2018. Hispanic/Latino and Pacific Islander students were less likely to be identified with autism than other groups. Black autistic students were less likely to be included in general education settings. A narrowing gap in autism identification over the past decade between White and Hispanic/Latino students suggests some improvement in equitable identification practices, although continued disparities exist.
Over the past decade, the number of children on the autism spectrum receiving special education services in public schools in the United States has increased to 828,000, which comprises 12% of all students with disabilities (Irwin et al., 2022). Federal law requires public schools to provide special education services to students with disabilities, including autism. Examples of services listed in an Individualized Educational Program (IEP) include speech and language therapy, occupational therapy, or behavioral intervention services. Additionally, federal law requires students with disabilities to receive services in the “least restrictive environment” (LRE), where they are educated with students without a disability as much as possible, and the removal from the regular education environment to special settings only happens when education cannot be achieved in the usual classroom.
Disproportionality in special education identification and service access is a key area of concern. Significant disproportionality is defined as a Local Educational Agency (LEA; e.g., school district, charter school, county office of education) having an identified racial and ethnic over-representation in any disability category or special education placement (i.e., LRE) over three consecutive years (US Department of Education, 2004). The threshold of risk ratio for “significant disproportionality” is determined by each state, ranging from 2.0 to 4.0 (ideadata.org). It is 3.0 or more in California, which is also used by other states (e.g., Arizona), meaning a group is three times as likely, for example, to be identified with autism compared to other groups. Education agencies are required to track identification and services for students from different backgrounds, and currently, significant disproportionality uses race and ethnicity as the sole demographic indicator. Education agencies must use federal funds to address the issue when significant disproportionality is found, making this also an economic concern (Center for IDEA Fiscal Reporting & IDEA Data Center, 2015). Understanding how race and ethnicity affect autism identification, special education services, and placement can inform policy and help identify procedures that ensure greater accuracy and equity in service access.
Disproportionality in Autism Identification and Eligibility
Disparities in autism identification are found both in medical diagnosis and in educational eligibility (e.g., Baio, 2014, 2018; Cooc, 2018; Kim et al., 2021; Maenner, 2020; Sullivan, 2013; Young et al., 2024). Historically, White children have been more likely to be identified with autism than other racial and ethnic groups. In the past decade, racial and ethnic differences in autism identification have started to narrow (Maenner, 2020; Maenner et al., 2021, 2023). Based on data collected by the Autism and Developmental Disabilities Monitoring (ADDM) network in 2020, for the first time, the prevalence of autism in 8-year-old children was higher in Black, Hispanic/Latino, and Asian or Pacific Islander children than in White children. Nevertheless, the percentage of Black autistic children who were also diagnosed with intellectual disability (ID) remained higher than the rates in other racial and ethnic groups (Maenner et al., 2023). This suggests improvement and a need for continued work to examine racial and ethnic differences in appropriate identification.
Racial and ethnic disparities are also found in educational eligibility. White students are more likely to be identified with autism than Black, Hispanic/Latino, and American Indian/Alaskan Native students in schools based on state and national data (Marks et al., 2014; Sullivan, 2013). For example, Hispanic/Latino students were nearly 40% less likely to be identified with autism than White students (Sullivan, 2013). Recently, using state-level data, Kim et al. (2025) found that in North Carolina, non-Hispanic Black students were overrepresented in ID identification and underrepresented in autism identification compared to their non-Hispanic White peers.
There are both similarities and differences in the autism prevalence and disproportionality patterns in California compared to the nation and other states. In 2022, 17% of students with disabilities in California were identified as having autism, which is higher than in other states (US Department of Education, 2024). Earlier studies examining autism prevalence and racial differences using educational identification nationally suggested that Black, Hispanic/Latino, and White students were more likely to be identified with autism in California than in many other states (Travers & Krezmien, 2018; Travers et al., 2014); in the early 2000s, in California, Asian, Black, and White students were overidentified, while Hispanic/Latino students were under-identified (Mark & Kurth, 2013; Morrier & Hess, 2012). Findings for American Indian/Alaskan Native students were mixed. Limited studies have examined autism identification in the California, special education system although it has the highest enrollment of public K–12 students in the country (State of California, Department of Finance California, 2023). In fact, only two studies were found examining disproportionality in autism identification, specifically in the California education system (Cooc, 2018; Luelmo et al., 2022), and the results support racial and ethnic disparities. During the 2019/2020 school year White students were significantly overrepresented in the autism category in seven LEAs, and Hispanic/Latino students with other disabilities were overidentified in special education more generally and under-represented in autism identification (Luelmo et al., 2022). Cooc (2018) specifically examined Asian Americans in special education in California and found that Asian American students were underrepresented in special education overall and overrepresented in autism identification across most districts. The patterns of racial disproportionality in California are comparable with a national’s that the patterns changed in Black and Asian children. Hispanic and Native Americans are consistently under-represented (Kim et al., 2025). Based on the limited data and the large proportion of autistic students in the state, educators supporting autistic students have a specific interest in examining disproportionality in California.
Disproportionality in Placement and Access to Services
Disparities also occur in accessing services after a student is identified with autism.
Despite federal regulations mandating free and appropriate education and receipt of inclusive services in public schools, decades of research highlight disproportionality issues in special education related to LRE access. For example, Black students with disabilities are underrepresented in general education classrooms and overrepresented in more restrictive educational environments (Skiba et al., 2006). Additionally, the National Center for Education Statistics (2020) reports that 55% of White students with disabilities spend more than 80% of the school day in a general education classroom compared with only a third of Black students with disabilities. Hispanic and American Indian students with disabilities are also more likely to spend more time in a separate classroom compared with White students (Hussar et al., 2020).
Disparities in LRE also exist across disability categories. Compared with 13% of students with disabilities generally, 33% of students with autism have low access to LRE (Irwin et al., 2022). On average, about a third of autistic students were placed in general education settings for 80% or more of the school day in the United States, which is similar to the rate in California in 2018 (34% vs. 57% for students with disabilities; US Department of Education, 2019). The percentage varies by state with some states (e.g., Colorado, Connecticut, and Idaho) tending to be more inclusive compared with others (e.g., New York, South Carolina, and Washington, D.C.; Kurth, 2015). Furthermore, close to half of the cases involved in LRE-related hearings (e.g., placement decisions) in California were for students classified as having autism (Bolourian et al., 2020).
In addition to placement in special education, students also have access to specialized services. The primary services received by autistic students in school are speech and occupational therapy, and behavioral interventions (McDonald et al., 2019; Wei et al., 2014). The examination of racial differences in educational services received by autistic students is limited. Sturm and colleagues (2021) found racial disparities in the number of special education services received across eligibility groups (i.e., autism, ID, speech and language disability) in a large school district with a large Hispanic student population. Specifically, White American, European American, or Middle Eastern American students received a higher number of services, and Hispanic students received fewer than other racial groups. Among the three eligibility groups, students with autism had the most significant racial differences.
Addressing Disproportionality
These disproportionality findings are problematic for a multitude of reasons. On one hand, overrepresentation can result in a mismatch between students’ educational needs and the services they receive. Overrepresentation may also indicate a misinterpretation of behaviors, particularly for students from diverse racial and ethnic backgrounds (e.g., Black students are overrepresented in emotional disturbance and intellectual disability when compared with White counterparts; Cruz & Rodl, 2018), which can ultimately negatively impact their educational opportunities. Overrepresentation of students from diverse racial and ethnic backgrounds can also lead to stigmatization of groups and may imply racial and ethnic bias in the eligibility process (Skiba et al., 2006). Additionally, the current significant disproportionality criterion flags only over-identification, not under-identification (Luelmo et al., 2022). This means that any risk ratios below 3.0 are not flagged or monitored, and students who are under-identified might be missed based on this criterion. Underrepresentation can systematically exclude historically underserved students from services that may help them achieve positive outcomes.
Disproportionality in special education is a complex issue that impacts systemically marginalized students and requires ongoing investigation. Given these issues, it is important to understand current disproportionality in California, both over- and under-representation and also how the disproportionality rates have changed over time to determine whether school efforts to increase equity have led to progress. The present study had three aims: (a) examine the racial and ethnic disproportionality in autism identification in special education in California; (b) examine racial and ethnic differences in general education inclusion and services received by students with autism; and (c) examine a 10-year trend in autism identification by race and ethnicity in special education from 2008 to 2018 school years (SY).
Method
Datasets and Variables
The current secondary data analyses were based on data obtained from a publicly available database (DataQuest) or provided by the California Department of Education in 2020. To address the three aims of the study, various student counts by race and ethnicity, educational identification, and special education services were collected.
To examine the racial and ethnic differences in autism identification rates in California special education in the SY2018/2019 (Aim 1), raw data from DataQuest were extracted, including total number of students with an autism identification, the number of students identified as having autism in each racial and ethnic group, the total number of students overall and students enrolled in special education in that school year, and the number of students in each racial and ethnic group overall and students enrolled in special education, ages birth to 22. To explore racial and ethnic differences in general education inclusion, and services received by students with autism (Aim 2), we used three indicators, Least Restrictive Environment (LRE), separate school placement (i.e., public or private specialized educational settings outside a student’s local school), and Individualized Educational Program (IEP) services (e.g., speech and language therapy, occupational therapy). Data included the number of students in each racial and ethnic group under each indicator. LRE indicates the proportion of the day students with disabilities are educated alongside their peers with no disabilities, and two levels were included in this study: inside a regular education classroom less than 40% of the day, or 80% or more of the day. An IEP is a written plan for students with disabilities identified under IDEA to document their specialized instruction and related services. We looked at six types of services (based on the categories indicated in the CDE dataset): behavioral intervention services, individual counseling, language and speech therapy, mentoring, occupational therapy, and specialized academic instruction. To examine the 10-year trend in autism identification by race (Aim 3), the student count data from the SY2008/2009, SY2013/2014, and SY2018/2019 were extracted.
Data Analyses
The likelihood of being in a certain group was indicated by the risk ratio (RR). The RR describes the likelihood of a certain event happening in one group versus another (Cooc, 2018; Sullivan, 2013). Specifically, in this study, RR is the likelihood of receiving an autism identification, for example, in one racial or ethnic group versus the rest of the racial or ethnic groups in the state. It is computed by using the rate of autism identification in one student racial or ethnic group by the rate of autism identification in the rest of student racial or ethnic groups (e.g., rate in Black students divided by the rate of all the other racial or ethnic groups). A risk ratio of 1 indicates an equal likelihood of being identified with autism in the two groups. A value larger than 1 indicates that the target racial or ethnic group is more likely to be identified with autism than the other groups (i.e., overrepresentation). A value smaller than 1 indicates that the target racial group is less likely to be identified with autism than the rest of the racial groups (i.e., under-representation). A p-value and 95% confidence interval for each risk ratio were computed based on a normal approximation (Nicolas, 2004); a significant p-value (<0.05) indicates a RR different from 1. As mentioned above, the California Department of Education (CDE, n.d.) defines disproportionality as the “overrepresentation of a specific race or ethnicity identified in one or more of four areas: identification of a disability in general; identification of a specific race or ethnicity in a specific disability category; discipline; and placement.” In California, a risk ratio of 3.0 has been used as a criterion for significant disproportionality in special education. Due to limitations in the public dataset, confounding factors such as socioeconomic state and school district are not included in the analyses.
Results
The sample included students from California, ages birth to 22. In SY2018/2019, total enrollment was more than six million, 55% were Hispanic/Latino, 23% were White, 12% were Asian, 5% were Black, 1% were American Indian or Alaskan Native (AIAN), 0.5% were Native Hawaiian or Other Pacific Islanders (NHOPI), and 4% were multiracial. The multiracial group was included in the total enrollment count, but no specific risk ratio analyses were conducted for this group because of the high variability in students included in this group during the CDE data collection process (e.g., those who declined to answer were lumped into this group as well).
Aim 1. Racial and Ethnic Differences in California Special Education Enrollment and Autism Identification
Based on the risk ratio analyses, AIAN (RR=1.33, 95% confidence interval [CI] = [1.30, 1.37]), Black (RR=1.46, 95% CI = [1.45, 1.47]), and Hispanic/Latino (RR=1.09, 95% CI = [1.09, 1.10]) had a higher likelihood of being enrolled in special education than everyone else. Asian students (RR = 0.52, 95% CI = [0.51, 0.52]) and NHOPI (RR=0.77, 95% CI = [0.74, 0.80]) were less likely to be in special education than other students. See Table 1.
Group Differences in California Special Education Enrollment and Autism Identification.
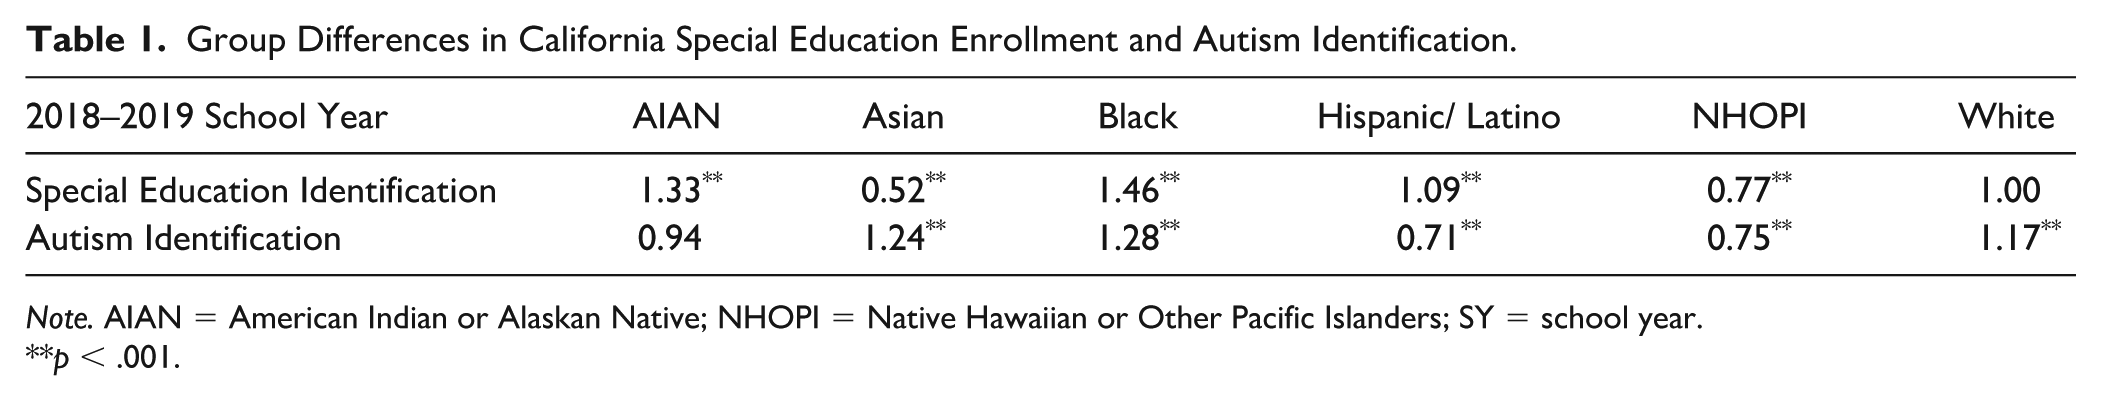
Note. AIAN = American Indian or Alaskan Native; NHOPI = Native Hawaiian or Other Pacific Islanders; SY = school year.
p < .001.
Asian, Black, and White students had an elevated likelihood of meeting an educational eligibility for autism than others (p < .001). Compared with all other racial and ethnic groups, Hispanic/Latino (RR = 0.71, 95% CI = [0.71, 0.72]) and NHOPI students (RR = 0.75, 95% CI = [0.69, 0.83]) were less likely to qualify for special education with autism as the primary condition. See Table 1.
Aim 2. Racial and Ethnic Differences in General Education Inclusion and Services Received by Students With Autism
LRE and Separate School Placement
Black students were the least likely to be included in general education settings (in general education 40% or less; RR = 1.60, 95% CI = [1.54, 1.66]); this risk ratio was the highest among all racial and ethnic groups. The risk ratio for AIAN students indicated a similar educational placement (RR = 1.03, 95% CI = [0.89, 1.18]) as compared with autistic students from other racial categories. Both Hispanic/Latino (RR = 0.61, 95% CI = [0.60, 0.62]) and NHOPI students (RR = 0.59, 95% CI= [0.48, 0.72]) were less likely to be included in the general education settings (i.e., spend more than 80% of the school day in a general education classroom), whereas White students were more likely to be in this setting (RR = 1.55, 95% CI = [1.52, 1.59]). See Table 2. When the risk ratios for separate school placement were examined, the results indicated that Black students were more than twice as likely to be placed in a separate school compared with other students (RR=2.19, 95% CI = [2.03, 2.36]), the highest likelihood among all students.
Group Differences in LRE and Separate School, and IEP Services.
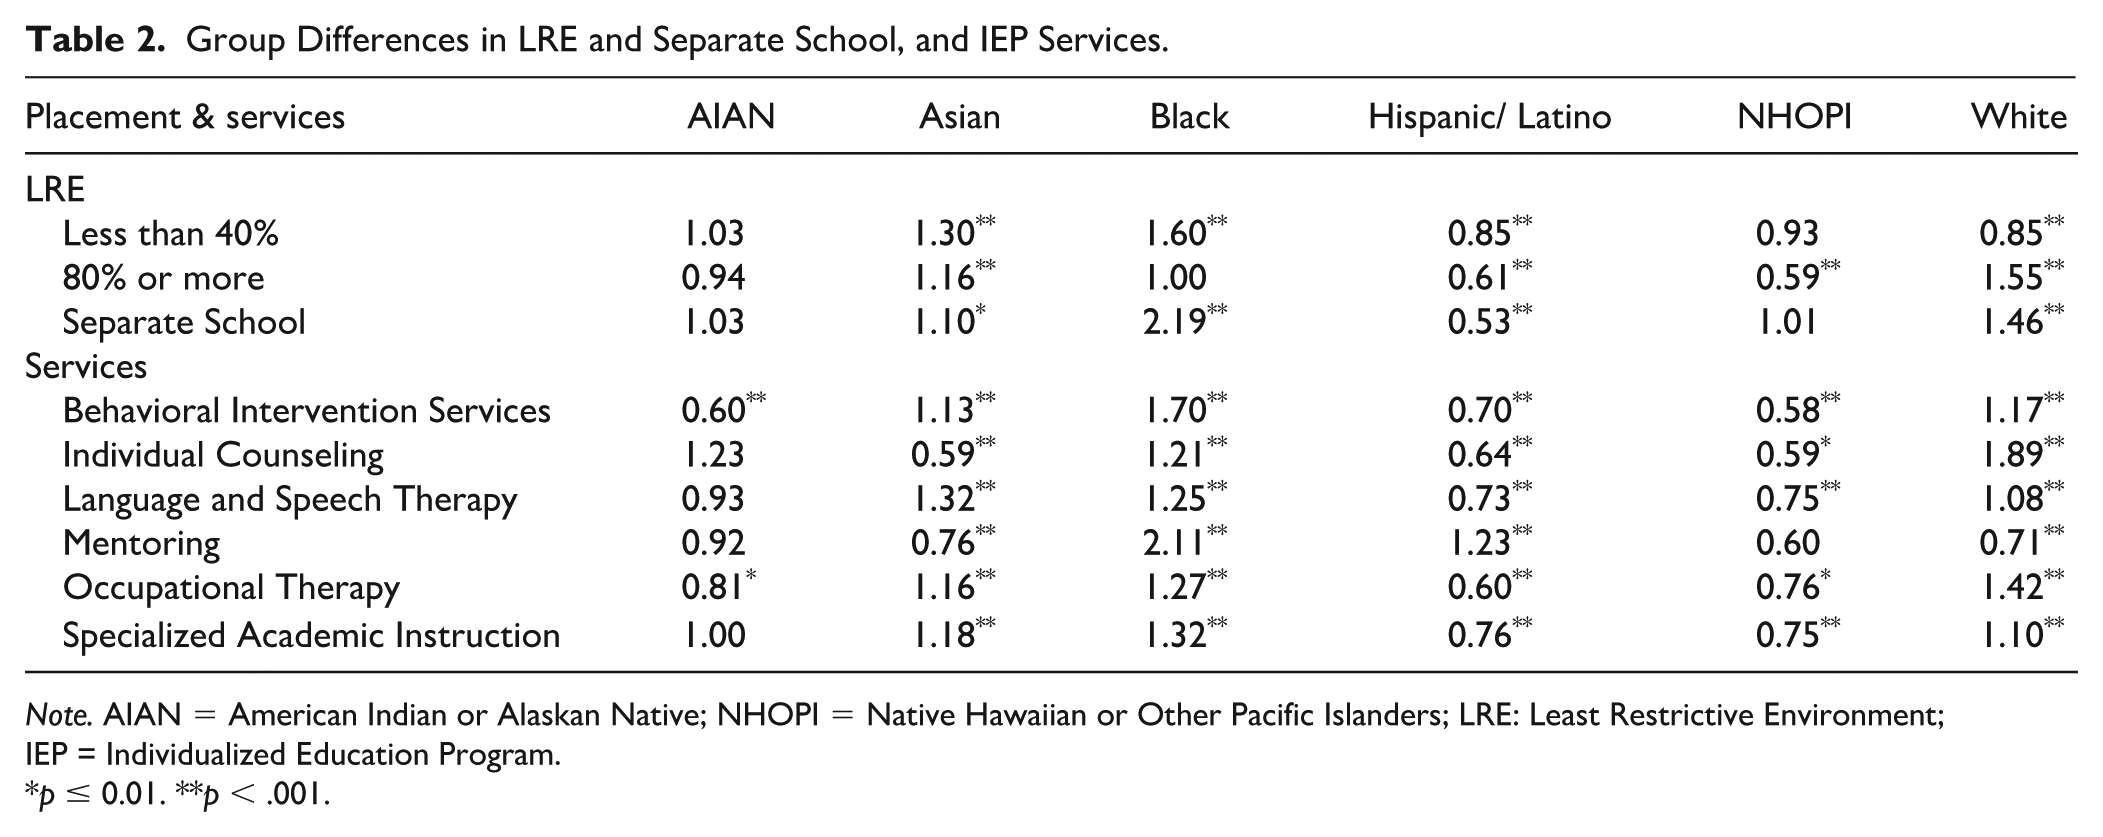
Note. AIAN = American Indian or Alaskan Native; NHOPI = Native Hawaiian or Other Pacific Islanders; LRE: Least Restrictive Environment.
p ≤ 0.01. **p < .001.
Follow-up RR analyses examined potential differences in LRE and separate school placements by age groups (i.e., 6-12, 13-19, and greater than 19 years of age). The results indicated that the likelihoods were similar across age groups. That is, Black students with autism were less likely than other racial and ethnic groups to be placed in general education classrooms and more likely to be in separate schools across all age groups than other racial and ethnic groups.
Individualized Education Program Services
Group differences in services, as identified in the IEP, were examined for the sample of autistic students across six IEP services. Black students were more likely to have each of the six services included in their IEPs than others (p < .001). Asian students were more likely to have behavior services (RR=1.13, 95% CI = [1.08, 1.18]), occupational therapy (RR = 1.16, 95% CI = [1.13, 1.20]), language and speech therapy (RR= 1.32, 95% CI = [1.30, 1.35]), and specialized academic instruction (RR=1.18, 95% CI = [1.16, 1.20]) included in their IEPs than other groups, although less likely to have mentoring or individual counseling (p < .001). Hispanic/Latino students were more likely to have mentoring (RR = 1.23, 95% CI = [1.16, 1.30]) than other groups, while White students were more likely to have individual counseling (RR = 1.89, 95% CI = [1.81, 1.98]) in addition to all other services (p<.001) other than mentoring (RR = .71, 95% CI = [0.66, 0.76]). Overall, the under-representation in NHOPI students was evident in all six educational services compared with their peers, although mentoring was not significantly different than other groups (RR = 0.60, 95% CI = [0.35, 1.04]). Underrepresentation in Hispanic/Latino students was seen in five out of the six services examined. See Table 2.
Aim 3. Autism Identification in California From SY2008 to SY2018
To evaluate potential changes in autism identification over time, risk ratios were examined and compared across three school years (SY): 2008/2009, 2013/2014, and 2018/2019. In SY2008/2009, White students were twice as likely to be identified with autism (RR = 2.0, 95% CI = [1.96, 2.03]), while Hispanic/Latino were less likely to be identified (RR = 0.50, 95% CI = [0.49, 0.50]) than other students. The RR in autism identification was 1.48 versus 0.59 in White and Hispanic/Latino students in SY2013/2014, and 1.17 vs. 0.71 in SY2018/2019. The RRs in all groups, except in White students, have increased over the years (Black students from RR = 1.13 in SY2008/2009 to RR = 1.28 in SY2018/2019; NHOPI students from RR = 0.68 to RR = 0.75; AIAN students from RR = 0.74 to RR = 0.94; Asian students from RR = 1.00 to RR = 1.24). See Table 3 and Figure 1.
Autism Identification in California From 2008 to 2018.
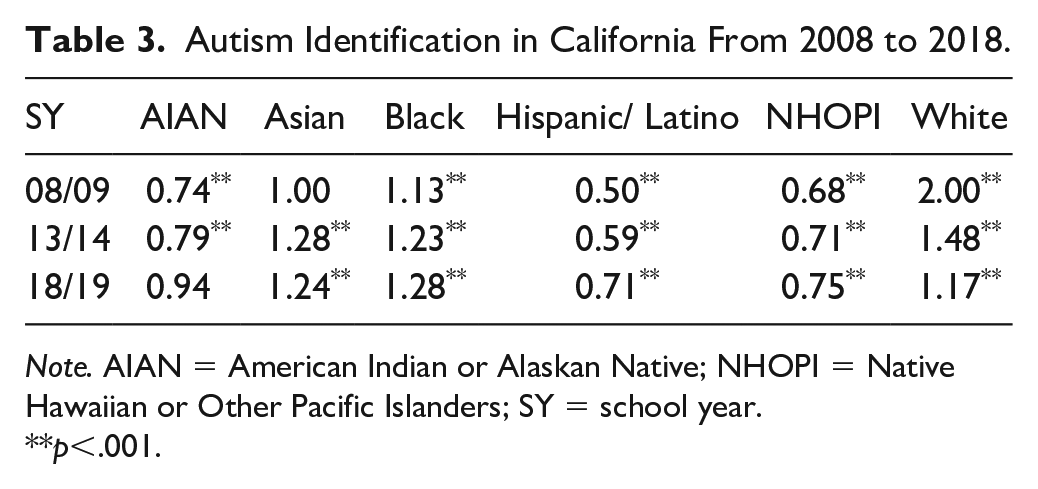
Note. AIAN = American Indian or Alaskan Native; NHOPI = Native Hawaiian or Other Pacific Islanders; SY = school year.
p<.001.
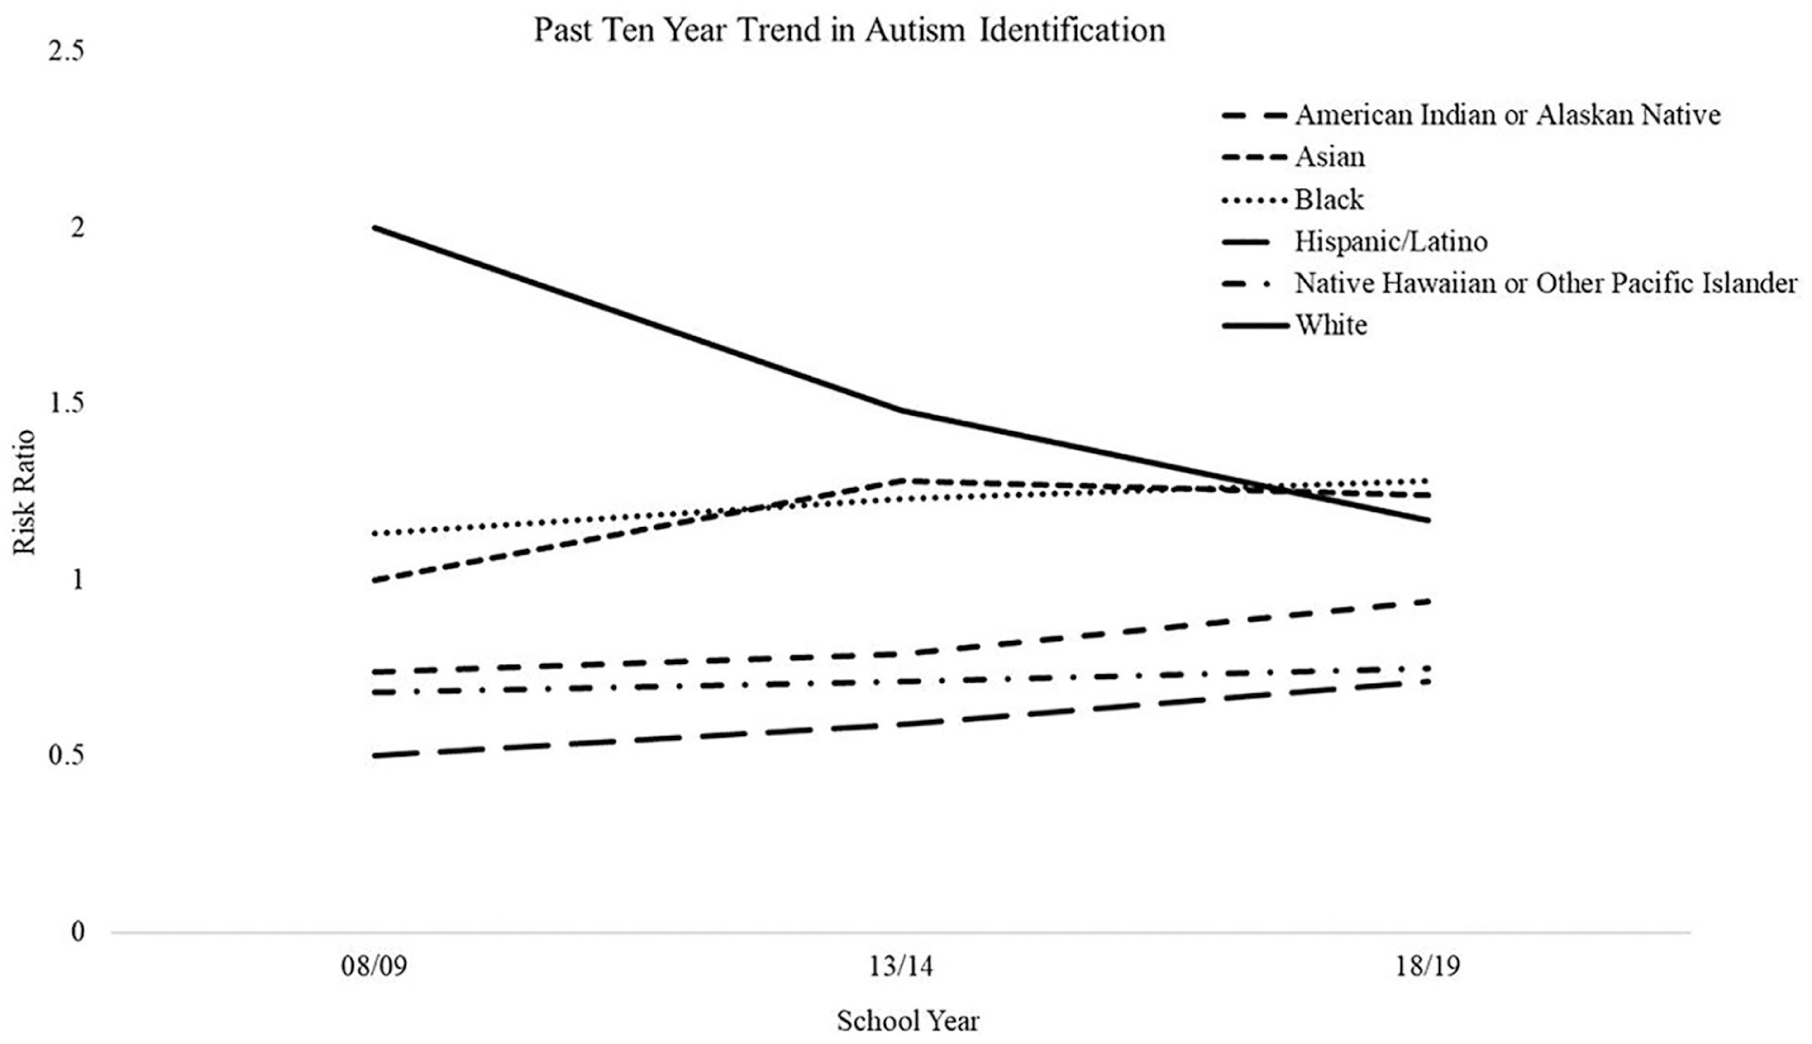
Autism Identification in California from 2008 to 2018.
Discussion
The education system is the primary provider of intervention services for autistic students. Mis- or under-identification of autism may lead to a lack of access to needed services and necessary accommodations to access the general education curriculum, which can in turn affect student outcomes. The present study investigated racial and ethnic disparities in autism identification and service provision within the California special education system. The findings shed light on the complex issue of disproportionality, indicating changes over time and areas for targeted improvement.
The findings are in line with previous research identifying disparities in autism identification and services for different racial and ethnic groups (e.g., Morgan et al., 2017). Our findings reaffirm that White students are more likely to be identified with autism than other students, and Hispanic/Latino students are less likely. Data from the current study indicates some improvement has been made over the last decade, but Hispanic/Latino students remain underrepresented in California school services despite the reduced group differences in the most recent national autism prevalence report (Maenner et al., 2023). A clinical diagnosis of autism or health evaluations for autism have been shown to impact special education eligibility decisions (Esler et al., 2023; Pettygrove et al., 2013; Young et al., 2024). With the narrowed gap in surveillance tracking in recent years, group differences in educational diagnosis may also decrease in the coming years. However, other factors discussed below also impact disparities in school-based autism identification. Future studies are needed to reduce disparities in the identification of Hispanic students in California schools given the high Hispanic population in California.
The decrease in overrepresentation in White students has been reported in other studies (Maenner et al., 2023). Multiple factors may have contributed to the improvement, including years of research, major reviews by the National Research Council in 2002, and changes in legislation and related regulations, which helped shape the requirement for data collection and monitoring (Albrecht et al., 2012). For example, Individual with Disabilities Education Act (IDEA) of 1997 introduced the concept of significant disproportionality and started the requirement of monitoring significant disproportionality in states. IDEA of 2004 made monitoring a priority, and interventions became mandatory when significant disproportionality was found in LEAs (i.e., reserving 15% of total preschool and school-age IDEA funds for CEIS; IDEA, 2004). Additionally, cultural responsivity training has been associated with changes in self-reflection, practice, attitude, and perceptions of students from diverse backgrounds (Devereaux et al., 2010; Hoover et al., 2018). Therefore, increased awareness and training for teachers and other service providers may also have contributed to the improvement. Nevertheless, continued work is needed as Hispanic/Latino and Native Hawaiian or Other Pacific Islanders remain underrepresented.
At a state level, this study did not find risk ratios of 3.0 or more for any specific racial and ethnic group, which is the state’s definition of significant disproportionality. This suggests improvement at the state level from prior timepoints. Nevertheless, it is important to note that the disparity threshold of 3.0 in California is quite high. Significant disproportionality may still exist even though the threshold for reporting special education compliance has not been met. Although we did not identify disproportionality at the state level, Luelmo and colleagues (2022) reported significant disproportionality in SY2018/2019 in White students with autism in 7 districts, all of which were in rural communities. One district had a large discrepancy in risk ratios between White and Hispanic/Latino students (5.49 vs. 0.22; Luelmo et al., 2022). Exploring disproportionality at local levels helps uncover root causes leading to differences in identification and access to services and leads to targeted interventions to increase equity. This also provides an opportunity to explore strategies that have decreased disproportionality in successful districts, whereas examining at the state level provides an overall picture of general trends in change and provides value for overall progress. For example, in California, districts needing improvement are asked to evaluate the area in need of improvement further and develop a plan submitted to the California Department of Education. Compliance and improvement monitoring continue until the data indicates that the LEA is no longer out of compliance with the identified indicator. Future research on strategy usage for LEAs that move out of “significant disproportionality” is warranted.
In terms of educational placement, we found that Black students were disproportionately more likely to be in separate settings. This is consistent with the literature suggesting Black autistic students have received disparate services. As compared with their White peers, Black and Native American students have higher rates of placement in more restrictive (self-contained) educational settings and identification as having emotional and behavioral disorders or intellectual disability (Coutinho & Oswald, 2000; Snyder & Dillow, 2015). Recent studies also found that Black students with disabilities are less likely to spend time in general education settings than White students, regardless of income status (Cooc, 2022; Grindal et al., 2019) and disability type (Cooc, 2022). These disparities are striking and suggest ongoing bias and inequity in access to educational opportunities for Black students with disabilities. Inclusion in general education classrooms is the legal right of students with disabilities (IDEA, 2004), however, students from minoritized backgrounds, and specifically Black students, continue to be disproportionately segregated from their non-disabled peers. This is certainly an issue of racial, disability, and educational justice that commands additional research and policy work. Inclusive practices also benefit all students, including those with and without disabilities (Nilholm, 2021; Odom et al., 2011).
Research on racial disparity in special education services is scarce. We found in this study that while there have been improvements in autism identification over time, there are still challenges in service access. Native Hawaiian or Other Pacific Islander students were less likely to have all services that we reviewed listed in their IEP compared with their peers. Hispanic/Latino students were less likely to receive five out of the six services examined. Although services listed in an IEP are usually based on student needs and their goals, we would expect that all races and ethnicities will be equally impacted by these factors. Nevertheless, these two groups of students were consistently under-represented in a large proportion of the services, three of which were top services received by autistic students (Wei et al., 2014). The disproportionality in educational services identified in IEPs has also been reported in other studies. In general, non-White students with autism receive fewer special education services compared with their White peers (Sturm et al., 2021), and Hispanic/Latino students receive the fewest special education services (Sturm et al., 2021). Hispanic/Latino students with autism receive lower rates of school-based physical therapy (Bilaver & Havlicek, 2019), occupational therapy (Bilaver & Havlicek, 2019; Irwin et al., 2022), and speech and language therapy (Irwin et al., 2022) than White peers. Our study is the first to suggest education service disparity in Native Hawaiian or Other Pacific Islander (NHOPI) students with autism and further adds to the scarce literature on service disparities in the education system. The population size of this group was small compared with other groups, which may have impacted the RR analysis; however, it is possible that there are true group differences between the NHOPI and other racial groups. Future studies are needed to replicate and to understand the reasons behind the group differences in special education service receipt.
Group differences in identification, placement, ands services might be driven by multiple factors. For example, Young et al. (2024) found that behavioral characteristics, level of impairment, presence of a clinical autism diagnosis, and a diagnosis of intellectual disability contributed to disproportionality in autism identification. Children without clinical autism or intellectual disability diagnosis or with other co-occurring clinical diagnoses were less likely to receive an educational autism diagnosis. However, these children were also more likely to have a less comprehensive evaluation which may be a result of systemic disparities. Furthermore, traditionally marginalized children were less likely to have any mention of autism concern in their records compared with their White peers (Young et al., 2024). Other systemic, child, and caregiver factors also contribute to the differences, including community poverty (Burton et al., 2017; Cruz & Rodl, 2018), living in rural settings (Kim et al., 2021), gaps in curriculum and instruction implementation, inconsistent pre-referral processes, educators’ limited beliefs in student ability (Fergus, 2010), potential implicit biases, lack of cultural consideration (Golson et al., 2022), barriers in navigating the special education system for families with autistic children (Luelmo et al., 2022), academic achievement (Farkas et al., 2020), and caregivers’ challenges in advocating for inclusive placement (Howard et al., 2021). For example, Luelmo et al. (2022) found a discrepancy in navigating the special education system in Spanish- and English-speaking caregivers, in which the former were less likely to identify initial signs of any disability and more likely to rely on teachers to identify a disability. English learner status may impact timely diagnosis or eligibility determination (Hibel & Jasper, 2012). Schools may take a wait-and-see approach and hope to differentiate language barrier issues versus disability as students’ English improves, which may delay the determination of eligibility for special education and, in turn, needed services. Caregivers who are more educated, have higher income, or have more social connections may be more likely to advocate for their child 1; Magaña et al., 2013; Sturm et al., 2021); however, the burden should not fall completely on caregivers.
Additional support should be provided to help caregivers navigate and advocate for their child.
Limitations
As with many other studies examining potential racial and ethnic group differences, this study has several limitations. The results reported in this study were primarily descriptive.
Although it is typical for studies in this area, we were not able to conduct detailed, fine-grained analyses (e.g., statistically compare risk ratios across years or assess potential confounding variables) given the limited public access to district, school, and student-level data. Therefore, we cannot make definitive statements regarding disproportionality by race and ethnicity.
Additionally, the identification and services labels may not be defined, interpreted, or assessed in the same way across districts, schools, or states. This limits the generalizability of the findings; however, California has a large diversity of districts and schools. Additionally, RR analyses tend to be less stable with small sample sizes (Cooc, 2018), and some racial and ethnic groups have larger sample sizes than others. This may limit the accurate interpretation of our findings. The data analyzed in this study relied on population data reported by the Department of Education for state and federal reporting purposes. As a result, we have no control over data collection and are limited to exploring more depth and specific analyses and cannot verify data accuracy.
Implications and Future Directions
Correct educational identification matters because of its implication for quality individualized educational program (IEP) development to identify appropriate services and goals. For autistic students, implementing a quality IEP that includes measurable goals strongly predicts student functional outcomes (Ruble & McGrew, 2013). The disparities in service provision have significant implications for educational equity and the well-being of autistic students. Addressing these issues requires a multifaceted approach at both the policy and the practice levels. Importantly, findings of persistent disparities may shed light on possible root causes of disproportionality that need to be addressed at the system level, especially in Hispanic/Latino students. Future studies are needed to examine factors impacting the group differences (e.g., understanding cultural norms, diagnostic evaluation tools, implicit biases, lack of multitiered systems of support, and lack of adequate English Learner support and instruction; Luelmo et al., 2022; Tek & Landa, 2012) and explore how multiple intersectional identities, such as race, ethnicity, gender, and socioeconomic status, intersect to influence disparities in autism identification and services. State education agencies should continue monitoring disproportionality using RR analyses and other relevant metrics (e.g., suspension rates, family and teacher interviews, and record reviews). Timely and accurate data collection is essential for identifying and addressing disparities so they can be adequately addressed and to determine whether initiatives to reduce disparities work. Future studies should investigate how local factors, such as community demographics, school resources, and geographic location, contribute to disparities in autism identification and service provision. Although increased awareness and training for teachers and other service providers may have contributed to the improvement in racial disparity, continued work is needed as Hispanic/Latino and Native Hawaiian or Other Pacific Islanders remain underrepresented (Devereaux et al., 2010; Hoover et al., 2018). State- and district-level administrators should take actions to diversify the workforce (Kim et al., 2025). School personnel, including educators, administrators, and support staff, should receive ongoing training on culturally responsive practices, implicit bias, and disability awareness, and be rewarded for using culturally responsive approaches (Kim et al., 2025; Young et al., 2024). This training can promote fair assessment and appropriate service provision for all students (Truong et al., 2022), which is consistent with IDEA’s mandates of conducting fair, linguistic, and culturally sensitive evaluations.
Group differences in inclusion and service access suggest monitoring and regular reviews are needed, especially in Black, Hispanic, and Native Hawaiian or Other Pacific Islander students with autism to identify and mitigate potential biases that contribute to disparities.
Longitudinal tracking with valid measurement tools may help determine whether racial disparities improve over time (Burke et al., 2020; Cooc, 2022). This dataset did not allow us to account for variations in factors that may contribute to the racial and ethnic disparities at multiple levels (e.g., individual, family, teacher, school, or district); it will be important to identify factors at the system level (e.g., school and district), such as limited access to a comprehensive medical evaluation, that leads to disparities.
IEP teams should use culturally responsive practices when developing and implementing individualized plans. This includes involving families in the decision-making process (Burke et al., 2020; Reyes et al., 2018) and tailoring interventions to students’ cultural and linguistic backgrounds. Additional support should be provided to caregivers from marginalized backgrounds to increase their special education knowledge and empower them to navigate and advocate for their children (Burke et al., 2020).
Conclusion
The present study adds to the growing body of research highlighting disparities in autism identification and service provision in the special education system. While progress has been made in reducing some of these disparities, significant challenges persist. Addressing these disparities requires a comprehensive effort that involves policy changes, practitioner training, and ongoing research to ensure that all students, regardless of their racial and ethnic background, have equal access to appropriate services and educational opportunities.
Footnotes
Acknowledgements
We would like to thank Drs. Paul Luelmo and Danielle Harvey, and Ryan Estrellado for their consultation on this project.
Author’s Note
We use person-first and identity-first terminology interchangeably to reflect the variety of preferences of autistic individuals, self-advocates and caregivers.
Author Contributions
Y.Y., P.S., M.M., J.S., and A.S. contributed to the study conception and design. Material preparation, data extraction and analyses were performed by Y.Y. and J.H. The first draft of the manuscript was written by Y.Y. and M.M. All authors commented on previous versions of the manuscript. All authors read and approved the final manuscript.
Declaration of Conflicting Interests
The author(s) declared no potential conflicts of interest with respect to the research, authorship, and/or publication of this article.
Funding
This project was funded by the Institute for Education Sciences grant R324A170063. and by the Health Resources and Services Administration (HRSA) of the U.S. Department of Health and Human Services (HHS) under grant number 1T73MC30113-01-00.