
Abstract
Using U.S. state-level data, we report unadjusted and adjusted odds ratio of special education (SPED) trends in Tennessee from 2009 to 2019 for students in Grades 3 to 8 by three language groups: native English speakers (NES), English-proficient bilinguals (EPB), and Current English learners (Current EL). We report trends across all SPED disability categories and across five prevalent disability categories (specific learning disability, specific language impairment, intellectual disability, other health impairments, and autism). The cross-sectional analytic sample included 812,783 students from 28 districts that met the SPED risk ratio threshold set by the state. Results revealed that, compared with NES students, both EPB and Current EL students were generally less likely to receive SPED services, suggesting evidence of language status disparities in SPED representation. Furthermore, findings varied depending on whether adjustments were made to generate odds ratios, especially for higher-incidence disabilities (specific learning disability, specific language impairment, and intellectual disability). Finally, the most severe evidence of underrepresentation was in lower-incidence disabilities (other health impairments and autism). Our results underscore the need for further examination into low rates of SPED identification among learners whose first language is not English (EPB and Current EL). We discuss the contextualized research, practice, and policy implications of our findings.
Keywords
English learners (ELs) represent roughly 10% of the U.S. school-age population, but 15% of ELs are served under the Individuals with Disabilities Education Act (IDEA; Irwin et al., 2021), although ELs’ rates of special education (SPED) identification vary by state (Office of English Language Acquisition [OELA], 2021). Mirroring findings on disparities in SPED representation of racial and ethnic minority students in the United States (e.g., Constantino et al., 2020; Cruz & Firestone, 2022), the growing body of research anchored NELB students in the United States are similarly mixed and contentious: Studies report overrepresentation, underrepresentation, and shifting representation (e.g., Morgan et al., 2015; Skiba et al., 2016; Sullivan, 2011). A contributing factor to the contentious landscape centers on methodology, namely, on whether unadjusted (i.e., not accounting for covariates, such as gender, student-level achievement) or adjusted (i.e., accounting for covariates) analytic approaches are applied to generate the resultant SPED ratios for determining disproportionality. Special education identification disparities affect students’ likelihood of educational success compared to their peers (Counts et al., 2018; NASEM, 2017), so a pressing question is whether SPED identification rates vary across language groups, particularly in the American South that has not historically educated large numbers of NELB students. In Tennessee, for example, Current ELs are less likely to be identified for SPED compared to their English-proficient peers (Mancilla-Martinez et al., 2022; OELA, 2021). Like other states in the American South, Tennessee is a “new immigrant destination state,” given the unprecedented growth of NELB students in general and Current ELs in particular over the past years (Noe-Bustamante et al., 2020). To examine trends in the intersection of SPED and language status in a new destination state, we compared unadjusted and adjusted SPED odds ratios using existing Tennessee state-level data (N = 812,783) across a 10-year span (2009–2019). The overarching goal of this study is to contribute contextualized insight at the state level that informs policy and practice recommendations to ensure students from all language backgrounds receive the educational support they need and are entitled to.
Significant Disproportionality in SPED
The 2016 Equity Regulations under the IDEA require that all states adopt a standard approach to identify significant disproportionality (i.e., unequal SPED identification by racial and ethnic background). Prior to the requirement prescribed by the IDEA Equity Regulations, states used a wide variety of approaches, complicating both within and across state comparisons (Office of Special Education Programs [OSEP], 2017; O’Hara & Bollmer, 2021). States must now set a threshold above which disproportionality is determined. In Tennessee, disproportionality is calculated with a minimum cell size of 10 (i.e., a minimum of 10 students identified for SPED by racial or ethnic group) and a minimum “N” size of 30 (i.e., a minimum of 30 students in total by racial or ethnic group) for the resultant unadjusted risk ratios. Unadjusted risk ratios are used by states for annual determinations of disproportionality in terms of student race or ethnicity. Unadjusted risk ratios are calculated by dividing the risk of a particular outcome (SPED identification) for children in one racial or ethnic group by the risk of that same outcome (SPED identification) for children in all other racial or ethnic groups, without accounting for covariates (e.g., student-level achievement) that may relate to SPED identification (OSEP, 2017). An unadjusted risk ratio of 1.0 indicates no difference between the groups (i.e., proportional representation) while unadjusted risk ratios >1.0 indicate a higher likelihood of one group being identified for SPED (i.e., disproportional representation). If significant disproportionality is found according to criteria set by the state, local education agencies (LEAs) must identify and address the root cause(s). In Tennessee, disproportionality is determined when a student group experiences a risk ratio above 3.0 for three consecutive years.
Under federal regulations, unadjusted risk ratios represent the standard methodology states use to identify and report significant disproportionality (OSEP, 2017). States may use a method other than the unadjusted risk ratios (e.g., adjusted odds ratios), but only for internal information, evaluation, or assessment because unadjusted risk ratios are officially used for accountability purposes. Adjusted analyses aim to provide insight into whether similarly situated students (e.g., similar student-level academic achievement) who differ in race or ethnicity, for example, are differentially represented in SPED. Academic achievement is perhaps the most common covariate in adjusted analyses as academic achievement gaps are largely reported to explain the overrepresentation of racial and ethnic minority students (Farkas et al., 2020; Shifrer, 2018). Low-income status is also associated with compromised academic achievement (Duncan & Hoynes, 2021), and income status varies by race or ethnicity, with Latino students representing the largest share of students living in poverty (Guzman et al., 2021). Other factors include grade status, gender, and chronic absenteeism. Grade level has emerged as a factor related to SPED identification patterns (Samson & Lesaux, 2009; Yamasaki & Luk, 2018), gender (reported by a parent or guardian at enrollment) has been reported to be differentially associated with SPED identification (Coutinho et al., 2002), and students who have high rates of absenteeism (Sullivan & Bal, 2013) or inconsistent attendance (Sprick et al., 2020) tend to have a greater likelihood of SPED identification. Thus, examining whether such factors relate to SPED identification by language background seems reasonable.
Special education disproportionality research has concentrated on the overrepresentation of racial or ethnic minority students (e.g., Farkas et al., 2020). Although current IDEA guidance defines significant disproportionality on the basis of whether a LEA exceeds (i.e., overrepresentation) a risk ratio threshold set by the state [34 C.F.R. § 300.647], the central issue is misrepresentation (Morgan et al., 2017, 2020; NASEM, 2017; U.S. Department of Education [USDE], 2016). Yet, the Equity Regulations in IDEA only establish a system for identifying significant disproportionality in terms of overrepresentation (OSEP, 2017). This is concerning as all students should receive the instructional services that match their educational needs. Despite the lack of guidance, underrepresentation (e.g., (Morgan et al., 2015, 2017; Sullivan & Bal, 2013) and a shift from underrepresentation in the (pre)primary grades to overrepresentation in the upper elementary and middle grades has been reported (Hibel & Jasper, 2012; Samson & Lesaux, 2009; Yamasaki & Luk, 2018).
Significant Disproportionality by Language Status
With considerable equity implications, English language assessments in schools are used as screeners to identify students who have yet to develop grade-appropriate academic English language skills. In sharp contrast to students whose parents report that only English is spoken in the home (i.e., NES students), English language proficiency is assumed to be inadequate for students whose parents report they speak a language other than English at home. Non-English language background students must pass an academic English language screener at school entry that varies across districts and states, with about 5 million students formally identified by their schools as Current ELs (Irwin et al., 2021). In contrast to the intent of the provision of EL support services, Current ELs often face a cycle of suboptimal instruction in English and academic subjects (Murphy & Torff, 2019). This poses serious equity concerns as a less rigorous curriculum may lead to long-term disservice to Current ELs, from decreased likelihood of reclassification as English-proficient to diminished academic performance. While the sociodemographic characteristics of Current EL students in the United States are heterogeneous and diversity is only increasing, the vast majority of Current ELs are U.S.-born, U.S. citizens (Park et al., 2018). Current ELs deserve quality education like their English-proficient peers. Further, English is the primary language of formal instruction for most Current ELs. It is thus worrisome that many Current ELs do not develop the necessary English language skills that qualify them for reclassification as English-proficient even after several years of English language schooling in the United States.
The American South region of the United States has experienced unprecedented growth in the population of school-age NELB students in the past decade (Irwin et al., 2021), raising concerns over the extent to which demographic shifts in the school-age population have outpaced the development of education infrastructure to accommodate linguistic differences (Lowenhaupt & Reeves, 2015). In Tennessee, during the 2018–2019 school year, 13% of the total Current EL population and 41% of Grades 6 to 12 Current EL population were long-term ELs, meaning Current ELs who are not reclassified as English-proficient after 6 years of formal schooling (Tennessee Department of Education [TDOE], 2018f). There is also evidence that nearly half of the long-term ELs in the nation are dually identified with learning disabilities (Wise et al., 2010).
To gain more nuanced insight into disparities in SPED identification, researchers underscore the need for contextualized investigations at the local level (Guiberson, 2009; Skiba et al., 2016). Across states, wide variation has been reported in disproportionality (Welner & Skiba, 2016), with the American South emerging as a region in which further research is particularly warranted. One of the few studies to date that lends insight into the question of racial disparities in SPED identification in the American South is that of Morgan and colleagues (2020). Drawing on National Assessment of Education Progress (NAEP) data from 2003 and 2015 targeting 11 states in the American South, Morgan et al. found evidence of underrepresentation, whether analyses were unadjusted or adjusted for potential confounds. This study was not focused on NELB students, but Morgan et al. found overidentification of ELs using the 2003 data and, in contrast, under identification of ELs using the 2015 data. Given that linguistic diversity co-occurs with race and ethnicity in the United States and is rapidly increasing (OELA, 2020), an organic next step is to specifically investigate trends in SPED identification by language status and not just Current ELs. English-proficient bilingual students are also from homes in which a language other than English is used, despite being English-proficient. Yet, little is known about this population’s representation in SPED, and even less is known about NELB students’ rates of SPED identification in prevalent disability categories.
Higher-Incidence Disabilities
Given their language-based nature, specific learning disability (SLD) and speech or language impairment (SLI) tend to be the two most common higher-incidence categories for which Current ELs are identified. Specific learning disability includes a wide range of conditions, such as perceptual disabilities, brain injury, reading difficulties, and dyslexia (20 U.S.C. § 1401). Speech or language impairment also includes a wide range of conditions, such as a communication disorder (e.g., stuttering, impaired articulation, IDEA, Part B § 300.8(c)(11)). But exclusionary factors, like environmental, cultural, or economic disadvantage, as well as limited English proficiency, should not be identified as the primary cause of a student’s learning difficulties, given the disproportionate identification, placement, and discipline rates of students of color in special education (Whittaker & Ortiz, 2019). Indeed, language difference (i.e., language development patterns that differ from those of English monolinguals but expected in bilingually developing children) should be differentiated from language disabilities (i.e., special needs that require clinical, explicit, and systematic support) to ensure students receive the appropriate instructional supports (Barrera, 2006; Klingner et al., 2006). However, this continues to be a significant challenge (Stutzman & Lowenhaupt, 2020), with studies underscoring the subjective nature of identifying language-based disability categories (Counts et al., 2018; Hibel & Jasper, 2012) and showing that Current ELs may be especially likely to be identified with SLD and SLI compared with their English-proficient peers (OELA, 2020).
Lower-Incidence Disabilities
A growing number of studies have examined NELB students’ representation in lower-incidence disabilities that affect a student’s learning and may qualify them for SPED, such as intellectual disability (ID), other health impairments (OHI), and autism (e.g., Santi et al., 2019). Intellectual disability refers to significantly sub-average general intellectual functioning (IDEA, Part B § 300.8(c)(6)). Other health impairment refers to limited alertness with respect to the educational environment stemming from chronic or acute health problems that adversely affect a child’s educational performance (IDEA, Part B § 300.8(c)(9)). This category is broad and includes both prevalent conditions, such as attention-deficit/hyperactivity disorder (ADHD), and more specific conditions, such as Tourette syndrome. Finally, autism refers to a developmental disability significantly affecting verbal and nonverbal communication and social interaction, typically evident before age 3, which adversely affects a child’s educational performance (IDEA, Part B § 300.8(c)(1)). Studies reveal little evidence of disproportionality of NELB students in ID (Morgan et al., 2015; Sullivan, 2011; Trainor et al., 2016). However, overrepresentation from a discrepancy between the language of instruction and the language of assessment has been reported (Santi et al., 2019). For OHI and autism, research to date points to underrepresentation of NELB students (Trainor et al., 2016).
Lower-incidence disabilities typically require a medical assessment for diagnosis (Dragoo, 2020; Hyman et al., 2020; McNicholas et al., 2018), but it is important to distinguish between a medical diagnosis that may require medical treatment and an educational determination that may qualify a student for SPED. Even with a medical diagnosis, an educational evaluation must be conducted by a school psychologist to qualify for SPED. Educational eligibility for SPED under lower-incidence disabilities can arguably be considered neutral to students’ language background. If such language-related differences occur in identification, it may be interpreted as limited health care access experienced by language and racial minorities (Parish et al., 2012; Toomey et al., 2013) or as stemming from the dearth of bilingual school psychologists who can conduct educational evaluations using valid and reliable assessments designed for NELB students (National Association of School Psychologists, 2015). Of concern, compared to their White, English-proficient peers, Latino Current ELs tend to be less likely to be diagnosed with lower-incidence categories (Trainor et al., 2016).
Present Study
This study examines potential disparities in SPED identification by language status in Tennessee, a Southern American state that has experienced rapid growth in NELB school-age students. Our state-level analysis aims to contextualize findings that can inform policy and practice to equitably meet the educational needs of NELB students. We ask: What are the SPED unadjusted compared to adjusted odds ratios across a 10-year span (2009–2019) in Tennessee by language status (NES, EPB, and Current EL) across (a) all SPED categories and (b) five prevalent disability categories (i.e., SLD, SLI, ID, OHI, and autism)? Our results have implications for other states experiencing similarly unprecedented growth in the NELB school-age population.
Method
Data
This study used existing Tennessee state-level data collected annually by the Tennessee Department of Education (TDOE) and used a repeated cross-sectional design. Data were made available through the Tennessee Education Research Alliance. This cross-sectional study used student-level data from 2009 to 2019 for students in Grades 3 to 8 grouped by language status: NES, EPB, and Current EL. The NES students are those with English as their only reported home language. English-proficient bilinguals and Current ELs are both from non-English language backgrounds (NELB). English-proficient bilinguals are those who were either (a) already English-proficient at school entry or (b) former ELs who have exited EL services after attaining English proficiency. Current ELs are those actively receiving EL services in their schools (see Supplemental Material concerning Waived ELs).
The analytic sample across all academic years included 812,783 students, with an average of 285,900 students per year (SD = 6,387; see Table 1 for the total number of students by language status in each school year) from 28 school districts that met the risk ratio threshold set by the state: minimum of 10 students identified for SPED by language status and a minimum of 30 students by language status (TDOE, 2018b). English-proficient bilinguals and Current ELs in our sample represented the vast majority (87%) of all EPBs and Current ELs in Tennessee. Also, the majority of EPBs and Current ELs in our analytic sample (73%) were U.S.-born, similar to the national profile of NELB students (Park et al., 2018). Finally, half of the sample (49%) were from lower-income homes (see Measures for how lower-income status was determined), with variation by language status (NES = 47%, EPB = 61%, Current EL = 67%) as is the case nationally (Park et al., 2018).
Yearly Sample Size From 2009–2010 to 2018–2019.
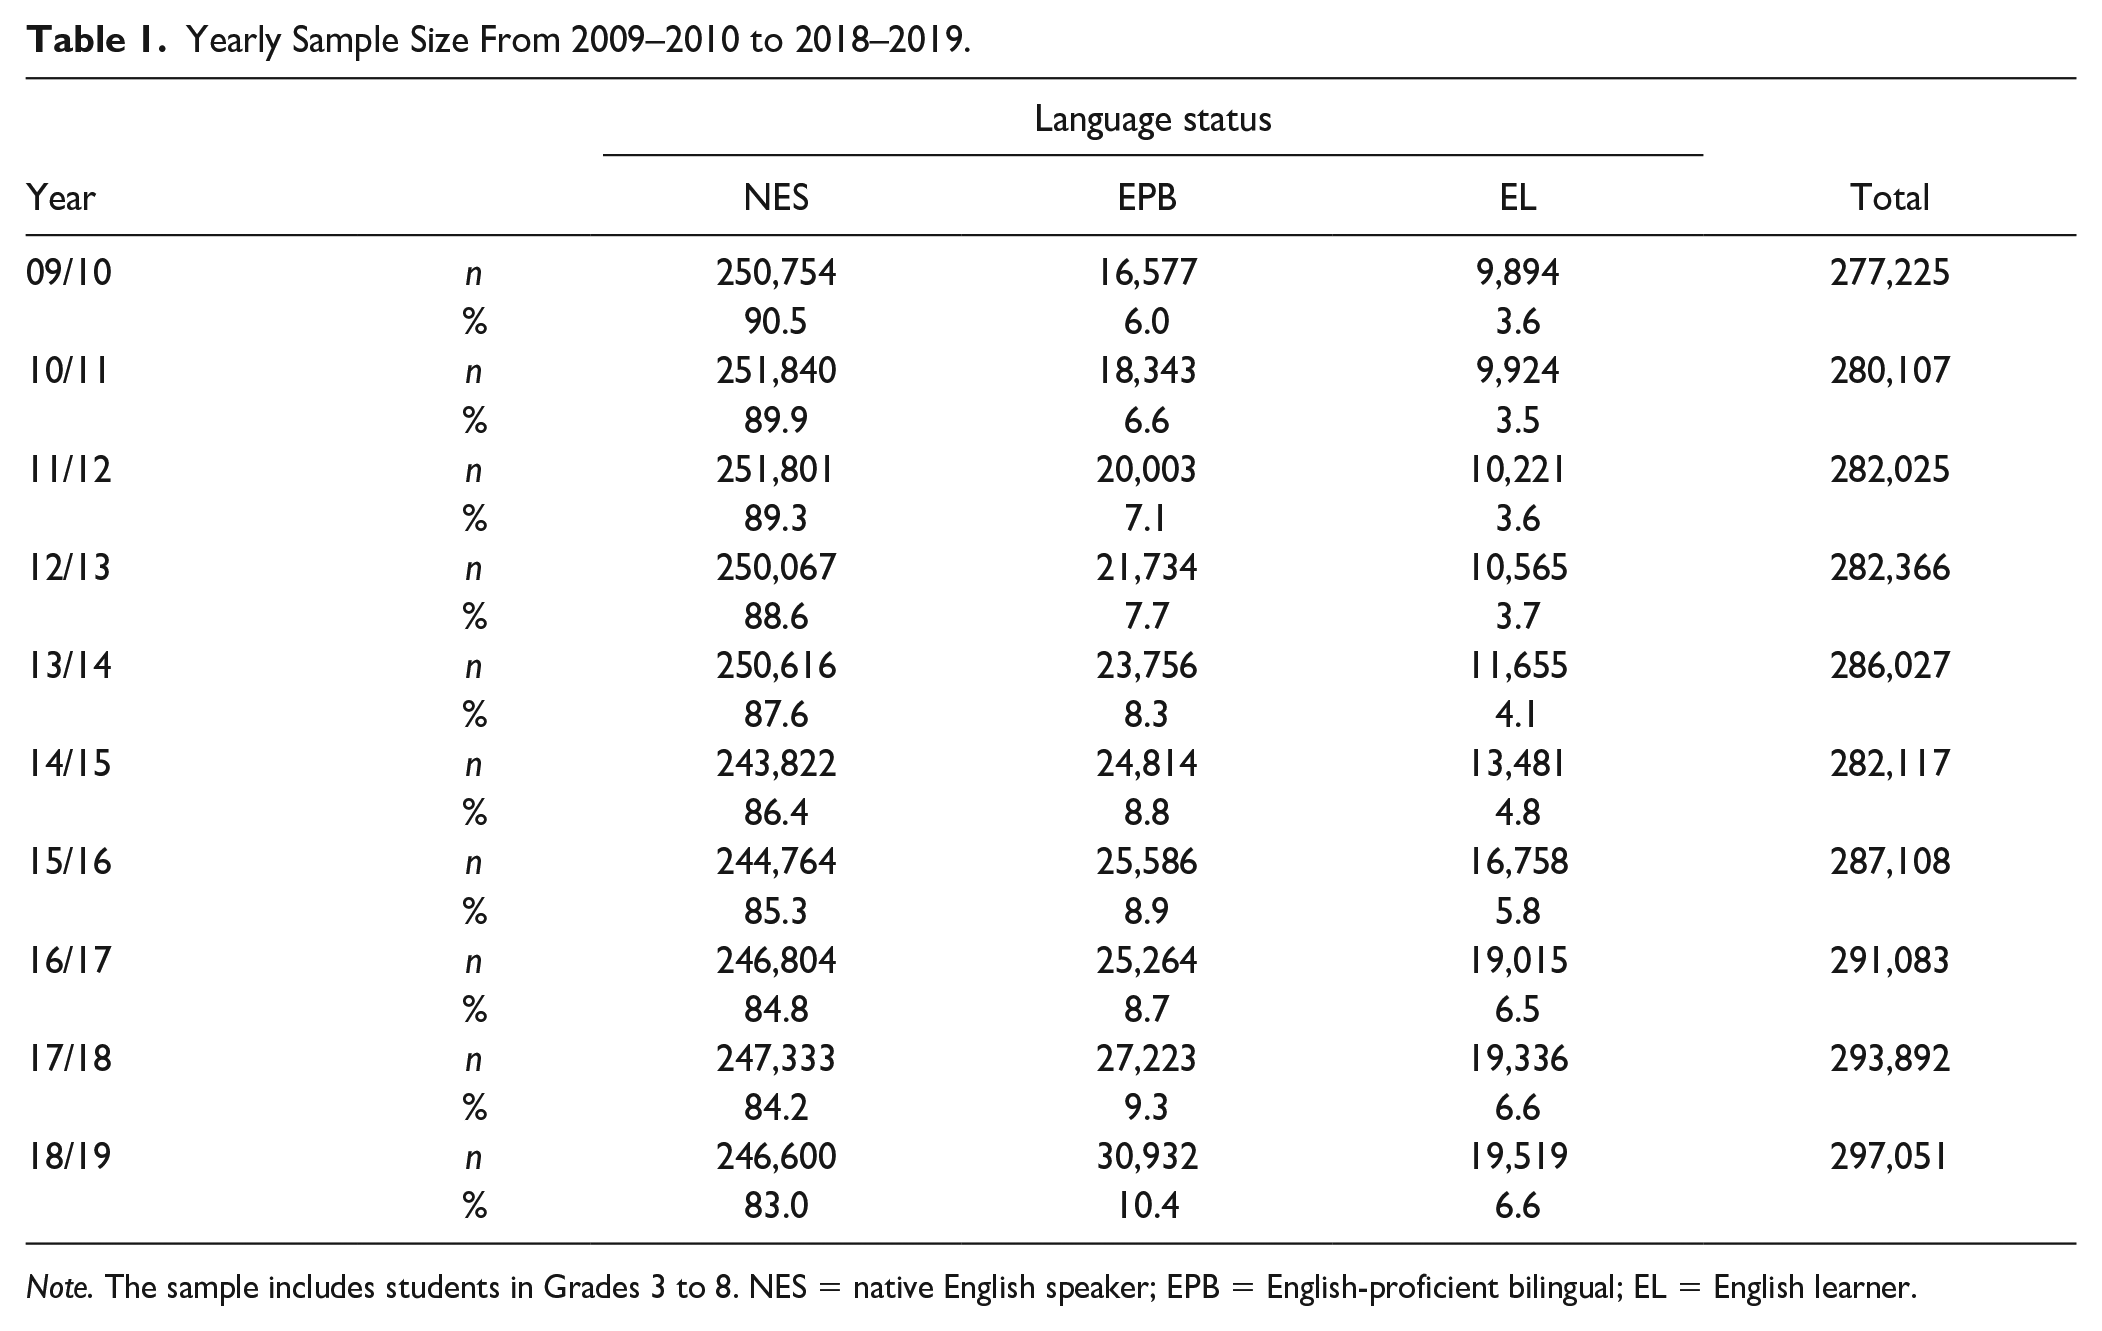
Note. The sample includes students in Grades 3 to 8. NES = native English speaker; EPB = English-proficient bilingual; EL = English learner.
Measures
Disability Status: Overall and Five Prevalent Categories
Students’ overall disability status, recorded by school personnel (e.g., SPED teachers) responsible for drafting students’ Individualized Education Program, was coded as a binary indicator (1 = SPED, 0 = not SPED) as were five disability categories: SLD (1 = SLD, 0 = not SLD), SLI (1 = SLI, 0 = not SLI), OHI (1 = OHI, 0 = not OHI), ID (1 = ID, 0 = not ID), and autism (1 = autism, 0 = not autism). On average from 2009–2010 to 2018–2019, NES students included the highest proportion of SPED-eligible students (18.47%), followed by Current ELs (15.82%), and EPBs (8.82%). Additionally, Current ELs showed the highest representation in SLD (8.43%) and SLI (6.45%) and the lowest representation in ID (.99%), OHI (1.01%), and autism (.64%) compared with NES and EPB students. Our analytic sample focuses on students in Grades 3 to 8, but these rates are consistent with national trends where Current ELs tend to be more likely to be represented in language-related categories such as SLD and SLI (OSEP, 2022).
Hispanic Status
Students’ Hispanic status was identified based on their ethnicity code, for which students were required to choose either Hispanic or non-Hispanic. We selected students’ Hispanic status as a key variable of interest given that NELB students in the United States—regardless of English proficiency status—predominantly come from Spanish-speaking homes (i.e., 28% of the U.S. student population; National Center for Education Statistics, 2022). In Tennessee, approximately 13% of the total student population is Hispanic and, within the NELB student population, 73% are Hispanic as of the 2021–2022 school year. Accounting for students’ Hispanic status (1 = Hispanic, 0 = non-Hispanic) allowed us to examine whether students’ Hispanic background related to students’ likelihood of SPED placement, and whether the likelihood differed by language status within the Hispanic population (Hispanic students who are EPBs vs. Hispanic students who are Current ELs). The racial and ethnic backgrounds of the non-Hispanic group (i.e., reference group to Hispanic students; 27% of the NELB student population as of the 2021–2022 school year) included Asian, Black, Native American/Alaskan Native, Native Hawaiian/Pacific Islander, and White.
Income Status
To proxy students’ income status, we used students’ eligibility for free or reduced lunch (1 = eligible, 0 = not eligible) for academic years 2009–2017 and economically disadvantaged (ED) status for 2017–2019 (1 = ED, 0 = not ED). Beginning in 2017, Tennessee students were automatically classified as ED based on their family’s participation in public nutrition assistance programs rather than through self-reporting of household income used to qualify free or reduced lunch eligibility (TDOE, 2021).
English Reading Achievement
For the English reading achievement covariate, we used students’ Tennessee Comprehensive Assessment Program (TCAP) reading scores for 2009–2015 and TNReady reading scores for 2016–2019 as the TDOE moved from the TCAP to the TNReady assessment system in the 2015–2016 academic year (English reading achievement data for the 2015–2016 was unavailable). Both assessments assess the Tennessee Academic Standards (i.e., requiring that students demonstrate the ability to closely read and analyze text, answer text-dependent questions, and demonstrate command of the English language). However, the TCAP only included multiple-choice questions whereas the TNReady includes written responses. We generated z-scores (i.e., rescaled the mean values of reading achievement scores to be zero and the standard deviation to be 1 for each academic year for all students) for our analyses as the TCAP and TNReady scores were on different scales. The coefficient alpha reliability for TNReady (2016–2019) is reported to be 0.89 across all grade levels (3–8; TDOE, 2020). However, reliability information for TCAP (2009–2015) was unavailable.
Additional Covariates
We controlled for additional factors that may relate to SPED identification: grade status, gender, and chronic absenteeism. Given the range of grade levels in our analytic sample, we categorized students as either in elementary grades (Grades 3–5; 1 = elementary grades) or middle grades (Grades 6–8; 0 = middle grades). We also controlled for gender as reported by a student’s parent or guardian upon school enrollment, with students coded as 1 for female and 0 for male, as indicated in the Tennessee database. Finally, students with chronic absenteeism (1 = chronic absenteeism) are those who missed at least 10% of instructional days per school year, and students without chronic absenteeism (0 = no chronic absenteeism) are those who attended school for more than 90% of the school year. The 90% attendance rate cut-off is in line with Tennessee’s method of identifying chronic absenteeism (i.e., missing at least 10% of the school year; Brimm & Mumpower, 2021; TDOE, 2016).
Analytic Approach
We first prepared the cross-sectional dataset using Stata 15.1 (StataCorp, College Station, TX), where student-level sociodemographic and enrollment datasets for each year were merged to generate a final dataset for each academic year from 2009 to 2019. With the finalized datasets for each year, we conducted logistic regression analyses with SPED and disability status as the outcomes of interest, using LOGIT with the OR option to transform estimated coefficients to odds ratios (ORs). This transformation simply affects how the logistic regression results are displayed, not how they are estimated (StataCorp, 2020). To examine SPED representation odds by language status, we used Tennessee’s risk ratio threshold of 3.0 for three consecutive years before and after accounting for student-level factors. That is, while we report our findings in ORs to account for student-level covariates, we use Tennessee’s disproportionality threshold (i.e., 3.0) to make sense of each NELB subgroup’s odds of SPED placement and potential disproportionality, anchored on policy. We generated unadjusted and adjusted ORs, respectively. For overall SPED identification and across five prevalent disability categories (SLD, SLI, ID, OHI, and autism), we estimated two sets of logistic regression models by category of interest. The NES students served as the comparison group to compare results with NELB students. The first set of logistic regression models was used to generate unadjusted OR coefficients, using only language status as an explanatory variable. No other student-level factors were included in this first set of models. The second set of logistic regression models adjusted for student-level factors of interest (i.e., adjusted ORs) described earlier to determine if and how the unadjusted ORs for SPED identification differed when adjusting for student-level factors.
Results
Overall SPED Identification
Across the focal 10-year span (2009–2019), the unadjusted ORs (i.e., without covariates) by language status were relatively stable (see Figure 1). Table 2 presents the logistic regression model details by academic year, with coefficients presented as ORs. An OR of 1.0 indicates that the language group of interest (i.e., either EPB or Current EL) when compared with the reference group (i.e., NES peers), have about the same probability of being placed into SPED services. An OR greater than 1.0, in contrast, indicates that the group of interest is more likely to receive SPED services compared with their NES peers. Additionally, an OR <1.0 indicates that compared with the reference group (i.e., NES), the group of interest (i.e., either EPB or Current EL) is less likely to be represented in SPED services.
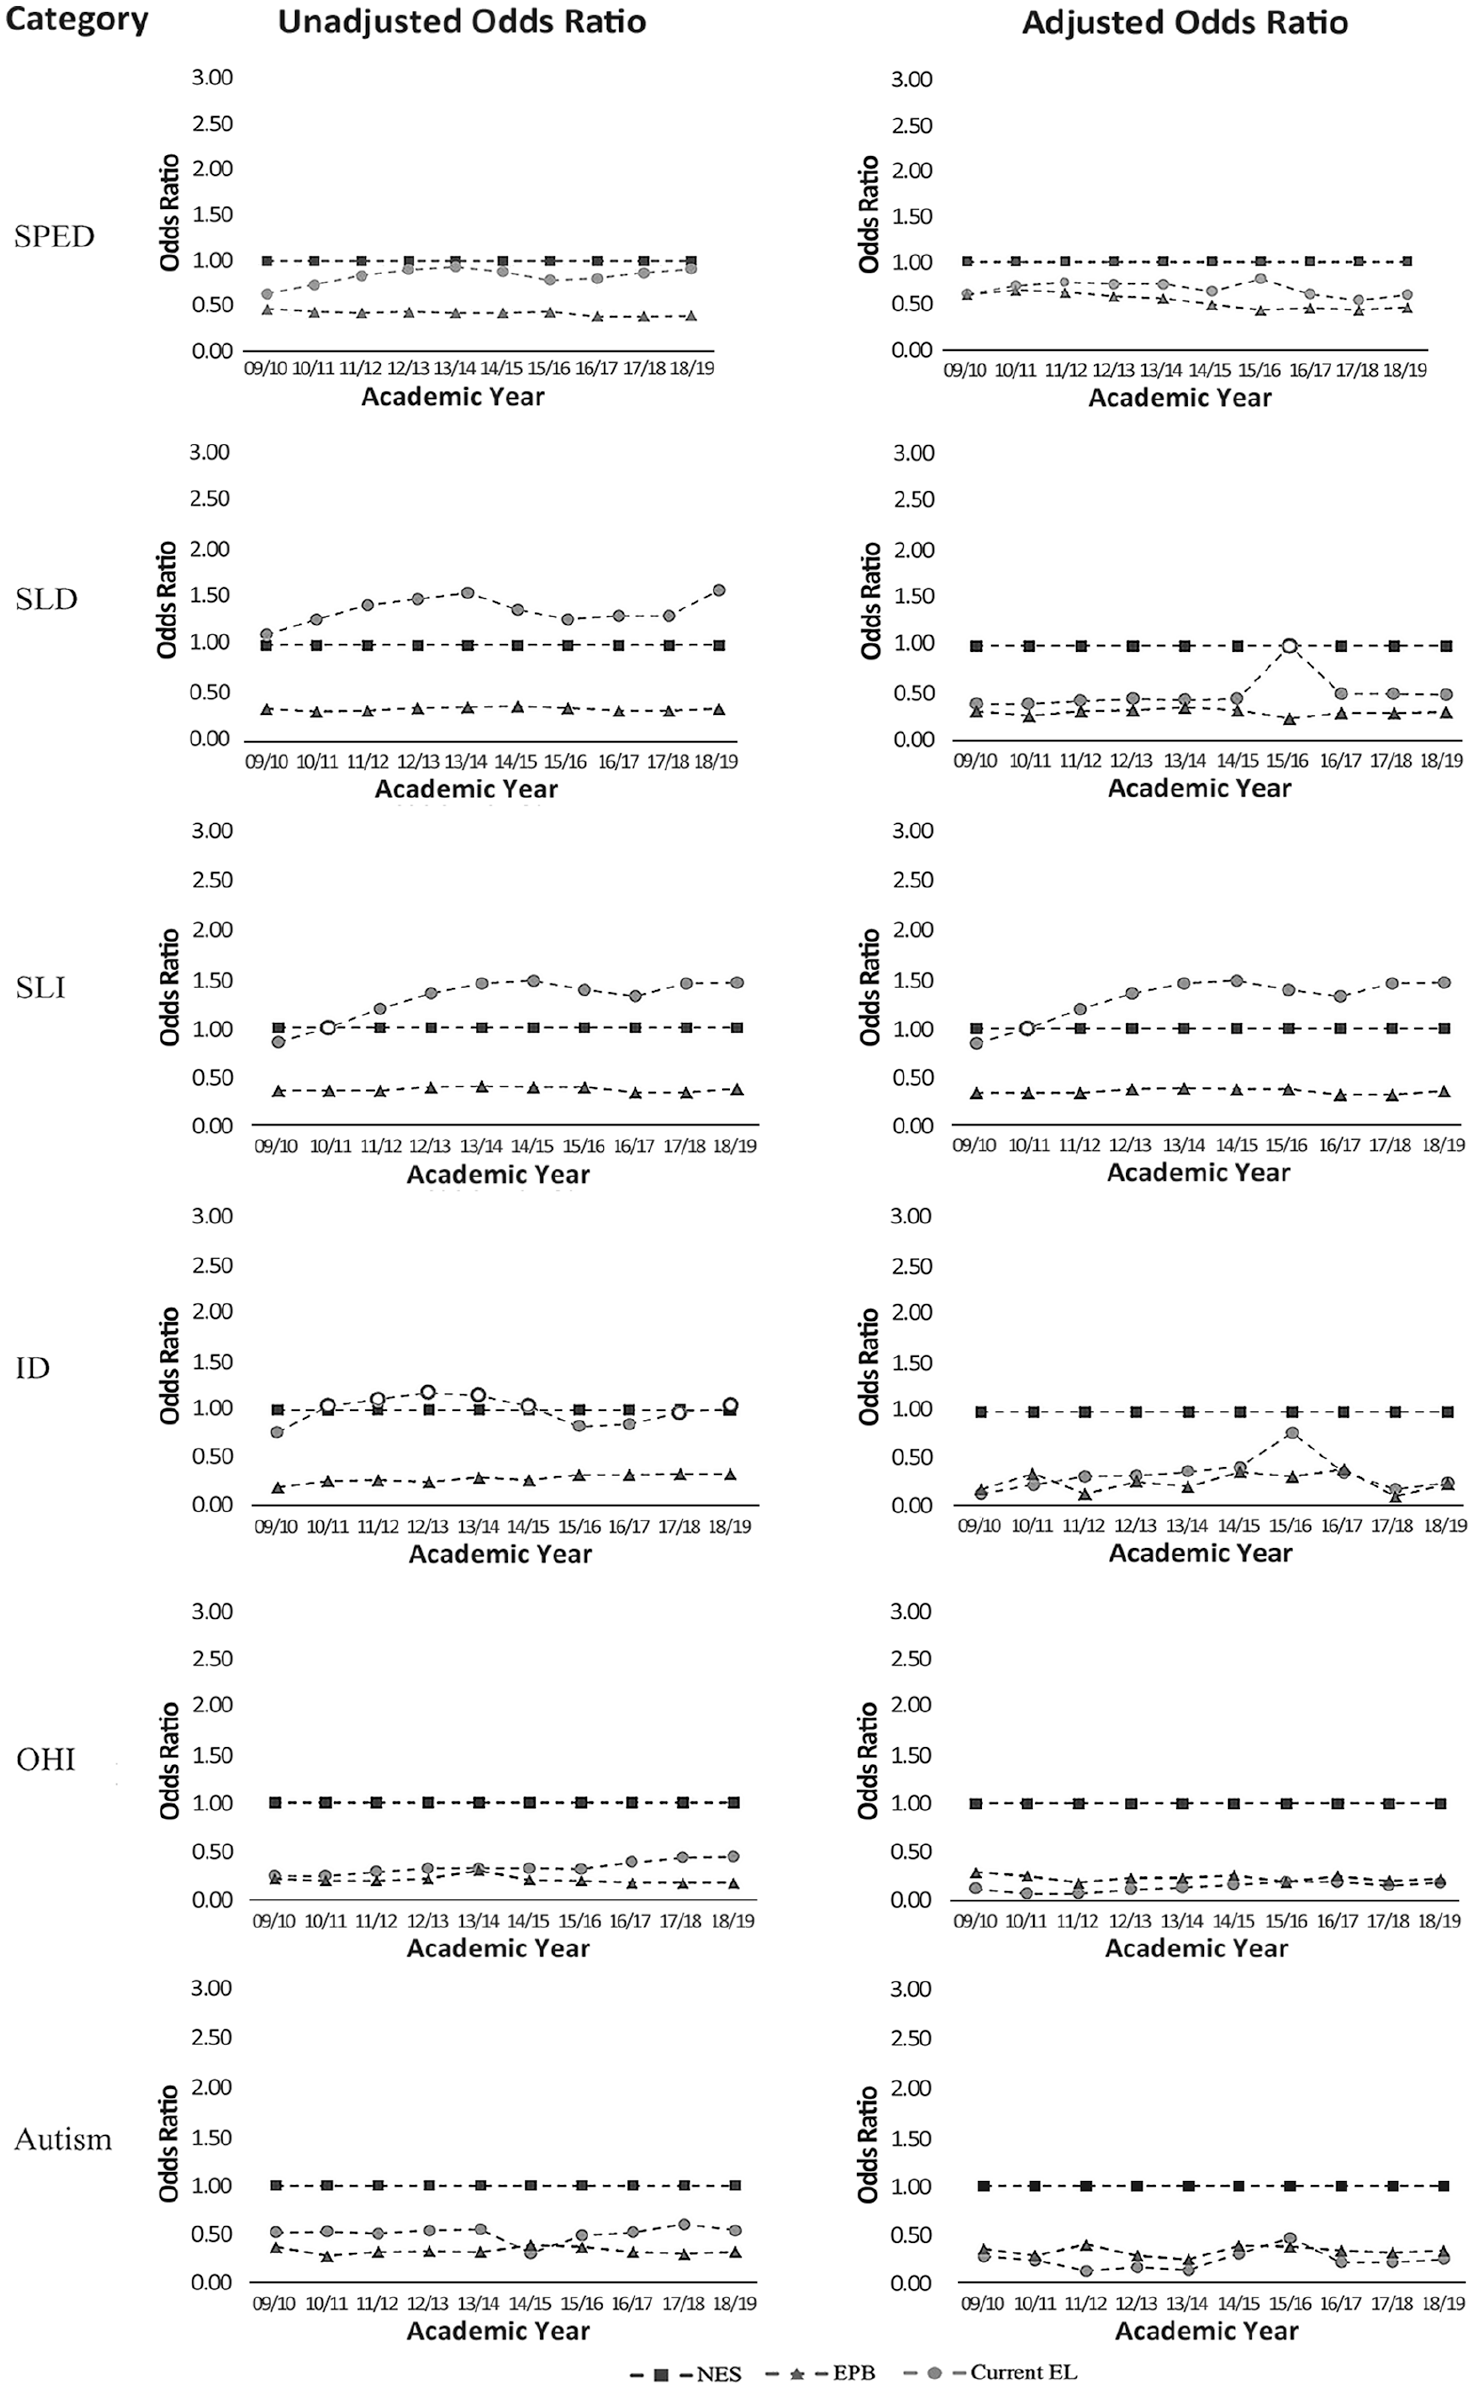
Unadjusted (Left-Pane) and Adjusted (Right-Pane) Odds Ratios (OR) of Identification for Overall SPED and for Five Prevalent Disability Types (SLD, SLI, ID, OHI, and Autism).
Logistic Regression Odds Ratio Coefficients for SPED Identification.
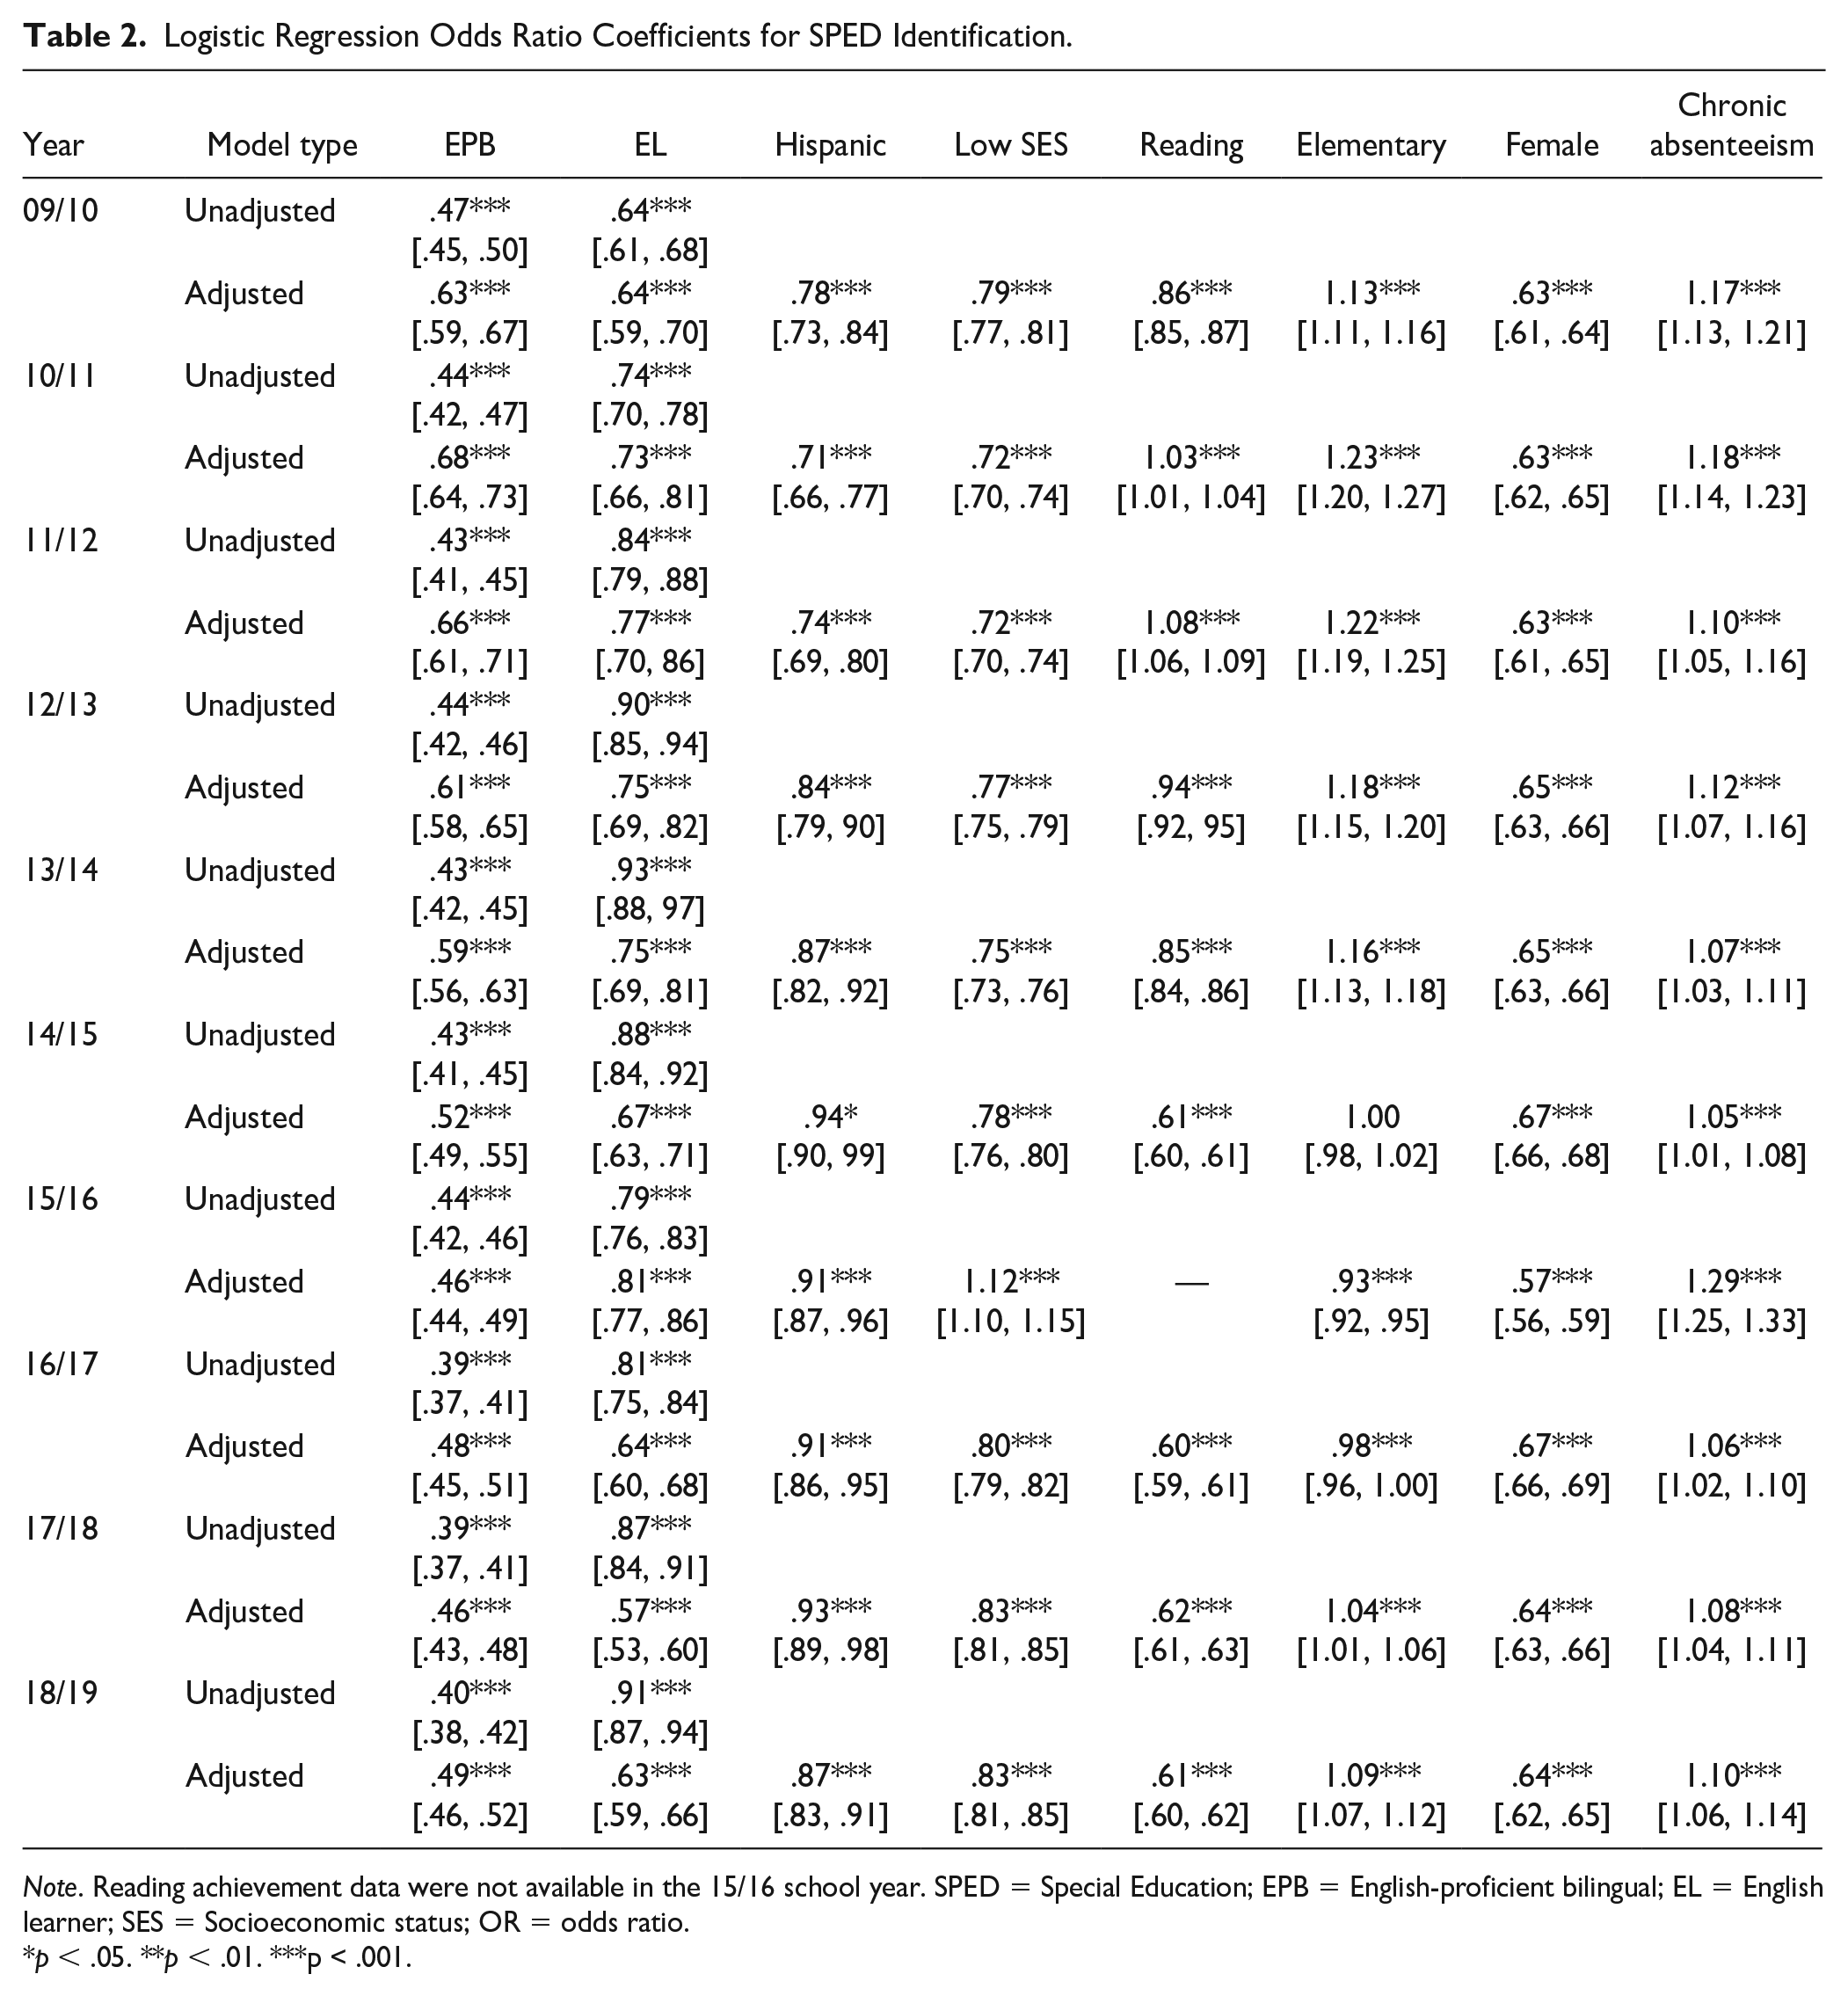
Note. Reading achievement data were not available in the 15/16 school year. SPED = Special Education; EPB = English-proficient bilingual; EL = English learner; SES = Socioeconomic status; OR = odds ratio.
p < .05. **p < .01. ***p < .001.
The unadjusted ORs among the language status groups indicate that both EPBs and Current ELs were less likely to be identified for SPED compared with NES students (see ORs under the Unadjusted row in Table 2), with EPBs exhibiting the lowest likelihood across the 10 years. Overall, the unadjusted ORs of EPBs remained lower than those of Current ELs, ranging from 0.39 to 0.47, suggesting that EPB students were from 53% (1–0.47) to 61% (1–0.39) less likely than NES students to be represented in SPED services. While the unadjusted ORs of Current ELs were higher than those of EPB students, they were still approximately 7% to 36% less likely than NES students to receive SPED services (as indicated by unadjusted ORs ranging from 0.64 to 0.93). Indeed, there was little fluctuation across the 10-year span for each language status group, with NELB students showing lower likelihoods of SPED identification compared with their NES peers. However, adjusting for covariates generally increased the likelihood of SPED representation for EPBs while adjusting for covariates generally decreased Current ELs’ likelihood of SPED representation compared with NES peers.
Furthermore, with the exception of grade level in academic year 2014–2015, all of the covariates showed statistically significant relation to SPED representation (see Table 2, adjusted rows). Furthermore, except for grade level wherein the odds of SPED identification generally increased for students in the primary grades and for chronic absenteeism wherein the odds of SPED placement generally increased for students who were chronically absent, the odds of SPED placement declined when accounting for all other covariates. We note that low-income status increased the odds of SPED placement only when English reading achievement was not accounted for in academic year 2015–2016. Finally, the ORs did not reveal significant state-determined disproportionality in terms of overrepresentation (i.e., ORs did not exceed 3.0 for three consecutive years) of neither EPBs nor Current ELs compared with NES students. For yearly covariate-adjusted ORs for each district included in our analytic sample, see Supplemental Figure S1.
Five Prevalent SPED Disability Categories
Higher-Incidence Disabilities
Figure 1 displays the SLD unadjusted and adjusted ORs by language status. The complete overview of yearly ORs of SLD appears in the Supplemental Material (see Supplemental Table S1). Based on the unadjusted ORs and compared with NES students, Current ELs showed the highest odds of SLD identification while EPBs showed the lowest odds. However, Current ELs’ higher odds became lower and comparable to those of EPBs after adjusting for covariates, indicating that these factors made a significant contribution to the likelihood of SLD placement. In particular, Hispanic status was consistently associated with increased odds of SLD placement. However, there were fluctuations in the association between low-income status and the odds of SLD placement as well as in the association between chronic absenteeism and the odds of having SLD status. All other covariates were associated with declining odds. For years when English reading achievement scores were available, the English reading achievement coefficients show that the likelihood of having SLD status decreases with one-unit increase in English reading achievement. Notably, English reading achievement showed a strong link to SLD status. Specifically, Current Els’ covariate-adjusted odds of SLD identification in 2015–2016 (i.e., when English reading achievement data was unavailable) was comparable to that of NES peers (i.e., OR of 1.0, although not significant), whereas in other years, when English reading achievement scores were available, Current ELs were generally 58% to 68% less likely than their NES peers to receive SLD status (i.e., ORs <1.0 and significant).
In contrast to Current ELs’ odds of receiving SLD status, EPB students’ odds remained relatively stable, and low, when accounting for covariates. We observed a similar overall pattern between the unadjusted and adjusted SLI ORs by language status (see Figure 1 and Supplemental Table S2). For EPBs, although trending toward slight increases, the unadjusted ORs remained relatively stable and low after accounting for covariates. In sharp contrast, Current ELs’ ORs shifted from higher to lower odds relative to their NES peers after adjusting for covariates. In the case of SLI, the significance of Hispanic status and chronic absenteeism fluctuated. In contrast, English reading achievement, low-income status, and gender were associated with decreased odds of SLI placement. However, grade level had the strongest relation to SLI status such that the odds of having SLI status consistently increased for students in the elementary grades (Grades 3–5) compared with middle grades (Grades 6–8; ranging from 92% to 219%, as indicated by ORs ranging from 1.92 to 3.19 with the middle grades group as the reference group). All unadjusted and adjusted ORs of SLI identification are presented in the Supplemental Material (see Supplemental Table S2).
Lower-Incidence Disabilities
For ID identification, Current ELs’ unadjusted ORs hovered at a level proportional to those of their NES peers but shifted to being lower and similar to those of EPBs after accounting for covariates. English-proficient bilingual students’ unadjusted and adjusted odds were generally similar and low (see Figure 1). The role of covariates was largely inconsistent and not significant, except for English reading achievement wherein the odds of ID identification consistently declined with one unit increase in English reading achievement scores (ranging from 69% to 77%, as indicated by ORs ranging from .23 to .31). All unadjusted and adjusted ORs for ID identification are presented in the Supplemental Material (see Supplemental Table S3). Finally, for OHI and autism, adjusting for covariates did not notably change the odds of identification for EPBs and Current ELs relative to their NES peers (see Figure 1). Both groups of NELB students were less likely to be identified for OHI and autism compared with NES peers. Except for Hispanic status, covariates were generally significant and largely associated with declined odds of OHI and autism identification. English reading achievement revealed a strong link to OHI and autism, such that the odds of identification declined by 31% to 60% (as indicated by ORs of English reading achievement ranging from .40 to .69 across both disability categories). Unadjusted and adjusted ORs across the 10 years can be found in the Supplemental Material (see Supplemental Tables S4 and S5).
Discussion
Inappropriate SPED placement is associated with consequential and potentially long-lasting negative life prospects, making placement decisions an issue of educational equity for all students. Our cross-sectional findings based on unadjusted and adjusted analyses from Tennessee state-level data do not reveal evidence of SPED disproportionality by language status in terms of overrepresentation, whether the focus is on overall SPED trends or across prevalent disability categories. On the contrary, our findings suggest that NELB students may be underrepresented in SPED, most notably in lower-incidence categories. By definition, new immigrant destination states like Tennessee have comparatively less experience educating students who are from linguistically diverse homes, likely complicating the long-standing challenges associated with differentiating second language acquisition from learning disabilities (e.g., Artiles & Castro, 2021). Educators in these contexts charged with making consequential SPED referral and identification decisions may experience a greater degree of uncertainty about whether NELB students, particularly Current ELs, can qualify for dual services (EL and SPED). We discuss our findings and their policy and practice implications in the sections that follow.
NELB Students May be Underrepresented in Special Education
Results from our findings span a decade (2009–2019) and the trends are robust: NELB students were consistently less likely than their NES peers to be identified for SPED, regardless of whether unadjusted or adjusted results were considered. Depending on the disability type, NELB students’ likelihood of being identified was either generally unchanged or decreased relative to NES peers after adjusting for covariates. When we examined results across five prevalent disability categories, similar trends emerged: NELB students tended to be less likely than their NES peers to be identified. The exception to this trend centered on the case of Current ELs identified with SLD or SLI, two higher-incidence disability categories. When unadjusted likelihoods were considered, Current ELs were especially likely to be identified with SLD and SLI compared with English-proficient peers (both NES and EPB students). This finding aligns with those stemming from national trends (OELA, 2020) and is expected as the relatively subjective nature of identifying language-based disability categories has long been noted in the field (Counts et al., 2018; Hibel & Jasper, 2012).
However, adjusting for covariates changed the landscape: the likelihoods of SLD and SLI identification for Current ELs declined. Our finding contradicts some of the existing evidence on the overrepresentation of Current ELs in SLD and SLI (Sullivan, 2011) but aligns with previous findings on adjusted likelihoods of SPED placement (mostly focused on racial and ethnic minority students) where student-level factors were considered (Hibel et al., 2010; Morgan et al., 2017). Studies that adjusted for individual-level covariates revealed that racial, ethnic, and language minority students (i.e., NELB students) tend to be underrepresented in specific disability categories (Hibel et al., 2010; Morgan et al., 2015). Our findings on Current ELs’ lower likelihood of SLD and SLI identification align with that of Morgan and colleagues (2017) based on a nationally representative dataset.
More specifically, the adjusted analyses underscored that factors other than language status were significant for understanding SLD and SLI placement for Current ELs. For SLD, being a student of Hispanic background, the most typical Current EL profile in the United States (Park et al., 2018), was associated with a higher likelihood of SLD identification, although the role of income status was inconsistent for SLD identification. However, being an elementary-level (Grades 3–5) student, being female, not being chronically absent, and having higher English reading achievement was associated with a lower likelihood of SLD identification. Previous work has similarly found that elementary-grade ELs tend to be less likely to be identified, noting that educators tend to find supplemental supports sufficient (Guiberson, 2009). This is concerning as delayed early intervention opportunities for learning disabilities are associated with compromised learning trajectories (Bruder, 2010; Guralnick, 2005), making accurate and timely placement decisions essential for equitable educational outcomes. Indeed, during the middle-grade years, supplemental supports may be more limited. Perhaps of most relevance, English academic language skills are more centrally implicated for academic achievement across subject areas over the course of schooling (in middle compared with elementary grades), potentially leading to increased referral and representation of linguistically diverse students in SPED (Artiles et al., 2005). The nature of our data does not allow us to investigate this important question, but further research in this area is needed. For SLI, the most notable finding was that being an elementary-grade student (Grades 3–5) compared with a middle-grade student (Grades 6–8) was most strongly associated with a higher likelihood of SLI identification. This finding is expected as longitudinal studies of SLI placement find SLI tends to be identified earlier in development (Cruz & Firestone, 2022; Morgan et al., 2015).
We also found that female students were consistently less likely than their male peers to be identified for SPED. Known as gender disproportionality (Coutinho et al., 2002), our findings align with previous studies in Tennessee. That is, male students showed higher odds of SPED identification and specific disability categories, while female students showed lower odds (SLD, SLI, OHI, and autism; Cruz & Firestone, 2022; Hibel et al., 2010; Sullivan & Bal, 2013). Concerning school attendance, it is to be expected that higher attendance rates (not chronically absent) are associated with increased academic performance with more days of instruction. Indeed, the link between chronic absenteeism and compromised academic achievement has been established (Center for Research in Education & Social Policy, 2018). In turn, our finding that higher English reading achievement is generally associated with a lower likelihood of SPED identification is also to be expected. The concern is that NELB students, especially Current ELs, tend to evidence lower English reading achievement compared to their English-proficient peers (Johnson, 2020). However, being female and having higher English reading achievement were associated with a lower likelihood of SLI identification.
Somewhat more unexpectedly, both unadjusted and adjusted odds ratios indicated that NELB students were consistently less likely to be identified for lower-incidence disability categories: ID, OHI, and autism. Although empirical evidence on NELB students’ representation is limited, evidence to date is mixed: De Valenzuela and colleagues (2006) found that ELs were overrepresented in ID and underrepresented in OHI while Morgan and colleagues (2015) found that language minority learners were not significantly more or less likely than peers from English-speaking households to be identified for ID or OHI. For autism, Yamasaki and Luk (2018) similarly found an underrepresentation of NELB learners based on Massachusetts’ state-level data. Moreover, Morgan and colleagues (2017) found that ELs were consistently less likely to be identified in SPED and less likely to be identified in specific disability categories.
We speculate that the general pattern of NELB students’ underrepresentation in SPED might be related to sociocultural factors relevant to the U.S. NELB school-age population. Various cultural, linguistic, and/or socioeconomic obstacles may constrain minority families’ access to medical care and SPED services, such as high levels of disability stigma (e.g., being labeled as “intellectually disabled”) in certain cultures, limited access to appropriate care due to poverty and English proficiency, or mistrust in health care providers and school personnel (e.g., Zuckerman et al., 2014). Also, commonly observed inequities in access to medical care and knowledge of utilizing health care options among minority learners and their families, referred to as health disparities (Parish et al., 2012; Toomey et al., 2013) may relate to NELB learners’ representation in and identification for lower-incidence, clinically driven disability categories (versus more subjective disability categories like SLD). In Tennessee, guidance for ID, OHI, and autism evaluation strongly recommends utilizing students’ medical histories or encouraging families to consult with their pediatricians (TDOE, 2018a, 2018d, 2018e). Based on research that finds minority families to have fewer interactions with health professionals or pediatricians who diagnose disorders during early childhood (Flores & Committee on Pediatric Research, 2010), we speculate that the confluence of sociocultural factors (e.g., poverty, language barrier, cultural perception of language disabilities, and access to health care providers) may partially explain our findings.
Limitations and Future Directions
The issue of SPED disproportionality by language background is highly complex and multifaceted. Like all studies, we made methodological decisions in an effort to provide a clear picture of the association between SPED representation and students’ language backgrounds. These decisions included dichotomizing data (i.e., Hispanic vs. non-Hispanic, chronic absenteeism: missed less than or more than 10% of school days) and potential collider effects (e.g., SPED representation, as expected, was associated with both language background and SES). Also, the English reading measure changed from TCAP to TNReady under the state-wide change, thereby changing how scores could be interpreted across the years. Although we standardized English reading achievement scores to account for this change, this may limit the generalizability of our findings. Relatedly, psychometric data for the newer assessment, TNReady, were not available. Furthermore, we used both unadjusted and adjusted analyses to account for variability in student backgrounds but acknowledge that students are not similarly-situated. For example, in the United States, NELB students live in poverty at higher rates than their NES peers (Guzman et al., 2021) and, within each language status group, the odds of being placed into SPED services might vary based on the unique characteristics and backgrounds of individual students (e.g., Hispanic females from high SES homes who are not chronically absent). Furthermore, caution must be exercised in interpreting our findings based on one state in the American South that has experienced a significant increase in the school-age population of students from linguistically diverse homes. However, our findings showcase the importance of attending to language background when considering SPED representations in addition to race and ethnicity. Indeed, our results help inform state-level efforts and may be relevant to states similarly experiencing rapid growth in the population of school-age NELB students.
However, the cross-sectional nature of our data and design poses important limitations. For instance, the slight fluctuations observed only in the academic years 2010–2011 and 2011–2012, in which higher English reading achievement was associated with a higher likelihood of SPED identification in general, may potentially be related to the cross-sectional nature of our data. Longitudinal studies are needed to provide more nuanced insight into our observed cross-sectional trends. For example, low-income status was generally associated with lower odds of overall SPED identification, and consistently associated with lower odds of SLI, OHI, and autism identification. However, the role of income status was inconsistent for SLD and ID, which may be related to the cross-sectional nature of our data. Relatedly, we cannot determine the causality of the variables included in our analytic models.
Furthermore, our depiction of high- and low-incidence categories includes conditions that encompass both prevalent and rare conditions (SLD is a high-incidence category that includes prevalent conditions, such as dyslexia, and rare conditions, such as minimal brain function; OHI is a low-incidence category that includes prevalent conditions, such as ADHD, and rare conditions, such as Tourette Syndrome). The categories are consistent with TDOE’s classification, but there is variability in the prevalence of conditions within SLD and OHI. The TCAP and TNReady assessments were also only administered in English in Tennessee as English is the official and legal language of Tennessee, requiring instruction and assessments in the public schools to be conducted in English (TDOE, 2018c). Thus, the implications of our study are limited to the role of English reading achievement scores on students’ SPED placement odds. Previous work has underscored the importance of accounting for NELB students’ home language when investigating reading achievement (Mancilla-Martinez et al., 2021) and future studies that examine the extent to which English reading achievement and NELB students’ home language reading achievement relate to SPED placement likelihoods are needed.
Our analysis also did not include Waived ELs (i.e., NELB learners eligible for EL services but whose parents declined the support) due to insufficient data (see Supplemental Material). However, EL service waiver may be related to prioritization of SPED services over EL services in schools (Kangas, 2018). In Tennessee, Waived ELs retain their initial identification as ELs and their English language proficiency and academic progress continue to be monitored by LEAs. Although guidelines exist for parents and LEAs to assist with the waiver decision, little is known about how and why parents make these decisions. This is an understudied area of research. It was also beyond the scope of our study to investigate whether students were placed in the least restrictive settings regardless of language background. Some work finds that racial and ethnic minority students in SPED tend to be placed in more restrictive settings compared with their non-minority peers (National Center for Learning Disabilities, 2020), which can further compromise their academic outcomes. However, a recent study by Morgan and colleagues (2022) finds that, when similarly situated students are compared based on adjusted analyses, racial and ethnic minority students are equally likely as their White peers to be removed from general education classrooms. More research by language status is needed.
Perhaps the biggest, although not unique, limitation of our study is that our data cannot speak to the accuracy of the classification decisions. Our findings suggest underrepresentation of NELB students in SPED, but underrepresentation is not synonymous with underidentification (USDE, 2016) as NELB students may be correctly placed independent of the observed ORs. The need for better SPED identification practices has been underscored and there are ongoing debates over the extent to which current standards for determining disproportionality are appropriate (Morgan et al., 2017). Also, we were not able to investigate the quality of SPED services provided, warranting future research on the extent to which students’ instructional placement, in general education or SPED settings, supports their academic achievement. Although our current findings robustly point to potential underrepresentation of NELB students in SPED, we underscore that overrepresentation is unquestionably just as problematic as, again, misrepresentation is the central equity issue.
Implications and Conclusion
Our findings underscore the need for further investigations into the referral and identification process for NELB students, namely low rates of identification (NASEM, 2017). We must consider disproportionality as a social, cultural, and historical issue, not simply a medical issue, especially in light of the somewhat subjective nature of disability labels and the multi-determinate ways in which SPED identification occurs (Connor et al., 2019). Sociodemographic factors associated with NELB in the United States, such as limited English proficiency and economic disadvantage, should not contribute to SPED identification. But our results reveal that sociodemographic factors associated with ELs in the United States significantly contribute to SPED identification. Attention to NELB students’ parents in the referral process is also needed. Among other factors, poor communication, low effort in providing services, and negative treatment of parents by professionals have surfaced as concerns of Latino parents of children with disabilities (Shapiro et al., 2004).
However, the referral and identification process cannot be improved without federal guidance on the issue of underrepresentation. As we have underscored throughout, Equity in IDEA regulations only establishes a system for identifying significant disproportionality based on overrepresentation. Yet, the central equity issue is misrepresentation if all students are to have equal access to education as intended by IDEA. This effectively means that states, like Tennessee, necessarily set thresholds that monitor only for overrepresentation. A clear policy implication is that it is imperative to have clear federal guidance on underrepresentation. Additionally, there is an urgent need for greater educator workforce competence in understanding the educational needs of linguistically diverse learners, especially in contexts experiencing rapid growth among the NELB school-age population. The central point is that Current ELs’ developmental experience, not their cognitive ability and potential, differs from that of their English-proficient peers by virtue of having access to a language other than only English. Thus, Current ELs should not be treated as English monolinguals. Reliance on English-only assessments for identification purposes necessarily provides only partial insight into what Current EL students may know and understand (Mancilla-Martinez et al., 2021). Yet, school-based assessments are overwhelmingly English-only, even for SPED identification (Escamilla et al., 2017). The urgent need for investment in valid assessments for use with NELB students, especially Current ELs, is evident. Furthermore, our results suggest that bilingual specialists should be included in consequential data team meetings and underscore that the pivotal role of school psychologists (Cohen et al., 2015) cannot be overstated in the referral and identification process.
Supplemental Material
sj-docx-1-ldx-10.1177_00222194231178285 – Supplemental material for Special Education Representation Trends Vary by Language Status: Evidence of Underrepresentation in Tennessee
Supplemental material, sj-docx-1-ldx-10.1177_00222194231178285 for Special Education Representation Trends Vary by Language Status: Evidence of Underrepresentation in Tennessee by Jeannette Mancilla-Martinez, Min Hyun Oh, Gigi Luk and Adam Rollins, MA in Journal of Learning Disabilities
Footnotes
Declaration of Conflicting Interests
The author(s) declared no potential conflicts of interest with respect to the research, authorship, and/or publication of this article.
Funding
The author(s) received no financial support for the research, authorship, and/or publication of this article.
References
Supplementary Material
Please find the following supplemental material available below.
For Open Access articles published under a Creative Commons License, all supplemental material carries the same license as the article it is associated with.
For non-Open Access articles published, all supplemental material carries a non-exclusive license, and permission requests for re-use of supplemental material or any part of supplemental material shall be sent directly to the copyright owner as specified in the copyright notice associated with the article.