
Abstract
There is wide variability in the special education eligibility criteria for deafblindness across the United States. This study was a novel examination of variations in state factors, including eligibility criteria for deafblindness, to identify potential relationships between state factors and the number of students who are deafblind during the 2018–2019 school year. No state factors correlated to the OSEP Child Count population data. Multiple linear regression analysis revealed factors primarily relating to sensory disability professionals, which correlated to the National Center on Deaf-Blindness population data. Implications for students, personnel, and professional development offerings are discussed.
Students who are deafblind (DB) are consistently under-identified and under-counted within the U.S. population of students with disabilities (National Center on Deaf-Blindness [NCDB], 2020). This is a significant problem for students who are DB or have dual sensory loss. Students who are DB and are appropriately identified exhibit stronger communication and academic skills than those without adequate assessment of their vision and hearing status (NCDB & Accessible Teaching, Learning, and Assessment Systems [ATLAS], 2022). To improve the likelihood that students with dual sensory loss are appropriately identified as DB for special education criteria, researchers, practitioners, and advocates must understand current factors tied to eligibility criteria decisions.
Understanding Deafblindness Eligibility Criteria
The Individuals with Disabilities Education Improvement Act (IDEA, 2004) educational definition of deafblindness is brief and often challenging to interpret. Deafblindness is defined as “concomitant hearing and visual impairments, the combination of which causes such severe communication and other developmental and educational needs that they cannot be accommodated in special education programs solely for children with deafness or children with blindness” (§300.8 [c] (2)). States vary in their eligibility criteria and definition of deafblindness (Dragoo, 2020; Herbster, 2015; Müller, 2006; Travers & Schles, 2023). These varying definitions mean that students’ identification as being DB is dependent on the state they live in.
Recently, two independent reviews of DB eligibility criteria have been conducted. In the first, Dragoo (2020) surveyed a nonrandom sample of 15 state criteria and found that the operational definitions of deafblindness to be generally similar across 15 states. Travers and Schles (2023) examined the eligibility data for deafblindness in 54 U.S. states and territories. They found that most states (75%) used the federal definition of DB, while only 18% of states’ definitions differed considerably from the federal definition. Of note, as of 2021, 17 states required an individual to meet the criteria for re-eligibility under deafness/hearing impairment and visual impairment (Travers & Schles, 2023). This means that in 17 states, the eligibility determination of deafblindness is dependent on the student first meeting specific criteria for visual impairment and deafness/hearing impairment. Given the documented variability of eligibility criteria across states for separate disability categories (e.g., Dragoo, 2020; Herbster, 2015; Müller, 2006; Schles & Travers, 2023; Travers & Schles, 2023), the requirement of meeting eligibility for hearing and visual impairments prior to the consideration of the label of deafblindness is highly troublesome since “vision and hearing are important senses for learning and they reinforce each other” (Bruce et al., 2016, p. 54). Deafblindness is not additive (lack of vision plus loss of hearing); rather, it is multiplicative. The distortion or absence of any portion of a distance sense reduces the support provided to the other.
Professionals Required to Participate in Eligibility Decisions
When determining eligibility, membership of the evaluation team is critical, especially since students who are DB have highly individualized educational and communication profiles. The IDEA (2004) mandates that knowledgeable educational professionals are required to serve on eligibility teams. Yet, few states explicitly require professionals certified in sensory disabilities when DB eligibility is being considered (Travers & Schles, 2023). Only four states listed teachers of the visually impaired (TVIs) a requirement, and one provisionally required one on the team. Teachers of the deaf/hard of hearing (TDHHs) were mentioned even less, with one state indicating a requirement for a TDHH, and one provisionally requiring one to participate in eligibility decisions.
No states mention or require a teacher of the deafblind (TDB) nor an intervener to serve on eligibility teams considering deafblindness (Travers & Schles, 2023). Interveners are paraeducators who “provide access to information and communication and facilitate the development of social and emotional well-being for children who are deaf-blind” (NCDB, 2021). It is concerning that no states mention TDB nor interveners as they are the only professionals specifically trained in DB (Bruce et al., 2020; Parker & Nelson, 2016). Very few professionals are trained in the unique evidence-based strategies needed to provide access and maximize learning opportunities for children who are deafblind. In addition, educators typically have little experience with this population, which can lead to low expectations for student outcomes and engagement (Bruce et al., 2016). Without a professional trained in deafblindness on the Individualized Education Program (IEP) team, students may not be given the opportunity to reach their full potential. Therefore, not including TDBs can be problematic as the eligibility team should include at least one member highly skilled in deafblindness (Bruce et al., 2016; Ferrell et al., 2014).
Medical Documentation and Eligibility Criteria
Another facet of eligibility for deafblindness includes specific medical measures that specialists must interpret. These reports and their interpretations may impact the eligibility decisions made by education personnel. Having skilled professionals utilizing reliable diagnostic procedures and understanding how to relay those results accurately is critical (Jones, 2001). While best practice is to have audiological (hearing) and ophthalmic (vision/eye health) data, these are not universally required components in states’ eligibility criteria for DB. Eighteen states require audiological data or a diagnosis of hearing impairment, and four have provisional requirements (Travers & Schles, 2023). Seventeen states require and three provisionally require data from an optometrist/ophthalmologist. Ophthalmic reports typically include the child’s visual acuity measure (20/20, 20/70, or 20/200, etc.), etiology, and prognosis of their visual impairment. Without an adequately trained professional who understands the implications of the law, evaluation data, and how to evaluate functional vision and hearing status, children with a dual sensory impact often have eligibility team members who are not trained on how to interpret their medical data.
States’ Variations in Eligibility Criteria and Prevalence of Students With Disabilities
Researchers across disability areas have established that the prevalence rates of students with specific disabilities greatly vary from state to state. Noel and Fuller (1985) noted that the prevalence of students in special education identified with learning disabilities was positively correlated to the number of educators with higher education degrees in that discipline. In 1986, Hallahan and colleagues examined each state’s special education disability categories for variability rates and identified the visual impairment (VI) category as the one with the most significant variation. Schles and McCarthy (2022) found that eligibility criteria that required assessments unique to the field of vision (e.g., learning media assessments [LMA] and functional vision assessments [FVA]) were correlated to the number of students found eligible for VI. There was also a positive correlation with the presence of university teacher preparation programs for TVIs as more students were identified with a primary disability of VI in those states.
Understanding Population Data for Students With Deafblindness
There are two annual counts of students who are DB in the United States. The first is a count of students with deafblindness as a primary disability label. For the 2018–2019 school year, there were a total of 1,493 students in the United States with a primary disability label of deafblindness, ages 3 to 5 and 6 to 21 totals combined (U.S. Department of Education, 2020). As an estimated 90% of students who are DB have a primary disability label other than deafblindness, since 1986, the NCDB is authorized to collect data specific to children who are DB regardless of their primary disability label. The NCDB 2019 Child Count (data collected from December 2, 2018, to December 1, 2019) identified 9,867 students who were DB in the United States between 3 and 21 years old (NCDB, 2020). As there are two distinct annual population counts for students who are DB, any research into correlations between eligibility criteria and student prevalence rates must consider both counts in analysis.
Given the gaps in the literature, the following research questions were asked:
Method
Sample and Data Sources
The population for analysis was drawn from the 50 U.S. states, Washington DC, and Puerto Rico (all referred to as states within this report). Data from the 2018–2019 school year were used for analysis as the researchers believed it was the most recent, reliable data (due to data quality concerns stemming from the COVID-19 pandemic impacting subsequent school years).
Data Sources and Covariates
For the outcome variables, the data sources were publicly available from OSEP and NCDB. OSEP Section 618 data were used for the OSEP Child Count data for the number of students with deafblindness and a primary disability label of deafblindness. The NCDB Child Count Data were the source of students who were DB regardless of primary disability label.
Covariates of interest were grouped into four conceptual categories. The first two conceptual categories were states’ individual eligibility criteria in the special education category of “deafblindness” (16 potential covariates) and “visual impairments including blindness” (10 potential covariates). In both conceptual categories, variables included specific components of eligibility criteria that may or may not be present in each state. This included, but was not limited to, the following: Did students need to meet a visual acuity threshold or audiological data threshold? Were specific types of assessment data required (e.g., eye reports, functional vision, or communication assessments)? Were specific teachers/professionals required to attend eligibility decision meetings (e.g., TVIs; TDHHs)? Data for deafblindness and VI eligibility criteria variables were sourced from Schles et al. (2022) data set.
The second two conceptual categories were state-level financial variables and state-specific factors that related to students who were DB. The three state financial variables (average per pupil expenditure, percentage of children 5–17 years old living in poverty, and average state per capita income) were all sourced from the American Community Survey 5-year data. Seven state-specific variables relating to students who were DB included whether or not states housed a university preparation program for TVIs, TDHHs, O&M specialists, or Deafblind Specialists, did the state formally recognize the profession of the intervener, and whether or not the state had an active school for the blind or school for deaf students (note: combined schools for deaf and blind students were included in each count). These state-specific variables relating to students who were DB were independently created and coded by two research assistants until 100% agreement was reached. After coding, the first author shared the finalized list with colleagues to verify the accuracy of active university training programs and specialized schools.
Outcome Variables
The authors developed three different multiple linear regression models, all with the same predictive variables considered for analysis. In the first two models (related to RQ1 and RQ2), the outcome was calculated as the percentage of students who were DB within the larger total number of students in a state receiving special education services ([OSEP or NCDB Child Count/states’ total Child Count report] × 100). For RQ3, a ratio of states’ percentage of students in OSEP and NCDB Child Count reports was created to analyze whether state-level factors correlated to the differences between the two counts.
The first model (RQ1) used OSEP Child Count data for the number of students from 3 to 21 years old reported with a primary disability label of deafblind during the 2018–2019 SY. There were 51 states with available data for analysis, as Wisconsin’s OSEP Child Count data were not reported for this school year. The mean percentage of students who were DB reported in OSEP Child Count data was 0.02609% with a standard deviation of 0.03272% (range = 0.0%–0.20507%).
The second model (RQ2) used NCDB Child Count data for the total number of students from 3 to 21 years old who were DB in a state regardless of their primary disability label of deafblindness during the 2018–2019 SY. There were 51 states with available data for analysis, as Puerto Rico was missing OSEP Child Count data in the area of Developmental Delay for the 2018–2019 school year. The mean percentage of students who were DB reported in NCDB Child Count data was 0.14447% with a standard deviation of 0.04952% (range = 0.06073%–0.25839%).
The third model (RQ3) was the NCDB and OSEP Child Count data percentage ratio for the 2018–2019 SY. There were 50 states with available data for analysis, as Wisconsin and Puerto Rico each had data missing for one of the population counts. The mean ratio was 0.17912% with a standard deviation of 0.17404% (range = 0.0%–0.79909%).
Data Analysis
The primary purpose of the current analysis was to create multiple linear regression models to identify potential correlations between the reported population of students who were DB and state-specific factors. First, descriptive statistics for all variables were reviewed. To identify potential correlational relationships between variables, correlation matrices were analyzed. All variables were individually regressed with each outcome variable to answer each research question. Statistically significant relationships were noted, and the potential for collinearity between statistically significant variables was examined through additional correlation matrices. These procedures were used to develop multiple linear regression models for each research question.
Note: Wisconsin does not have state eligibility criteria for the eligibility category of deafblindness (Travers & Schles, 2023). Following the coding of Schles et al. (2022), they were included in the model using IDEA criteria for deafblindness. The statistical relationships were tested with and without Wisconsin in the model. There were minimal differences, none statistically significant, between the models with or without Wisconsin, so they were included in the final models so that the results represented the full United States.
Results
Descriptive Findings
Thirty-three states (64.7%) housed a university-based training program for TDHH. Twenty-eight (54.9%) states housed a university-based training program for TVIs. Few states named specific types of professionals who should attend or collect data during the eligibility process. Seventeen states (33.3%) required students to meet eligibility definitions in VI and DHH before eligibility in the category of deafblindness could be considered. Broadly, states varied in their eligibility criteria for students with VI and deafblindness, with less variability in deafblindness criteria than VI criteria. Full descriptive statistics for DB and VI eligibility criteria variations can be found in the following articles (Schles & Travers, 2023; Travers & Schles, 2023). Relevant descriptive statistics for the current analysis are summarized in Table 1.
Key Descriptive Statistics, Eligibility Criteria, and State Demographics.
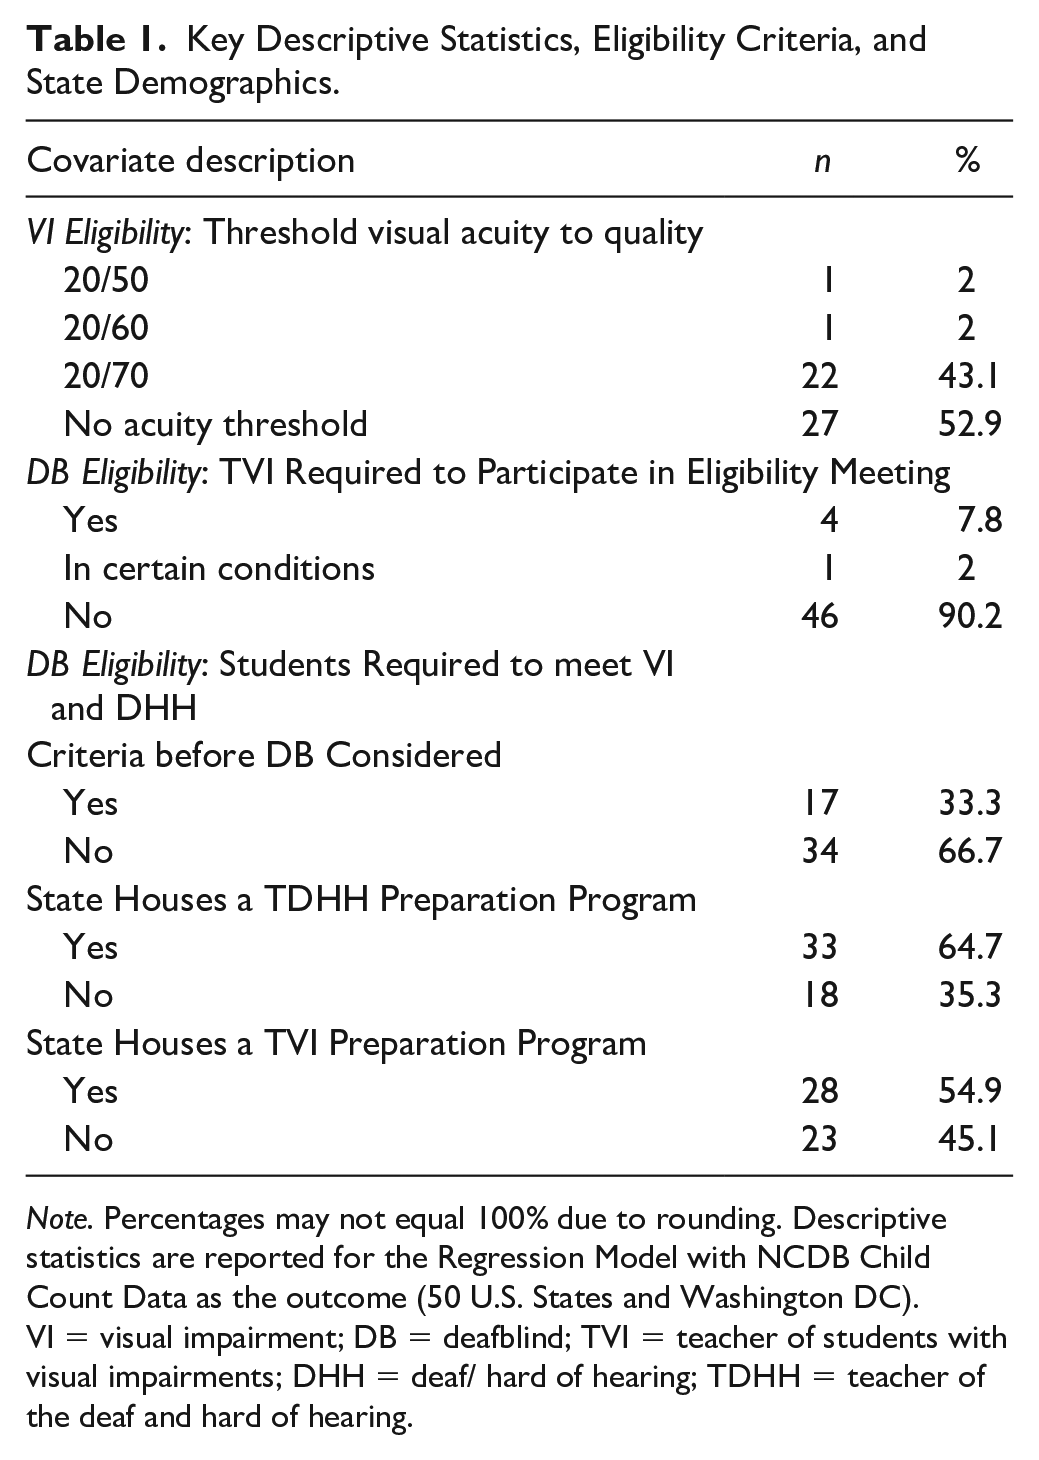
Note. Percentages may not equal 100% due to rounding. Descriptive statistics are reported for the Regression Model with NCDB Child Count Data as the outcome (50 U.S. States and Washington DC). VI = visual impairment; DB = deafblind; TVI = teacher of students with visual impairments; DHH = deaf/ hard of hearing; TDHH = teacher of the deaf and hard of hearing.
Regression Analysis
OSEP Child Count as Outcome Variable (RQ1)
Each potential covariate within the four conceptual groupings was individually regressed with the outcome variable (percentage of students with deafblindness as their primary disability label per OSEP Child Count data). None of the covariates had a statistically significant correlation with the outcome, so no regression model was developed.
NCDB Child Count as Outcome Variable (RQ2)
Using the process described above, each potential covariate in the four conceptual groupings was individually regressed with the outcome variable (percentage of students with deafblindness in a state based on NCDB Child Count data). Four variables were statistically significantly correlated with the NCDB Child Count data: VI eligibility criteria acuity thresholds, deafblindness eligibility criteria requiring a TVI to participate in eligibility decisions, if the state housed a TDHH preparation program, and if a state housed a school for the deaf. The variables of a state housing a TDHH preparation program and a school for the deaf were correlated (r = .2424, p = .0866). The school for the deaf variable was no longer significant when included in the final model, so the variable was dropped. The final regression model accounted for 29% of the variance in NCDB Child Count data across states for the 2018–2019 SY, R2 = .29, F(6, 44) = 3.05, p < .001. Compared with states that did not have a TDHH preparation program, states with a TDHH program had fewer students reported in the NCDB Child Count, b = –.0292, t(44) = −2.13, p = .039. States that required TVIs to participate in DB eligibility decision meetings, b = .1092, t(44) = 2.08, p = .044, had more students than states that did not require a TVI, b = .0707, t(44) = 1.54, p = .132. However, both had a positive correlation with the number of students reported. The visual acuity threshold variable held a negative correlation with NCDB Child Count data, with fewer students reported when there was a visual acuity threshold of 20/70, b = −.1156, t(44) = −2.54, p = .015, compared with no visual acuity threshold, b = −.1043, t(44) = −2.29, p = .027.
The Ratio of Child Counts as Outcome Variable (RQ3)
Using the process described above, each potential covariate in the four conceptual groupings was individually regressed with the outcome variable of the NCDB and OSEP Child Counts ratio to determine whether any factors correlated with the difference between the two counts. None of the covariates had a statistically significant correlation with the outcome, so no regression model was developed.
Prototypical States
To interpret the statistical modeling results in practical terms, the authors created prototypical states to better understand how differences in the variables of interest correlated to changes in the number of DB students in the NCDB Child Count. Using the overall OSEP Child Count reports of the total number of students in special education (across all disability categories), the “average” state in the United States reported 139,936 students 3 to 21 years old in special education in the 2018–2019 school year. Using the final regression model, Table 2 reports how the number of students in the NCDB Child Count could vary, depending on (a) if a state does or does not have a TDHH preparation program, (b) if a TVI is required to participate in DB eligibility team decisions, and (c) if the state’s VI eligibility criteria have a 20/70 acuity threshold requirement or there is no visual acuity threshold included in the eligibility criteria. While one state each maintained acuity thresholds of 20/50 or 20/60 (Schles & Travers, 2023), these were not included in the calculations for prototypical states because it is unusual for a state to use this requirement (See Table 2).
Estimated Prototypical State NCDB Child Population Count Based on Final Regression Model.
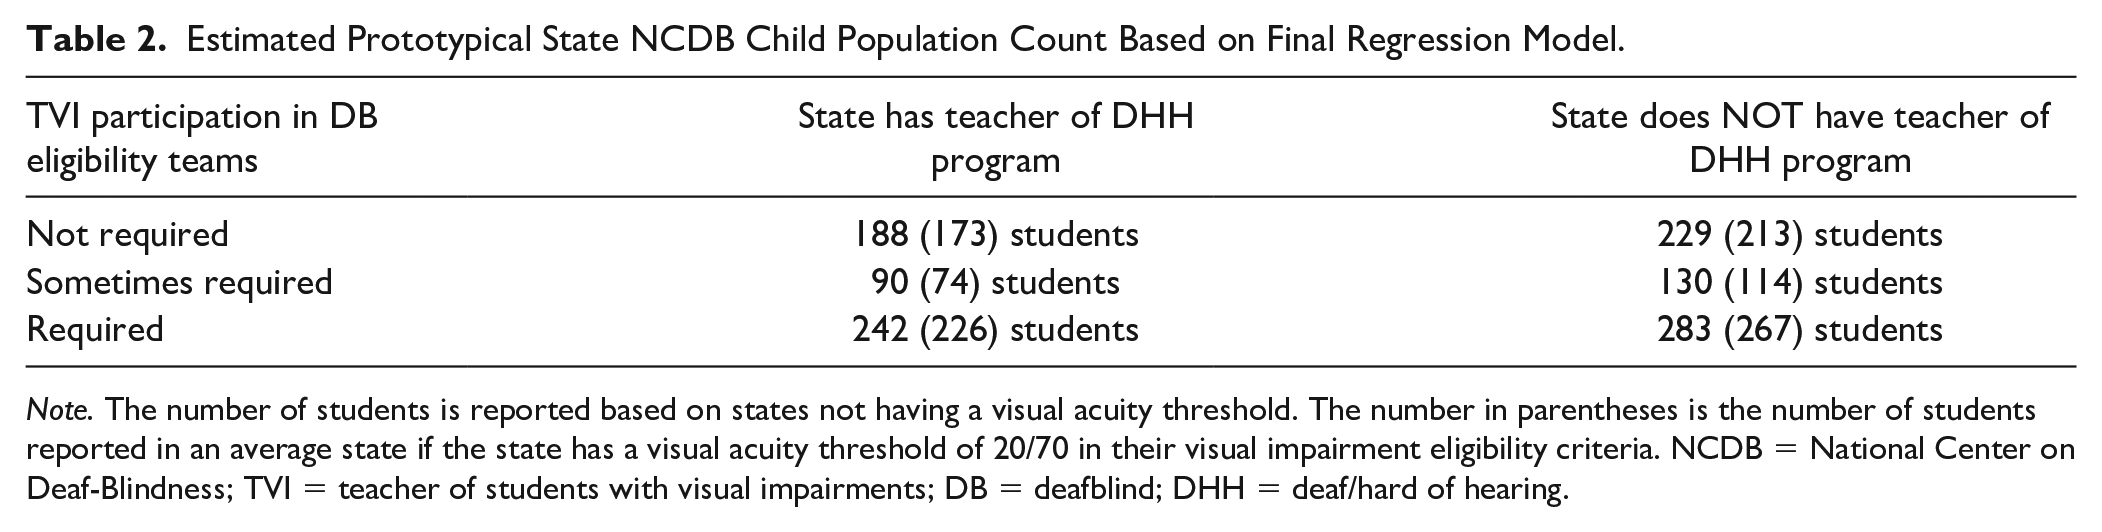
Note. The number of students is reported based on states not having a visual acuity threshold. The number in parentheses is the number of students reported in an average state if the state has a visual acuity threshold of 20/70 in their visual impairment eligibility criteria. NCDB = National Center on Deaf-Blindness; TVI = teacher of students with visual impairments; DB = deafblind; DHH = deaf/hard of hearing.
Relatively small differences were observed depending on whether a state had a visual acuity threshold of 20/70 or no acuity threshold. Fewer students were identified when a visual acuity threshold was in place (average 15 students difference, range = 14–16 students). The largest number of students who were DB would be identified if the state required TVIs to participate in DB eligibility decisions and the state did not have a TDHH program, with an average of 283 or 267 students, depending on acuity thresholds. While significantly fewer students would be reported if the state did not require a TVI to participate in the DB eligibility decision and the state had a TDHH program (188/173 students, respectively, depending on acuity threshold). The fewest number of students who were DB would be reported if a TVI was only sometimes required (e.g., only in specific circumstances) to be on an DB eligibility team, regardless of whether the state had a TDHH program and the acuity threshold in the state’s VI eligibility criteria.
Discussion
This study aimed to understand whether states’ demographics and eligibility criteria correlated to the number of students who are DB reported in the United States during the 2018–2019 school year. No correlations were identified between state-level variables and OSEP Child Count, nor state-level variables and the ratio or difference between OSEP and NCDB Child Counts. Four state-level factors were identified as statistically significantly correlated to the number of students reported in the NCDB Child Count. Considered together, three of the variables accounted for 29% of the variation in states’ NCDB Child Count reporting. Given that this is the first analysis of its kind into the prevalence of students who are DB, it is important to consider the implications and limitations of the current findings along with the foundation these results lay for more in-depth future research.
Connections Between Sensory Disability Professionals and Student Prevalence
Eligibility for special education services should be determined by knowledgeable and highly trained professionals. Thus in best practice, the eligibility team for students who are DB should include, at minimum, the family & student, TVI, TDHH, school psychologist, school administrator, general education teacher, special education teacher, and at least one person formally trained in deafblindness and the unique needs of the student (i.e., specific communication methods and instructional methodologies, development of children who are DB, assessment, and program implementation; Ferrell et al., 2014; Luckner et al., 2016; Parker et al., 2012; Riggio, 2009; Riggio & McLetchie, 2008; Wiley et al., 2016). Unfortunately, few education personnel are extensively trained in deafblindness and/or DB strategies. Lack of personnel preparation for teachers specific to deafblindness has long been reported as a concern (Blaha et al., 2009; Bruce, 2007; DeMario & Heinze, 2001; Huebner et al., 1995; Ludlow et al., 2005; McLetchie & MacFarland, 1995). Only three states in the United States (IL, TX, and UT) recognize TDBs as an endorsement or certification. Given the limited number of DB professionals, eligibility teams may rely on any team members trained in at least one sensory disability area.
Requiring a TVI to Participate in Eligibility Decisions
Results of the current analysis show that when a state’s DB eligibility criteria explicitly required the participation of a TVI in an eligibility team meeting, there was an increase in the number of students identified as DB. Requiring a TDHH did not correlate with the prevalence of students identified as DB. One reason for this correlation could be that preservice training programs for TVIs are more likely than TDHH training programs to include training in multiple disabilities and deafblindness. Teachers of the visually impaired report feeling at least twice as prepared as TDHH to support students with DB after completing their personnel preparation program (26% vs. 10%; Correa-Torres et al., 2021).
In the current analysis, states’ DB and VI eligibility criteria components were considered for analysis. The authors wanted to consider eligibility criteria from all three sensory disability (DB, VI, DHH) categories because (a) most students who are DB are not formally labeled as such, and (b) 17 states require students to be eligible in the VI and DHH categories before DB can be considered (Travers & Schles, 2023). Not having DHH eligibility criteria is a limitation of the current analysis. Nevertheless, it is interesting that the acuity thresholds in the VI eligibility criteria (not the acuity thresholds in the DB criteria) correlated to the number of students in the NCDB Child Count. While not statistically correlated to each other in the model, in practice, it is easy to assume that perhaps requiring a TVI at the eligibility meeting allows for a clearer interpretation of acuity data and an understanding of the impact of the student’s vision on their learning needs. Of note, when discussing acuity for students with VI or DB, are the 2014 and 2017 OSEP released Dear Colleague Letters discussing visual impairment eligibility (Musgrove, 2014; Ryder, 2017). The letters stated that students with any type of visual impairment should be identified as such, and without specific modifiers limiting the types of visual impairments that could qualify a student for special education services. Unfortunately, aspects of both letters are unclear. While they state any type of visual impairment may qualify a student for services, they do not quantify or describe what is a visual impairment. As such, many have interpreted these letters to mean that any specific measure, including acuity (e.g., 20/70), cannot be included in special education eligibility criteria, while others maintain that some type of tangible definition is needed.
TDHH Preparation Programs and Deafblind Eligibility
Results from this study indicated that fewer students were identified as DB when a training program for TDHHs existed in their state. While the specific reason for this correlation is unknown, a few theories are worth exploring. First, TDHH training programs historically have a strong focus on how to support students who are deaf or hard of hearing without additional or significant disabilities and limited to no training in deafblindness or multiple disabilities (Borders & Bock, 2012; Bruce et al., 2008; Correa-Torres et al., 2021; McLetchie & MacFarland, 1995). As a result, TDHH may feel or be unprepared to support students who were DB because the majority of these students have significant support needs (i.e., 87% of the population has one or more additional disabilities; NCDB, 2020).
Conversely, having fewer students who are DB identified in a state with a TDHH training program could be because TDHHs are more (rather than less) equipped to understand the functional implications of a student being deaf or hard of hearing. With this knowledge, they could provide input that a label of deafblindness is inappropriate for a specific student, leading to an appropriately lower number of students being identified as DB. More exploration into this issue is needed, given the fact that the presence of a state having TVI teacher preparation program correlated with a high number of students with VI (Schles & McCarthy, 2022) and an increase in graduates trained in learning disabilities correlated with more students with learning disabilities identified in a state (Noel & Fuller, 1985).
Implications of Differing Population Data for Students Who Are Deafblind
Different statistical models were developed to explore correlations between state eligibility criteria and three different ways to measure the prevalence of students who were DB. Only the model using the NCDB Child Count resulted in any statistically significant findings. No correlations were identified when exploring models that included the OSEP Child Count data. It is well established that the OSEP Child Count is not an accurate count of students who are DB (Herbster, 2015; Müller, 2006; Purvis & Schalock, 2014; Weber, 2009), which is why the NCDB Child Count was established in 1986 (NCDB, 2020). Many have noted the limitations of the OSEP Child Count data because it is only a count of students with a primary special education disability label, and not all the students receiving special education services due to a specific disability (e.g., Barton et al., 2016; MacFarlane & Kanaya, 2009; Mandell & Palmer, 2005; McLaughlin & Owings, 1992; Schles & McCarthy, 2022). Despite the limitations of the OSEP Child Count, only Schles and McCarthy (2022) conducted analyses of the prevalence of students with disabilities using a count other than OSEP Child Count. Similar to the results in the current study, Schles and McCarthy (2022) found different eligibility criteria and state factors correlated to the prevalence of students with VI whether they were looking at OSEP Child Count (primary-disability only), or a total count of students with VI (regardless of students’ primary disability label).
Limitations
There are limitations to the current analysis, which should be considered along with the results. First, states’ eligibility criteria in the IDEA categories of deafness and hearing impairment were not included, only deafblindness and VI. Since one variable from the VI eligibility criteria (visual acuity threshold) and if a state had a TDHH preparation program were statistically significantly correlated to NCDB Child Count, it stands to reason that there may be additional variables related to deafness and/or hearing impairment that also correlate to the prevalence of students who are DB. To address this gap, efforts should be made to collect and analyze DHH eligibility criteria. Once data are available, further analysis is needed to better understand whether or how the prevalence of students who are DB correlate to DHH eligibility criteria. Furthermore, there are likely factors related to special education identification and prevalence of students with deafblindness that were not captured or included in analysis. There are factors which may be important, however are hard to quantify across states, such as ease of access to early intervention services, variations in state administration policies or structures, and the activeness of family or consumer group support organizations. Last, the current analysis covers only the 2018–2019 school year. Additional analysis should be conducted across other school years to see whether patterns emerge.
Next Steps and Implications
Due to differences in eligibility criteria and factors across states, students’ states of residence matters for special education eligibility decisions around deafblindness. While more or less 40 students with DB in a state may seem small (e.g., the difference between if a state does or does not have a TDHH training program), this is a notable impact for service providers and students who are DB. One clear takeaway from the results is the correlation between sensory disabilities professionals and increased prevalence (TVIs) or decreased prevalence (presence of university programs for TDHH) of students who were DB. More exploration is needed into these correlations to better understand the factors at play.
There are a few clear next steps for researchers and policymakers. First, the current analysis should be repeated across different school years to identify whether the current results hold and whether patterns emerge. Next, a deeper exploration is needed to understand how TVIs and TDHHs are taught to identify and support students who are DB and whether differences or trends emerge between the two professions. Investigating the availability of professional development options for TVIs and TDHHs about deafblindness and the impact of such training on the identification of students who are DB could provide additional data that may impact any identified trends. Correa-Torres et al. (2021) found that only 62% of educators had access to professional development related to deafblindness, which is not enough. In addition, as teacher education models continue to move from in-person to distance education models, it would be interesting to observe whether the presence or absence of a TDHH or TVI preparation program in the state correlates to the prevalence of students who are DB. Does having a teacher preparation program in a state lead to a higher concentration of local professionals from program alums, or could it be the presence of an active university preparation program as a resource to the community? Does the state-level impact of having a DB training program disappear or increase if the program is online, with attendees located across the United States rather than physically located on a college campus?
As few professionals are highly trained in deafblindness in schools, additional research could explore the influence of technical assistance programs most likely to support educators. Every state has a deaf-blind project (SDBP) providing technical assistance to IDEA Part B and C professionals and families. The level of direct and indirect services varies across SDBPs (Daley et al., 2017; NCDB, n.d.). Although they do not provide direct services to students in schools, SDBP staff have extensive knowledge of deafblindness and can provide input about the implications of deafblindness on childhood development. As a result, SDBPs often are the primary support to school staff (including TVIs, TDHH, interveners and paraeducators, speech language pathologists, occupational therapists, physical therapists, etc.; NCDB, n.d.) for professional development and technical assistance regarding deaf-blindness and DB-specific strategies (Daley et al., 2017; NCDB, n.d.). The differences between SDBPs are not yet well documented or easy to quantify, though, given their potential influence and support, they are worth exploring in future research. In addition, gathering data about SDBP participation in identification, function on the eligibility team and IEP planning could clarify any impact on identifying DB students.
Footnotes
Acknowledgements
We would like to thank Robbin Bull for her work in the early stages of this project.
Declaration of Conflicting Interests
The author(s) declared no potential conflicts of interest with respect to the research, authorship, and/or publication of this article.
Funding
The contents of this manuscript were developed in part under a grant from the U.S. Department of Education, #H326T180026. However, those contents do not necessarily represent the policy of the U.S. Department of Education, and you should not assume endorsement by the Federal Government. Project Officer, Susan Weigert.