
Abstract
Curriculum-based measures (CBMs), which allow educators to monitor progress over time and make instructional decisions based on student performance, represent a fixture of general approaches to reading and data-based instructional frameworks. However, evidence supporting the use of CBM for students with intellectual disabilities is limited. This study evaluated the criterion validity of a reading CBM battery. Multiple CBM and standardized criterion measures were administered to elementary-age children (N = 56) with intellectual disabilities. Inferential analyses identified numerous domain-specific correlations between CBM and criterion measures; however, no single CBM emerged as a more effective predictor of reading performance. Findings provide qualified support for the use of CBM with children who have intellectual disabilities.
Reading intervention and assessment are increasingly associated with use of curriculum-based measures (CBM). Unlike traditional standardized measures or mastery measures developed by instructors, CBMs are tests of discrete academic skills (e.g., reading fluency and number identification) designed to be administered repeatedly to assess long-term student performance and guide instructional decisions (King et al., 2022; Tindal, 2013). CBM is used as a universal screening and progress monitoring tool within school-wide multi-tiered systems of support (MTSS) frameworks to allocate educational resources (Van Meveren et al., 2020). A related use of CBM is data-based individualization (DBI; Fuchs et al., 2021), which entails developing a goal for a student based on performance norms and the student’s level of performance and adjusting instruction based on the student’s progress. Sensitivity to changes in student behavior is one important feature of CBM; these tools may align closely with intervention procedures, providing a more efficient test of the effectiveness of instruction relative to larger, standardized measures (King et al., 2022).
CBM is of particular importance for instructional planning for students with critical reading needs, such as students with intellectual disabilities (ID; IQ scores below 70 or 75 coupled with adaptive behavior deficits). These learners have well-documented challenges associated with developing reading skills (e.g., Channell et al., 2013). Contemporary work in the field of reading instruction nonetheless demonstrates that students with ID can make critical improvements in reading with direct and explicit instruction (e.g., Lemons et al., 2018).
Increased attention to developing effective literacy instructional strategies for learners with ID necessitates comparable attention to measuring their skill development over time. That is, routine assessment is a critical aspect of DBI (e.g., Lemons et al., 2014, 2018) and while the reading intervention literature for students with ID is still limited, the relevant research on whether CBMs are appropriate tools for use with these learners is decidedly scanter. The few studies in which researchers employed CBM as a metric of reading progress (e.g., Allor et al., 2010; King et al., 2022; Lemons et al., 2013) suggest progress on CBM emerges slowly or is otherwise undetectable when compared with proximal measures of performance. This is in stark contrast to the broader CBM literature, which includes considerable evidence for the validity of these measures as screening and progress monitoring tools for typically developing students, as well as those who are at risk for reading difficulties or who have specific learning disabilities (e.g., Fewster & MacMillan, 2002; Reschly et al., 2009). The National Center for Intensive Intervention (NCII, 2019) likewise evaluates the technical adequacy of CBM for general populations as part of their mission to disseminate effective practices, but provides limited insight into suitability of CBM for children with ID.
Studies employing CBM as measures of intervention effectiveness of children with ID (e.g., King et al., 2022) have conducted severely underpowered correlation analyses among small samples (e.g., N = 17) that provide qualified support for validity of reading CBM. However, studies specifically examining the validity of CBM for students with ID have primarily involved older individuals. Hosp et al. (2014) assessed the criterion of a variety of subject-specific CBM (e.g., reading, math, and writing) among postsecondary students with ID (N = 41) enrolled in a 2-year university certificate program. Oral reading fluency (ORF) and maze comprehension CBM results were correlated with the broad reading, reading fluency, and passage comprehension scores of the Woodcock–Johnson Tests of Achievement (WJTA). Analysis revealed moderate-to-strong correlations (e.g., .30–.75) between CBM and criterion measures; however, subsequent analyses (i.e., Meng’s z test) did not identify significant differences in the ability of ORF and maze measures to predict performance on the WJTA. A direct replication featuring the same measures and analyses (Hosp et al., 2018) and a separate sample of postsecondary students with ID (N = 45) produced similar results, with reading CBM predicting performance on criterion measures without demonstrating differences in predictive capability.
Purpose
Much of the research supporting the use of CBM stems from work with children with learning disabilities and other populations who do not share the cognitive profile of individuals with ID (Snyder & Ayres, 2020). There is, therefore, little evidence to support the suitability of CBM as an assessment or decision-making tool for elementary and middle school students with ID. Research validating the use of CBM is needed if children with ID are to be responsibly included in large-scale education initiatives predicated on CBM (Hosp et al., 2018). Demonstrating the validity of reading CBM for children with ID will likewise support the use of potentially effective instruction among this population (e.g., DBI; Fuchs et al., 2021).
One approach to validating CBM involves comparing outcomes to standardized assessments with established validity (i.e., criterion measures). The present study examined the criterion validity of CBM in reading for elementary students with ID. Like Hosp and colleagues’ previous work (2014, 2018), we aimed to study whether CBM outcomes were correlated with and predicted performance on domains encompassed by more comprehensive assessments. Guiding questions included (a) To what extent are the CBM outcomes correlated with the criterion measures, and are those correlations significant?; and (b) Are some CBM outcomes significantly better at predicting performance on criterion measures than others?
Method
Participants and Setting
Following approval by a university-affiliated institutional review board (IRB) and multiple district IRBs, potential participants were recruited from elementary and middle schools (n = 33) across districts (n = 8) in four southern states as part of a separate reading intervention study for struggling readers. Eligible participants for this study: (a) were diagnosed with ID; (b) spoke fluent English; (c) used speech as their primary form of communication; (d) possessed hearing and vision faculties sufficient to complete administered assessment; (e) had access to a paraprofessional for 30 to 40 min for 4 days per week; and (f) repeated a model of at least one letter name, sound, or word during screening. We excluded students able to read 17 words per minute (wpm) with 90% accuracy or 60 wpm with 80% accuracy. Also excluded were students who required intensive behavior support before academic intervention would be appropriate. The families of participants received a U.S. $50 gift card as an incentive for participating. The reading intervention study recruited 92 students. Due to the issues with data collection, attendance, and an inability to confirm a diagnosis of ID, we retained a sample of 56 for this study. Parents completed a demographic survey prior to students’ completion of the test battery. Of the members of the sample who reported their age (98%), average age was 9.2 years (range = 6–15; SD = 2.3). The participant who did not report their age attended an elementary school. A description of additional demographic variables appears in Table 1.
Demographics of Participants in Study of CBM and Children with ID.
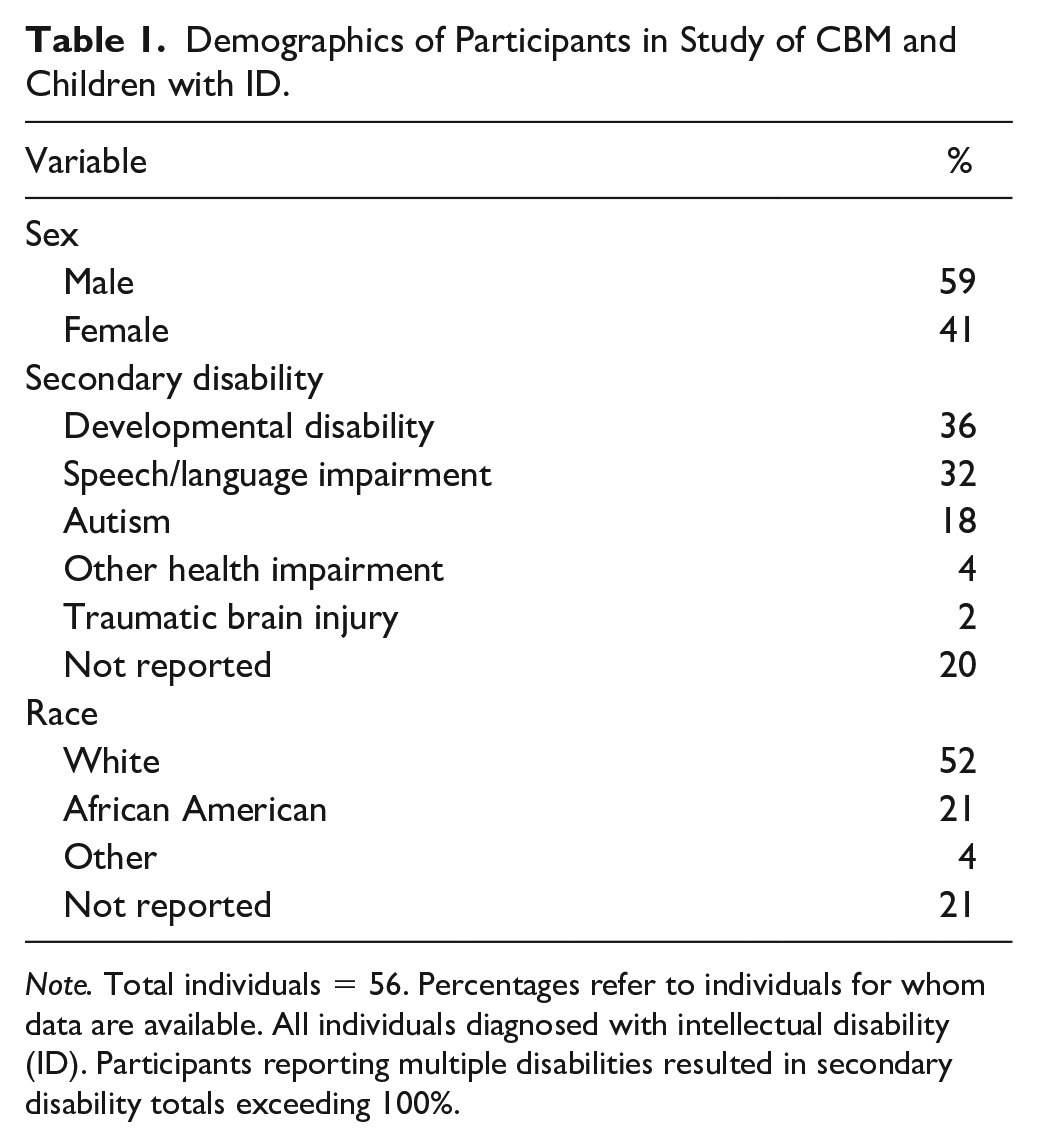
Note. Total individuals = 56. Percentages refer to individuals for whom data are available. All individuals diagnosed with intellectual disability (ID). Participants reporting multiple disabilities resulted in secondary disability totals exceeding 100%.
Test administrators included three graduate students in special education and three staff members affiliated with the project supervised by a doctoral-level faculty member with expertise in reading for individuals with developmental disabilities. Test administrators received training on administration and were required to score a mock student’s answer script across all assessments with a minimum of 90% accuracy. Training continued until administrators met criterion.
Measures
Criterion Measures
Participants completed two subtests of the Test of Word Reading Efficiency, Second Edition (TOWRE-2; Torgesen et al., 2012). The sight word efficiency (SWE) subtest required students to read as many nondecodable sight words as possible in 45 seconds. The phonemic decoding efficiency (PDE) subtest required students to read as many phonemically regular nonwords as possible in 45 seconds. Alternate form reliability for the SWE (.91) and PDE (.92) is acceptable (Tarar et al., 2015). The TOWRE-2 demonstrates excellent classification accuracy based on chronological age and reading ability. The norming sample of the TOWRE-2 was generally consistent with estimates of national population prevalence and accounted for ID.
Participants also completed the print knowledge (PK) and phonological awareness (PA) subtests of the Test of Preschool Early Literacy (TOPEL; Lonigan et al., 2007). The PK subtest encompasses items (n = 36) related to concepts of print, letter and word discrimination, letter–name identification, and letter–sound identification. The PA subtest assesses blending, segmenting, and phonemic awareness using 27 items. Internal consistency for the TOPEL is acceptable (range = .86–.96; Wilson & Lonigan, 2010). The TOPEL is highly correlated with alternative standardized literacy assessments and predictive of overall reading ability (Lonigan et al., 2007). The standardization sample for the TOPEL was stratified on the basis of numerous demographic variables, including disability status (Madle & Owens, 2010).
As the final standardized measure, participants completed the Woodcock–Johnson IV (WJIV). Specific subtests included the letter–word identification (LWID), spelling, and passage comprehension. For LWID, students needed to identify letters and words. The spelling test assessed the ability to print letters and spell words. During the passage comprehension assessment, students identified pictures corresponding with words. The test also included a cloze procedure, in which students read a sentence and determined the correct word to place in blank spaces. Split-half reliability across WJIV subtests is acceptable (.84–.94); in addition, all subtests have adequate content validity (Villarreal, 2015). The WJIV has a long history of application among individuals with ID and is an accepted test of achievement among this population (Cook, 2018).
CBMs
Administered AIMSweb assessments (Shinn & Shinn, 2002) included measures of letter-sound fluency (LSF), letter-naming fluency (LNF), phoneme segmentation fluency (PSF), nonsense word fluency (NWF), and ORF as well as word identification fluency (WIF) developed by Fuchs et al. (2004). For LNF, students named randomly ordered letters. Test–retest reliability is acceptable (i.e., >.81; Clemens et al., 2017). The LSF measure required students to provide letter sounds without prompting when presented with randomly ordered lowercase letters. Test–retest reliability is acceptable (.80; Elliott et al., 2001). Phoneme segmentation fluency required students to segment words into their smallest component phonemes, with the score reflecting the number of sound segments stated. Test–retest reliability is .85 (O’Hearn, 2013). For NWF, the measure addressed students’ ability to decode phonemically regular nonwords, with a point awarded for each sound correctly identified. Alternate form reliability is acceptable (.83). Participants completed 3 first-grade level AIMSweb ORF passages to measure students’ ability to accurately and fluently read connected text. Alternate form reliability exceeds .93 (NCS Pearson, 2012). The WIF measure presented 50 high-frequency words randomly sampled from a 100-word Dolch list (Fuchs et al., 2004). Alternate test form reliability is .97.
All CBMs were scored in two ways: raw number of correct items and percentage correct. The raw number of correct items represented the total number of correct items a student obtained on each individual CBM task during the allotted time, regardless of the number of items attempted. Percentage correct was calculated by dividing the number of correct by the total value of items attempted (i.e., correct plus incorrect items), and multiplying by 100. All measures were administered one time except for the ORF task, which was administered three times using three separate forms. For our analyses, we selected each participant’s median ORF scores.
Procedures
Project staff administered and scored reading assessments for participants during in-person, 1:1 sessions in an isolated setting within the participants’ schools. Assessments were administered in a single session separated by frequent breaks. Multiple ORF probes were administered within the same session. We scheduled assessment sessions during noninstructional time based on the availability of the student. If a student could not attend a scheduled session, project staff rearranged a meeting with a cooperating special educator or paraprofessional. Including breaks, the duration of all assessment sessions was approximately 90 minutes per student. All assessments were video-recorded and administered in accordance with procedures specified in relevant test administration manuals. A secondary observer reviewed 100% of all data collection sheets for scoring accuracy before being entered in a spreadsheet for analysis. Disagreements were discussed and reconciled prior to conducting the analysis.
Interobserver Agreement
Project staff involved in test administration reviewed an assessment protocol. Each assessor was required to score a mock script of student responses across responses with at least 90% accuracy before independently working in the field. Following data collection, a secondary observer randomly selected video-recorded assessment sessions for 21.4% (n = 12) of the students in the sample for the purposes of collecting interobserver agreement (IOA). Total agreement for each measure was determined by dividing the lowest value of correct responses determined by an observer by the higher observed value and multiplying by 100%. Acceptable levels of agreement were obtained for LNF (M = 94.28%; range = 75%–100%; SD = 7.47), LSF (M = 95.1%; range = 80%–100%; SD = 6.82), PSF (M = 88.80%; range = 35.9%–100%; SD = 20.74), NWF (M = 92.17%; range = 47%–100%; SD = 15.53), WIF (M = 96.58%; range = 75%–100%; SD = 7.22), and ORF (M = 96.58%; range = 75%–100%; SD = 7.22). Disparities were resolved via consensus.
Data Analysis
Our data analysis plan involved several steps. First, we calculated descriptive statistics and determined whether the data met assumptions for subsequent analyses (i.e., normality and lack of outliers). We then calculated bivariate correlations between the CBM to examine the relations between the outcomes. Although primarily associated with regression, we interpreted large correlations (i.e., r ≥ .80) as potential evidence of collinearity with the potential to inflate subsequent analyses (Kim, 2019). We calculated bivariate correlations separately for the two CBM outcome types (i.e., raw number of correct and percentage correct).
Next, we made a priori pairings of criterion measures (i.e., TOWRE, TOPEL, and WJIV) and content-appropriate CBM metrics (Hosp et al., 2014, 2018) For example, NWF, WIF, and ORF were paired with the SWE subtest of the TOWRE due to their overlap with sight word reading (e.g., Barth et al., 2014). Likewise, we paired ORF CBM with WJIV passage comprehension subtest due to the established relationship between fluency and comprehension (e.g., Tighe & Schatschneider, 2016). We made the following pairings between criterion measures and CBMs: TOWRE SWE would be predicted by NWF, WIF, and ORF; TOWRE PDE would be predicted by LSF, LNF, and PSF; TOPEL PK would be predicted by LSF and LNF; TOPEL PA would be predicted by NWF and PSF; WJIV LWID would be predicted by WIF, LNF, and ORF; WJIV spelling would be predicted by LSF, LNF, and PSF; and WJIV passage comprehension would be predicted by the ORF and WIF. To answer our first research question, we calculated bivariate correlations between specific criterion measure—CBM pairings, examining both the magnitude and statistical significance of the correlations. We ran correlations between the criterion and CBMs for the raw correct and percentage correct outcomes. Results were interpreted relative to two separate criteria. For the purposes of providing initial evidence of validity, we considered correlations equal to or greater than .50 adequate for evidence of validity, consistent with prior research (e.g., Good et al., 2013). Although our small, nonrepresentative sample is not consistent with the validity guidelines of the NCII, we also noted when coefficient guidelines met the more stringent NCII validity criterion of .60.
Finally, to answer our second research question, we conducted a Meng’s z (Meng et al., 1992) to examine whether one of the CBMs paired with the criterion measure was significantly better at predicting performance on that criterion measure. Meng’s z tests the correlations between two independent variables and one dependent variable, CBMs and the criterion measure in the present study. Calculations involve the correlations between the dependent (criterion) variable and the first independent variable
Results
Descriptive statistics appear in Table 2. We assessed skewness and kurtosis for all measures. Hair et al. (2010) suggest skewness and kurtosis values falling between ±2 and ±7, respectively, are acceptable for the purposes of our analyses. Most measures demonstrated appropriate levels of skewness and kurtosis, with the exception of raw scores for WIF, PSF, and ORF. These values are likely due to the high degree of variability within our sample (see Table 2). We decided to conduct the analyses without removing outliers or measures for several reasons. First, skewness and kurtosis minimally exceeded the recommended values. Second, reducing the size of the sample through the elimination of outliers would diminish the ability of our analyses to accurately identify significant effects (Hosp et al., 2018). Finally, variability is commonly observed in measures of reading performance for students with ID (e.g., King et al., 2022).
Descriptive Statistics for Criterion and CBMs.
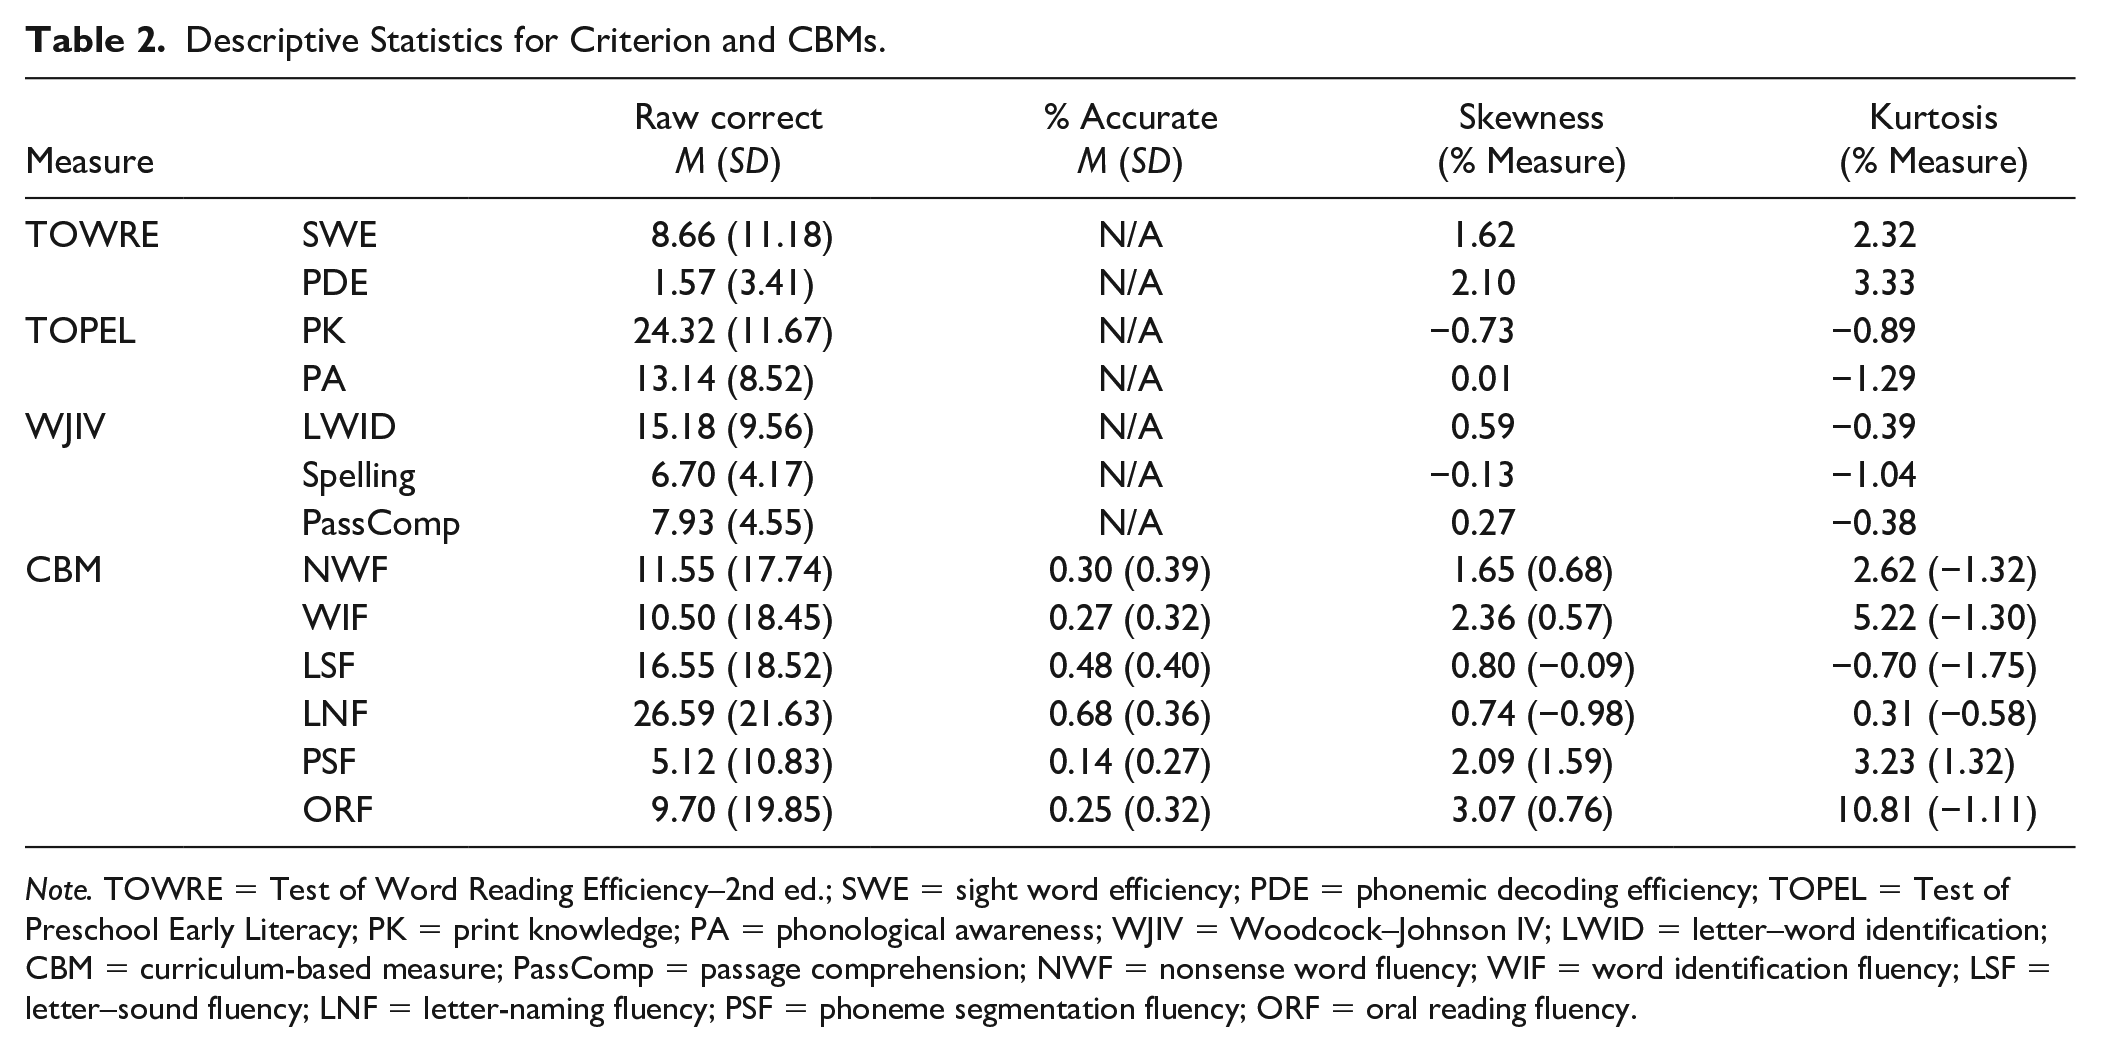
Note. TOWRE = Test of Word Reading Efficiency–2nd ed.; SWE = sight word efficiency; PDE = phonemic decoding efficiency; TOPEL = Test of Preschool Early Literacy; PK = print knowledge; PA = phonological awareness; WJIV = Woodcock–Johnson IV; LWID = letter–word identification; CBM = curriculum-based measure; PassComp = passage comprehension; NWF = nonsense word fluency; WIF = word identification fluency; LSF = letter–sound fluency; LNF = letter-naming fluency; PSF = phoneme segmentation fluency; ORF = oral reading fluency.
Bivariate correlations between the CBM outcomes—for both raw number correct and percentage correct—are reported in Table 3. Correlations for the raw number correct outcomes are reported above the diagonal, while correlations for the percentage correct outcomes are reported below the diagonal. Regarding raw correct, all outcomes were positively correlated, at least moderately so. All correlations were statistically significant, except for the correlation between LNF and PSF in the raw number correct metric. Correlations ranged from .30 to .96. The lowest observed correlation was between PSF and LNF (r = .30). Three correlations exceeded the .80 threshold indicative of collinearity: WIF and NWF (r = .81), LSF and NWF (r = .84), and ORF and WIF (r = .96).
Correlations Between CBM Outcomes for Raw Number Correct and Percentage Correct.
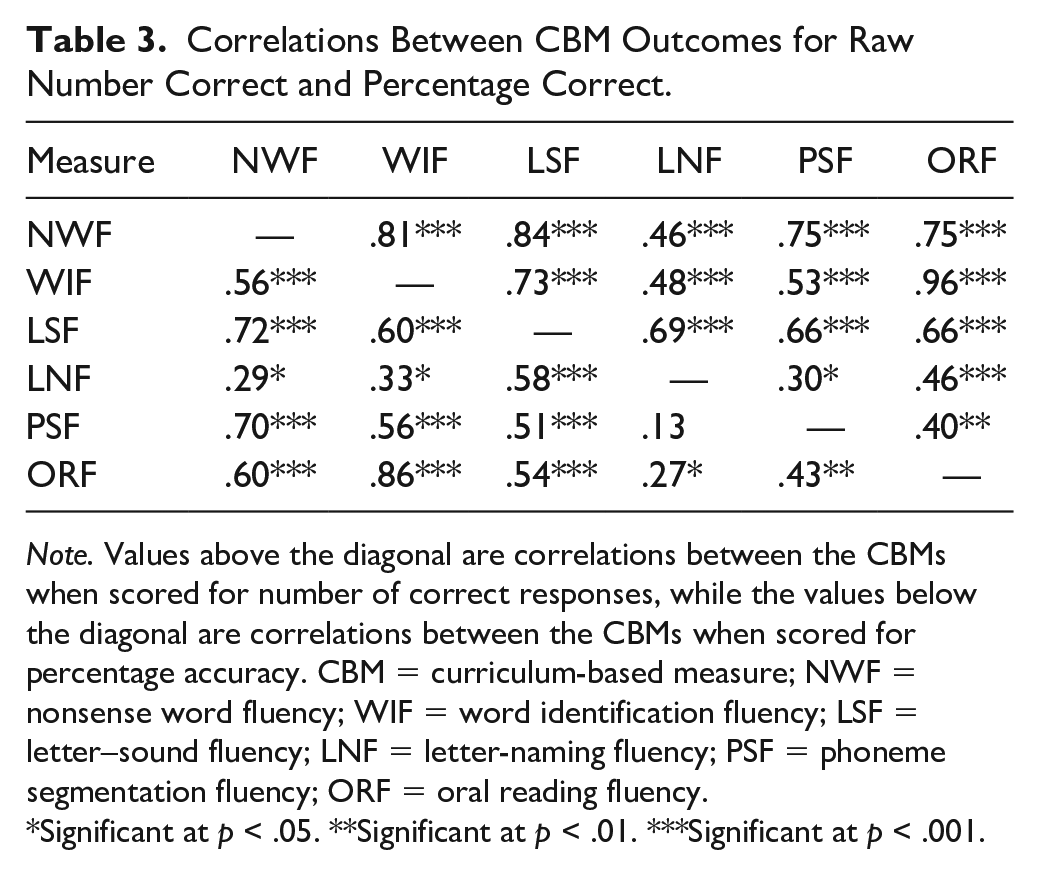
Note. Values above the diagonal are correlations between the CBMs when scored for number of correct responses, while the values below the diagonal are correlations between the CBMs when scored for percentage accuracy. CBM = curriculum-based measure; NWF = nonsense word fluency; WIF = word identification fluency; LSF = letter–sound fluency; LNF = letter-naming fluency; PSF = phoneme segmentation fluency; ORF = oral reading fluency.
Significant at p < .05. **Significant at p < .01. ***Significant at p < .001.
Correlations for the percentage correct outcomes showed a similar pattern. Namely, all outcomes were positively correlated and ranged from .13 to .86. Like the raw number correct correlations, the PSF and LNF correlation was the smallest (r = .13), and this was the only correlation that was not statistically significant. Also akin to the previous results, the WIF and ORF correlation for the percentage correct outcomes exceeded the .80 threshold (r = .86), but the WIF and NWF (r = .60) and LSF and NWF (r = .58) correlations did not.
Correlations Between Criterion and CBMs
Correlations between the criterion and CBMs for the raw number correct outcomes are reported in Table 4. Of the total number of associations assessed (n = 17), 100% of raw scores met the .50 threshold for adequate validity. Fewer (70.59%; n = 12) met the numeric criterion of NCII. All correlations were positive, moderate-to-strong in strength (range: .54–.93), and statistically significant. The strength of relations between the CBMs and their associated criterion measure varied across the criterion measures. For the SWE subtest of the TOWRE, WIF and ORF were the strongest predictors. For the PDE subtest of the TOWRE, LSF and PSF were the strongest predictors. The PK and PA subtests of the TOPEL were both associated with two CBMs (i.e., LSF and LNF, and NWF and PSF, respectively). In each case, both predictors of the PK and PA subtests yielded similar correlations (range: .58–.66). The WIF and ORF measures were the strongest predictors of the LWID subtest of the WJIV, and LSF and LNF were the strongest predictors of performance on the spelling subtest of the WJIV. The WIF outcome yielded a strong correlation with the WJIV passage comprehension measure (r = .67), as did the ORF outcome (r = .59).
Validity Correlations for CBM Raw Correct and Percentage Accurate Correct Outcomes.
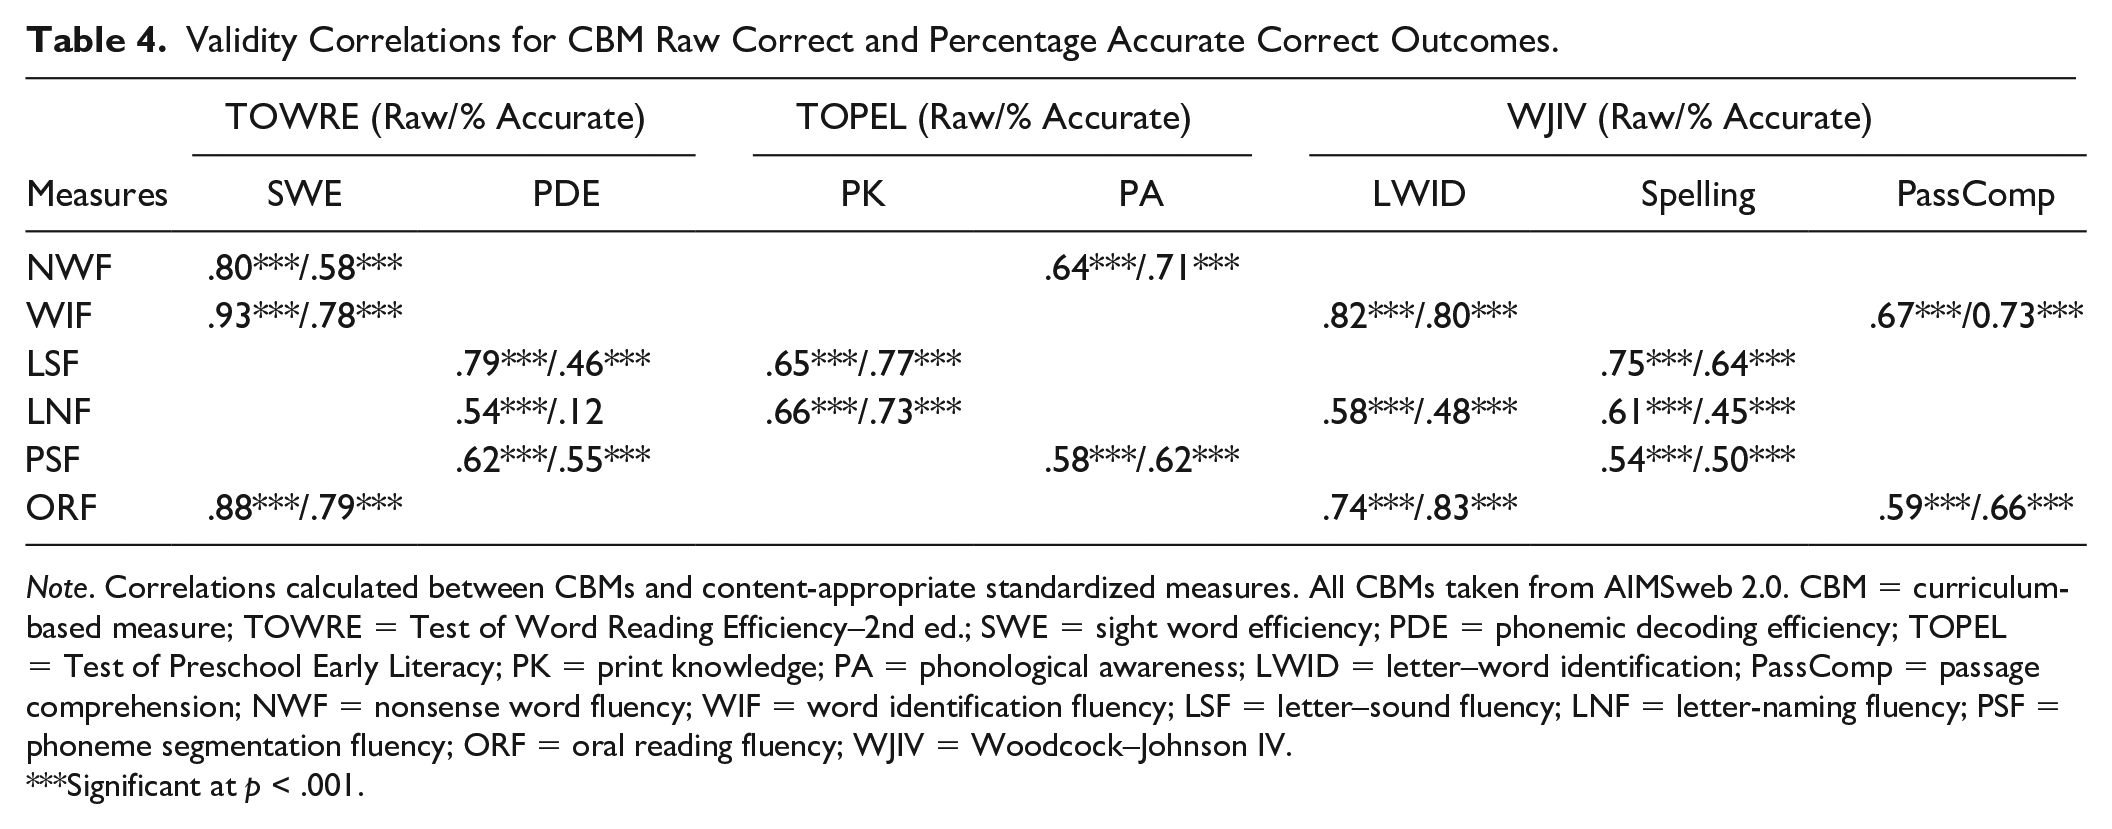
Note. Correlations calculated between CBMs and content-appropriate standardized measures. All CBMs taken from AIMSweb 2.0. CBM = curriculum-based measure; TOWRE = Test of Word Reading Efficiency–2nd ed.; SWE = sight word efficiency; PDE = phonemic decoding efficiency; TOPEL = Test of Preschool Early Literacy; PK = print knowledge; PA = phonological awareness; LWID = letter–word identification; PassComp = passage comprehension; NWF = nonsense word fluency; WIF = word identification fluency; LSF = letter–sound fluency; LNF = letter-naming fluency; PSF = phoneme segmentation fluency; ORF = oral reading fluency; WJIV = Woodcock–Johnson IV.
Significant at p < .001.
Correlations for the same criterion-CBM pairs for the percentage accurate outcomes are reported in Table 4. Most correlations (82.35%; n = 14) met the .50 threshold for adequate validity, with only 58.82% (n = 10) consistent with the NCII threshold. The correlations are all positive, ranging from weak to strong (range: .12–.83). All correlations were statistically significant, except for the correlation between the PDE subtest of the TOWRE and LNF. Percentage accurate WIF and ORF yielded the strongest correlation with the SWE subtest of the TOWRE. The LSF and PSF values yielded the strongest correlation with the PDE subtest of the TOWRE. The correlations between the CBMs and the PK and PA subtests of the TOPEL are strong. The WIF and the ORF measures were the strongest predictors of performance on the LWID subtest of the WJIV. The LSF and PSF values were the strongest predictors of performance on the WJIV spelling subtest. We observed positive, strong correlations between the WJIV passage comprehension subtest and the WIF and ORF measures (r = .73 and r = .66, respectively).
Difference Between Predictive Correlations
Meng’s z test results between correlation coefficients for criterion-CBM pairs for both raw number correct and percentage correct appear in Table 5. We observed significant predictions for only CBMs scored by raw number correct; all comparisons for the percentage accurate outcome were not significant. First, WIF was a significantly better predictor of performance on the SWE subtest of the TOWRE, the WJIV spelling subtest, and the passage comprehension subtest of the WJIV than was ORF. For the raw number correct outcome, LSF was a better predictor of the PDE subtest of the TOWRE than was the PSF subtest. The remaining comparisons were not statistically significant, suggesting that the CBM had equal predictive power to the criterion measure despite observed differences from the previous analytic step.
Results for Differences Between Predictive Validity of CBMs.
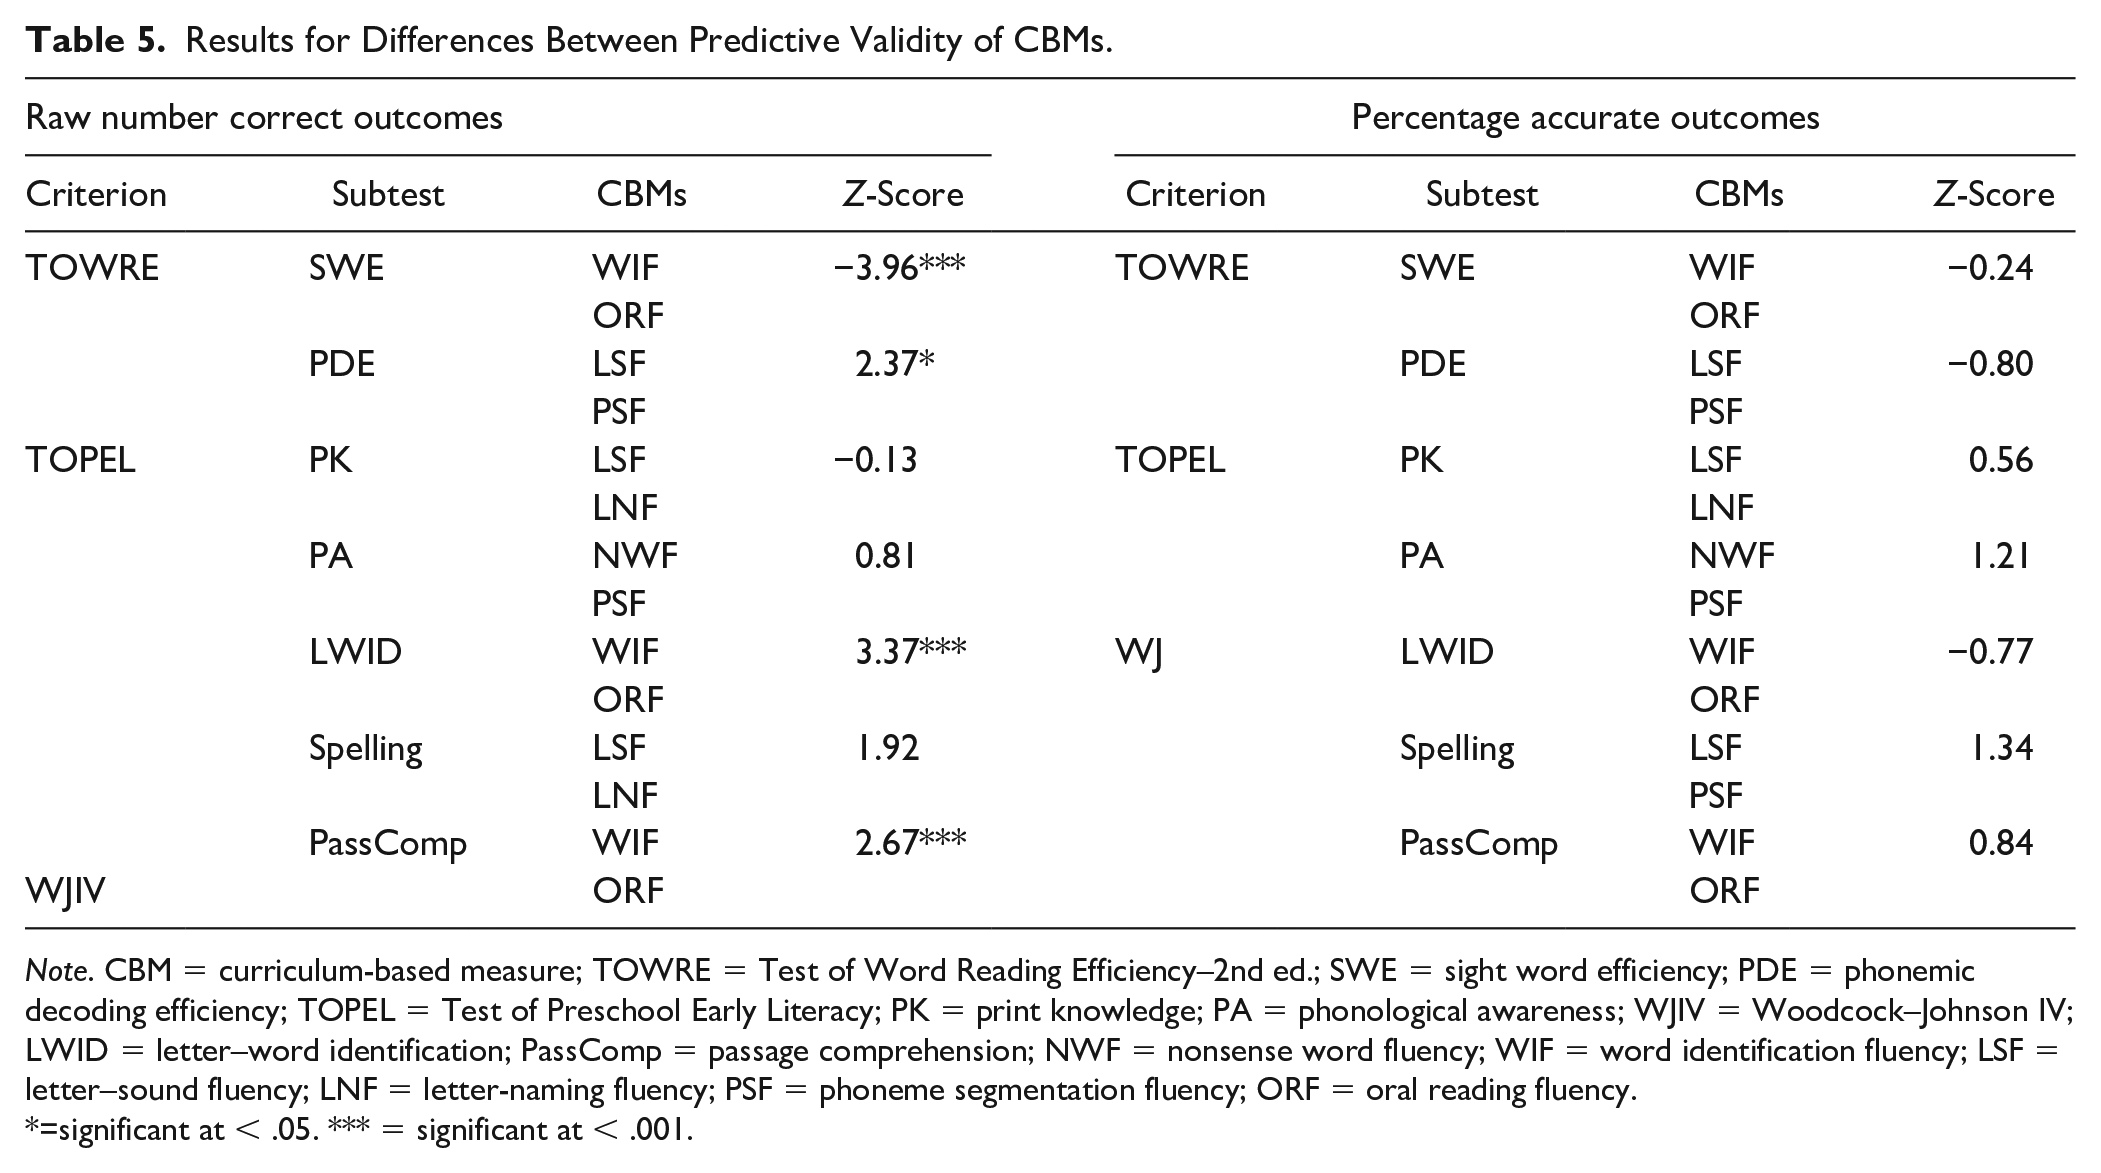
Note. CBM = curriculum-based measure; TOWRE = Test of Word Reading Efficiency–2nd ed.; SWE = sight word efficiency; PDE = phonemic decoding efficiency; TOPEL = Test of Preschool Early Literacy; PK = print knowledge; PA = phonological awareness; WJIV = Woodcock–Johnson IV; LWID = letter–word identification; PassComp = passage comprehension; NWF = nonsense word fluency; WIF = word identification fluency; LSF = letter–sound fluency; LNF = letter-naming fluency; PSF = phoneme segmentation fluency; ORF = oral reading fluency.
=significant at < .05. *** = significant at < .001.
Discussion
This study assessed the criterion validity of reading CBM for elementary-age children with ID. Analyses suggest that CBM were significantly correlated with domain-specific criterion measures. Specifically, the raw number of items correct represented a stronger predictor of performance than accuracy percentage. There were minimal differences in terms of predictive power between most CBMs to the criterion measures, regardless of the outcome metric (i.e., raw number correct or percentage accurate). Only four significant differences were identified: WIF was a better predictor than ORF for the SWE subtest of the TOWRE, the spelling subtest of the WJIV, and the passage comprehension subtest of the WJIV. In addition, LSF was a better predictor than PSF on the PDE subtest of the TOWRE for raw correct only. In particular, we observed no significant differences in prediction for all CBM comparisons with the percentage accurate outcome. Results provide support for the use of reading CBM among children with ID.
In addition to featuring a younger population, this study featured a larger sample and wider range of criterion measures than featured in previous studies (e.g., Hosp et al., 2014, 2018) Comparisons are further impeded by our emphasis on early reading CBM. Nonetheless, results across studies remain relatively consistent, with correlations indicative of an association between ORF and criterion measures of passage comprehension (i.e., >.60; see Hosp et al., 2018). Our findings are also consistent with previously observed moderate-to-strong correlations between early reading CBM (i.e., LSF, WIF, ORF, and FSF) and standardized criterion letter- and word-identification subtests (King et al., 2022). Taken together, this scholarship supports the continued use of reading CBM in research and practice involving children with ID.
Results of this study contribute to work establishing the link between CBM administered on a weekly to biweekly basis and conventional standardized measures used to assess reading progress in children with ID. This is important given the limited responsiveness of this population on measures thought to represent the acquisition of reading (e.g., Lemons et al., 2013)—that is, standardized assessments (King et al., 2022). Findings do not directly address the apparent lack of sensitivity of CBM to student progress, however (e.g., Allor et al., 2010).
With the exception of WIF and LSF, our analyses did not identify any of the CBM as a superior predictor of performance on criterion measures. This is consistent with Hosp and colleagues (2014, 2018) findings concerning the equivalence of reading comprehension CBM. However, Hosp et al. suggested that the lack of distinction between ORF and maze (i.e., a measure specifically designed to test comprehension) assessments as predictors of passage comprehension may stem from the small sample sizes used within their studies. When compared with ORF, our findings indicate WIF is a superior predictor of word identification and serves as an equivalent predictor of comprehension. Eliminating potentially redundant CBM could reduce the resources practitioners and students expend on assessment. The utility of assessing students with ID using direct measures of connected text (i.e., ORF) nonetheless warrants further examination.
Limitations
This study had several notable limitations. Validity is a multifaceted concept only partially addressed in this study. Additional work was needed to examine various forms of evidence needed to comprehensively evaluate validity. Due to the considerable burden associated with re-administrations of the assessment battery, we did not assess reliability—a prerequisite of validity—for the CBM. We also did not counterbalance the assessments to avoid sequence effects. Although we encourage authors to address these issues in future studies, extensive documentation supporting reliability of these assessments among general populations (e.g., Clemens et al., 2017) is supported by recent studies that attest to the test–retest reliability (.81–.95) of similar measures (e.g., DIBELS ORF; Good et al., 2013) for students with ID (King et al., 2022). Finally, several correlations, as noted, exceeded the .80 threshold associated with collinearity. However, the high correlations between NWF and NWF and NWF and LSF are inconsequential, as these measures were not paired for Meng’s z analysis. We did include ORF and WIF in Meng’s z analysis despite the strength of the correlation because of the theoretical alignment between the measures. Findings should, therefore, be interpreted with caution.
While participant ID was verified for included participant based on parental reports and school documentation, we did not collect IQ scores at any point during the study and were unable to assess the influence of cognitive ability on the relationship between measures. Likewise, the modest sample size did not permit an evaluation of performance based on specific disabilities. We also restricted participation to children whose communication, sensory, and behavioral strengths were most conducive to reading instruction. Consequently, their performance may not reflect the broader population of students with ID (Snyder & Ayres, 2020). Although drawn from several states, districts, and schools, we did not attempt to acquire a randomized, nationally representative sample. Consequently, our findings contribute to evidence supporting the use of CBM among children with ID, but are not sufficiently rigorous to satisfy standards of organizations such as the NCII (2019).
Implications for Practice
The results herein provide preliminary evidence of the appropriateness of CBMs for assessing the reading development of elementary-age students with ID. Our findings suggest that a range of CBM may be used to adequately predict reading performance in specific domains, which may have implications for type and number of CBM educators should administer in practice. From the perspective of a practitioner, this means that using CBMs to approximate students’ reading abilities is feasible, perhaps saving considerable time given the relative ease of administering, scoring, and interpreting CBM tools. In addition, practitioners may be able to save time in some instances by avoiding the administration of redundant tools—however, we hesitate to make this recommendation explicitly without further corroboration. In addition, the results indicate that the way in which the CBMs are scored—either as raw number correct or percentage correct—vary little in their prediction to larger, standardized assessments.
Future Directions
Results suggest that, for a specific population of students with ID, CBM may be appropriate for screening and instructional decision-making. However, additional research is needed to gauge the effect of modifications (e.g., extra time) frequently used for children with ID on the utility of CBM (Snyder & Ayres, 2020). Findings from this study pertain to children for whom modifications appear to be unnecessary, a population that does not fully represent the range of students who receive special education services (e.g., Lemons et al., 2013).
The results of this study should be not generalized to CBM that measure other academic skills (e.g., mathematics and writing). Hosp and colleagues (2014, 2018) demonstrated the usefulness of a CBMs for reading, writing, and mathematics for young adults with ID. The convergence of our findings with Hosp and colleagues’ should not presuppose a similar convergence for mathematics or writing CBM tools for elementary-age students in this population. Future research should explicitly validate those tools for these learners.
A related issue involves the extent to which both sampling and the reporting of demographic characteristics inhibit the examination of participant- or contextual-level variables on the efficacy of assessment and other factors relevant to instruction (King et al., 2022). Identifying large samples of students with ID, administering extensive assessment batteries, and other logistic challenges represent significant impediments to additional research in this area. Innovations in the analysis of smaller, single-case designs more commonly used to examine reading among populations who require intensive instructional supports may provide insight into variables that influence the effectiveness of reading instruction (Miočević et al., 2022).
Footnotes
Declaration of Conflicting Interests
The author(s) declared no potential conflicts of interest with respect to the research, authorship, and/or publication of this article.
Funding
The research described herein was supported by the Institute of Education Sciences, U.S. Department of Education, through grant R324A190240. The opinions expressed are those of the authors and do not represent the views of the Institute or the U.S. Department of Education.