
Abstract
Objectives:
To examine patterns in the timing and location of incidents of maritime piracy to see whether, like many urban crimes, attacks cluster in space and time.
Methods:
Data for all incidents of maritime piracy worldwide recorded by the National Geospatial Intelligence Agency are analyzed using time-series models and methods originally developed to detect disease contagion.
Results:
At the macro level, analyses suggest that incidents of pirate attacks are concentrated in five subregions of the earth’s oceans and that the time series for these different subregions differ. At the micro level, analyses suggest that for the last 16 years (or more), pirate attacks appear to cluster in space and time suggesting that patterns are not static but are also not random.
Conclusions:
Much like other types of crime, pirate attacks cluster in space, and following an attack at one location the risk of others at the same location or nearby is temporarily elevated. The identification of such regularities has implications for the understanding of maritime piracy and for predicting the future locations of attacks.
Introduction
Maritime piracy (hereafter, piracy) is not a new phenomenon, but until recently it was a rare offense. Rises in attacks and estimates to suggest that piracy may cost the global economy upward of $7 billion (Ploch 2010) per annum has attracted attention from scholars, the military and the United Nations alike. However, there is currently a dearth of empirical research on this topic. Instead, much of the research is qualitative (e.g., O’Meara 2007) or descriptive (e.g., Abbot and Renwick 1999; Vagg 1995) in nature, or has focused on how international law applies to this type of crime (e.g., Hong and Ng 2010; Ploch 2010; Treves, 2009).
Most of the quantitative research concerned with piracy has been conducted by Political Scientists and has tended to focus on macro-level explanations for variation in the frequency of incidents off the coastlines of different states. Consequently, what research there is has generally used the country-year (the count of events off the coastline of a particular country) as the unit of analysis. This work indicates that the risk of piracy is not evenly distributed across the worlds oceans, and scholars (e.g., Daxecker and Prins 2012; Hastings 2009) have, for instance, examined the relationship between the stability of states—taken as an indicator of a country’s likely ability to deal with the problem—and rates of maritime piracy off their coastlines. Such research suggests an association, with piracy being more prevalent off the coasts of weak states.
Like such studies, research concerned with patterns of urban crime originally focused on macro level explanations, with researchers examining trends at the country (e.g., Quetelet 1984) or city level (Shaw and McKay 1969). More recently (for a review, see Weisburd et al. 2009), however, scholars have increasingly focused on patterns at the micro level—both theoretically and empirically. In this article, we apply theories developed to explain spatial and space-time patterns of urban crime to the problem of maritime piracy and present associated empirical analyses. In the next section, we begin with a brief discussion of the pertinent literature as it applies to urban crime. We then discuss some of the existing research on maritime piracy and the particular context (policy and locational) within which such events occur. After deriving a set of expectations, we present a series of empirical analyses. Finally, we consider the theoretical and practical implications of the findings.
Space-Time Patterns of Urban Crime
In response to the observation that crime is not uniformly distributed in time (e.g., Falk 1952) or space (e.g., Cohen 1941; Quetelet 1984), ecological theories of crime suggest that studying the intersection of the routine activities (Clarke and Cornish 1985) of potential crime targets, offenders, and those who might intervene to prevent crime, can contribute to the understanding of crime patterns. For example, crime pattern theory (e.g., Brantingham and Brantingham 1993) emphasizes how offender mobility and legitimate routine activity patterns shape offender awareness of particular places which, in turn, informs their awareness of criminal opportunities. Moreover, that crimes are most likely to occur where offender awareness overlaps with criminal opportunities they are capable of exploiting, and where the perceived benefits of crime outweigh the perceived effort and risks (e.g., Clarke and Cornish 1985).
Motivated by such theories, a substantial body of scholarship has focused upon the characteristics of the locations where crimes occur, using data aggregated to some meaningful geography such as census blocks. For such studies, the focus of enquiry regards the setting in which crimes occur, and this is often examined independently of when offenses happen. However, an emerging body of research demonstrates that as well as examining spatial patterns, there is considerable value in analyzing the space-time dynamics of crime. Motivated by the observation that some homes are burgled many times while others remain unvictimized, in the early work (for a review, see Farrell 1995), researchers focused on the crime of burglary and this work showed that when a house is burgled, the risk to that home is substantially elevated for a short period of time (e.g., Pease 1998). Two classes of theory have been proposed to explain such patterns. The first are theories of risk heterogeneity which suggest that, in the case of burglary, some homes are simply more attractive to offenders than others and are therefore repeatedly victimized. For this type of theory, the risk of victimization at any particular home is not expected to vary over time.
The second types of theories consider event dependency and propose that victimization increases the risk of future offenses at the same home. Studies conducted using qualitative (Ashton et al. 1998), statistical (Short et al. 2009), and computer simulation (e.g., Johnson 2008) approaches suggest that for repeat burglary victimization, both types of explanation have a part to play.
In terms of event dependency, the largely offered view is that at least some of the time offenders act like rationale agents (see Clarke and Cornish 1985) and are likely to return to homes for which the potential benefits are perceived to outweigh the associated effort and risks of so doing. Moreover, because conditions change over time, any return to the same property is expected to be swift. Extending this idea, more recent work has tested the hypothesis that if offenders are likely to return to a previously targeted home (swiftly) because the conditions were perceived to be acceptable, they should also target proximate homes in the near future as these will share at least some of the characteristics that made the burgled home an attractive target.
Using techniques originally developed to detect disease contagion, studies (e.g., Johnson et al. 2007; Johnson and Bowers 2004; Townsley, Homel, and Chaseling, 2003) have confirmed that the risk of burglary clusters in space-time, and does so more than would be expected if observed patterns could be explained entirely in terms of risk heterogeneity. Recently, studies have examined space-time patterns for a range of event types including street robbery (Grubesic and Mack 2008), shootings (Ratcliffe and Rengert 2008; Wyant et al. 2011), insurgent (e.g., Behlendorf, LaFree, and Legault 2011; Braithwaite and Johnson 2012; Townsley, Johnson, and Ratcliffe 2008), and counterinsurgent activity (Braithwaite and Johnson 2012). In all cases, confirmatory results have emerged, although the spatial and temporal scales over which space-time clustering occurs varies by event type; in part, reflecting the terrain over which different types of events occur. The theoretical explanations for anticipating observed patterns also vary, recognizing the dynamics likely to generate them. Despite the differences in likely theoretical explanations, commonalities also exist that may help explain documented patterns. These include the fact that people are affected by spatial and temporal constraints (Ratcliffe 2006) and, that the conditions that make a location conducive for an activity on one day, may change over time, or may be perceived as so doing.
Maritime Piracy
If such generic influences do play a role in explaining observed patterns across event types, then the theory and associated methods discussed should provide insight into other forms of crime, including those that do not occur in urban environments, such as maritime piracy. A common reading of the research on maritime piracy (O’Meara 2007) is that the primary motivation is financial gain. Consequently, it seems reasonable to suggest that pirates will seek to maximize the benefits of their activity whilst minimizing the risks and associated costs. If pirates do evaluate (however crudely) the costs and benefits of targeting particular locations, it seems reasonable to suggest that they would be more likely to select locations about which something is known. At any one time, pirates are unlikely to have up-to-date knowledge of the seas and the types of vessels they use (skiffs) have limited ranges which reduces opportunities for reconnaissance. 1 Thus, just like burglars, pirates may be expected to return to locations they have previously been successful or for which the conditions are currently perceived to be conducive to piracy. Further, pirates may perceive that the accuracy of their knowledge—including merchant (or other vessels) use of particular shipping routes and their levels of protection—will decay over time, and so a quick return to previously targeted locations would be logical. However, targeting vessels at the exact same locations repeatedly is likely to lead to particular routes being avoided or pirates captured. Research suggests that pirates may not fear arrest per se (e.g., see Ploch 2010) due to the difficulties associated with prosecuting them (see below), but being detected incurs costs in terms of time and resources. Consequently, pirates would be expected to vary attack locations over time, but perhaps in a predictable manner—targeting locations not so far from previously attacked locations, at least some of the time.
Pirates may accrue financial rewards in many ways, but the two most common means are through the hijacking of cargo (see Hastings 2009) or ransoming of vessels and their crew. Considering interventions to reduce piracy, some are general strategies while others are aimed at specific types of attacks (e.g., kidnappings). General approaches include the use of legislation to deter piracy or to increase the likelihood of detection. Examples include the UN Security Council resolution (October 2008) which provided naval counterpiracy forces—previously limited to policing vessels in the open seas—with a legal basis to pursue pirates into Somali territorial waters (i.e., within 10 km of the coastline). However, even with extended powers, one problem that naval forces face is establishing that apprehended suspects were involved in piracy in such a way that would be admissible in a court of law. For instance, pirates aboard suspicious vessels may dispose of incriminating evidence before naval forces board them. Even when pirates are apprehended with weapons, or even hostages, they may be released. 2 In fact, many suspects are released at the point of apprehension, a practice referred to as catch and release.
An alternative legal approach intended to deter kidnappings was introduced as a UN sanction in 2008, and as a US presidential order in 2010. Both policies banned the payment of ransoms to individuals known to be involved in piracy, which was designed to deter the payment of ransoms. Problems have also been noted with such strategies. For instance, not all countries support them, making enforcement difficult, which may undermine the threat perceived by pirates or those from whom they demand payment. Moreover, a recent empirical analysis of daily counts of piracy off the coasts of Somalia and the Gulf of Aden provided no evidence as to the effectiveness of such policies (Shortland and Vothknecht 2011).
Other approaches focus on reducing opportunities for piracy, or of increasing the likelihood that pirates will be intercepted during an attack. For example, in August 2008, the Marine Security Patrol Area was set up in the Gulf of Aden by the Western Navies Combined Task force 150. This was followed in February 2009 by the establishment of the Internationally Recommended Transit Corridor, a transit lane off the Gulf of Aden through which ships are advised to travel. In both cases, naval resources patrol the areas and assist vessels in distress. However, the area that must be protected is vast, and resources are limited—in 2010, 30 ships were allocated to patrol a region of 2 million square miles (Chalk 2010). To aid in this endeavor, naval forces or potential target vessels could use radar to detect pirates, but this can be problematic as the small “skiffs” that pirates typically use (Chalk 2010) are difficult to detect using such means. Consequently, the ability to anticipate the timing and location of future attacks or the identification of regularities in patterns of attacks that might assist in the development of early warning systems would be extremely useful.
With this in mind, Caplan, Moreto, and Kennedy (2011) employ an approach known as Risk Terrain Modeling (RTM) to see if attacks locations can be predicted. Using a Geographical Information System (GIS), they generate a series of “spatial layers” that map out the characteristics of the environment thought to be conducive to piracy. Such layers include proximity to ports, shipping lanes, and so on, but do not include influences that vary over time, such as the timing and location of prior attacks. These layers are combined to generate a map that identifies locations where risk factors coalesce and hence where piracy may be most expected. The model is statistically significant at predicting attack locations and hence represents a promising approach. However, resources dedicated to counter piracy are limited and cannot patrol all areas at risk all of the time. Consequently, identifying regularities concerned with when attacks might occur as well as where they are most likely would be of clear value.
In their study, Shortland and Vothknecht (2011) use daily time-series data to examine how tidal conditions, such as the timing of Monsoons, affect piracy off the coastlines of Somalia and the Gulf of Aden. The risk to pirates is that the elevated wave amplitude associated with the Monsoon seasons (typically between Jan to March and June to August) may capsize their skiffs, making the conditions for piracy less appealing. Their analysis supports this proposition, and such knowledge may inform approaches to forecasting, but it does not provide an indication of where incidents might take place. Of course, one might use the RTM approach to estimate which locations are most at risk and then use time-series data to predict when risks will be highest, but such an approach assumes that the risk of attack increases proportionately at all locations. This may be an unreasonable assumption and one that is examined here.
In this study, we first examine spatial patterns, predicting that incidents of piracy will be clustered. We then examine regularities in the monthly time series of pirate incidents in different regions of the oceans to test the hypothesis that patterns will vary, reflecting differences in local conditions. Finally, we test the hypothesis that pirate attacks will cluster in space and time.
Methods and Results
Data
Data concerning incidents of piracy for May 1978 to Jan 2012 were obtained from the National Geospatial Intelligence Agency’s (NGIA, https://www1.nga.mil/Pages/default.aspx) Anti-Shipping Activity Messages database. The NGIA data come from a variety of sources including, but not limited to, the International Maritime Bureau and the International Maritime Organization. Incidents include successful and attempted attacks, as well as (for example) suspicious approaches. We consider all incidents in the current article because, we reason, that all events are important and will likely require a response. Moreover, for any incident of the kind recorded by the NGIA, the target will be a ship and the offender a pirate, and hence the analysis of all events is likely to inform understanding of pirate activity. For each incident, the location and date are recorded along with a description of the event. Prior to analysis, duplicate records were identified and removed, providing a sample of 5,715 recorded events for analysis.
Spatial Patterns
Figure 1 shows a kernel density map
3
of recorded incidents for those parts of the world in which the majority of attacks
occur. Some subregions, notably those off the coast of Somalia, the Gulf of Aden (between
the Yemen and Somalia), the Gulf of Guinea (the West Coast of Africa), around the coasts
of Sri Lanka (the Arabian Sea/Bay of Bengal) and Malaysia, experienced more incidents than
do others; accounting for a total of 4,062 events. To determine whether the spatial
clustering suggested by Figure 1
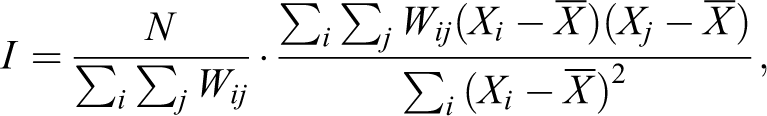
was statistically significant, we use the Moran’s I statistic (Moran 1950).
As a global test of spatial autocorrelation, this is used to see whether areas with high
(low) counts for a particular variable tend to cluster in space. The formula is as
follows:
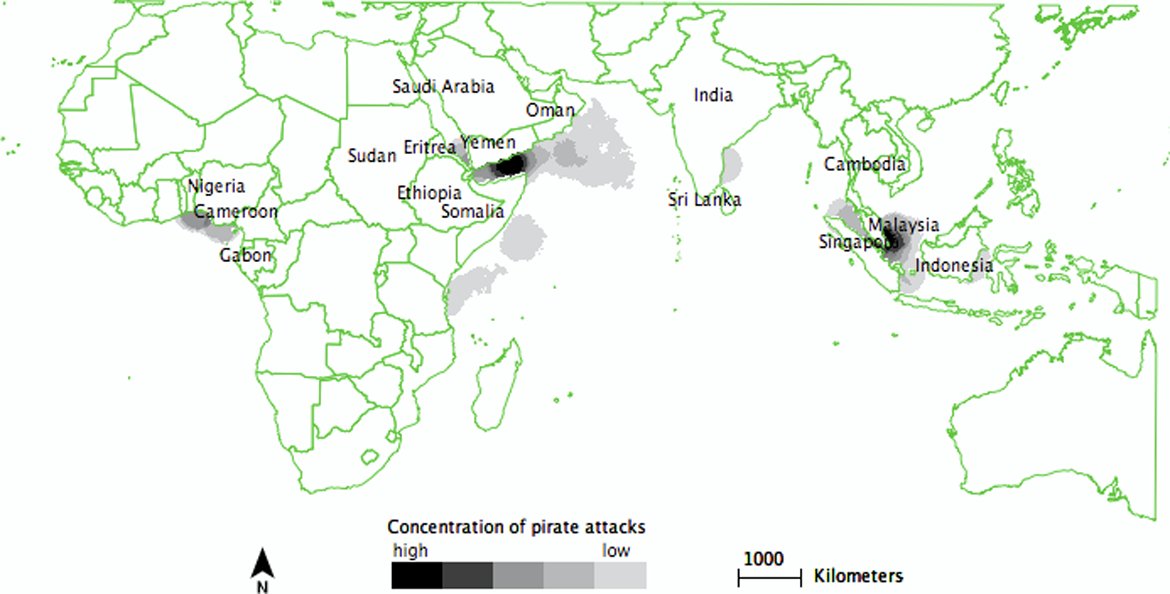
Kernel density map of incidents of Maritime Piracy, January 1985 to January 2012.
Where, N is the number of spatial units indexed by i
and j
X is the variable of interest
wij
is a matrix of spatial weights indexed by i and
j.
To compute the Moran’s I statistic, it is necessary to divide the
study area into areal units. The NGIA divide the world into 97 subregions, but these are
too large to be useful in this case. Consequently, we generated a grid of equal sized
cells and computed the Moran’s I statistic for these. The null hypothesis
is that patterns reflect complete spatial randomness (CSR) and so an expected
distribution, generated under conditions of CSR is required to determine if the observed
Moran’s I value is meaningful. This distribution is generated using a
permutation approach. To explain, the observed cell counts are randomly shuffled and a
Moran’s I statistic computed for the shuffled data. One permutation of
the data is not particularly useful and so this process is repeated many times. As a full
permutation will be virtually impossible, a Monte Carlo (MC) simulation is used to draw a
random sample of (say) 99 from all possible permutations. This generates a distribution of
expected Moran’s I values that can be compared with the observed value.
The (pseudo) probability of observing a value at least as large as that for the actual
data can then be computed using the formula proposed by North, Curtis, and Sham (2002):
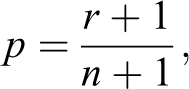
where, r is the number of permuted values at least as large as that observed, and n is the number of permutations.
As the cell size used was rather arbitrary, we conducted the analyses for cell dimensions from 50 km to 500 km. For obvious reasons, when computing the Moran’s I values, those cells that entirely represented land (approximately 29 percent of the earth’s surface) were excluded from analyses. For all cell sizes, the observed Moran’s I value was statistically significant (all ps < .01), confirming that incidents of pirate activity cluster in space. 4
Temporal Patterns
The above patterns are aggregated over the study period and mask temporal variation. Figure 2 shows the monthly time series for the five subregions—defined using the NGIA classification—with the highest overall counts of incidents for the period January 1985 to January 2012.
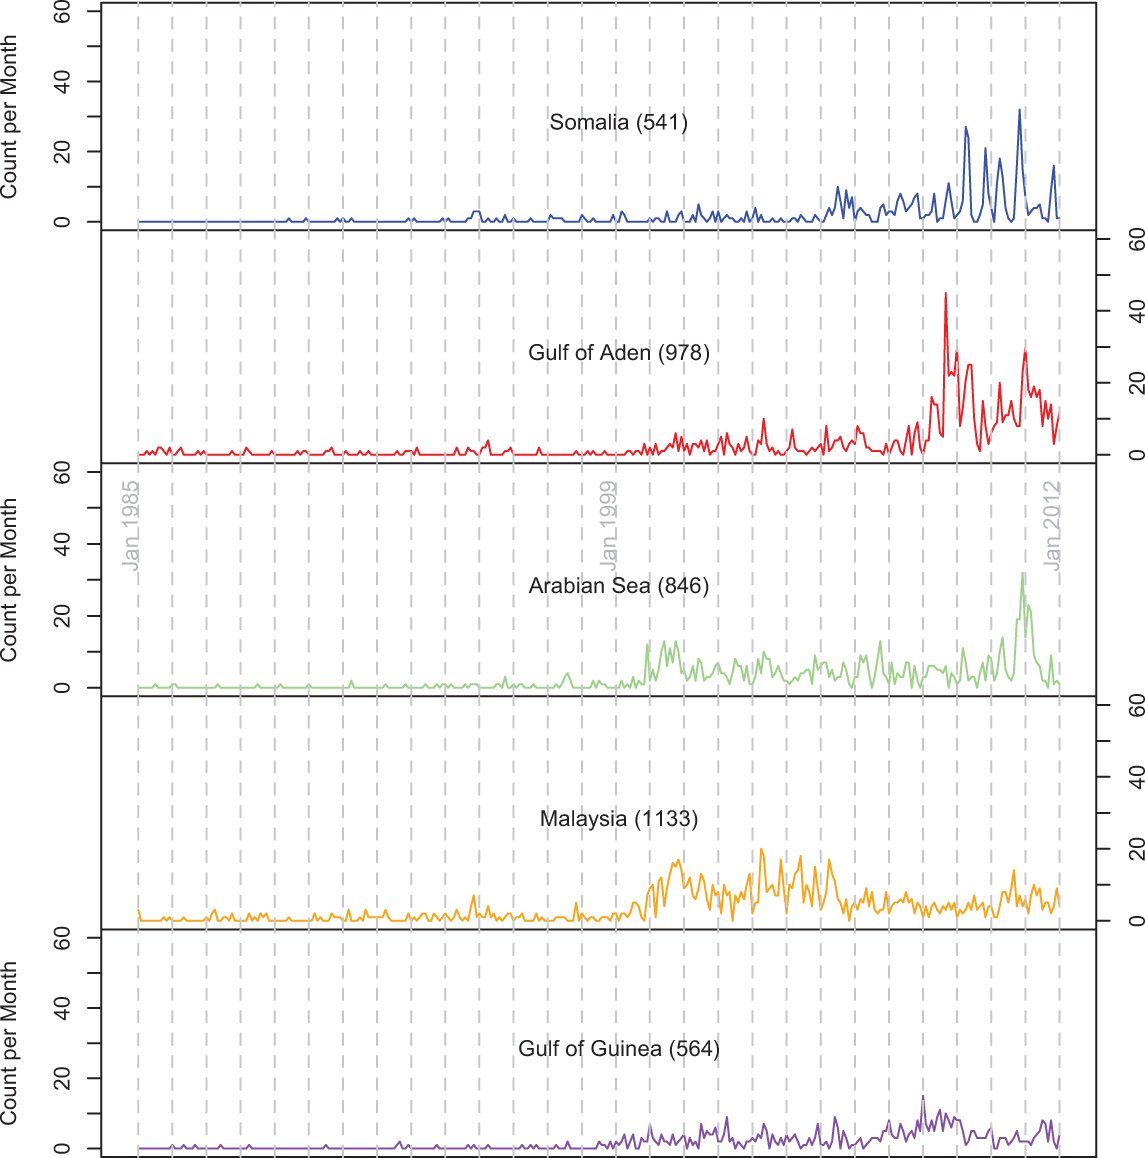
Monthly time series for the five subregions with the highest numbers of attacks (vertical lines indicate the month of January).
Changes in the rate of attacks (per unit time) toward the end of the series are quite startling for the first three subregions. However, the trends are by no means consistent. For instance, the region around Malaysia experienced the most incidents between 2000 and 2006, but not after 2007. More generally, when some subregions have unusually high counts of attacks per month, others do not. A simple bivariate analysis for the second half of the study period (in which 95 percent of the attacks occurred) supports this suggestion, with the median value (rp = .15, p < .05) of the ten pair-wise correlation coefficients (range −0.08 to 0.42) computed across the five time series being low. Thus, at this level of aggregation, it appears that variations in monthly incidents of piracy from one subregion to the next are unlikely to be explained by a common factor.
As discussed, a variety of factors may influence the frequency of incidents per month,
the simplest being seasonal variation in weather and other conditions. Here, we test
whether there are seasonal trends in incident counts and if these vary across subregions.
This is interesting in its own right but if differences do exist, it will be important to
take account of these in subsequent analyses. A number of approaches could be taken with
the simplest being to compute and contrast the monthly counts for each subregion. However,
as the data are for a time series, what happens in one month can effect what happens in
the next, and thus too simple an approach may be misleading. Consequently, we use a simple
time-series model. As the counts are low for some months, we use a Poisson model, using
quasi-Poisson errors to reduce the risk of parameter standard errors being underestimated.
Such a model can cope with the fact that the predicted values are bounded (they cannot not
be less than zero) and that the variance for the time series is unlikely to be constant.
The model used is as follows:
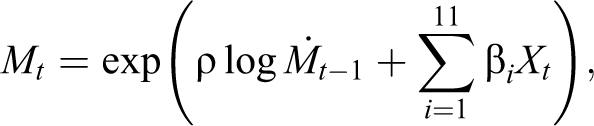
where Mt
is the count of events in month t, the
Xts are binary variables, one for 11 of the months of the
year, that indicate the month of the year to which an observation belongs (April is used
as a reference category as this had the highest total account across all subregions),
The results, shown as Table 1, suggest a number of things. First, for all subregions, sequential monthly counts are positively associated. And, that having controlled for the latter, there are some seasonal trends but that these differ across subregions. For example, relative to April, the frequency of incidents off the coast of Somalia is significantly lower for the periods December to February and June to August, periods that largely coincide with the Monsoon season. In contrast, for the Gulf of Guinea, no seasonal pattern is apparent. Taken together, the results so far discussed suggest that attacks cluster in space, in time and, insofar as different regions experience an elevated risk of incidents at different times, in space and time.
Poisson Regression Model of Monthly Variation in Piracy Attacks for the Period Jan 1999 to Jan 2012
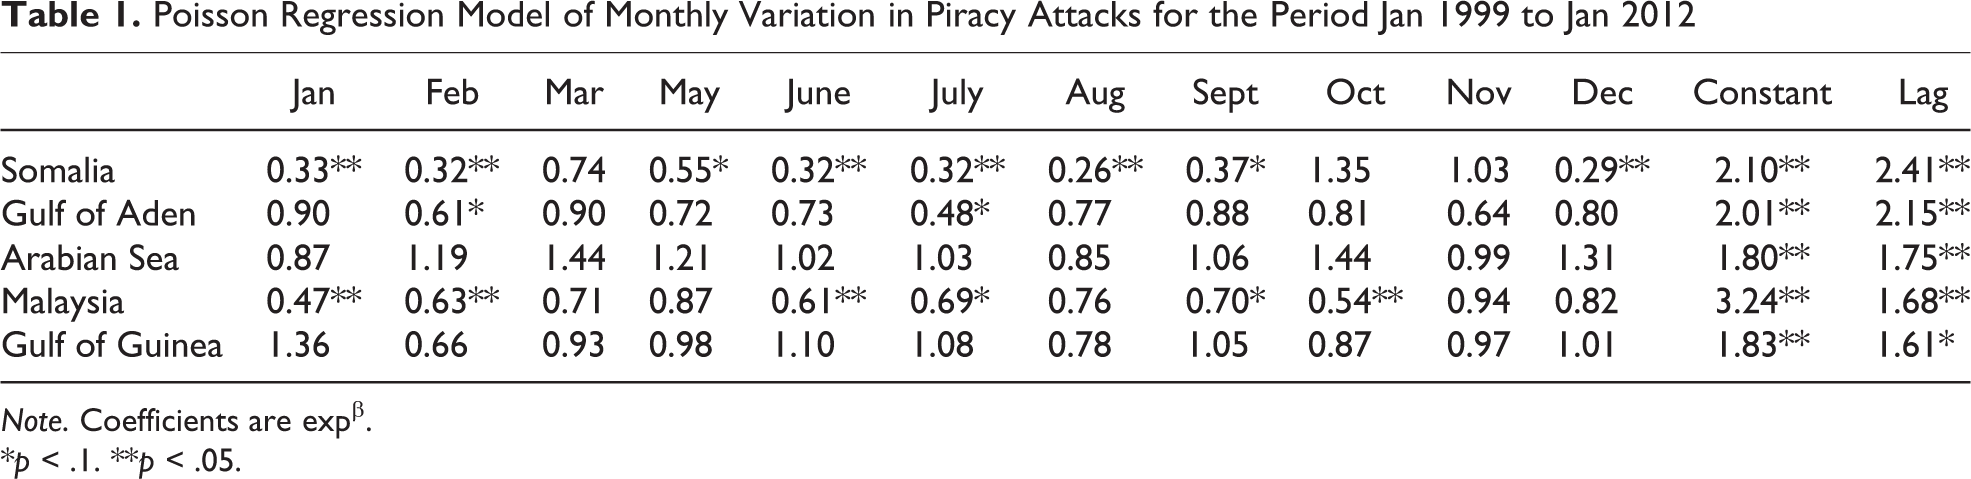
Note. Coefficients are expβ.
*p < .1. **p < .05.
Space-Time Patterns of Pirate Attacks
A number of statistical methods have been developed to detect space-time clustering in a
point pattern and we use two here. The Mantel (1967) test provides a single index that
indicates whether space-time clustering is apparent. Here, it is used to see if space-time
clustering is observed for each year for which data were available. The Knox (1964) test is used to examine
the patterns in more detail. As there is considerable overlap for the two tests in
computational terms, we describe them together, along with the results of the analyses.
For both tests, each event is compared with every subsequent other and the distance
(dij
) and time (tij
) between the 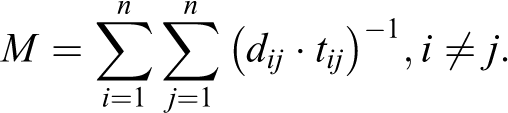
For the variant of Knox (1964) test used here (see Johnson et al. 2007), instead of computing a single index of space-time clustering, the distribution of the distances and times between attacks are summarized in a contingency table. The dimensions of the table, and bandwidths used, are at the discretion of the researcher but selected to allow a sensitive test of the hypothesis under investigation, and to reflect the terrain over which events occur. In the current study, we use spatial intervals of 10 km and temporal intervals of one week. The spatial intervals may seem a little large, but consider that at sea what would be a large distance in an urban area will be relatively small. Moreover, a sensitivity analysis suggests that—within reason—alternative bandwidths generate qualitatively identical results.
For both tests, it is necessary to compare the observed test statistic with that expected, generated assuming that the timing and location of events are independent (the null hypothesis). To generate the expected distribution, a MC simulation is used and for each iteration the dates on which events occurred are “shuffled,” thereby making the time and locations of incidents independent across permutations. For each permutation, a new contingency table is populated, an M statistic generated, and the results compared with those for the observed distribution.
Previous research on space-time clustering has used data for a city or possibly a country. Here, we use data for the whole world and one issue with doing this is that generating the expected distribution by shuffling the dates in a completely random fashion may be unreasonable. This is because the time-series analysis indicated that there were different seasonal patterns across subregions. For this reason, when shuffling the dates, we do this within NGIA subregions to preserve any (local) seasonal trends apparent in the permuted data.
Figure 3 shows the p values—computed using 99 iterations of the MC simulation and the North et al. (2002) formula—for the Mantel statistic for all incidents worldwide. It also shows the count of incidents for each year. From 1997 onward, the Mantel values are statistically significant, showing the existence of space-time clustering for incidents of piracy.
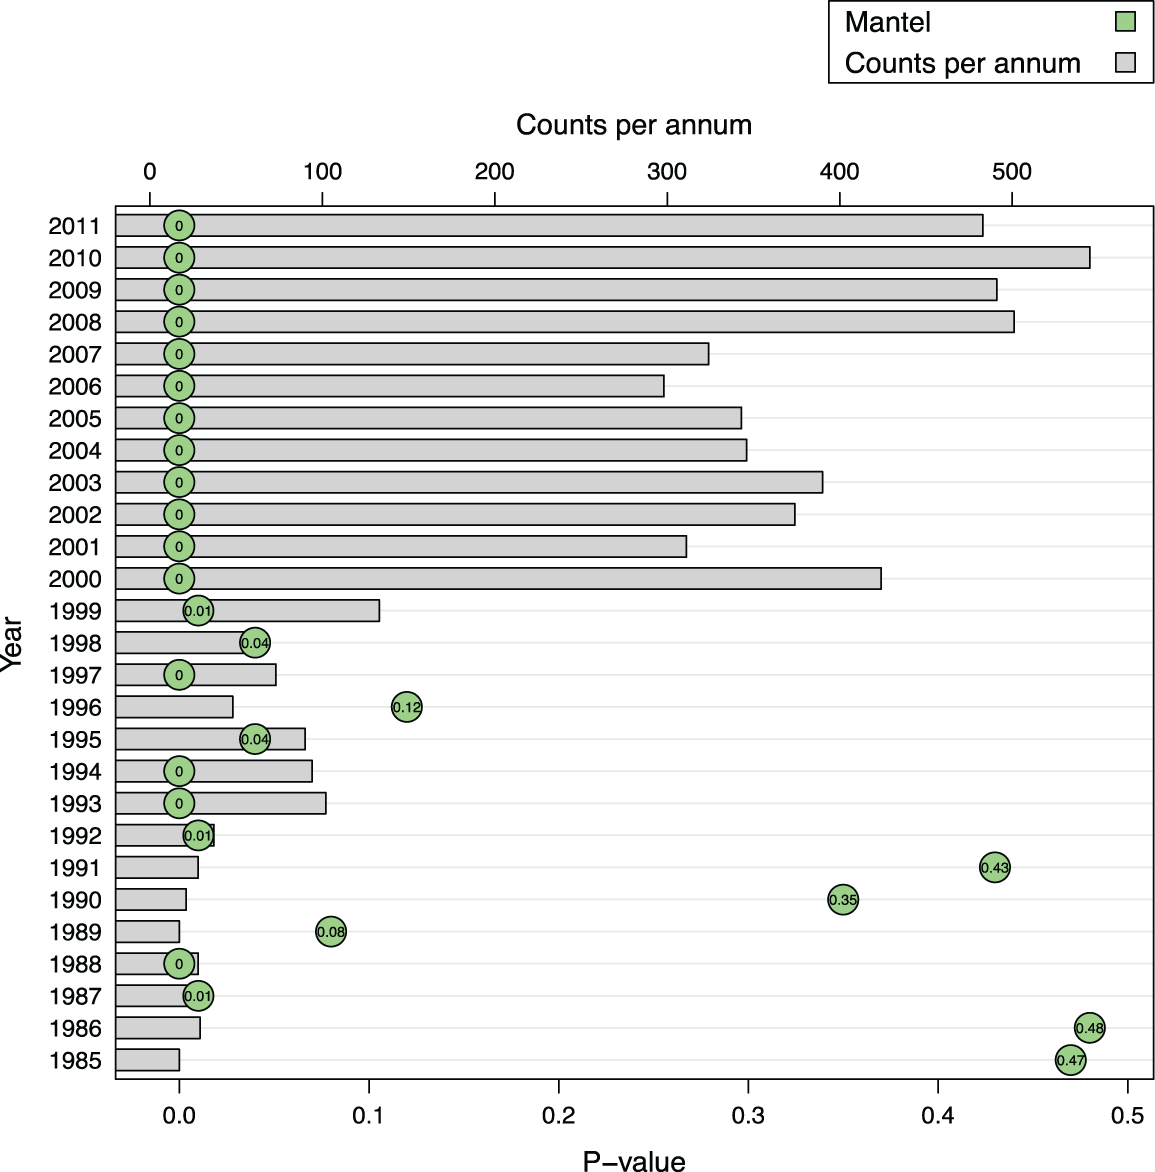
p Values for the Mantel test statistics for each year and yearly counts of piracy attacks.
The Mantel test is particularly suited to summarizing general patterns but provides little insight into precise ones. For this reason, we also use the Knox approach. In this case, rather than comparing a single test statistic to the expected distribution, the cell frequencies of the contingency table generated for the observed data are compared with those for the permuted data. Where the frequencies of the cells for event pairs that occur close to each other in space and time are consistently higher for the observed than the permuted data, space-time clustering is said to exist. To estimate the size of this effect, the observed frequency for each cell may be divided by the mean derived across all permutations (Johnson et al. 2007). Values above one indicate that the observed values exceeded expectation. The statistical significance of observed differences were calculated as described above.
Rather than presenting the results of the analyses for all years (which show similar patterns), Figure 4 shows the results for 2011. In the plot shown, each cell displays a Knox ratio for a particular space-time interval and the shading indicates whether the observed number of event pairs is equal to (Knox ratios of 1), exceeds (Knox values above 1), or is below expectation (Knox values below 1). The cells shaded are those that are statistically significant at the 0.01 level. This more conservative approach to significance testing was adopted as the plot summarizes so many test statistics. Like other crime types, it is clear that more events occur close to each other in space and time than would be expected if the timing and location of attacks were independent. That is, the Knox ratio in the bottom left of the plot is clearly much larger than any of the others. Moreover, there is evidence of a pattern of space-time decay as the next largest Knox ratio is for events that occurred within one week and 20 km of each other. For events that occurred within 2 weeks of each other, the Knox ratios for incidents that occurred nearest to each other are smaller than those for events that occurred within 1 week of each other. The Knox ratios for some of the other space-time intervals are also statistically significant, but the ratios are smaller and there is no clearly discernible pattern to these values. This is quite typical for studies of this kind (see Johnson et al. 2007).
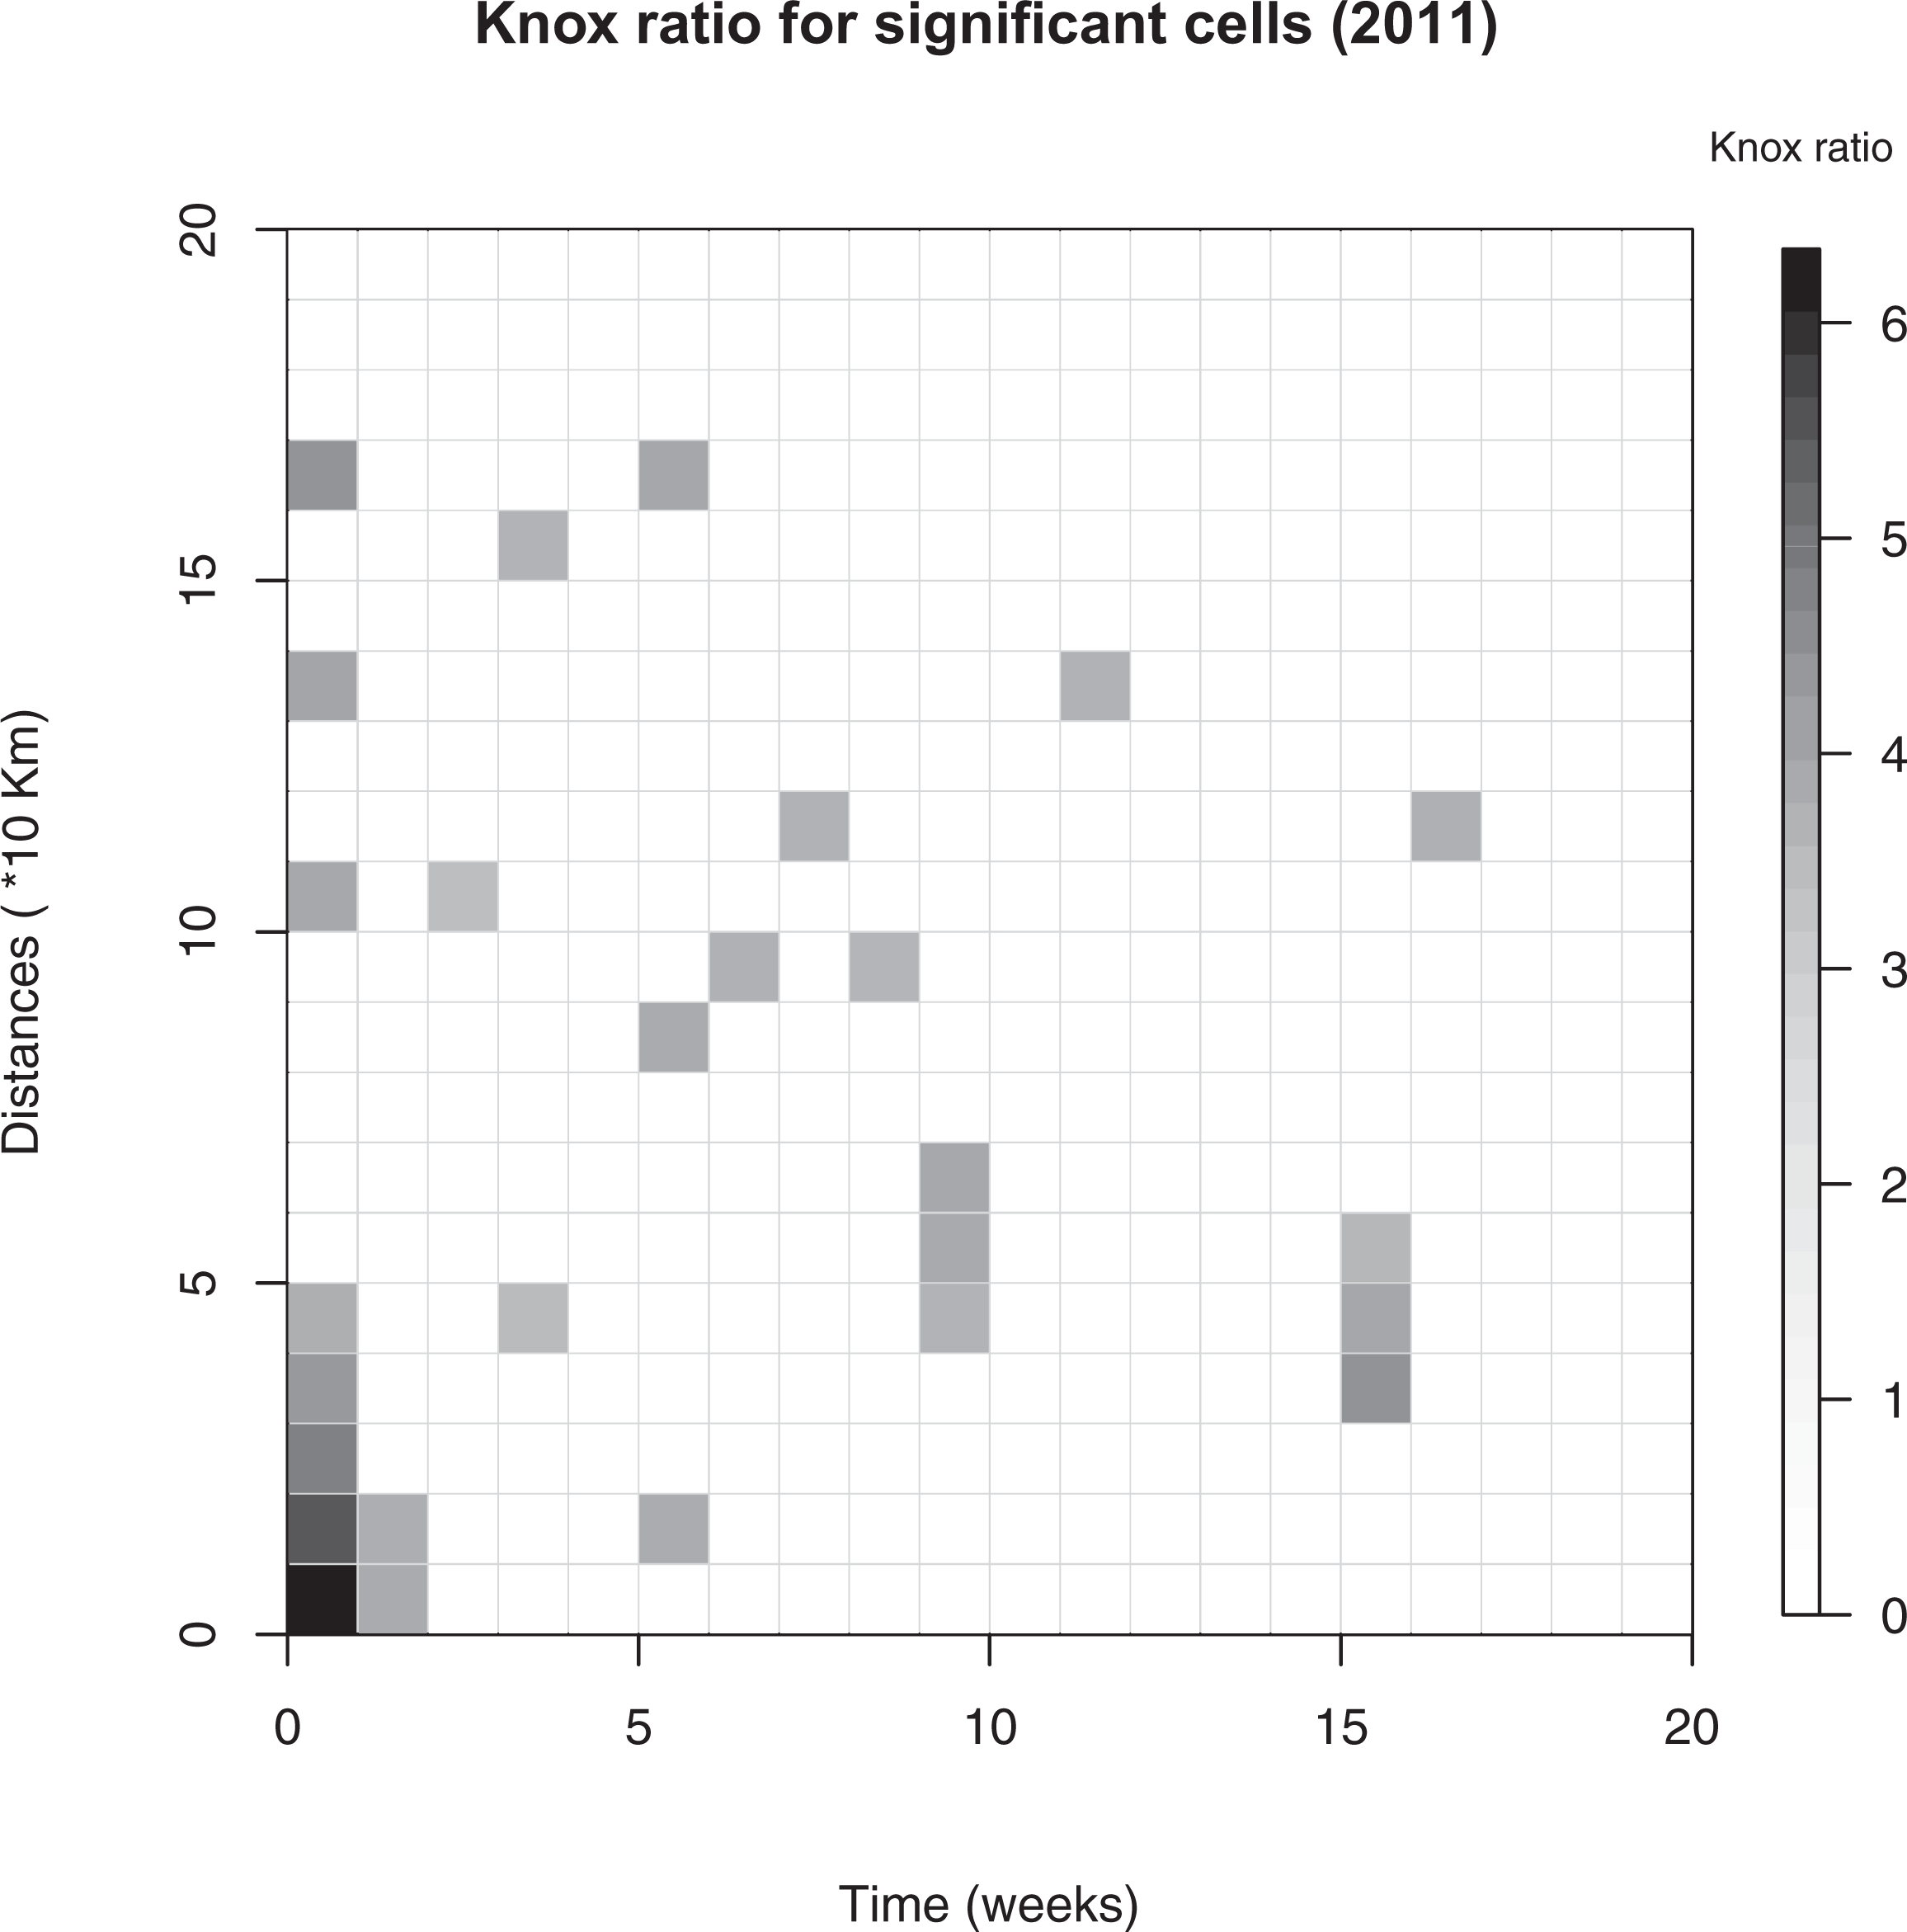
Knox ratios for attacks taking place in 2011 (shaded cells are statistically significant, p < .01).
Discussion
Despite the scale of Maritime piracy, there has been relatively little academic research concerned with the study of regularities in patterns of attacks. Informed by theories originally intended to explain crime in urban environments, the aim of the current study was to make a modest contribution in this respect. At the macro level, in line with other research, we observe that incidents of piracy are clustered in space. Seasonal patterns also appear to vary from one region to the next, possibly reflecting the impact that local weather patterns have on the opportunity for pirates to maneuver the oceans in the types of small boats they typically use. We also find that the general trends in the time series for the different subregions of the globe differ considerably. For instance, while the patterns are relatively stable over time in the waters around Malaysia (although they did reduce after 2007), off the coasts of Somalia, and the Gulf of Aden, there appears to be a tipping point around 2008 when the count of attacks per month abruptly rises from less than 10 to around 4 times that figure. In future research, it will be interesting to explore this from the perspective of complexity science using (for example) agent-based models (Gilbert and Bankes 2002) or analytic approaches that have been designed for the study of systems that display the type of nonlinear behavior observed here.
Considering the point patterns, we use an approach (see Johnson et al. 2007) that is gaining popularity in the study of urban crime to explore the space-time dynamics of pirate activity. Analyses conducted using two different tests suggest that, just like other types of crime, incidents of piracy cluster in space and time, and do so more than would be expected if their timing and location could be explained by the fact that some locations are more attractive to pirates than others. Our analysis takes account of the fact that we would expect some seasonal variation in the frequency of events and that such variation will likely differ by subregion. Simply put, the analyses suggest that following an incident at one location, the risk of others is likely to be temporarily elevated around that location; a regularity that may usefully inform where and when (limited) antipiracy resources are deployed. The analyses conducted using the Mantel test suggest that this has been the case for the last 16 years.
Other quantitative research discussed in the introduction of this article (e.g., Hastings 2009) has taken a different approach to analysis, using (for example) event count regression models to examine the association between the count of attacks within the territorial waters of each country each year and a range of independent variables. For instance, Hastings (2009) suggests that the conditions that will be conducive for some forms of piracy will vary across states (see also, Daxecker and Prins 2012). To elaborate, for hijackings to be profitable, it will be necessary for pirates either to use the cargo stolen or to trade it. Trading will, of course, be easier in countries where there is an economy that can absorb the stolen goods without attracting attention and where there is an infrastructure (e.g., roads, ports, etc.) to support the distribution of stolen items. For such research, the unit of analysis is the country-year, and the analyses ignore the space-time dynamics of attacks at a spatial and temporal resolution that might influence tactical responses and facilitate a detailed understanding of the phenomenon. While our analysis provides the latter, it does not examine the more long-term or time stable correlates of attacks, and so combining the two types of analytic approach would also seem to be a sensible next step.
As with any type of crime, it is important to note that the data analyzed are imperfect. In the case of urban environments, not all crime is reported (e.g., Van Dijk et al. 2007), and rates of reporting may vary over time or by country. In the case of maritime piracy, the data are not reported to a single agency and so there may be variation in the accuracy and type of data collected by different agencies. Moreover, what is counted as an “incident” may vary over time or by the agency recording it. In particular, with a concerted effort underway to reduce maritime piracy, incidents (successful or otherwise) may be recorded with increasing frequency and this should be considered.
Moreover, as has been suggested by advocates of situational crime prevention (Clarke 1980), there may be value in examining patterns for different types of events, such as kidnappings and hijackings, those that are conducted against different types of vessel (see Mejia, Cariou, and Wolff 2009), successes versus failed attempts, and so on. The fact that distinct patterns emerge from the analyses presented here suggests that the approach—theoretical and analytical—is useful. However, determining if more precise patterns emerge for different types of attacks would be a useful next step. A related issue is that in the current article we analyzed all attacks worldwide for each year. An alternative strategy would be to aggregate the data over time but to focus on patterns in particular geographic regions. It may be that patterns vary by region and if so such analysis would be of value.
To conclude, maritime piracy is a substantial problem that impacts those directly affected as well as the global economy. In this article, we have examined how patterns of incidents have varied over time and have shown that there is a regularity to when and where they occur. The findings have immediate implications for attempts to reduce maritime piracy, but there is much more research to be done.
Footnotes
Declaration of Conflicting Interests
The authors declared no potential conflicts of interest with respect to the research, authorship, and/or publication of this article.
Funding
The authors disclosed receipt of the following financial support for the research, authorship, and/or publication of this article: To conduct this research, the authors received financial support from the Engineering and Physical Sciences Research Council (EPSRC) under the grant ENFOLD-ing – Explaining, Modelling and Forecasting Global Dynamics, reference EP/H02185X/1.