
Abstract
A large body of research indicates that environmental conditions can influence the risk of social unrest. However, we know little about how these effects may change in the long run. Are they likely to remain constant or do they change over time – for example as a consequence of human adaptation? To investigate this question, we rely on a disaggregated analysis of England over a period of more than 300 years. Combining data on geo-referenced food riots with reconstructed climate data, we first assess the impact of annual temperatures on social unrest over the period 1500–1817. We then use our long-term time-series dataset to assess the temporal heterogeneity of year-to-year associations between temperatures and social conflict. Our models show a substantive negative correlation between temperatures and food riots in the aggregate. This association, however, seems to be highly inconsistent over time and largely confined to the 18th century. In addition, we find evidence of decadal processes of adaptation: past exposure to adverse weather conditions dampens the effect of current exposure. Taken together, these findings underline the importance of considering temporal heterogeneities when assessing the climate–conflict nexus and caution against any simple extrapolations of observable present-day effects of environmental conditions into the future.
Introduction
Adverse environmental conditions can negatively impact agricultural production, increase food prices, threaten people’s livelihoods, and trigger social unrest. In 2016, for example, riots erupted in the Indian state of Karnataka. The region was suffering a severe drought that had reduced drinking water supplies and ignited disputes over the distribution of water resources (Lodaya & Mukherjee, 2016). In 2017, northeastern Nigeria saw deadly clashes between farmers and herders as a consequence of a drought that hit Lake Chad basin and escalated distributional conflicts over fertile land (Akinwotu, 2017). In 2016, Bolivia experienced the worst drought in 25 years, which triggered violent protests in several urban centers (Reuters, 2016). These and other examples not only indicate that environmental conditions can in fact be conducive to social unrest but also raise the important question of whether we can expect to see an increase in similar instances of violence as the frequency and/or intensity of adverse weather events increases in the long run.
There are two possible responses to this question, which differ in terms of how they expect the marginal effects of weather conditions to change over time: the first, rather grim answer is based on the assumption that these effects are likely to remain constant or increase. Consequently, we could simply interpolate the results of previous studies stressing positive associations between weather conditions and violent unrest. Given that the frequency and/or intensity of extreme weather events is likely to accelerate in the future, we would expect an increase in environmentally induced violence.
But what if the effect of each individual extreme weather period on social unrest changes over time? For example, effects may decrease due to adaptation processes. As a reaction to past exposure to harsh weather conditions, people may adapt their behavior in order to reduce their vulnerability to similar conditions in the future. Consequently, even if we were to see more extreme weather events as a result of global warming, we would not necessarily observe any substantial increase in environmentally induced violence.
This article aims to assess the plausibility of these two competing scenarios by historically investigating their basic underlying assumptions: have associations between environmental conditions and social unrest changed in the long run? Do past weather conditions influence the subsequent effects of weather conditions on social unrest?
Numerous studies have analyzed the effects of year-to-year weather variation on large-scale violence using relatively short time periods spanning ‘only’ a few decades. While this research has contributed greatly to our understanding of the potential associations between weather conditions and violence in the short run, the underlying approach is limited in terms of contributing to the main research interest of this article. In particular, the time frames investigated are simply too short to effectively assess whether weather effects remain constant or change over longer time periods.
Another research strand has focused on analyzing whether large-scale instances of violence such as interstate or civil war have historically been more frequent in particularly cold or warm decades or centuries. This research strand has added important insights on truly long-term associations between environmental conditions and violent conflict. However, it has relied on units of analysis that are temporally and geographically highly aggregated, thereby hampering the identification of heterogeneities on smaller scales.
We combine elements of both research strands to assess the extent to which associations between environmental conditions and social unrest may change over time. We focus on yearly weather conditions at a relatively high spatial resolution (∼50 x 50 km grid cells) and for an extended period of more than 300 years. England serves as our empirical case. We combine gridded information on yearly temperatures with geo-referenced historical food riots between 1500 and 1817. In line with previous research, we assume that (H1) low yearly temperatures increase the risk of food riot occurrence. Most importantly, (H2) we expect substantial variation of effects over time. Specifically, (H3) we argue that previous exposure to particularly cold years dampens the effects of subsequent low temperatures on the risk of social unrest.
Our analysis proceeds through three main steps. We start by estimating the effects of temperatures on the probability of food riot occurrence using grid-years as our unit of analysis. Our models show that there was more unrest in colder years than in years with more favorable weather conditions. Next, we assess heterogeneities of effects over time. We find associations between weather conditions and unrest to be highly inconsistent over time and driven primarily by individual decades of the 18th century. Third, we use our long-term time-series dataset to assess the mediating effects of past weather conditions. We find that the number of very cold years in the past 30 to 40 years substantially dampens the effects of current exposure to low temperatures.
These results contribute to the literature in two main ways. First, they lend support to previous research in that they show that associations between weather conditions and unrest can also be observed in other historical time periods (i.e. the 18th century) and are not confined to recent and rather short time periods that most research has focused on (i.e. the 1990s and early 2000s). However, we also find substantial variation in the strength and direction of these correlations – whether we find a short-term association between weather conditions and unrest seems to be highly dependent on the specific time periods we investigate. Second, we provide tentative evidence of adaptation processes over the long term. As people are exposed to repeated instances of adverse weather, they appear to adapt in a way that reduces their vulnerability to any subsequent unfavorable climatic conditions. Taken together, both findings underscore the temporal heterogeneity of effects and caution against any simple extrapolation of current effects of environmental conditions into the future.
Associations between weather conditions and conflict in the long run
Vulnerability to weather conditions is highly context-dependent. It is characterized by a complex interplay between particular climatic factors, crop types, socio-economic capabilities, farm-based innovation processes, and institutional policies. Most research on the climate–conflict nexus acknowledges that this heterogeneity of weather effects prevents any direct extrapolation of findings from individual cases to a broader population of cases. Several studies explicitly investigate this conditionality and demonstrate that conflict effects of weather conditions vary greatly across world regions, individual countries, and subnational areas.
However, effects of weather conditions do not only vary across space, they are also highly time-dependent. In particular, several previous studies indicate that the vulnerability to weather shocks depends on people’s exposure to similar kinds of adverse weather conditions in the past. Contrary to spatial heterogeneities, temporal variation of weather effects has received substantially less attention in research on associations between environmental conditions and violent conflict. However, understanding this conditionality is particularly important if we want to assess the plausibility of the assumption that the expected increase in the frequency and/or intensity of extreme weather events is likely to lead to an increase in environmentally induced violence in the future.
On the one hand, past exposure to weather shocks may increase vulnerability to subsequent shocks. While people may have the necessary socio-economic and institutional capabilities to cope with individual weather shocks, repeated exposure to adverse weather conditions can consume their coping capabilities – in terms of, for example, crop storages or household savings. This would make them more vulnerable to any subsequent shocks. In fact, research shows that compared to isolated extreme weather events or gradual climate change, consecutive years of dry or wet periods are more likely to increase vulnerability (Droogers & Aerts, 2005; Lai, 2018). Consequently, the marginal effects of adverse weather conditions on violent unrest could increase as the number and frequency of weather shocks increase in the long run.
On the other hand, vulnerabilities may also decrease as a result of prior exposure to weather shocks. Historically, humans have always adapted to ‘actual or expected climate and its effects, in order to moderate harm or exploit beneficial opportunities’ (IPCC, 2018: 542). Possibly the most common adaptive behavior consists of changes in agricultural practices such as crop substitution (Kurukulasuriya & Mendelsohn, 2008; Olesen et al., 2011; Bhatta & Aggarwal, 2016) or crop diversification (Waha et al., 2013). 1 Closely related are technology-induced answers to weather variability or various institutional responses such as the adoption of social security measures (Laube, 2009; Agrawal, 2010). Effective adaptation would decrease the marginal effects of environmental factors on socio-economic conditions and social unrest in the longer run.
Despite the general evidence on the presence of processes of Average yearly temperatures across England (1500–1817)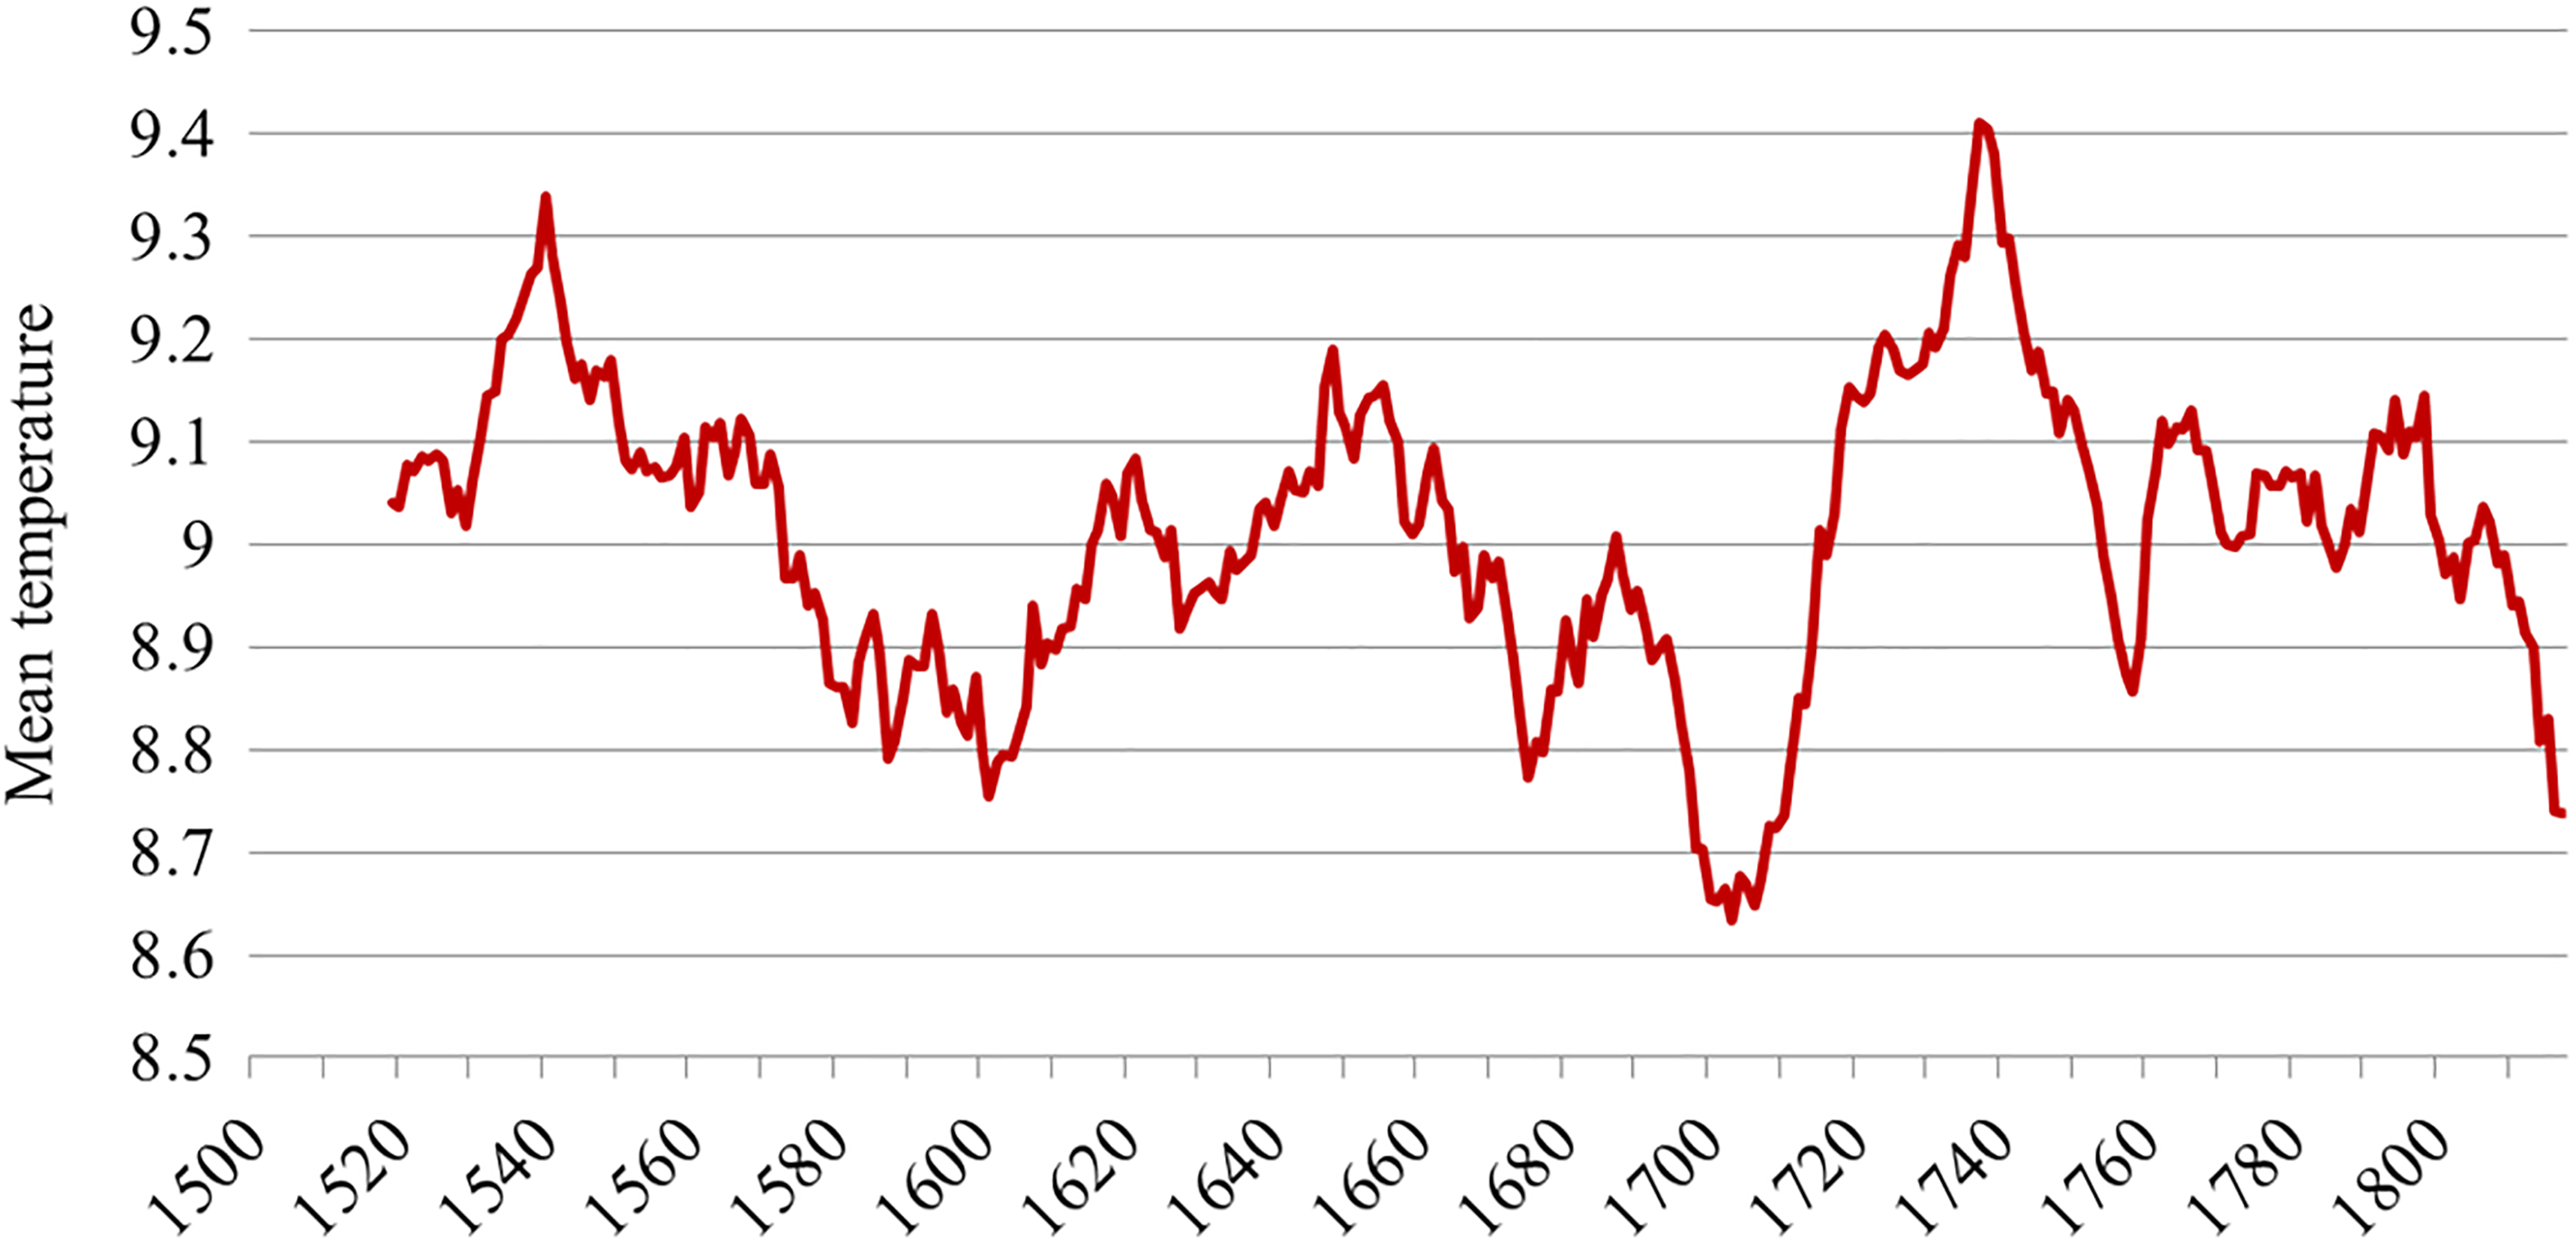
Most previous quantitative analyses focus on the effects of short-term weather patterns and extreme weather events. 2 While some studies cast doubt on associations between short-term increases or variation in temperature and precipitation on the one hand and civil conflict on the other hand (Buhaug & Theisen, 2012; Koubi et al., 2012), several other analyses find support for substantive effects of weather conditions. Using national-level data and yearly aggregates for the period 1981–2002, Burke et al. (2009), for example, find a strong positive statistical association between temperature and civil wars in Africa. Based on their findings, the authors predict a ‘54% increase in armed conflict incidence by 2030’ (Burke et al., 2009: 20670). Relying on rather narrow time periods, Hendrix & Salehyan (2012) and Raleigh & Kniveton (2012) also predict the exacerbation of small- and large-scale instances of political conflict in Africa due to future increases in rainfall variability. Studies relying on short-term, subnational variations in temperature and rainfall largely confirm the detrimental effects of climate variability on conflict found in country-level analyses (Yeeles, 2015; Almer, Laurent-Lucchetti & Oechslin, 2017). Analyzing the impact of rainfall deviations on communal conflict in sub-Saharan Africa between 1990 and 2008, Fjelde & von Uexkull (2012: 45) warn that in the future, ‘an increase in climate variability could render vulnerable population groups even more exposed to organized violence’.
The findings on short-term associations between weather conditions and conflict are important in themselves. However, previous studies in this research strand tell us little about how this association may change over time. Empirical analyses outlined above regularly control for time trends and dependencies, but they do not explicitly investigate temporal heterogeneities of effects. In particular, we lack a proper understanding of the presence, the magnitude, and the temporal scope of mitigating or exacerbating effects of past weather conditions. More fundamentally, the general empirical approach of these previous studies is not well suited to investigating the long-term changes in effects of weather conditions. In particular, studies mostly rely on relatively short time frames of few decades – typically the 1990s and early 2000s – preventing any assessment of whether the observable associations are likely to remain constant or to vary in the longer run. 3
Another research strand focuses on actual long-term associations between climate and violence. Identifying six major cycles of ‘warm’ and ‘cold’ weather phases in eastern China between 1000 and 1911, Zhang et al. (2007), for example, find that peaks of warfare frequency occurred in cooling phases. The authors argue that cooling phases shrank agricultural production and interacted with population pressure, thereby promoting wars. The historical impact of climate change on conflict has also been analyzed for other geographical areas. Zhang et al. (2011), for example, find that the cold phases of the Little Ice Age dampened agricultural production, increased grain prices, and furthered social disturbances such as rebellion or armed conflict within Europe over the period 1500–1800. Relying on geo-referenced data on historical conflicts in Europe, North Africa, and the Near East from 1400 to 1900, Iyigun, Nunn & Qian (2017) find associations between changes in temperature over 50-year intervals and wars and battles with more than 32 combat fatalities.
These long-term studies use large geographical areas and long time periods (decades or centuries) as their units of observation. This high degree of temporal and spatial aggregation has allowed for very long-term analyses in the context of scarce historical data. In particular, it has provided important evidence on long-term adaptation processes, thereby speaking directly to the research interest of this article: Iyigun, Nunn & Qian (2017) find that cooling has a positive impact on conflict incidence within the same 50-year interval, while cooling that occurred more than 50 years previously has little direct effect on violence.
However, high levels of aggregation also have some relevant downsides when it comes to investigating the changing effects of environmental conditions. Due to aggregation, a substantial amount of temporal and spatial within-unit variation of associations between weather conditions and violence is neglected. For example, analyses using 50-year periods can only capture very long-lasting intensification or adaptation processes where people’s behavior is influenced by climatic experiences that occurred 50 or 100 years previously. Conversely, they neglect decadal heterogeneities – for example, when people adapt their behavior to experiences from the past 10, 20 or 30 years. Similarly, the focus on vast regions masks intensification and adaptation processes in smaller areas. Finally, country-level analyses in this research strand have focused on large-scale forms of violence such as civil wars – neglecting less organized and more decentralized forms of unrest that are arguably much more sensitive to weather conditions.
Our empirical approach combines elements from both of the research strands outlined above to assess short-term weather variations on small geographical scales for very long time periods. We start by investigating the more or less explicit assumption of several previous studies that effects of climate variability on decentralized forms of violence observable in the 1990s and 2000s are not confined to these short and arbitrary time periods but represent more general patterns. In line with previous research we expect unfavorable weather conditions (in our empirical case, low temperatures) to increase the risk of unrest.
H1: In the aggregate, lower temperatures are associated with higher risks of riot occurrence.
Moreover, contrary to previous studies we do not control for temporal heterogeneities but explicitly investigate if associations between weather conditions and unrest change over time. In line with the arguments presented above, we expect a high degree of temporal heterogeneity of associations between temperatures and the risk of riot occurrence.
H2: Lower temperatures are associated with higher risks of riot occurrence in specific time periods only.
Finally, we investigate one potential source of this temporal heterogeneity: processes of intensification and adaptation. Thus, we analyze if and over what time periods the exposure to extreme weather conditions in the past can influence the impact of subsequent climatic conditions. In the presence of processes of intensification, prior exposure should increase the magnitude of effects of current weather conditions. Conversely, in the presence of processes of adaptation, prior exposure should decrease the magnitude of effects of current weather conditions.
H3: The association between temperature and the risk of riot occurrence is mediated by prior exposure to extreme weather events.
Changing climate, social unrest, and adaptive behavior: The case of England
Our analyses focus on England between 1500 and 1817. This time period falls within the so-called ‘Little Ice Age’ that extended from the 16th to the 19th century and brought substantially lower temperatures to many parts of the world. Excessively low temperatures were commonly accompanied by excessive rainfall that often lasted for more than a decade (Fagan, 2001).
The timing and extent of cooling varied across Europe. In England, the average temperature in the late 16th and early 17th centuries was 0.6 to 0.8 degrees Celsius below the average of the early 20th century (Lamb, 1995: 212). Figure 1 illustrates the aggregate temporal development of average yearly temperatures for the English mainland over the period 1500–1817. The data points represent a moving 20-year average (see data description in the empirical section below). The figure shows a long-term decrease in temperatures from the early 16th century onwards following the end of the extended Medieval Warm Period.
Describing three major famines in northern English counties at the end of the 16th century, Appleby (1978) argues that hunger was caused by a combination of population growth and crop failure due to cold weather. Historical records reveal that Great Britain experienced consecutive spells of extreme weather events particularly in the 18th century, including exceptionally wet winters in the 1730s (cf. Murphy et al., 2018) and ten unusually wet winters in a row between 1751 and 1760 (cf. Lamb, 1995). In the 1730s, crop failures caused surges in food prices throughout Britain (Fagan, 2001: 139). In-depth historical analyses have stressed the link between harvest, food prices, and popular disturbances in 18th-century England (Ashton, 1959).
It is important to note that weather-related crop failures were not the only cause of high food prices and social distress in England during the period under analysis. As for example highlighted by Thompson (1971: 92), food price advances were often substantially higher than crop deficiencies would actually justify. In particular, rioters blamed cereal exports to larger cities for rising food prices and dearth (cf. Bohstedt, 2010). Other factors that contributed to rising food prices were parliamentary land enclosures, market manipulations including speculations and the formation of monopolies by farmers and dealers, and wars (Thompson, 1971; Tilly, 1978; Bohstedt, 2010). Adverse weather conditions often interplayed with the detrimental social consequences of these factors.
The most common answer to food riots was violent repression, which was ordered by magistrates and ministers throughout England between the 16th and 19th centuries. However, the needs of a hungry population were also partially met by a series of institutional measures. Among the most important of these were occasional export bans (particularly for wheat and rye). Other governmental answers to social unrest included the codification of the Poor Law in the act of 1598, the building of municipal granaries, communal control of scarce food supplies, the procurement of imported grain, and municipal food relief funds (Bohstedt, 2010).
Moreover, agricultural adaptation processes are likely to have moderated the effect of climatic conditions on riots. Martínes-González (2015) and Tello et al. (2017) show that the colder and more humid climate during the second half of the 17th century can be viewed as the key driving force behind major improvements in traditional organic farm systems. In response to weather extremes, for example, farmers started to look for new crops (cf. Iyigun, Nunn & Qian, 2017). One agriculture-based innovation was the Norfolk four-course rotation system. In four-year cycles and in the absence of a fallow year, this system rotated wheat, turnips, barley, and clover, thereby increasing soil fertility, restoring some of the plant nutrients, and boosting wheat yields (see Overton, 1996: 121, 167).
Data, models, and results
Our empirical analysis seeks to answer three related questions. How does year-to-year temperature variation affect the risk of riot occurrence in the long run? How does this effect change over time? And how does past exposure to adverse weather conditions shape associations between yearly temperatures and social unrest?
Weather conditions and food riots
In order to investigate the effects of weather conditions on the social unrest, we have constructed a grid-cell dataset spanning a period of more than 300 years. This period of analysis (1500–1817) is predefined by the availability of data for our main explanatory and outcome variables. We create a grid net with each cell measuring roughly 50 x 50 km and use the grid-year as our unit of analysis. 4
Our main outcome variable measures the incidence of food riots per grid cell and year. We rely on a ‘riot census’ produced and generously shared by John Bohstedt (2010). It compiles information on the date, location, and other characteristics of riots from the 14th century to the early 19th century. The data rely on a variety of historical public records (magistrates’ reports and court records) and newspaper articles combined with data provided in secondary sources. A riot is defined as ‘an episode of crowd force or violence, meaning a collective assault on persons or property, illegal seizure of property, and/or coercion of a person to do something he/she would not otherwise do’. Events are included in the dataset only if they involved a crowd of at least ‘several dozen rioters’ (Bohstedt, 2010). Individual events are defined by actor, time period, and location: one event comprises all riotous violence carried out by the same group, in an individual contiguous territory (e.g. a parish) in a week.
Importantly, as the compiler of the data concedes, it is unlikely that the dataset represents a true census of all riots that occurred in England in the period under investigation. Rather, it represents a sample of events that is likely to be systematically biased towards the incorporation of rather large-scale riots relative to smaller riots. Similar to datasets on present-day violent events, the historical riot census can only capture events that were sufficiently significant to find their way into magistrates’ or court records. In addition, the dataset focuses explicitly on time periods during which food riots ‘clustered’. For example, a specific decade may have seen multiple food riots. Other years or periods may have experienced only single riot events. The riot census has explicitly focused on recording riot events that occurred in periods during which riots clustered in time. By focusing particularly on such riot episodes, the dataset underreports single, isolated riot events. Consequently, years for which no riot has been reported in the dataset may either have seen no riots at all or only single and/or minor riots (that have not found their way into the dataset). We explain below how we deal with these data shortcomings.
We have systematically geo-coded the location information provided in the census dataset. Our main outcome variable is measured with a binary indicator showing the occurrence or absence of a riot in a given grid-year. In our main models, we consider only those food riots that we have been able to precisely locate in individual towns and cities. We consider all events as part of our robustness checks, which are summarized below. Figure 2 illustrates the grid net used for our empirical analysis as well as the geographical distribution of food riots in the period under investigation.
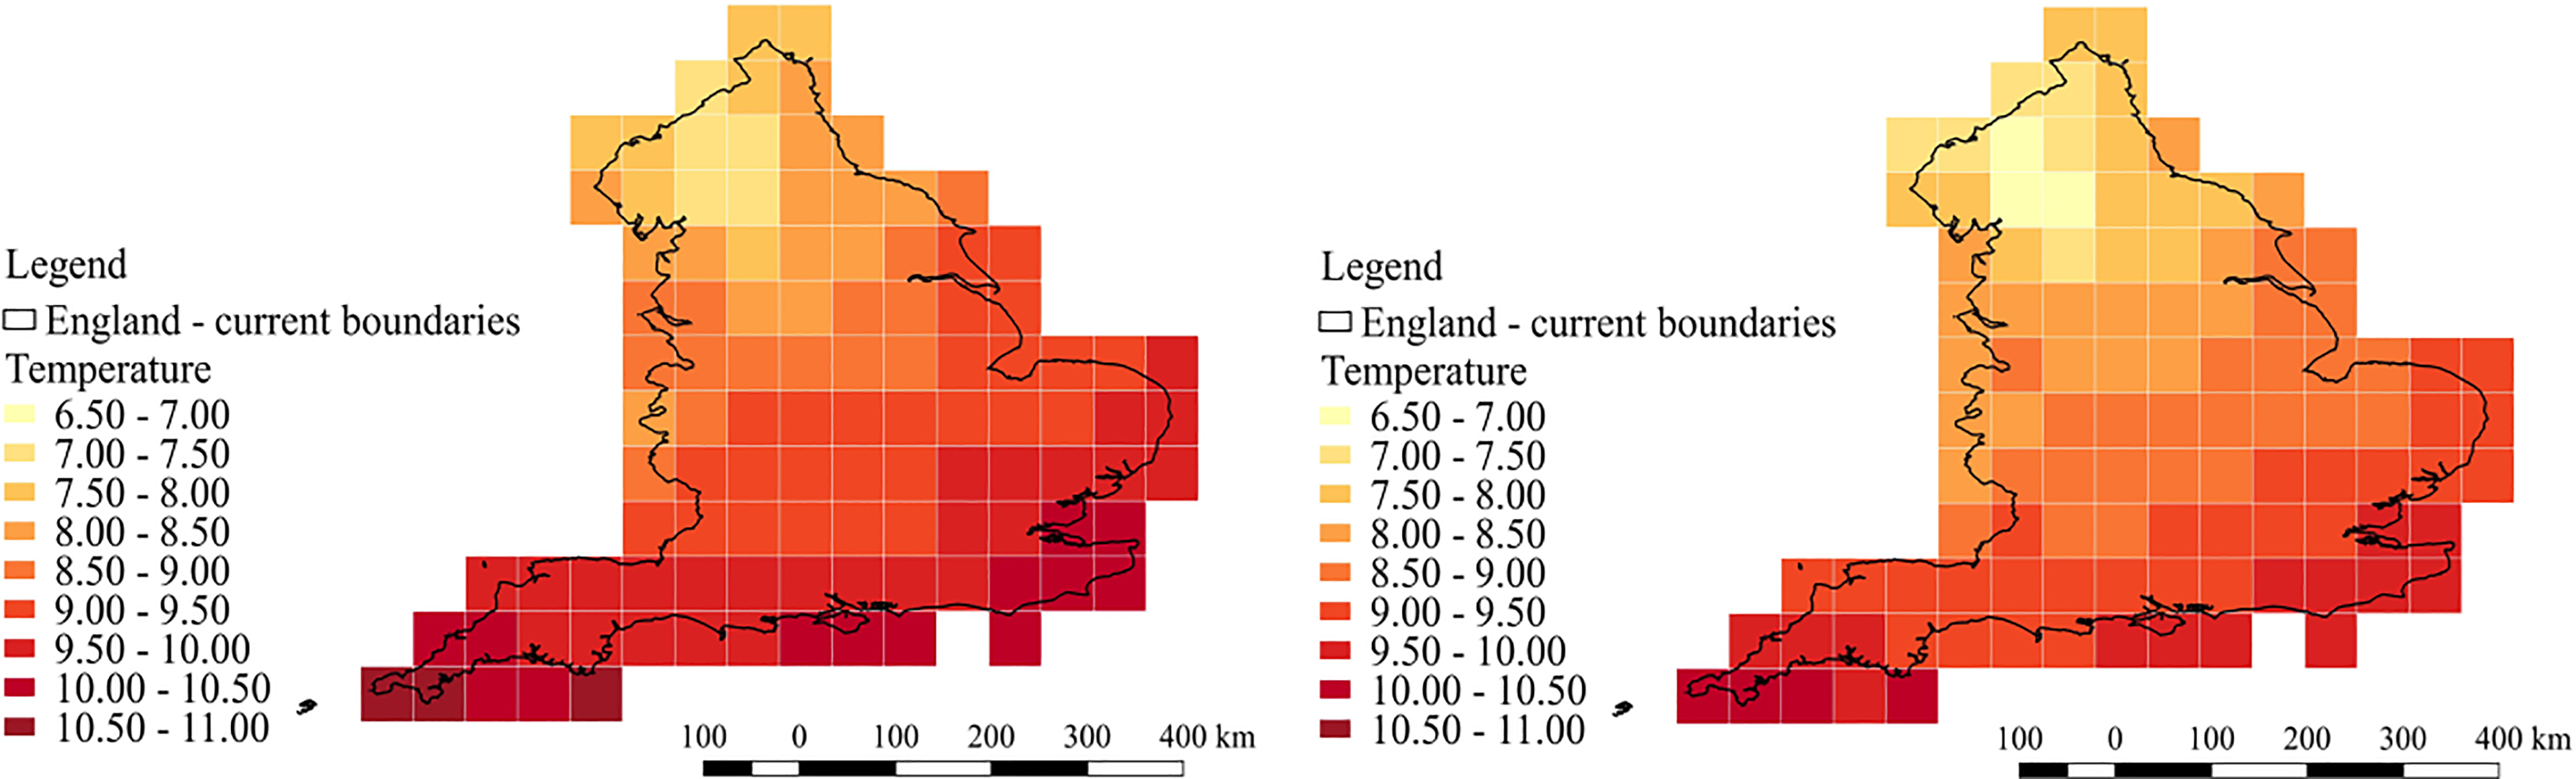
In terms of assessing historical climatic conditions, we focus on yearly temperatures rather than on precipitation levels because the former have been found to be more Grid for analysis and location of food riots Mean yearly temperatures in 1500 and 1817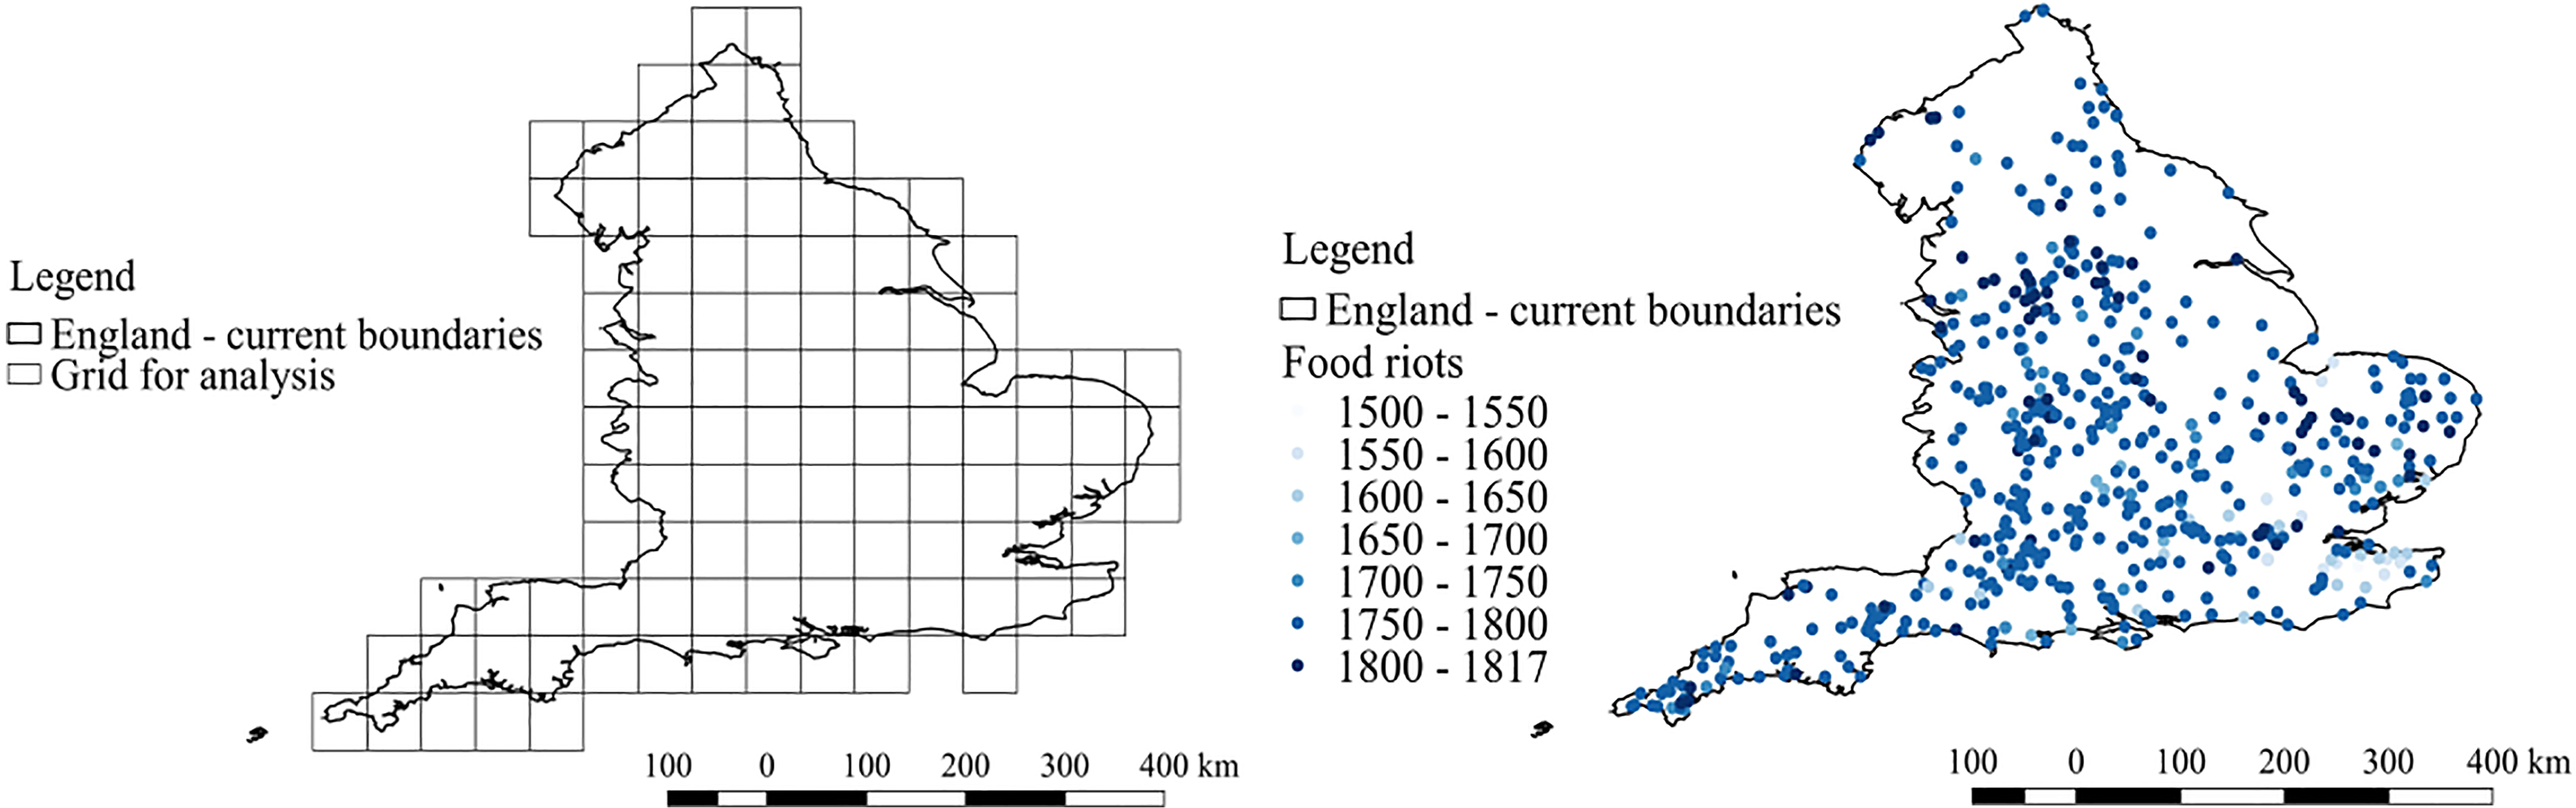
Association between yearly temperatures and riot occurrence
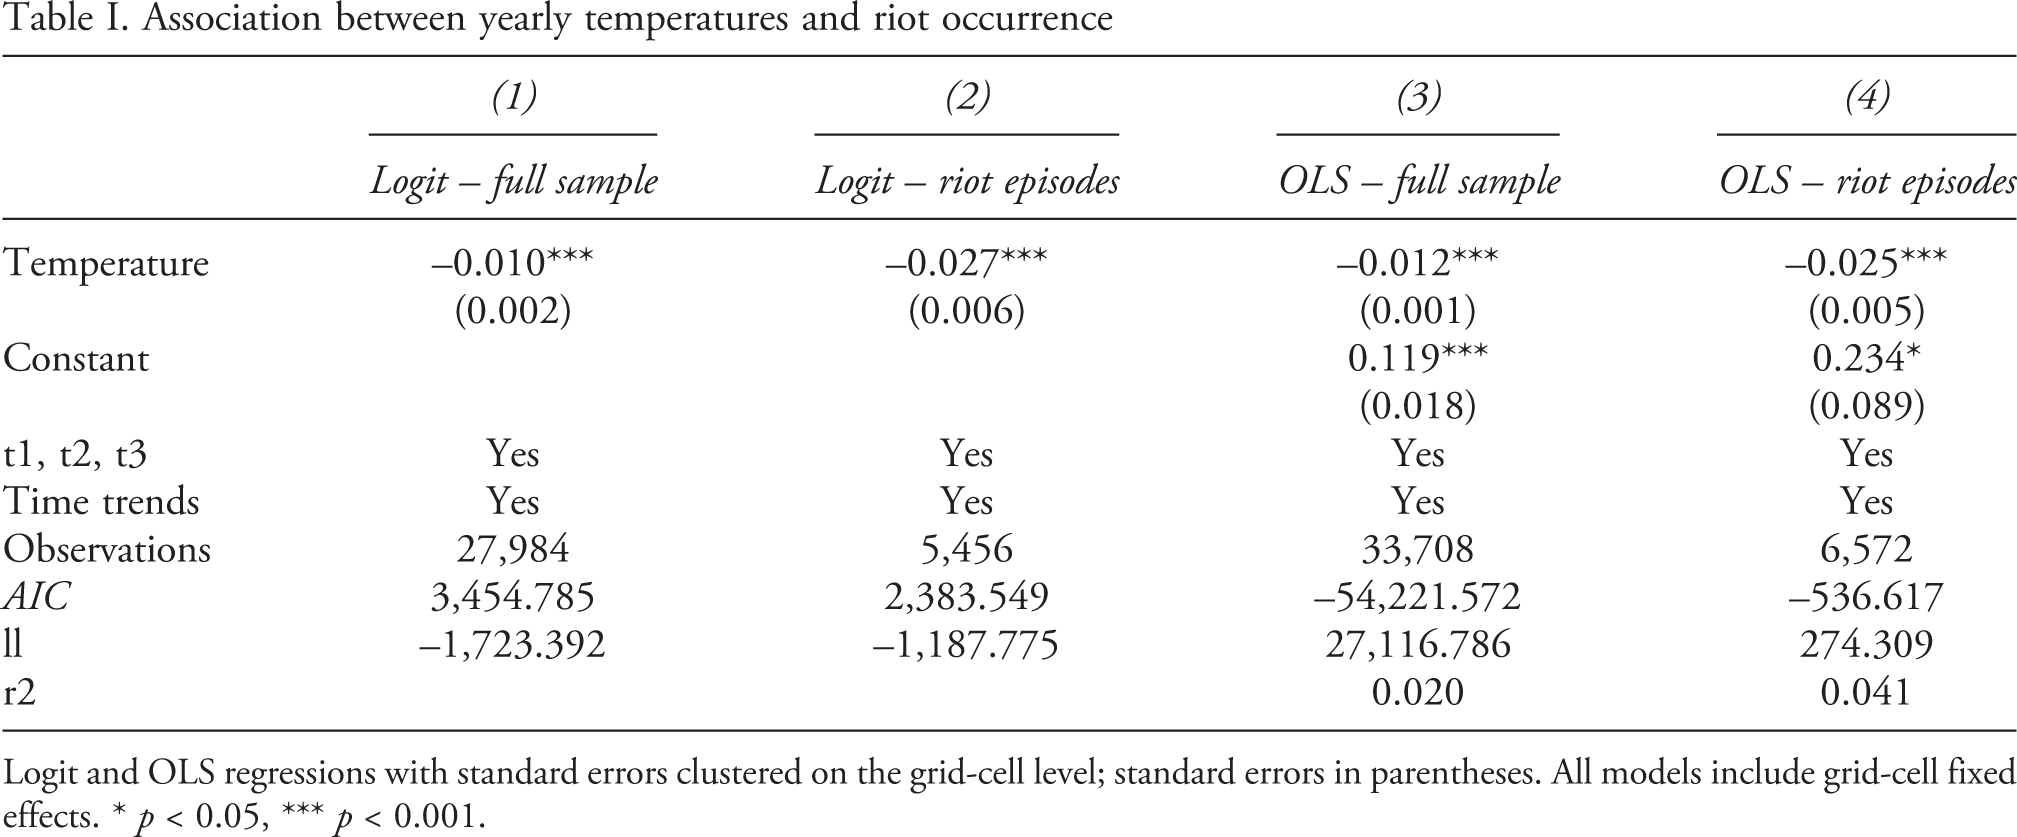
Logit and OLS regressions with standard errors clustered on the grid-cell level; standard errors in parentheses. All models include grid-cell fixed effects. * p < 0.05, *** p < 0.001.
We estimate both types of models to assess the consistency of the results across different modeling approaches – and their respective biases. We first estimate bias-corrected logit fixed effects models using a Stata package developed by Mario Cruz-Gonzalez, Iván Fernández-Val, and Martin Weidner (2017). We report partial effects instead of odds ratios to ease interpretation and comparison of results across models. Second, we estimate LPM with robust clustered standard errors. While we expect both approaches to produce roughly similar results, we consider the LPM as our main models, because this approach allows a more straightforward estimation and interpretation of results – in particular, in more complex models investigating heterogeneous associations between temperatures and riot occurrence.
In order to account for the fact that the riot dataset focuses on riot periods as well as for the resulting measurement error, we estimate models based on two samples. The first set of models uses the entire sample, assuming that the years without reported events have in fact not seen any riots. The second set of models treats years without any riots as missing data. It is restricted to riot periods, limiting the analysis to all those years in which at least one grid cell has seen at least one riot. The advantage of the first sample is that it allows us to investigate a full panel covering all areas of England across all years from 1500 to 1817. The disadvantage is a potential measurement error in our outcome variable resulting from systematic under-reporting of individual riot events. The advantage of the second approach is a more accurate measurement of our outcome variable – we can be more confident that zeros in the dataset do in fact represent the non-occurrence of a riot in the respective year and cell. The disadvantage of this subsample is that we limit the analysis to a subset of observations with an already elevated risk of riot occurrence. This limits our ability to generalize our findings to the total population of all grid-cells across all time periods. Investigating and comparing both samples allows us to assess how far the measurement error (sample 1) or the subsampling process (sample 2) drive our results.
All our models control for a cubic polynomial to account for serial correlation (Carter & Signorino, 2010); we also control for linear and quadratic time trends. 5 Table I presents the results of our main models. The first two columns display partial effects from logit models estimating correlations between yearly temperatures and the likelihood that the respective grid-year experienced at least one food riot – for the entire sample (column 1) as well as for riot periods only (column 2). Columns 3 and 4 report the results for LPM. Across all models, we find a statistically significant negative correlation between weather conditions and riot occurrence. Importantly, we see that logit and LP models produce comparable results – in terms of direction and coefficient size. This increases our confidence that our results are not driven by biases resulting from either of these two modelling approaches. As we move from the minimum to the maximum temperatures in the sample, the overall riot risk decreases by approximately ten percentage points (based on Model 4). While this represents a substantive association between yearly temperatures and riot occurrence, the effect size is also rather moderate, mirroring the fact that the decentralized and spontaneous occurrence of riots was determined by a variety of factors beyond weather conditions.
Before we move on to assess the extent to which adaptation processes may affect these correlations, we implement a series of robustness checks to assess the sensitivity of our basic findings to changes in model specifications.
First, we re-estimate our main models, adding riots without precise geo-locations. We have located all these events on the respective counties’ centroids. Adding these events to the measurement of our outcome variable does not affect our main results (see Table A.III in the Online appendix). Moreover, we also estimate negative binomial and linear regressions using the total count as well as the log-transformed counts respectively as outcome variables. The models produce substantively similar results as our main models (see Table A.IV in the Online appendix).
Second, we use an alternative measurement for the explanatory variable. We draw on long-term information on the Palmer drought severity index (PDSI) to assess annual variation in moisture. We rely on the PDSI rather than on raw precipitation data because previous studies on historical England have found soil moisture levels to be more relevant for wheat yields than rainfall (Wigley & Atkinson, 1977). We use data from the Old World Drought Atlas that provides a gridded (0.5 x 0.5 degree) reconstruction of the PDSI for Europe and the Mediterranean region for the period under investigation (Cook et al., 2015). In line with previous research, we assume associations between moisture and riot occurrence to be more complex than those for temperatures. In particular, research suggests that moisture deficits and surpluses can negatively affect agricultural yields with a one-year lag (Brandon, 1971; Scott, Duncan & Duncan, 1998). Estimating the effects of moisture conditions on riot occurrence, we find further evidence of the role of weather conditions in influencing the risk of social unrest: very wet and very dry conditions increase the riot risk in the subsequent year (see Table A.V in the Online appendix).
Third, we include two control variables in our analysis (unless specified otherwise, we temporally lag all time-variant explanatory variables by one year). Drawing on projected population data provided by the History Database of the Global Environment (HYDE) developed under the authority of the Netherlands Environmental Assessment Agency (Klein Goldewijk, Beusen & Janssen, 2010; Klein Goldewijk et al., 2011), we include a measure of population size. Among other things, the database presents a time series of population for the last 12,000 years. Information is provided in gridded maps with population counts per 5′ longitude/latitude grid on a five-year basis until 1500 and on a yearly basis thereafter (Klein Goldewijk et al., 2011). We also control for the strength of local social institutions. To this end, we focus on churches, which arguably represented the most widespread and most influential social institutions in the period under investigation. ‘Historic England’ is the public body formally responsible for, among other things, the listing of historical buildings in England. Historic England provides a geo-coded dataset on churches that covers our period of analysis. The data on most churches include precise construction dates, while others have only roughly estimated temporal information (e.g. built in the 17th century). We have coded the construction date as precisely as possible and have included a simple count of churches in our main models. The inclusion of control variables does not affect our main results (see Table A.VI in the Online appendix).
Finally, we assess whether our findings are driven by any specific geographical regions of England. We have divided our sample into four equally sized geographical subsamples (northwest, northeast, southwest, southeast). We find negative correlations between temperatures and riot occurrence across all four subsamples, while the effects are strongest in the southeast and the northwest. Consequently, in the case of England, adverse weather effects do not seem to be limited to any subregions with specific structural baseline conditions (see Tables A.VII to A.X in the Online appendix).
Next, we aim to assess the plausibility of one likely mechanism that may link environmental conditions to food riots: food prices. If correlations presented above really indicate a causal effect of temperatures on riot occurrence, we would also expect to see a negative correlation between temperatures and wheat prices. We therefore combine our climate data with historical information on wheat prices provided in the Abstract of British Historical Statistics (Mitchell & Deane, 1971) and compiled and standardized (silver) in the Allen-Unger Global Commodity Prices Database (Allen & Unger, 2017). The dataset provides information on a variety of commodities on a yearly basis for selected cities across the globe. The historical periods covered vary across cities. Information on wheat prices in years falling within the period of our investigation is provided for four English locations: Exeter, Winchester, Eton, and Chester. We focus on wheat prices rather than on other agricultural commodities because, throughout the period of analysis, no other grain played a more important role in English agricultural production in terms of the total share of agricultural land use (Broadberry, 2015). We investigate these associations more systematically in linear panel regressions using the city-year as the unit of analysis. Models with city fixed-effects provide evidence of a negative correlation between temperatures and wheat prices (see Table A.XI in the Online appendix) lending support to the plausibility of our main underlying assumption that environmental conditions may have affected livelihoods through changes in agricultural prices in the specific case and time period under investigation.
Time-varying correlations
We now move on to assess to what extent the associations between temperatures and riot occurrence vary over time and may have been driven by specific historical time periods. We implement a rolling-window analysis to assess how far coefficients vary over time. The more such variation we observe, the less accurate are linear extrapolations of findings on one period to another period – for example from present associations to expected future associations.
We have selected a 20-year window for our analysis because this roughly corresponds to the temporal extent of analyses in previous studies on present-day associations between climatic conditions and violent conflict. The first window contains observations for the period 1500–19, the second for the period 1501–20, and so on. For each window, we estimate the main LPM presented above – for the total sample and for the riot episodes subsample. Figure 4 plots the coefficients for all 299 estimations per sample as well as the respective 95% confidence intervals. The analysis indicates extreme variation of associations between weather conditions and unrest over time. For most parts of the 16th and 17th centuries, we see few effects of temperatures on unrest. The only significant exceptions are rather small negative effects towards the end of the 16th Variation in associations between temperature and riot occurrence over time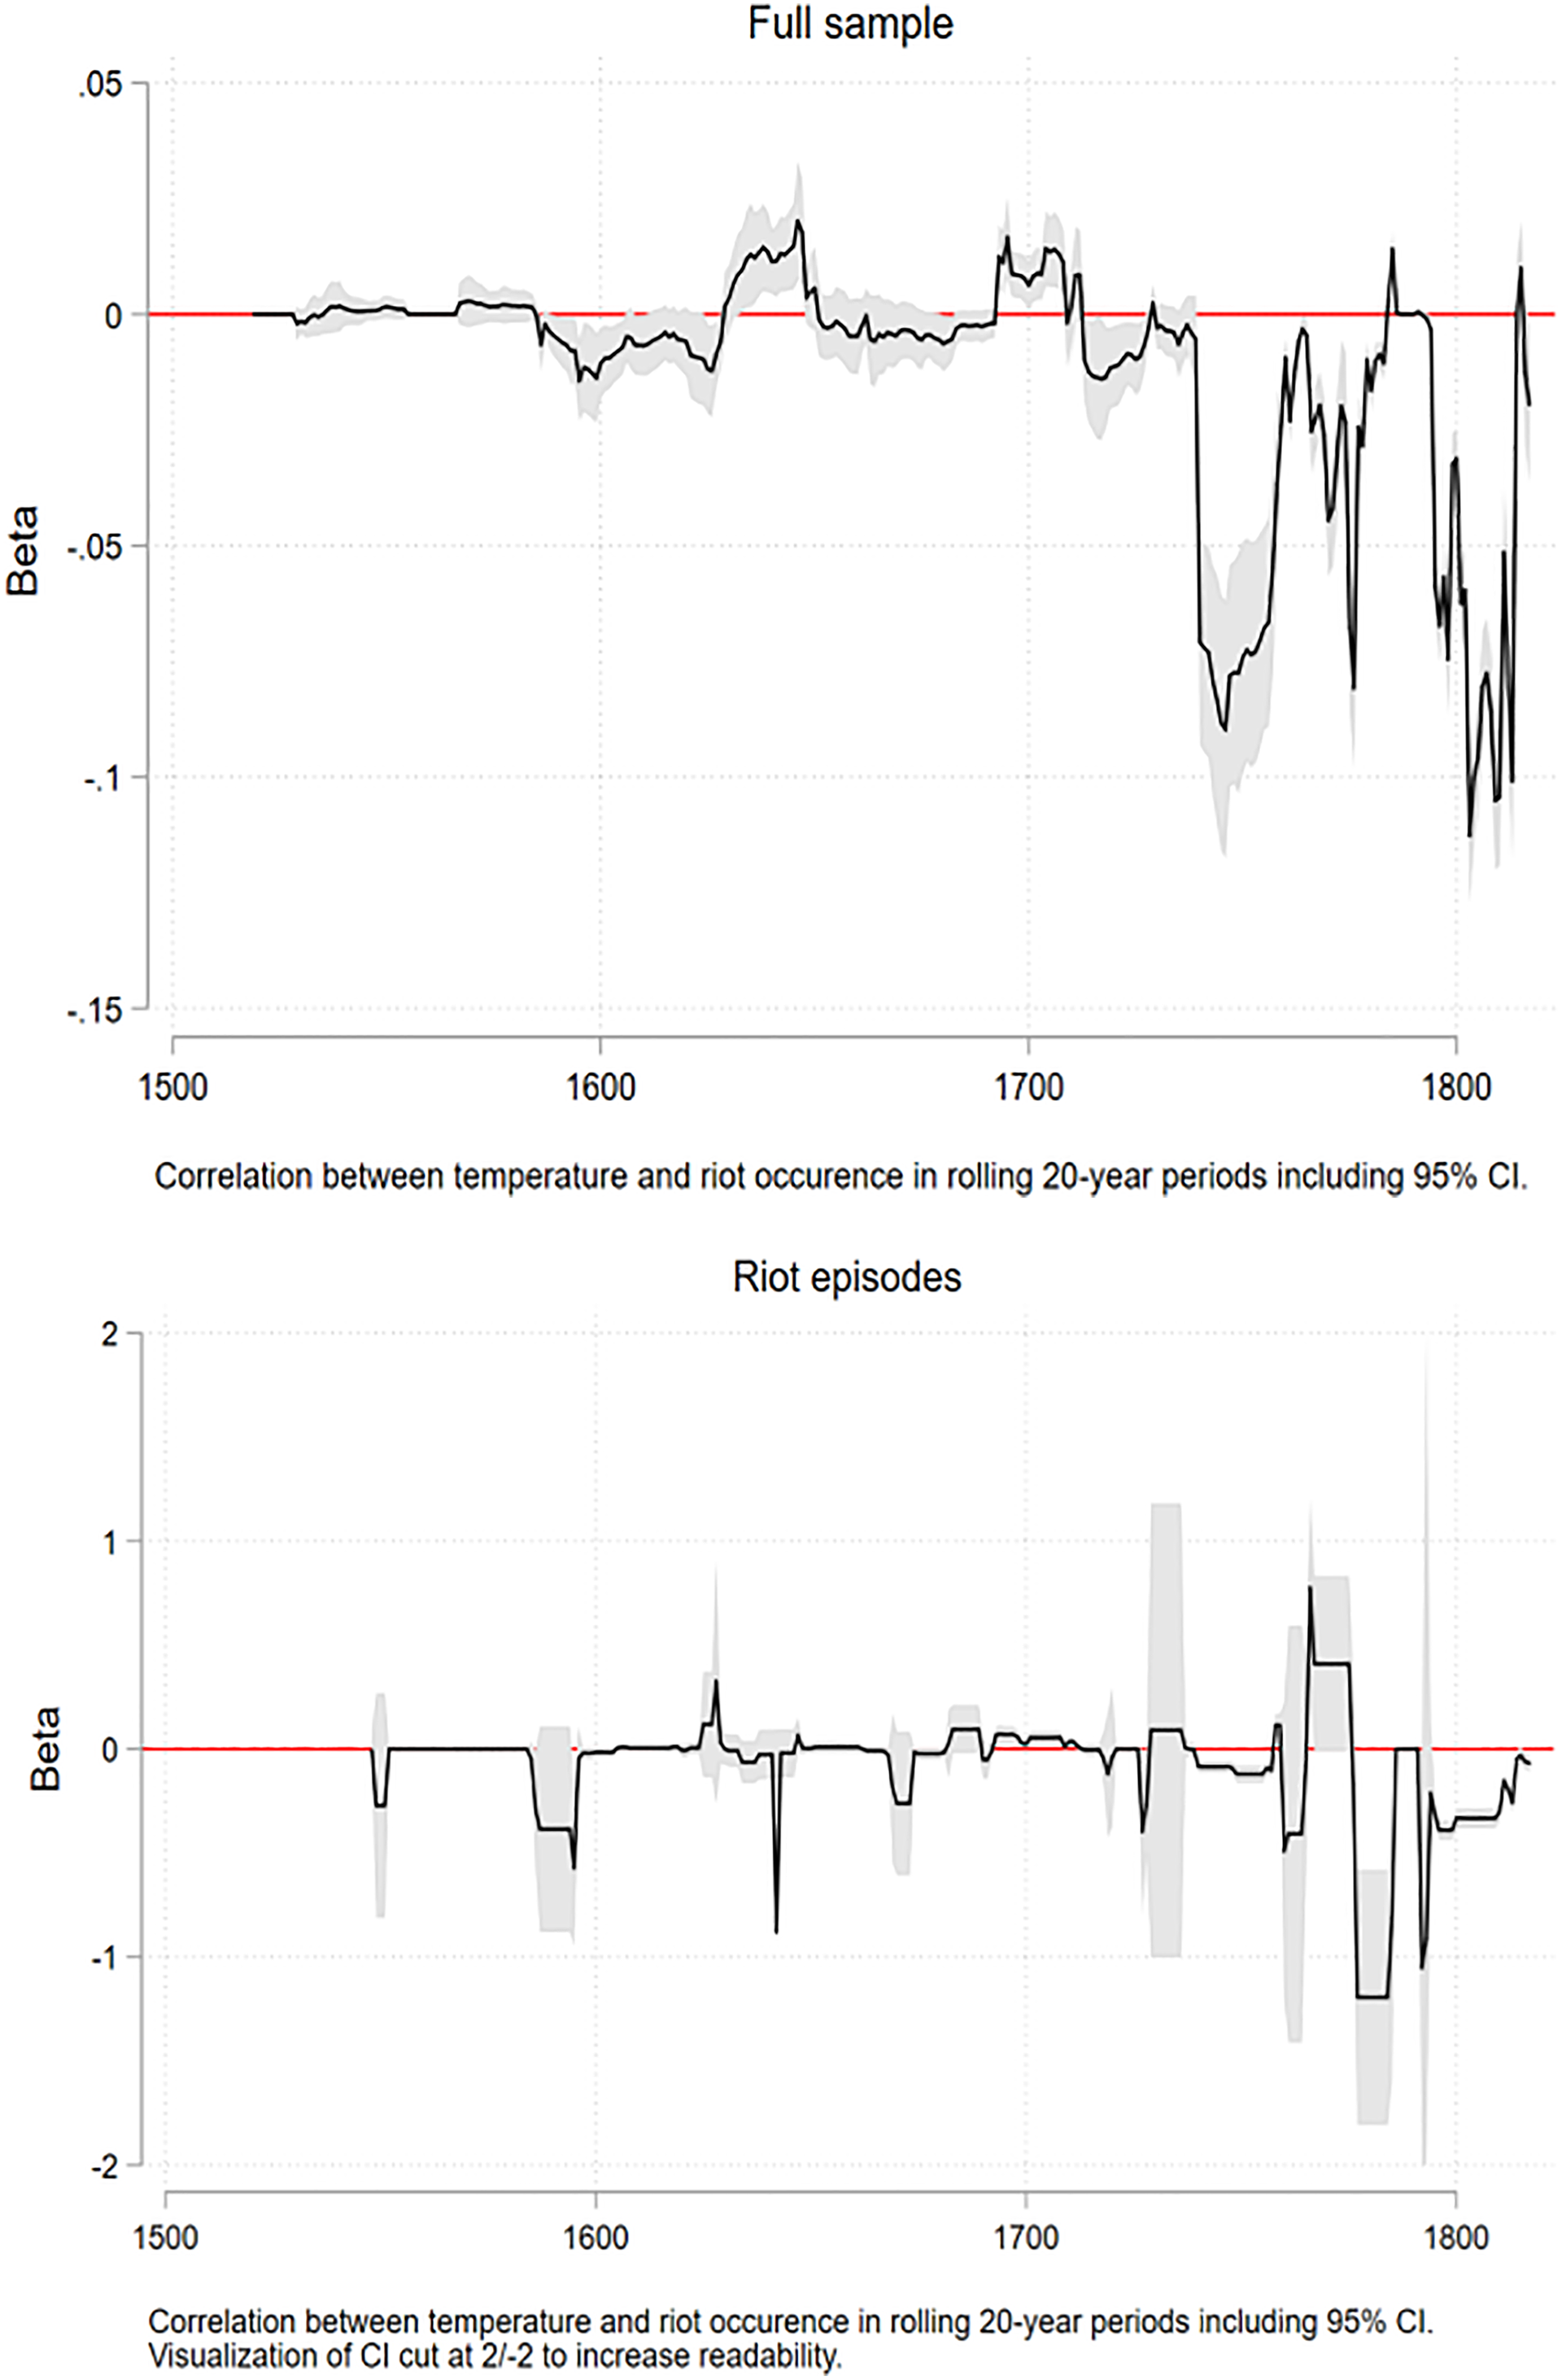
For the specific case of England, the temporal variation could result from a variety of conditions. As noted by Bohstedt (2010: 108), England became the ‘granary of Europe’ in the 18th century, exporting wheat and flour to various countries (cf. Mitchell & Deane, 1971: 94–95). Food export shipments to feed the troops fighting in two major wars during this century (the imperial war with Spain and the Seven Year War from 1756 to 1763) along with accelerated population growth in the second half of the 18th century 6 further contributed to domestic food shortage and hunger (Bohstedt, 2010: 103–112). Moreover, land enclosures by parliamentary act that became the norm in the 1750s may have hampered the subsistence of many famers. According to various authors, parliamentary land enclosures aggravated pressures on rural workers, fostered land inequality, and contributed to the onset of riots (Allen, 1992; Overton, 1996: 174–177; Bohstedt, 2010: 163). Thus, weather-induced bad harvest – in combination with cereal export shipments, population growth, and land enclosures – contributed to high food prices and riots particularly in the 18th century.
In addition, the variation across time may also reflect processes of intensification and adaptation. For example, as previously mentioned, historical records show that England experienced a series of extremely wet winters from 1751 to 1760. This roughly coincides with the strongest negative associations between temperatures and riot occurrence in the mid-1700s as depicted in Figure 4. While farmers may cope with isolated extreme events, a yearly sequence of bad weather poses a more existential threat to their livelihoods. Conversely, substantial cyclical fluctuations in the 18th century may also reflect adaptive processes sketched above: periods of harsh weather conditions and social unrest were followed by agricultural and social adaptation that mitigated the effects of subsequent cold weather periods.
The aim of the following section is to investigate the plausibility of the assumption that intensification and/or adaptation is one of the factors influencing changing effects of yearly temperatures.
Intensification and adaptation
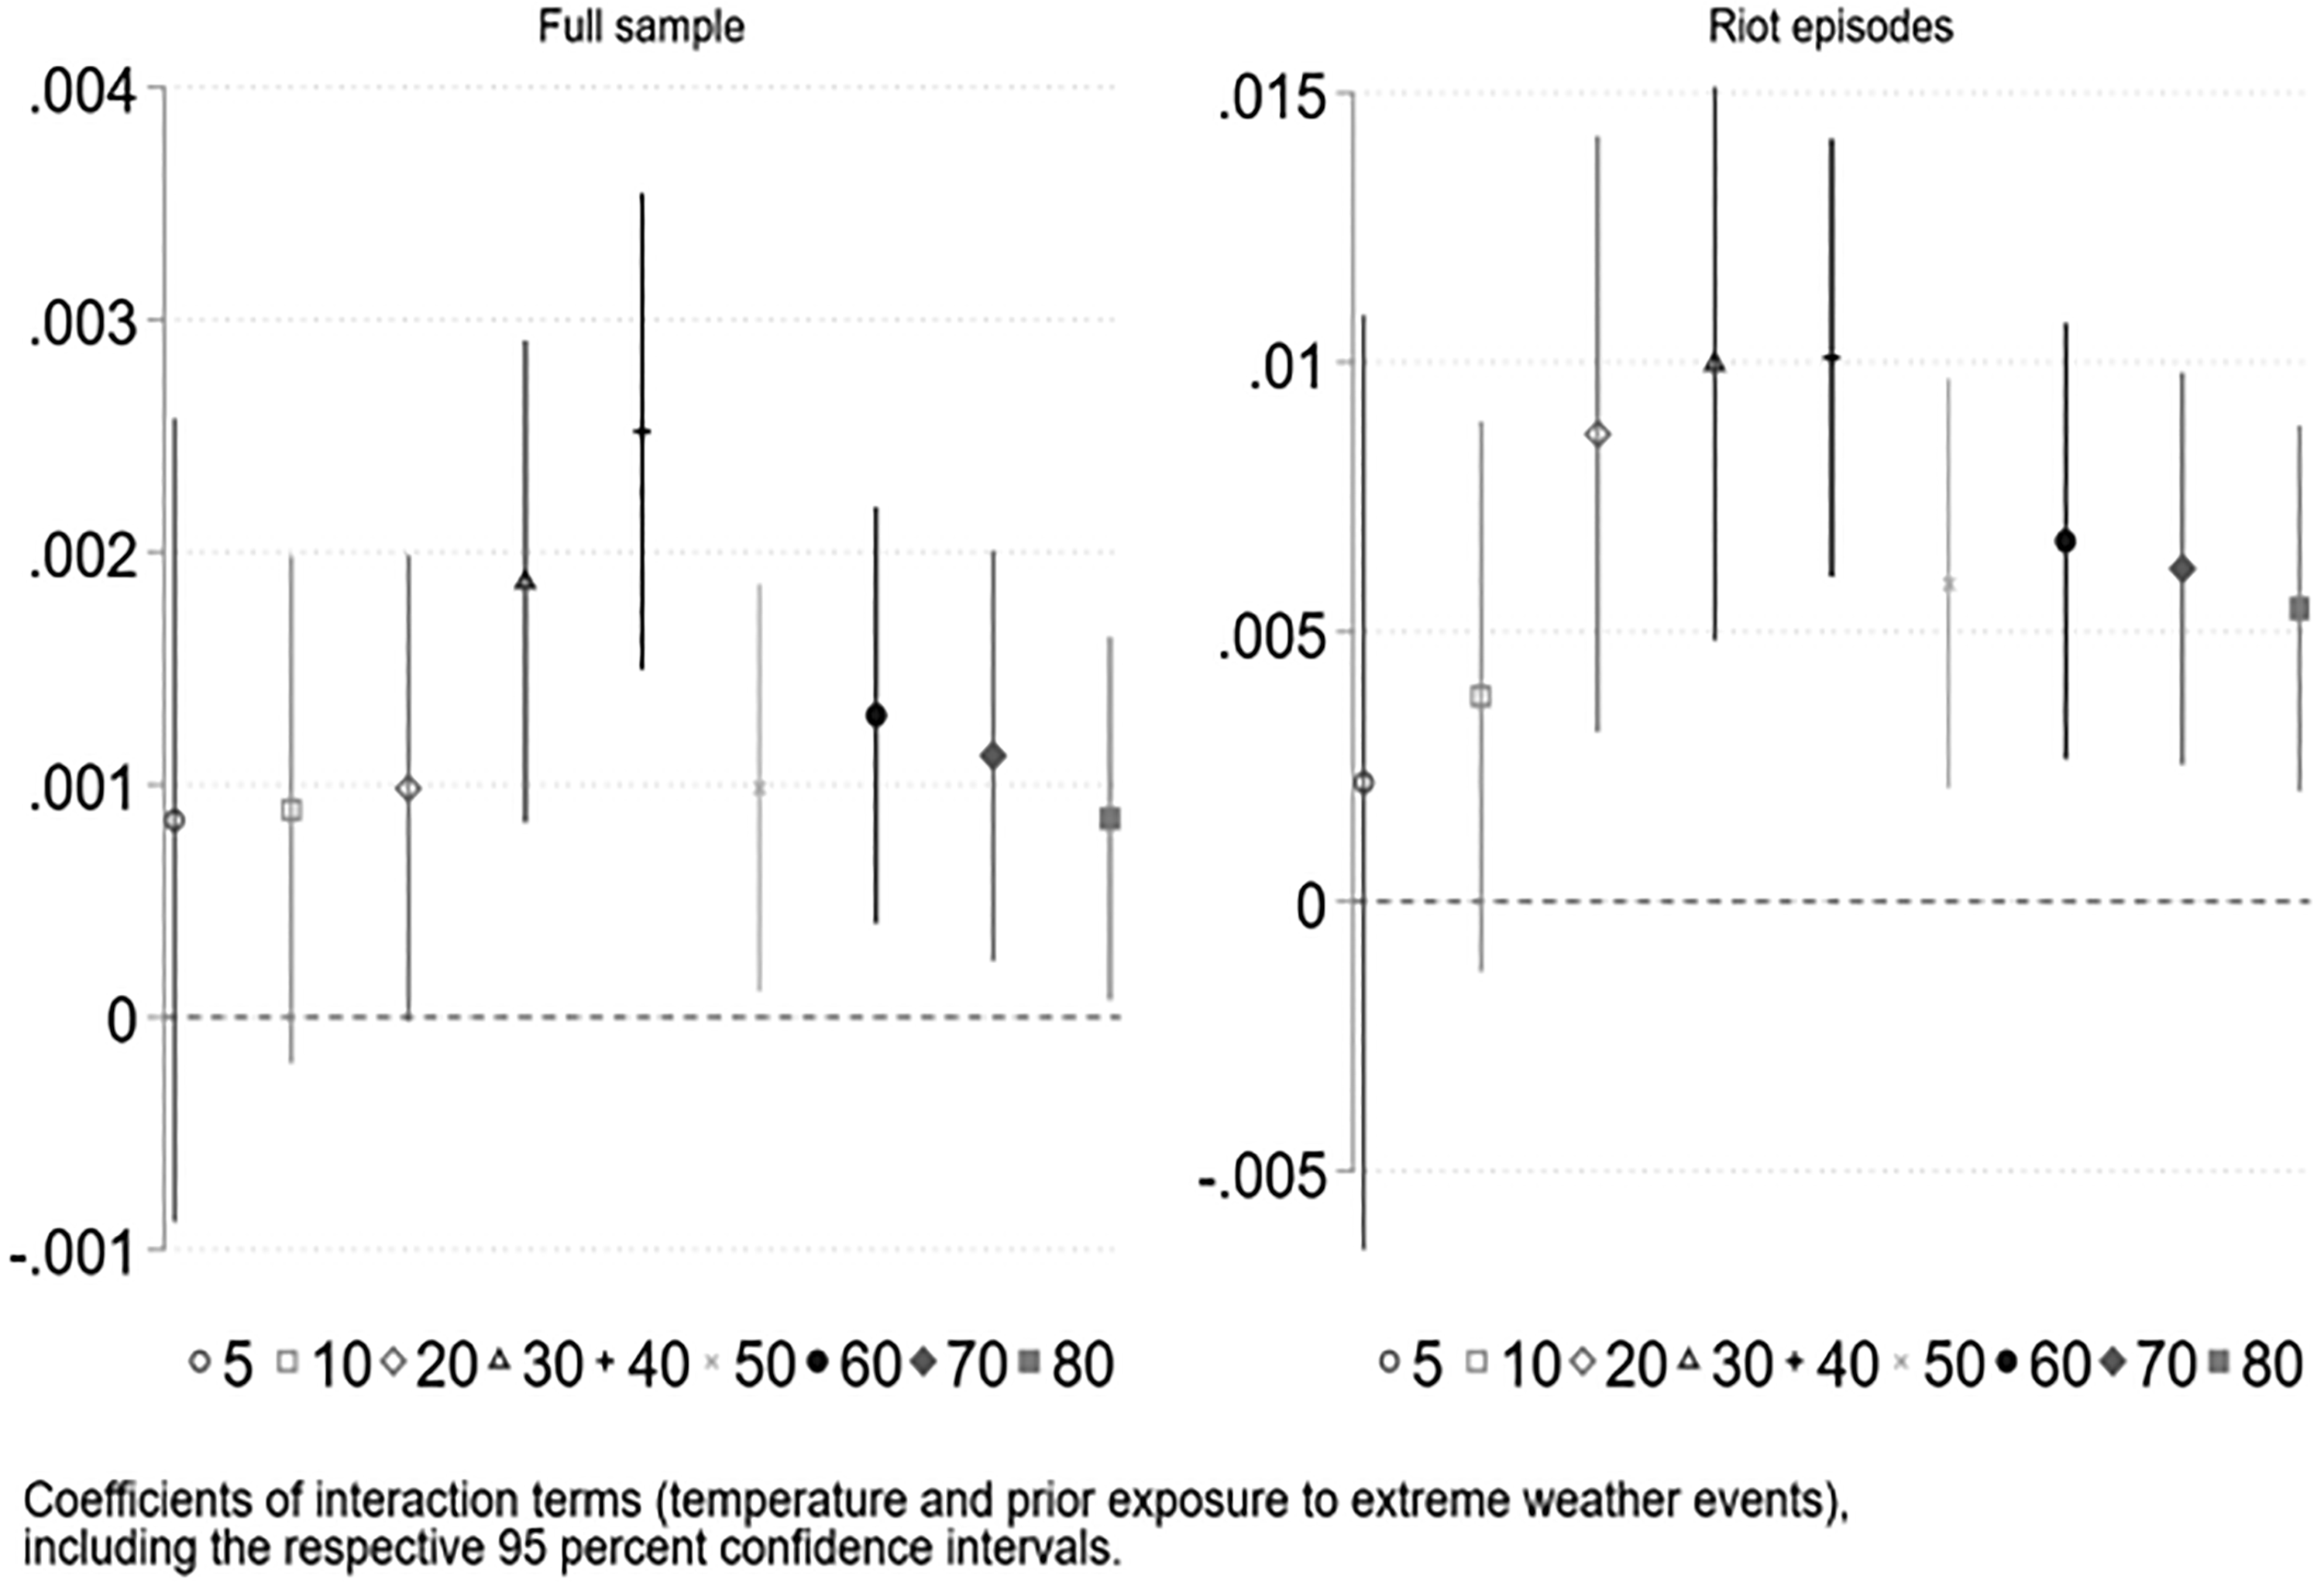
Processes of intensification and/or adaptation may explain some of the temporal heterogeneity of associations between weather conditions and unrest. We start by estimating interaction effects between weather conditions and the total number of years with particularly adverse weather conditions in the past. If intensification or adaptation processes have taken place, we should find that the effects of temperatures on riot occurrence increase or decrease in response to an increasing number of previous extreme weather events. In order to proxy previous exposure to particularly adverse weather conditions, we count the number of years in which a grid cell experienced temperatures lower than two standard deviations below the grid cell’s temperature mean – measured for the period ranging from the first year in our dataset up to the respective year t–1.
We do not have any strong theoretical expectations regarding the temporal scope of intensification or adaptation processes. We have estimated interaction effects between temperatures and the number of previous cold weather shocks within the preceding five, ten, 20, 30, 40, 50, 60, 70, and 80 years. Across models, we find positive interaction terms, which indicate that past exposure in fact reduces the negative effect of temperatures on the current risk of riot occurrence – in line with the expected effects of processes of adaptation (see detailed results in Tables A.XII to A.XXI as well as marginal effects plots for all interactions in the Online appendix).
Figure 5 shows that coefficients of interaction terms (LPM) are comparatively small for very short and very long time periods and largest for an intermediate time period of approximately 30 to 40 years. This result is in line with previous research on adaptation processes. While some forms of tactical (intraseasonal and seasonal) adaptation measures may be accomplished within a span of five years (e.g. adjusting the cropping sequence or changes in sowing date), more substantive forms of adaptation, including the diversification of production systems and livelihoods, soil conservation or spatial shifts in production zones, may take up to several decades (cf. Kandlikar & Risbey, 2000; Park et al., 2012). Conversely, weather shocks that occurred a very long time ago (e.g. 50 or more years previously) may not strongly influence current agricultural practices, as awareness of climate histories wanes over time and past adaptive strategies may not be transmitted across several generations. In fact, studies assessing farmers’ risk perception towards climate change underline that farmers tend to overweigh recent bad weather experience and disregard the prior probabilities of events (cf. Howe & Leiserowitz, 2013: 1489–1490). Also, authors note that there is considerable variation regarding accuracy of recall within populations and that memory of past climatic variability may be distorted in systematic ways (cf. Bryan et al., 2009: 418). Osbahr et al. (2011) find that particularly harsh weather events that happened in consecutive seasons and had a livelihood impact were remembered as important. This may explain why we find the strongest mitigating effects of past weather shocks when measuring processes of adaptation at intermediate temporal scopes (30 to 40 years).
Adaptation with different temporal scopes
Taken together, these results indicate that past weather histories do in fact impact the effect of current weather conditions. However, given the data limitations of our historical analysis, we cannot rule out that alternative mechanisms drive this conditionality. Moreover, we cannot differentiate between various agricultural or institutional channels of adaptation. Nonetheless, the findings are generally in line with the assumption that as people are exposed to repeated instances of extremely adverse weather conditions, they appear to implement political, social or economic changes that reduce their vulnerability to any subsequent unfavorable climatic conditions and conversely lower the risk of social unrest.
Discussion
Our analyses have produced three main results: first, we find a negative effect of yearly temperatures on violent unrest in the aggregate. Second, the impact of climate on social unrest varies across long-term time periods. The fact that we can observe strong effects in one time period does not mean that similar effects are present in other periods. Third, the effects of extreme weather periods are conditioned by weather histories in the medium (decadal) term: previous exposure reduces effects of subsequent exposure. For our case, we find that weather histories and adaptation processes over a period of 30 to 40 years seem to be particularly relevant.
While the external validity of our analysis is, of course, limited by the mainly data-driven focus on a specific case and time period, our results can nonetheless provide relevant insights for research on other regions and present-day effects of environmental conditions.
Across analyses, our results underscore the heterogeneity of climate effects. In particular, adding to previous research stressing the differential impacts of climate change across political and economic contexts, we demonstrate that this effect also varies substantially across long time periods. In line with our own argument, we cannot directly transfer findings for one specific timespan to other long-term periods. More generally, however, our results cast substantial doubt on the assumption that findings on effects of environmental conditions can simply be extrapolated across time. The aggregate climatic conditions, people’s weather vulnerability, institutional capacities, and technological development vary in the long term and shape the effects of weather conditions. Such longer-term temporal developments are certainly not specific to our empirical case. Consequently, it seems plausible that temporal heterogeneities can also be observed in other regions and other temporal periods. To advance our theoretical understanding of the climate–conflict nexus and better assess adaptation and mitigation processes, it seems indispensable to further explore this historical heterogeneity.
Similar arguments apply to our findings supposedly representing processes of adaptation. Periods of adaptation as well as conditions for adaptation are certainly context-specific. We therefore do not expect mitigating effects of past weather conditions to be strongest in a 40-year time window. What is more likely to apply to other cases, however, is the general observation that past weather conditions shape the effects of subsequent weather conditions and that the magnitude of this mediating effect is as context-specific as the direct effect of environmental conditions itself. This is in line with the results of previous studies addressing similar questions in other spatial and temporal contexts, as well as for other forms of unrest – such as analyses on peasant rebellions in historical China or on large-scale violent conflict in Europe as a whole (Jia, 2014; Iyigun, Nunn & Qian, 2017). Thus, our findings add to a more general picture on context-specific adaptation processes that preclude simple temporal extrapolations of present-day associations of environmental conditions and violent unrest.
Conclusions
This article has analyzed the changing impact of yearly temperature variation on riot occurrence in England over a period of more than 300 years. Our analyses have produced two main findings. First, colder temperatures (especially during winter and summer) lead to a higher risk of riot occurrence. While these results lend credibility to the argument that year-to-year weather variation can spur social conflict, we also show that these effects are mainly driven by certain time periods (in the 18th century). Thus, we should be particularly cautious when trying to extrapolate associations between climate change and conflict across time.
Second, our analyses demonstrate that scholars should pay more attention to adaptation processes when studying the effects of environmental conditions on local livelihoods and conflicts. We find evidence that weather histories matter in explaining current risks of violence: the more weather shocks a grid has experienced in the previous 30 to 40 years, the weaker the negative effect of temperature on current riot incidence. These findings speak against common assumptions that present-day associations between weather conditions and social unrest can be used to predict climate-related violence in the future.
However, our analysis also suffers from several shortcomings in addition to those discussed above. Our very long-term historical data introduce a number of uncertainties into our analyses – most notably with respect to the comprehensiveness of the riot data and the reliability of temperature reconstructions. While the consistency of our findings increases confidence in our analyses, other studies may assess our results based on shorter and more recent time periods (e.g. the 19th century) making use of more accurate weather data and other – potentially more fine-grained – data on social unrest.
Moreover, we only assess adaptation processes indirectly by observing previous exposure to harsh weather conditions. Thus, we cannot be sure that the observable conditionality of weather effects does in fact represent processes of adaptation – rather than other mediating mechanisms. We do not know whether past weather histories dampened the risk of social unrest by promoting agricultural adaptation practices or rather by unleashing sociopolitical responses such as the enactment of food export bans or poverty alleviation programs such as the Old Poor Laws. Future research could investigate more specific associations between past environmental conditions, concrete adaptive processes, and the subsequent risk of unrest.
Footnotes
Replication data
Acknowledgements
We want to thank John Bohstedt for sharing his data on food riots with us, Leif Strößner and Pawel Komendziński for their excellent research assistance, and Vally Koubi and two anonymous reviewers for comments on previous versions of the manuscript.
Funding
Research support from the German Research Foundation is gratefully acknowledged (WE4850/1-2).
Notes
References
Supplementary Material
Please find the following supplemental material available below.
For Open Access articles published under a Creative Commons License, all supplemental material carries the same license as the article it is associated with.
For non-Open Access articles published, all supplemental material carries a non-exclusive license, and permission requests for re-use of supplemental material or any part of supplemental material shall be sent directly to the copyright owner as specified in the copyright notice associated with the article.