
Abstract
Confidence has an important influence on consumer behavior. Beyond what consumers know or believe, the confidence with which they hold such knowledge or beliefs (i.e., how certain they feel) shapes their judgments, decisions, and actions. But how does confidence shift as consumers gain experience? And what are the consequences for consumer choice? A multimethod investigation combines computational linguistics, machine learning, and experiments to examine these questions. Analysis of 3.7 million reviews from almost 100,000 consumers spanning nearly 30 years reveals a common confidence trajectory. Across diverse product categories (e.g., wine, beer, cosmetics) there is a U-shaped relationship between experience and confidence. While gaining initial experience decreases confidence, eventually, with more experience, confidence rebounds. Further, feeling less confident leads consumers to avoid options associated with uncertainty and choose something different. This includes picking different products, avoiding brands associated with the uncertainty, and waiting longer to choose from those brands again. Taken together, these findings shed light on the evolution of confidence, how uncertainty shapes choice, and drivers of product switching and brand loyalty more generally.
Confidence has an important impact on consumer behavior. Beyond what people know or believe, the confidence with which they hold such knowledge or beliefs (i.e., how certain they feel) shapes their judgments, decisions, and actions. The more confident consumers are that a service will meet their needs, for example, the more likely they are to adopt it. The more investors feel they know a stock's potential, the more likely they are to buy it. And decades of research find that feeling more confident about something makes people more likely to advocate for it, less likely to change their mind, and more likely to act in line with that knowledge or belief (Bassili 1996; Maglio and Reich 2019; Rucker and Petty 2004).
But does confidence change as consumers gain experience? And if so, how?
Consumers are constantly gaining experience in almost every domain of life. As people try more wines, for example, they gain experience with different varietals, and as they listen to music, they learn more about different genres.
Compared with watching others, actually using a product makes people feel more confident (e.g., Fazio and Zanna 1978; Smith and Swinyard 1988; Wu and Shaffer 1987), so one could imagine that experience increases confidence. After all, experience improves memory (LaTour and LaTour 2010), decision making (Mitchell and Dacin 1996), and decision speed (Hutchinson and Alba 1991). Consequently, the increased knowledge that experience provides might make consumers feel more confident about their knowledge, opinions, and beliefs.
But is that actually the case?
A multimethod investigation combines computational linguistics, machine learning, and experiments to examine this question. Using natural language processing of more than 3.7 million observations from nearly 100,000 consumers, we find that rather than a linear increase, there is a U-shaped relationship between confidence and experience. While gaining initial experience decreases confidence, eventually, with more experience, confidence rebounds. Further, the results demonstrate how these confidence shifts shape consumer behavior. The more uncertain (i.e., less confident) consumers feel, the more likely they are to avoid products associated with the uncertainty, and switch to something different. 1
This work makes four main contributions. First, it sheds light on how experience changes confidence, revealing a novel U-shaped relationship. This relationship is consistent across product categories, time, and demographics, indicating a common trajectory. This suggests that consumer experience represents a developmental journey marked by predictable, distinct phases of knowledge acquisition that shape how confidence evolves.
Second, this pattern contributes to research on consumer learning and experience. Given that confidence reflects how well people believe they understand something (Alba and Hutchinson 2000; Hutchinson and Eisenstein 2008), the fact that it decreases as consumers gain initial experience indicates that they are realizing there is more to learn than they initially thought—they are learning what they do not know. This indicates a shared period of “metacognitive recalibration” where consumers are adjusting their beliefs about their own understanding. This is a novel phase in consumer learning that has not been identified previously.
Third, this work highlights a paradigm to understand the effects of experience. Studying direct experiences over time is difficult. It can take days, months, or years for experience to accrue, and experiences are hard to observe. Online reviews offer a solution. Given that language reflects things about the people who use it (Berger et al. 2020), changes in consumer language over time can document how confidence evolves. This approach can help future research explore how direct experience influences other consumer phenomena.
Fourth, this work deepens understanding of what drives choice, loyalty, and brand switching. Theories of brand loyalty often suggest that positive experiences should increase loyalty (e.g., Oliver 1999). We demonstrate that uncertainty also plays a role. Even if consumers like a product, feeling uncertain encourages them to try something else and avoid the same brand. These insights indicate that measuring and managing consumer uncertainty can improve customer acquisition and retention.
Confidence
Confidence is the subjective sense of conviction in one's understanding and judgments of something (Alba and Hutchinson 2000; Hutchinson and Eisenstein 2008; Milliken 1987). A golfer, for example, might feel confident about which club to use when stuck in the rough, and a foodie might feel confident about which wine to pair with fresh scallops.
Greater confidence is associated with a range of outcomes. It influences the impact of knowledge, attitudes, and beliefs, for example, as well as their discussion and persistence (Tormala and Rucker 2018). Specifically, consumers who are more confident in a belief are more likely to share it (Maglio and Reich 2019), less likely to change it (Bassili 1996), and more likely to rely on it to make decisions (Rucker and Petty 2004). Confidence in the benefits of electric vehicles, for example, should encourage consumers to buy them and share word of mouth.
While various factors can impact confidence (e.g., social consensus or information consistency; Petrocelli, Tormala, and Rucker 2007; Smith et al. 2008), one key driver is product-related experiences (Fazio and Zanna 1978; Smith and Swinyard 1988; Wu and Shaffer 1987). Test-driving a car, for example, can shed light on how responsive the steering is, leading consumers to be more confident in the car's performance and more likely to buy it.
But while research has investigated how one-off experiences (e.g., a product trial) impact confidence, in many domains (e.g., food, wine, or technology), consumers are constantly gaining additional experiences. Each meal, glass of wine, or new app download provides additional information that builds knowledge. Consequently, though any individual experience could theoretically increase or decrease confidence, might accumulating experiences over time have a consistent effect? And if so, what might that effect be?
Experience
The number of experiences a person has in a domain has a long history of importance across both marketing and psychology (Alba and Hutchinson 1987; Hutchinson and Eisenstein 2008). Having more experience predicts better and quicker decision-making (Logan 1988; Mitchell and Dacin 1996), more strongly held beliefs (Fazio et al. 1982), and better performance (Bilalić, McLeod, and Gobet 2007).
But while direct, firsthand experience (e.g., trying a product) often has a bigger impact than indirect experience (e.g., advertising, word of mouth; Kotler 1988; Marks and Kamins 1988), it is difficult to study, particularly over time. Though data exist on advertising exposure, for example, information on which products people try over time (particularly offline) is less accessible. Consequently, consumer behavior research on direct experience has focused on single instances (Hoch and Deighton 1989). Nowlis and Shiv (2005), for example, gave people one sample of food, and Hamilton and Thompson (2007) had consumers try a music player once.
In many domains, however, consumers are constantly accumulating direct experience. Each time they use a product or service, they gain firsthand knowledge (Hutchinson and Eisenstein 2008). These interactions encourage iterative learning (Carpenter and Nakamoto 1989; Hoch and Ha 1986), and the accumulation of experience provides a richer understanding, facilitating the transition from awareness to deeper knowledge (Alba and Hutchinson 1987).
A wine drinker might initially only know the difference between white and red, for example, but as they drink more glasses, their understanding becomes more refined. They start to recognize differences between cabernet and merlot, and develop a richer framework to evaluate and categorize varietals. Indeed, experience often generates a more structured and organized knowledge base (Mitchell and Dacin 1996), which makes future selections quicker and more informed (Brucks 1985). Consequently, understanding experience's impact has implications for everything from product development to advertising strategy (Cowley and Janus 2004).
Confidence and Experience
While it is clear that confidence and experience are important and related constructs, surprisingly little is known about their relationship. Indeed, to our knowledge, no work has examined the longitudinal effect of consumer experience on confidence. Further, while some work might suggest that greater experience increases confidence (Hutchinson and Eisenstein 2008; Spence 1996), other work suggests the exact opposite (i.e., that experience might decrease confidence; Clance and Imes 1978; Høegh-Larsen et al. 2023; Lyons et al. 2021).
To fill this gap, we test the relationship between experience and confidence. We predict a U-shaped relationship. Specifically, we predict that consumers will start out with relatively high confidence. Indeed, consistent with this suggestion, research suggests that inexperienced consumers often start with an inflated sense of conviction of their understanding of a domain (Alba and Hutchinson 2000; Kruger and Dunning 1999), because they are often unaware of gaps in their knowledge (Lichtenstein, Fischhoff, and Phillips 1982).
As consumers gain more experience in a domain, however, we hypothesize that their confidence will dip. With experience, consumers may start to recognize that they do not have as much understanding as they thought. Research on problem solvers, for example, has shown that they were confident initially (because they focused on what they knew, and were unaware of what they did not), but once their knowledge gaps were highlighted, their confidence decreased to match their actual skill (Caputo and Dunning 2005). By highlighting nuance, demonstrating a domain's breadth, or identifying discrepancies, each experience can reveal additional knowledge gaps, which, in turn, should reduce confidence as consumers recognize how much they do not know.
As consumers continue to accumulate experience, however, we suggest that they may fill some gaps, and regain confidence. Experienced consumers are more adept at recognizing gaps in their knowledge and closing them (Brucks 1985). Moreover, greater knowledge enables people to process information more efficiently and make better decisions (Johnson and Mervis 1997; Mitchell and Dacin 1996), which predicts greater confidence (Hutchinson and Eisenstein 2008). Thus, experience can provide consumers with knowledge that increases their confidence.
Note that while our suggestion that consumers start confident is consistent with the Dunning–Kruger effect (that people with low knowledge nevertheless have high confidence; Kruger and Dunning 1999), that work is cross-sectional, not longitudinal, and thus does not speak to whether and in what way confidence shifts once novice consumers gain direct experience. This work fills that gap.
The Current Research
A multimethod investigation examines the relationship between experience and confidence, and the consequences for consumer choice. Studying experience over time, though, is often challenging. It can take days, months, or even years for experiences to accrue, requiring time and investment to capture. Consequently, rather than being longitudinal, most studies examining the confidence–experience link have been cross-sectional, comparing different individuals who have more or less experience (Lichtenstein, Fischhoff, and Phillips 1982; Shanteau and Stewart 1992).
To address these challenges, we take a different approach. Specifically, we leverage online reviews. While reviews have been used to understand various aspects of marketing (e.g., Wang et al. 2022; see also Berger et al. 2020), they are rarely used to track the same consumer over time. When people write multiple reviews across time, though, this information provides a unique chance to map their confidence journey as they acquire experience. Consequently, we use natural language processing and machine learning to analyze reviews and examine how confidence changes as consumers gain direct experience in a domain.
First, using a large-scale analysis of online wine reviews, Study 1 examines the relationship between experience and confidence. Next, Studies 2 and 3 use a different product category (beer), and two different websites and consumer groups, to test generalizability. Then, Study 4 further broadens the scope, examining a domain that has a different user base and longer interpurchase times (i.e., cosmetics). Finally, Study 5 uses an experiment. Along the way, we also use these studies to investigate the consequences of shifts in confidence for product choice and brand loyalty.
Finally, given that prior work suggests that experience quality contributes above and beyond quantity (Hutchinson and Eisenstein 2008), we also test whether the quality of an experience (i.e., how analytically someone approaches it) changes how soon consumers recover their confidence.
Study 1a: 30,000 Wine Drinkers over Time
Study 1a provides an initial test of how experience shapes confidence. Specifically, we use computational linguistics to analyze a million tasting notes written by more than 30,000 wine drinkers over almost ten years. We predict a U-shaped relationship.
Method
We obtained all “tasting notes” from the CellarTracker website from its creation in 2003 to 2012 (nine years; McAuley and Leskovec 2013). Consumers use these “notes” to record their experiences with each wine they sample, including its taste, aroma, and whether they enjoyed it. There were 1,046,922 tasting notes from 30,141 consumers (M = 35 notes per consumer, SD = 149.46) that included words from the Certainty Lexicon (Rocklage et al. 2023) and were used in the final analysis.
Each wine someone tastes adds to their experience. Consequently, following prior work (e.g., Rocklage, Rucker, and Nordgren 2021), we arranged each individual's tasting notes in chronological order and assigned them sequential numbers. Consumers who tasted 30 wines, for example, would have their notes numbered 1 to 30. Given that some consumers contributed many notes, we log-transformed this measure so they would not have undue influence on the results.
The Certainty Lexicon (Rocklage et al. 2023) was used to quantify confidence. This computational linguistic tool contains 3,485 words and phrases rated based on the confidence or certainty they imply (0 = “very uncertain,” and 9 = “very certain”). “Beyond any doubt,” for example, received a score of 8.81, and “I really don’t know” received a score of .76 (both out of 9.00). These underlying numerical values are then used in place of the word or phrase when each is encountered in the text. “
As discussed, one could hypothesize that experience leads to increases, decreases, or a nonlinear relationship with confidence. Consequently, the data were analyzed using generalized additive mixed models (GAMMs), a bottom-up data-driven modeling approach. 3 We used the default degrees of smoothing provided in the R package mgcv (k = 10; Wood 2017), where k specifies the maximum flexibility of the smooth functions, balancing the fit's complexity against overfitting. 4
Results
Consistent with our theorizing, results revealed a U-shaped relationship between confidence and experience (see Figure 1; F = 45.01, effective degrees of freedom [e.d.f.] = 8.07, p < .001). While confidence started high, as consumers gained experience (i.e., tried more wines), confidence decreased. Then, as consumers gained more experience, confidence recovered.
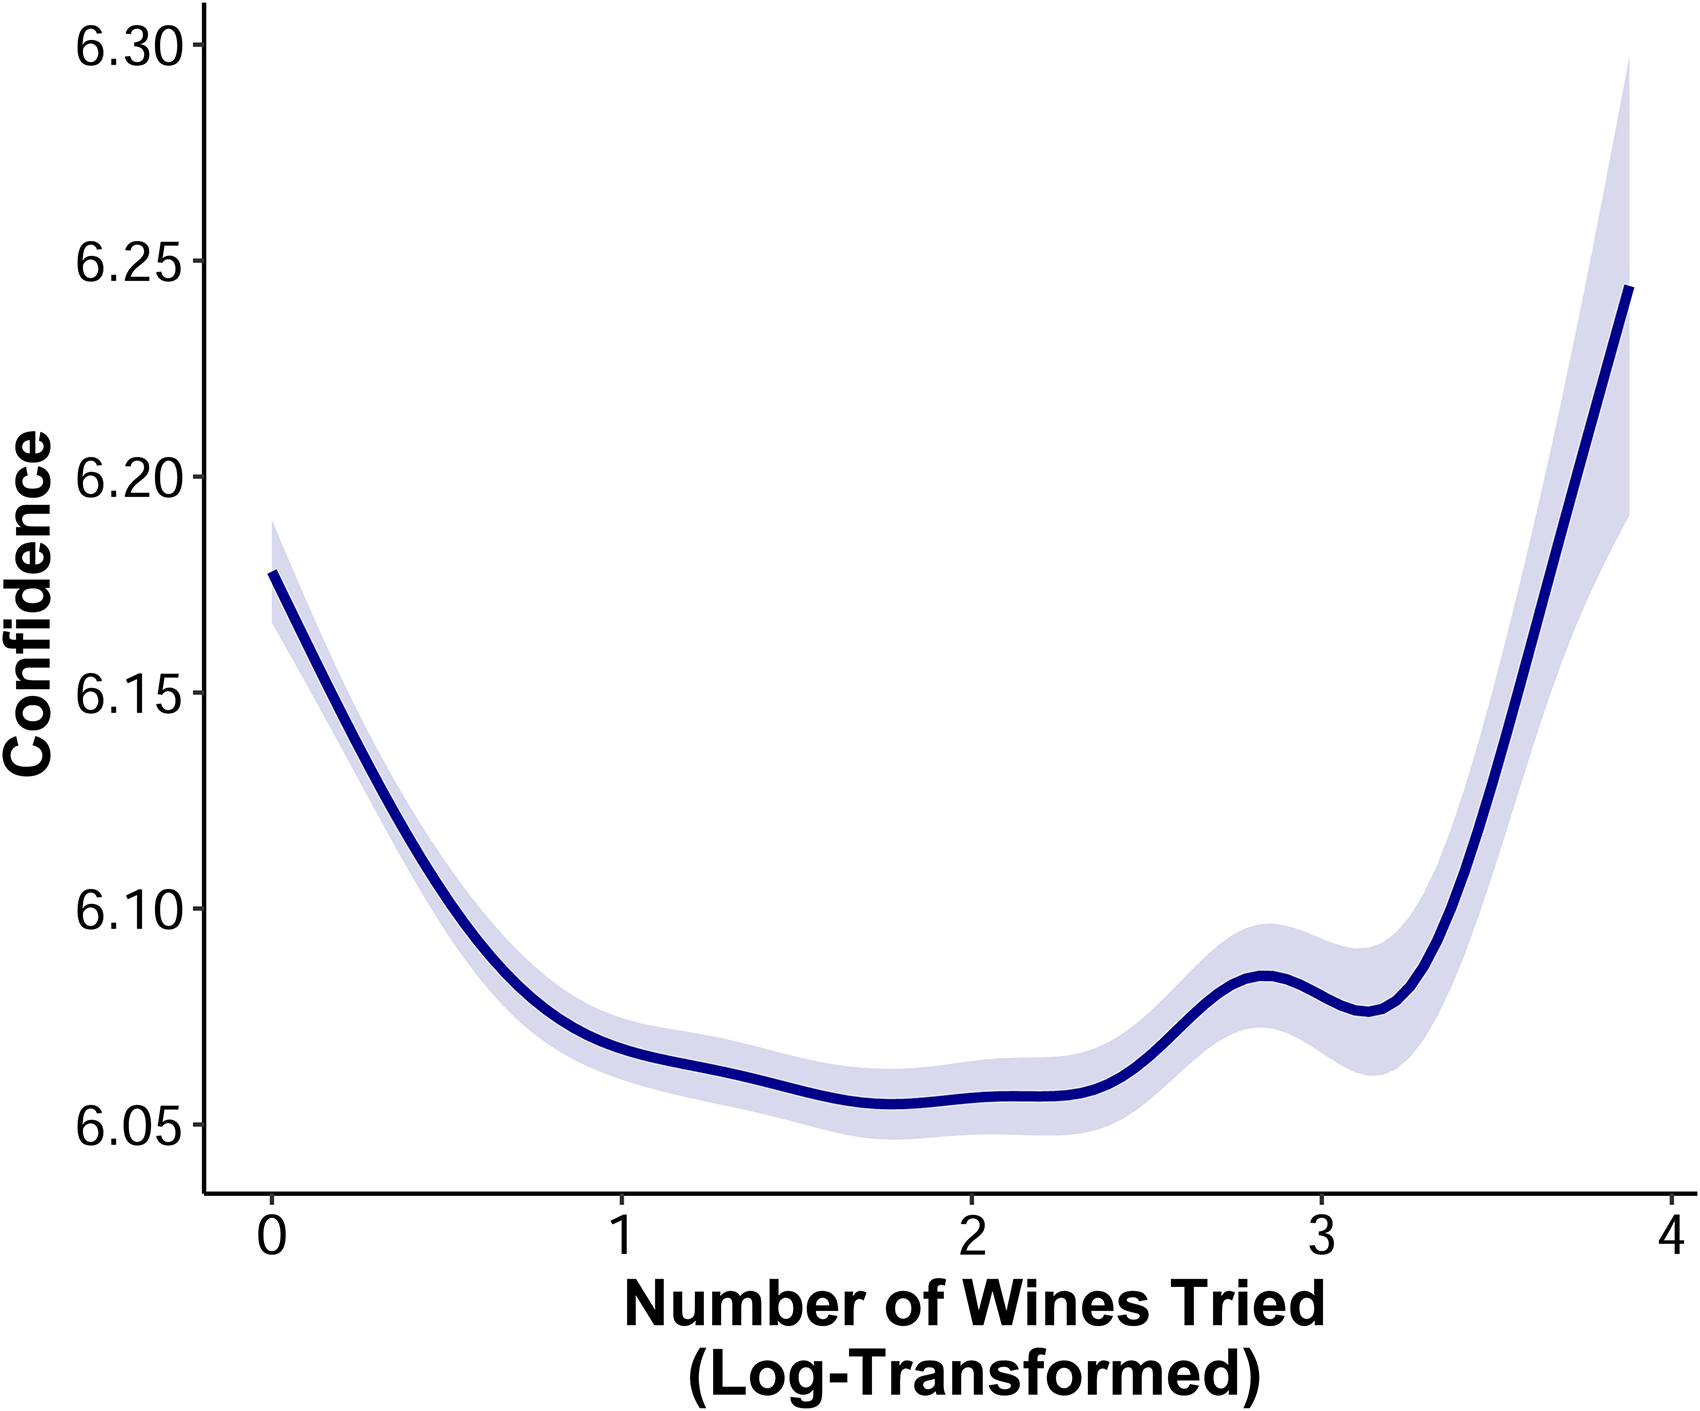
Confidence and Experience.
While consumers might initially say things like “I’m sure that” and “it is also clear” (scores of 7.18 and 6.97 out of 9.00, respectively), for example, as they gain experience they shift to include phrases like “I feel it is” and “there seems to be” (scores of 5.41 and 4.97, respectively). With more experience, they shift back to including those more confident phrases.
To further examine the significance of these changes, following Simpson (2018), we extracted the first derivative of the smooth function to provide the direction and magnitude of the slope at a given point (see the Web Appendix). Results indicate a significant decrease in confidence (i.e., significantly negative slope) until approximately ten wines have been tasted (i.e., 1 on Figure 1). With more experience, however, the slope becomes significantly positive (at approximately 240 wines tasted [2.38]), indicating a significant increase.
Alternative Explanations
While these results are consistent with our theorizing, one might wonder if they are somehow driven by alternative explanations. Consequently, we explored whether the results could be driven by (1) the wines sampled, (2) wine atypicality, (3) attrition, (4) indirect experience, (5) self-selection, (6) emotionality and valence, (7) time, (8) social influence, and (9) social norms. 5 Now that the shape of the effect is clear, it can be modeled using an approach that is less computationally intensive: growth curve modeling. 6 This approach finds the same U-shaped pattern (see Table 1), so it was used to investigate alternative explanations.
Confidence and Experience, Simultaneous Controls.
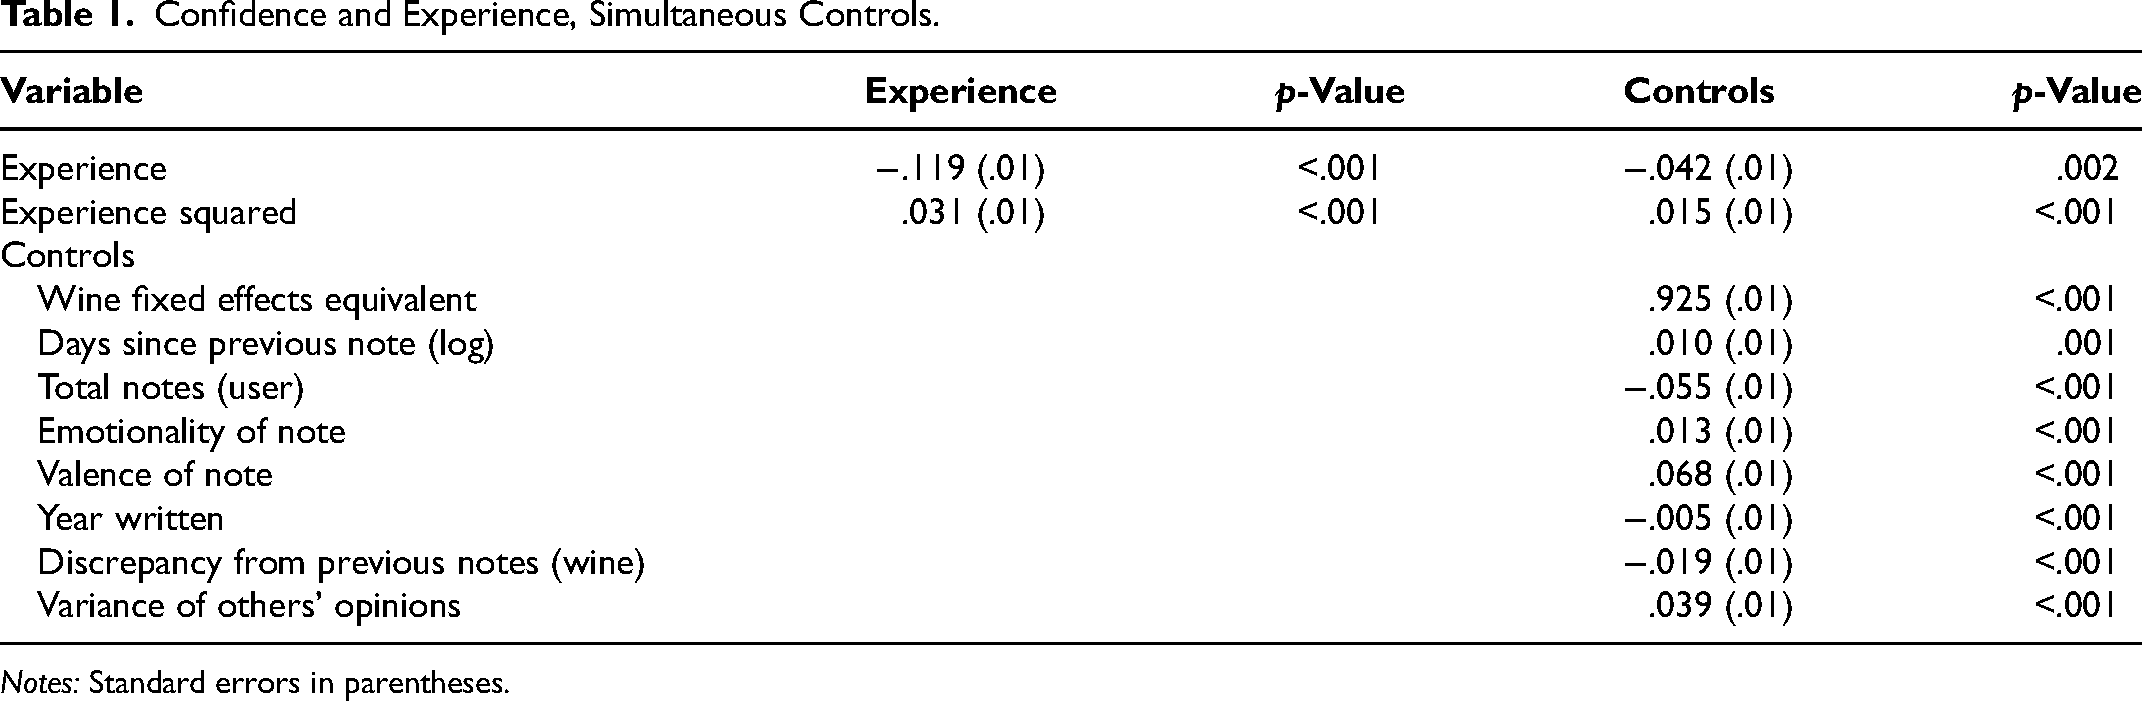
Notes: Standard errors in parentheses.
Wines sampled
First, one could wonder whether the results are driven by the particular wines sampled. Maybe consumers try more challenging (e.g., complex) wines as they gain experience, for example, and this makes them less confident. To test this possibility, we included what is similar to a fixed effect (Hamaker and Muthén 2020). Specifically, we calculated the average confidence expressed toward each wine, and controlled for it. Even doing so, however, the U-shape persists (γ = .02, t(541,847.62) = 9.97, p < .001; see the Web Appendix for all figures for this section). This suggests that rather than being driven by what consumers choose (i.e., the specific items), confidence shifts are more associated with their experiential journey.
Wine atypicality
Second, maybe the results are driven by changes in the variance of experience, or consumers trying wines that are more different from what they have tried before. To test this, we used machine learning to calculate how similar wines are to one another (see the Web Appendix). 7 We then calculated how the variance of sampled experiences changed with the addition of the current wine. While consumers were less confident when their current wine was more different from what they tried previously (γ = −.03, t(983,621.20) = 2.88, p = .004), even controlling for that, the U-shape persisted (γ = .03, t(624,227.71) = 9.77, p < .001). Consequently, this cannot explain the U-shaped pattern. Alternative measures show the same results (Web Appendix).
These results also speak to whether the U-shaped pattern is driven by consumers’ interest in expanding their knowledge or trying a broader set of wines. Some research suggests that novices prefer gaining broader experiences (Clarkson, Janiszewski, and Cinelli 2013), so one could wonder whether this sampling approach, rather than gaining general knowledge about the domain, could lead confidence to decrease. But this does not seem to be the case. Even controlling for how different a wine was from what they tried before (i.e., changes in variance), the U-shape persists, suggesting sampling breadth is not driving the effect.
Attrition
Third, one could wonder whether attrition might explain the results. Perhaps consumers who become uncertain exit the website, and only more certain ones remain, leading to a U-shape. To test this, we focused only on consumers who completed many tasting notes. Even analyzing those with at least 50 or 100 wines sampled, though, the U-shaped pattern remains (γ50 = .02, t(851,027.54) = 7.40, p < .001; γ100 = .02, t(741,893.32) = 6.93, p < .001).
Indirect experience
Fourth, perhaps consumers who sample more wines also gain more outside experience (e.g., reading about wines) and this drives the effect. We address this by controlling for two potential measures of indirect learning: how long consumers have been on the platform (more time for outside learning) and days between notes (gaps when they might learn indirectly). Even controlling for these, however, the U-shaped pattern persists (γ = .03, t(483,085.90) = 11.94, p < .001), suggesting that direct experience plays a role.
Self-selection
Fifth, one could wonder whether there is self-selection in whether consumers choose to write a given note. While this is certainly possible, several items cast doubt on this possibility. To begin, consumers who skip experiences likely take longer between notes. However, the fact that the U-shaped pattern remains even controlling for (1) how long consumers have been on the platform and (2) the time between notes casts initial doubt on self-selection in review writing.
Next, consumers who write about the same wine multiple times likely write about a larger proportion of their experiences. After all, they write about the same wine more than once. Indeed, these consumers write significantly more frequently, with greater consistency, and write more notes overall, suggesting that they write about a larger proportion of their experiences (see the Web Appendix for detail). Even when these consumers are analyzed alone, however, the U-shaped pattern persists (γ = .02, t(825,108.38) = 9.21, p < .001).
In addition, the U-shaped pattern persists even controlling for how many tasting notes consumers write in total across their time on the website, which controls for individual differences in review propensity (γ = .02, t(662,456.12) = 10.13, p < .001). Note that this also controls for the types of consumers who gained more and less experience.
Finally, if anything, prior work indicates that people who feel uncertain are less likely to communicate their views (Cheatham and Tormala 2015; Krosnick et al. 1993). Given that, it should be more difficult to observe a confidence dip (as less confident tasting notes should be less likely to be written). To test this possibility, we ran a host of empirical simulations to understand the possible impact of missing experiences. Specifically, we simulated what the U-shape would look like if anywhere from 10% to 50% of consumers’ low-confidence experiences were missing. In all simulations, including those with the most extreme missingness assumptions, the U-shape persisted (ps < .001; see the Web Appendix for full detail).
These results also replicate across the subsequent studies, which include different domains, different consumers, and different time periods. While it is challenging to completely rule out self-selection, the convergence of evidence across diverse analytical approaches and contexts suggests that self-selection in review writing is unlikely to drive the effect.
Emotionality and valence
Sixth, one could wonder whether emotionality or valence (i.e., how much consumers liked or enjoyed the product) might drive the results. As consumers gain experience, for example, they become more emotionally numb (i.e., less emotional; see Rocklage, Rucker, and Nordgren [2021]), and product evaluations might change as people gain experience. The emotionality and valence of consumers’ tasting notes was measured using the Evaluative Lexicon (see Rocklage and Fazio [2015] and Rocklage, Rucker, and Nordgren [2018] for more detail). Casting doubt on these alternatives, however, the U-shape persists even controlling for these aspects (γ = .03, t(553,761.31) = 14.21, p < .001).
These results also speak to whether, rather than being driven by general knowledge gain, the U-shape is driven by experience, helping consumers find their preferred wines and thus increasing their confidence. That said, if the effect were about finding one's preferences, controlling for valence should alter the U-shape. The fact that it does not, however, casts doubt on this alternative.
Time
Seventh, one could wonder whether time-dependent factors such as trends (e.g., increasing interest in rosé), shifting characteristics of the platform's users, or community growth could drive the pattern. The U-shaped pattern, however, is consistent across time. A significant year by experience squared interaction (γ = .01, t(784,262.65) = 2.97, p = .003) indicates that newer users began with higher confidence, but all users, regardless of when they joined, followed a similar U-shaped pattern and reached their lowest confidence at a similar experience level (see the Web Appendix). This persistence indicates a time-invariant journey that consumers go through.
Social influence and norms
Finally, maybe social influence drives the effect (e.g., consumers lose confidence when they notice that their opinion differs from others’ and then gain it back through conforming). To test this, we measured how consumers’ valence deviated (absolute difference) from a wine's average valence. Contrary to a social influence account, consumers became more discrepant from others as they gained experience (γ = .07, t(89,677.73) = 30.13, p < .001), and controlling for these discrepancies, the U-shaped pattern persists (γ = .03, t(553,261.13) = 15.87, p < .001). 8
To further test this, we also controlled for the variance of others’ opinions (e.g., Moe and Trusov 2011), as community consensus might affect confidence. Even controlling for the variance of opinions, however, the U-shape persisted (γ = .03, t(279,780.31) = 9.30, p < .001). Results are also inconsistent with a social norms account (see the Web Appendix for details).
These results also speak to whether the U-shape is driven by learning about others’ preferences. Such an account might suggest that consumers initially become less confident as they learn that others’ preferences differ from theirs, but regain confidence as they learn more about others’ preferences. If this were the case, though, controlling for discrepancy and variance should alter the U-shape. The fact that the U-shape persists casts doubt on this possibility.
Simultaneously including all controls
Results also remain similar with all significant controls included simultaneously (see Table 1; see the Web Appendix for all other studies).
Discussion
Results of Study 1a provide preliminary insight into the relationship between experience and confidence. While consumers started off somewhat confident, as they tried more wines, confidence decreased. With further experience, however, confidence rebounded, and eventually increased. Ancillary analyses demonstrate robustness and cast doubt on various alternative explanations (subsequent studies cast doubt on additional alternatives, such as experience with writing).
Studies 2a and 3a: 50,000 Beer Drinkers over Time
Results of Study 1a are consistent with our theorizing, but one could wonder whether they are somehow specific to the domain, website, or customer base analyzed. Consequently, to test generalizability, we examine another domain where consumers often gain experience (i.e., beer). We analyze over two million reviews, written by more than 50,000 beer drinkers, to test how confidence changes with experience. To further investigate whether the results are somehow restricted to a particular website or customer base, we examine two different websites. The data are from different settings, time periods, and sets of consumers, but given their similarities, we present them together (as Studies 2a and 3a) for conciseness.
Method
For Study 2a, we obtained all reviews from the BeerAdvocate website for a 16-year period, from its start in 1996 to 2012 (McAuley and Leskovec 2013). There were 1,451,766 reviews written by 32,563 consumers (M = 47 reviews per consumer, SD = 182.60).
For Study 3a, we obtained all reviews from the RateBeer website across a 12-year period, from 2000 to 2012 (McAuley and Leskovec 2013). There were 984,573 reviews written by 19,679 consumers (M = 48 reviews per consumer, SD = 182.19).
The measurement approach was the same as Study 1a. Experience was measured by the number of beers a consumer had reviewed at a given point in time, confidence was measured using the Certainty Lexicon, and GAMMs traced the trajectory of confidence based on experience.
Results
Consistent with our theorizing, both BeerAdvocate (Study 2a) and RateBeer (Study 3a) showed similar results to Study 1a (see Figure 2). Confidence started relatively high, but decreased as consumers gained experience (i.e., sampled more beers). Then, as consumers gained additional experience, confidence slowly recovered (BeerAdvocate: F = 111.85, e.d.f. = 7.04, p < .001; RateBeer: F = 221.69, e.d.f. = 8.75, p < .001).
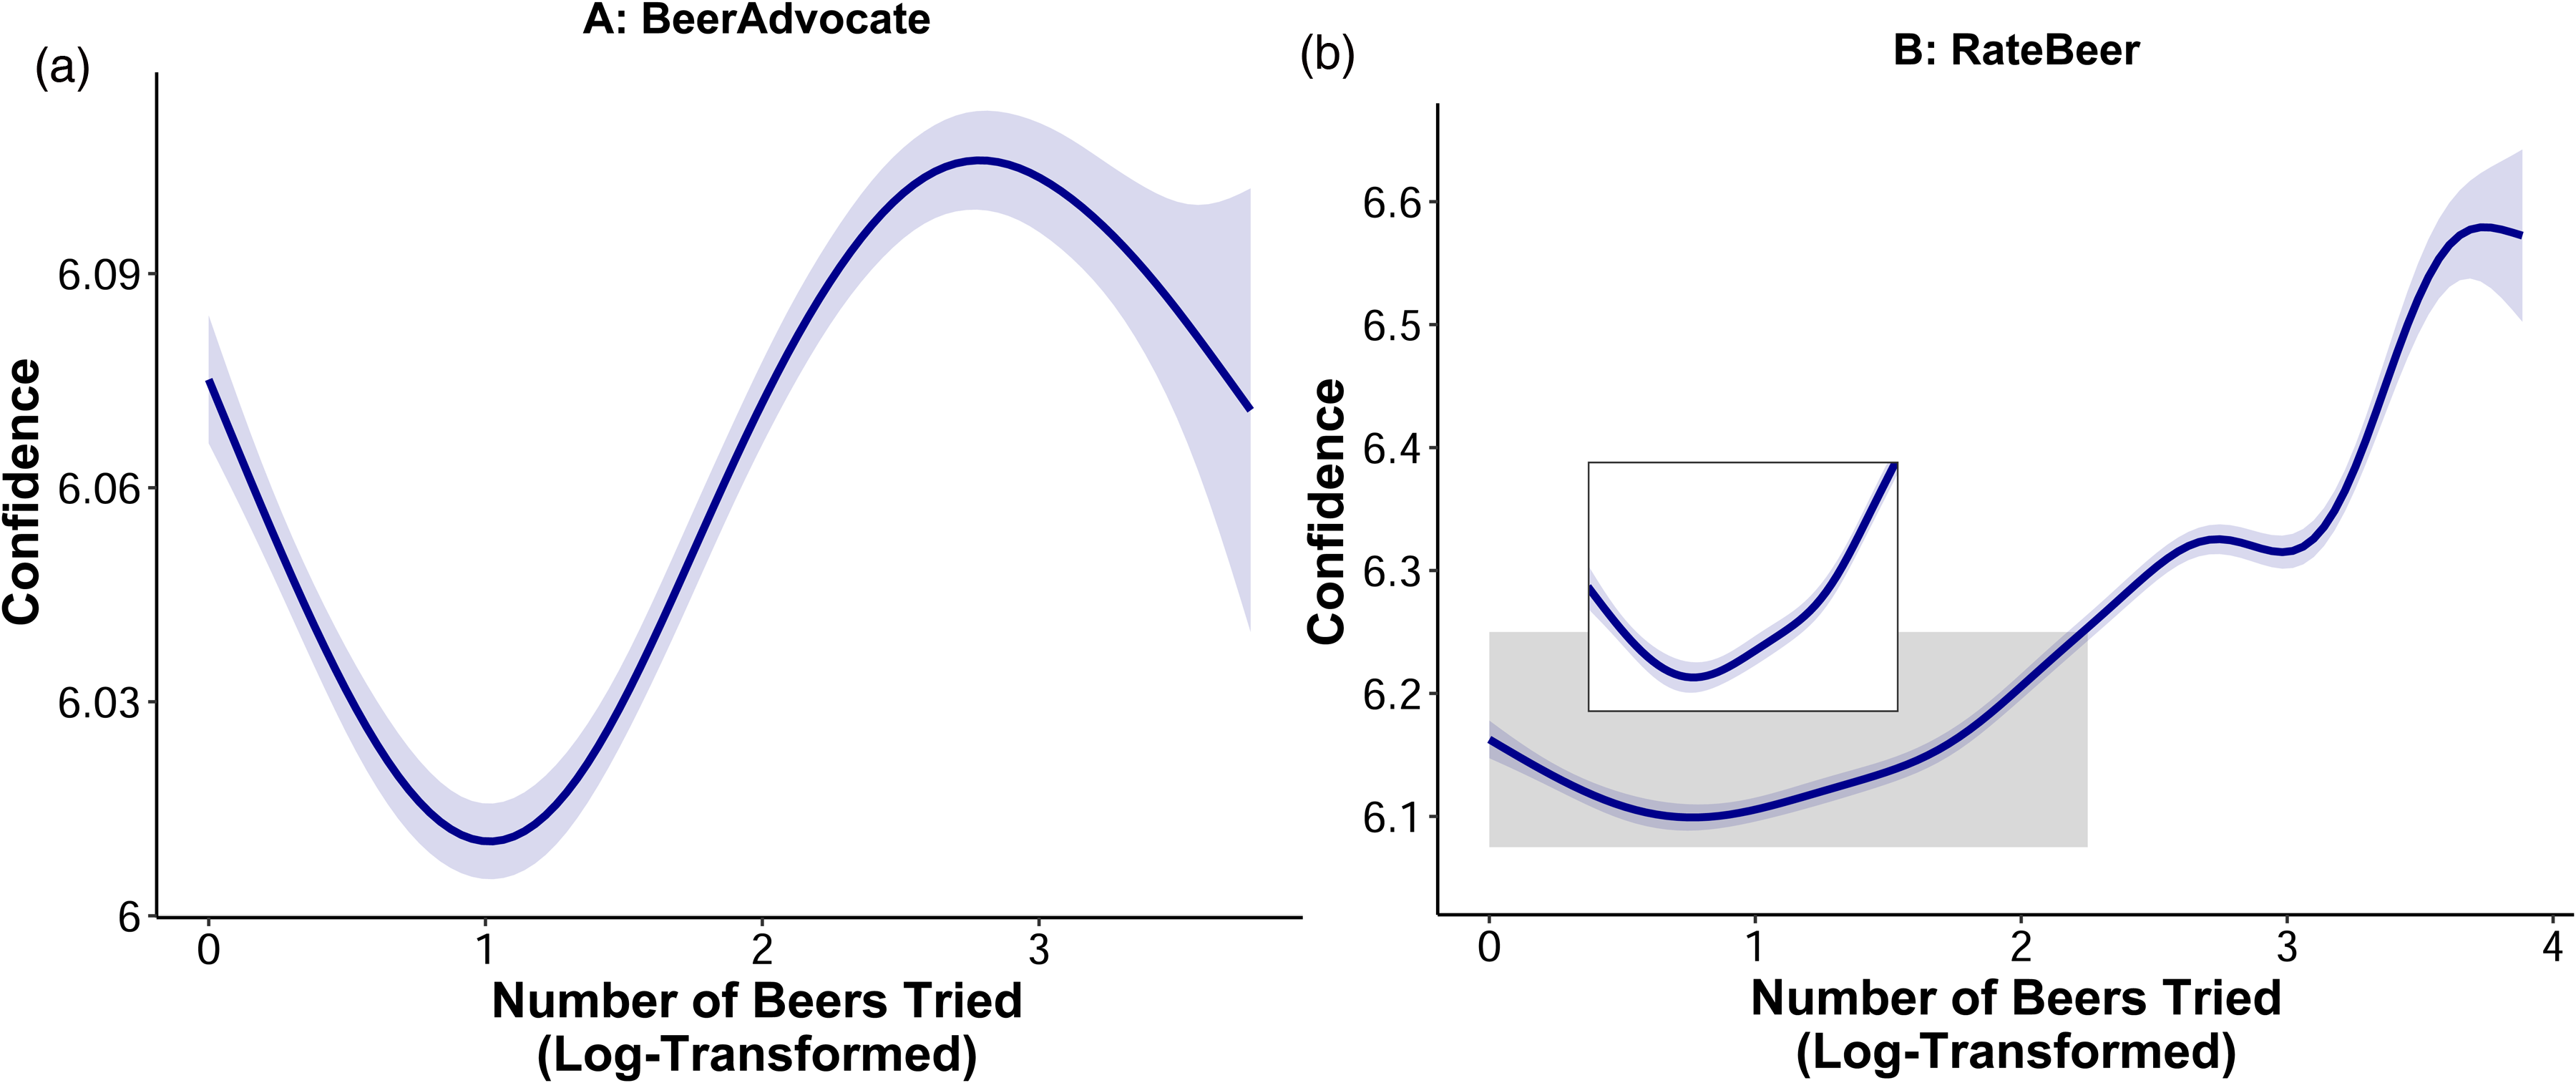
Confidence and Experience.
As in Study 1a, the first derivative of the smooth function shows that the slope is significantly negative at the beginning, indicating a significant decrease in confidence. At a certain point (approximately 13 beers for BeerAdvocate [1.10] and 8 beers for RateBeer [.90]), however, the slope becomes significantly positive, indicating a significant increase (see the Web Appendix). 9
Alternative Explanations
To examine alternative explanations, we again used growth curve modeling. Similar to Study 1a, results held controlling for (1) the beers sampled, (2) beer atypicality, (3) attrition, (4) indirect experience, (5) self-selection, (6) emotionality and valence, (7) time, (8) social influence, and (9) social norms (see the Web Appendix for detailed results and figures).
One might also wonder whether the U-shaped pattern truly reflects the initial stages of consumer experience. Maybe only more experienced consumers write reviews and so the U-shape actually reflects later, rather than earlier, stages of experience. Given that beginners are likely to show greater shifts in confidence, examining later stages of experience should weaken the ability to find effects, but to investigate this possibility, we examine consumers’ age (listed on the BeerAdvocate website). Compared with consumers who are age 30 or 40, those who recently reached drinking age (i.e., 21 years of age where BeerAdvocate is based) should have less prior experience. Consequently, if the U-shaped pattern is strongest for people who have less experience initially, it should be strongest among these younger reviewers.
Consistent with this, results showed a significant starting age by experience interaction (γ = −.001, t(157,822.42) = 3.90, p < .001). The dip was strongest for those starting at age 21 (γ = .175, t(251,509.62) = 11.02, p < .001), while older consumers (+1 SD [age 41]) had confidence levels with starting points that occurred significantly later in the U-shape (γ = .155, t(245,130.23) = 9.47, p < .001).
Discussion
Studies 2a and 3a provide further evidence regarding confidence and experience. Consistent with our theorizing and with the results of Study 1a, the studies revealed a U-shaped relationship. While consumers started off somewhat confident, as they tried more beers, that confidence decreased. As experience increased further, however, confidence rebounded, and eventually increased again.
Finding the same results in a different domain (i.e., beer), across two additional websites and tens of thousands of additional consumers, speaks to the generalizability of the effect. Ancillary analyses cast doubt on alternative explanations and demonstrate robustness.
Study 4a: Almost 12,000 Cosmetics Users over Time
Studies 1a, 2a, and 3a provide consistent evidence regarding experience and confidence, but one could still wonder about generalizability. Maybe the results are somehow restricted to alcohol, beverages, populations that gravitate toward these categories, or domains where interpurchase time is short. Consequently, to further test generalizability, Study 4a examines a different domain: cosmetics. It has longer interpurchase times and, compared with wine and beer, has distinct consumer demographics with different wants and needs (Statista 2024).
Method
We obtained 14 years of reviews from the beauty website Sephora beginning from the first review in 2008 until 2022 (Data & Sons 2022; Kaggle 2020, 2022). We focused on the two most popular categories: makeup and skincare. A subset of products (14%) did not have category labels, so we developed deep-learning long short-term memory recurrent neural networks to categorize them. Categorization accuracies were 77% or higher, indicating a high degree of accuracy. Results are similar when leaving out these products.
Sephora customers tend to write fewer reviews (M = 2.31) than the wine and beer consumers, so to trace confidence trajectories as they gain experience, we focused on consumers who wrote at least 10 reviews, resulting in 229,267 reviews written by 11,994 consumers (M = 19 reviews per consumer, SD = 15.86). Results are similar when focusing on consumers who wrote other minimum numbers of reviews (e.g., at least 5).
As with Studies 1a, 2a, and 3a, experience was measured using the number of cosmetics a consumer tried (i.e., reviewed) within each product category at a given point in time, confidence was measured using the Certainty Lexicon, and GAMMs traced the trajectory of confidence.
Results
Consistent with our theorizing and with Studies 1a, 2a, and 3a, there was a U-shaped relationship between confidence and experience (F = 4.08, e.d.f. = 3.71, p = .002; see Figure 3). While confidence started higher, as consumers gained experience (i.e., tried more cosmetics), confidence decreased. Then, as consumers gained more experience, confidence recovered. The slope begins significantly negative, but then becomes significantly positive (at approximately ten cosmetics), indicating a significant confidence increase (see the Web Appendix).
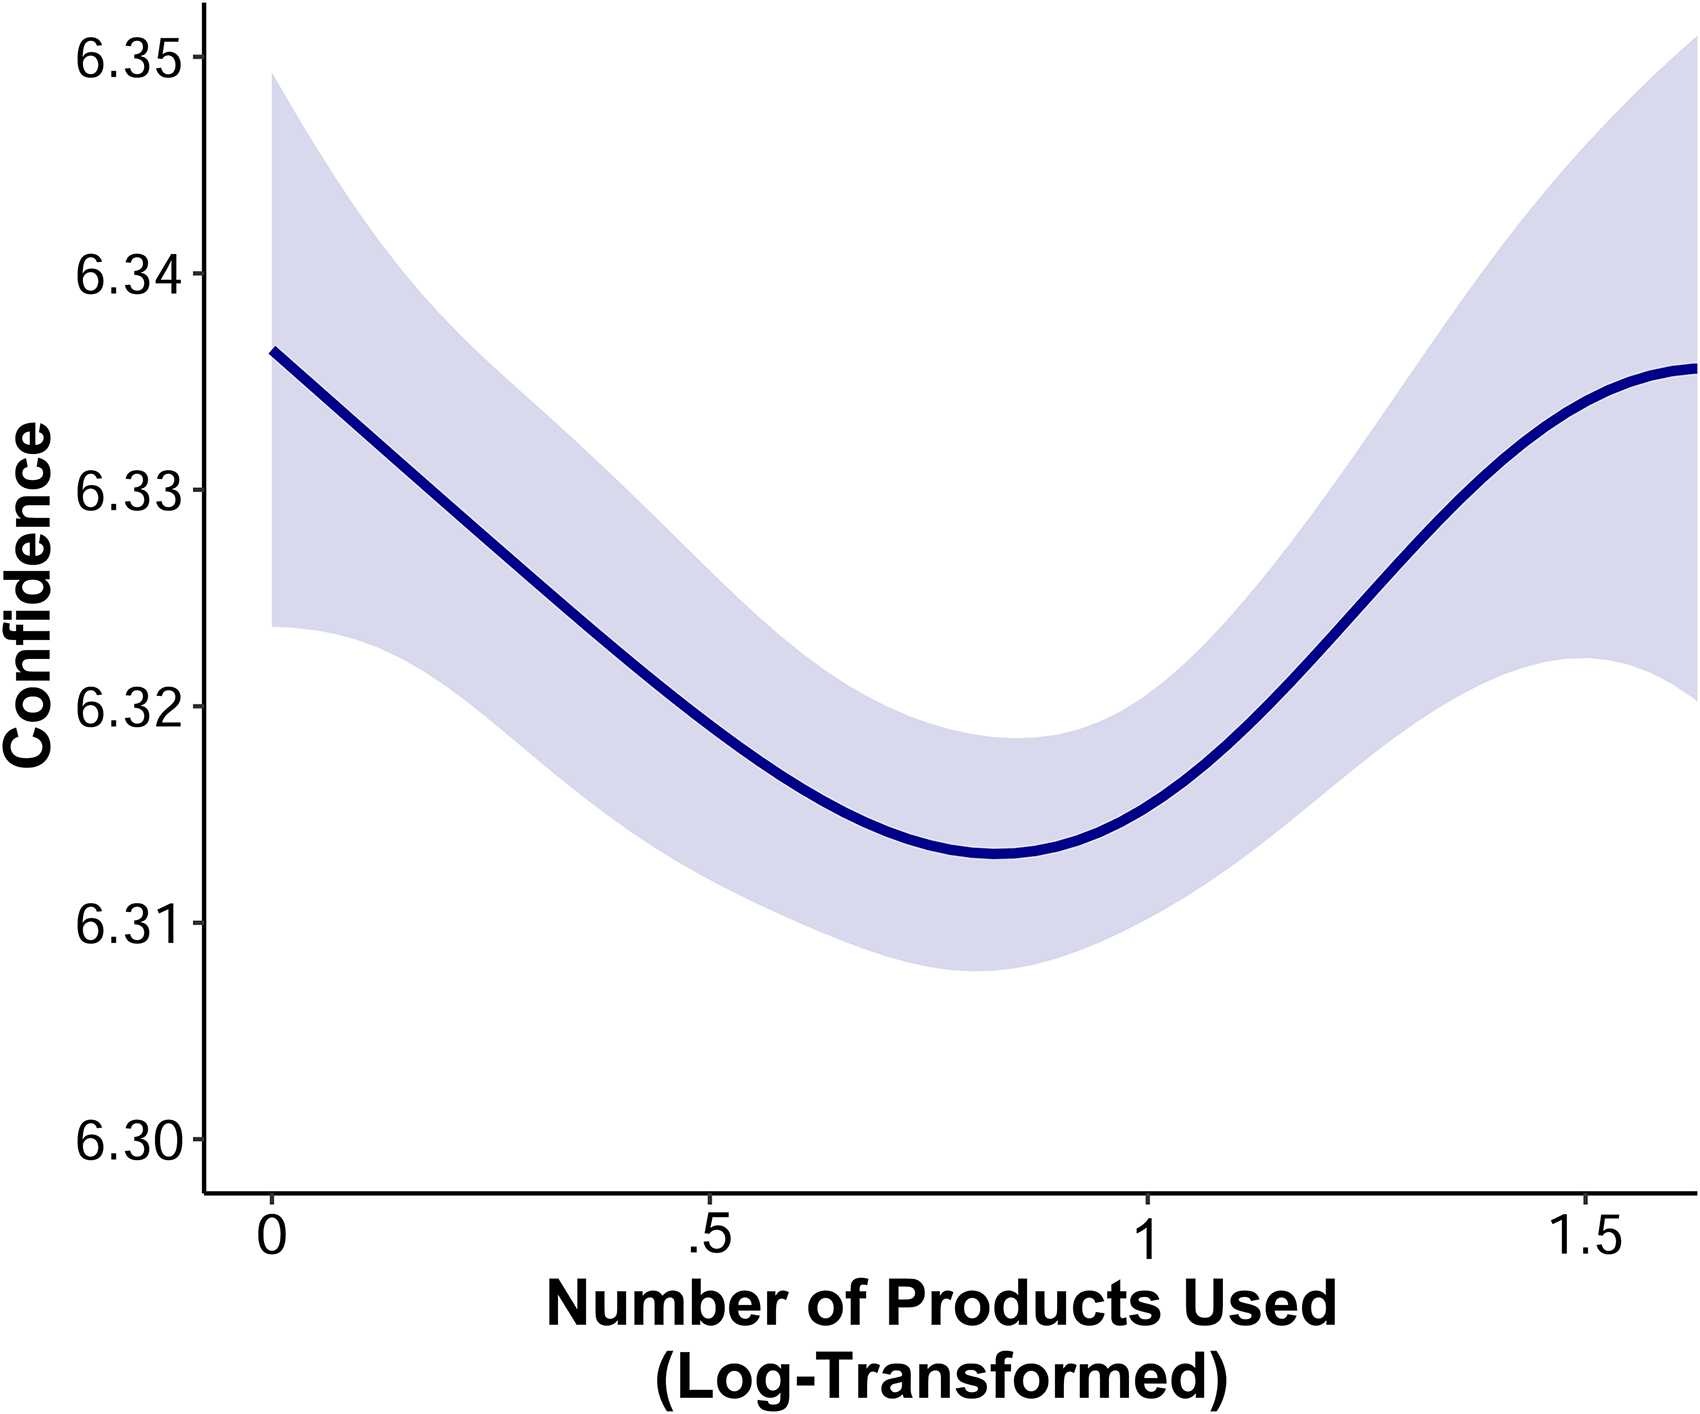
Confidence and Experience.
Alternative Explanations
Casting doubt on alternative explanations, results again held controlling for (1) the products used, (2) indirect experience, (3) self-selection, (4) emotionality and valence, (5) time, (6) social influence, and (7) social norms (see the Web Appendix). 10
One could additionally wonder whether the effects could be driven by experience with writing, rather than by domain experience (experience with cosmetics). Maybe consumers’ initial attempts to write reviews are difficult, leading to a dip in confidence. But, as they write more, their confidence increases. To test this possibility, we examined the number of reviews a consumer had written in other product categories (e.g., hair care or fragrances) prior to their first makeup or skincare review. If writing experience explains the effects, there should be different patterns based on prior review count. There were not. While writing more reviews predicted greater confidence (γ = .06, t(12,438.64) = 4.37, p < .001), there was no significant interaction with experience (γ = −.05, t(227,018.76) = 1.25, p = .21). Though this does not enable us to fully rule out category-specific effects, it suggests that the U-shaped pattern is similar regardless of writing experience, casting doubt on the notion that writing experience alone can explain the effects. Furthermore, the pattern persists (γ = .03, t(227,965.10) = 3.35, p < .001) when a product type (i.e., makeup) fixed effect is included, suggesting that the pattern is consistent across categories.
Finally, maybe the results are somehow driven by price. As consumers gain experience, for example, maybe they buy more expensive products that also give them greater confidence. While the wine and beer datasets did not have price information, product prices are available from Sephora. Even controlling for product price, however, the effect of experience is similar (γ = .03, t(208,625.84) = 3.27, p = .001), casting doubt on the notion that price can explain the effects.
Discussion
Results of Study 4a underscore the relationship between confidence and experience. Consistent with our theorizing and with the results of the first three studies, there was a U-shaped relationship between experience and confidence. While consumers started off relatively confident, as they tried more cosmetics, that confidence decreased. As experience increased further, however, confidence rebounded, and eventually increased again. Finding these patterns in another product category, and one with longer interpurchase times, highlights generalizability.
Study 5a: Manipulating Experience
The field studies provide consistent evidence regarding experience and confidence, and we used an experiment to explore whether results were similar under more controlled conditions. In addition, to test generalizability, this study uses scale measures of confidence.
Participants engaged in a photography evaluation task. Using specific criteria for judging photo quality, they encountered this novel task, viewed each photograph, provided a judgment, indicated their confidence in that judgment, and expressed whether they preferred to see a similar or different photograph next. This mirrors how consumers typically gain experience in a domain: They use a product, evaluate its quality, and decide whether to continue with it (or something similar) or try something different. We predicted that, similar to the field data, while confidence would decrease initially, eventually, with more experience, confidence should rebound.
Method
Participants (N = 801; Amazon Mechanical Turk) completed an online study for payment (58% female, 41% male, 1% other; Mage = 46.66 years, SD = 13.55).
Ten photographs were chosen at random from a large photography database. Participants were shown each photograph in one of three randomized sequences 11 and were asked to judge it based on criteria used by photographers. Specifically, they were given the Royal Photographic Society Journal guidelines, which included assessing technique (e.g., brightness), content (e.g., subject portrayal), and communication (e.g., storytelling). Participants were asked to consider these aspects when viewing each photograph, and the criteria were displayed above each image. They judged the quality of each photograph (1 = “Very low quality,” and 7 = “Very high quality”) and their confidence in that judgment (1 = “Not at all,” and 7 = “Very much so”). They then indicated whether they would prefer to see something similar or different as the next photograph (these results are presented in Study 5b). They were told their answer would not affect the actual photograph shown.
The photographs were separated into four blocks with breaks in between: low experience (Photograph 1), early experience (Photographs 2 to 4), intermediate experience (Photographs 5 to 7), and advanced experience (Photographs 8 to 10). These blocks served as the main unit of analysis. We asked additional questions between blocks to test alternatives (discussed subsequently).
Results
Consistent with the field data, a repeated-measures ANOVA showed that experience shapes confidence (F(3, 6,405) = 59.43, p < .001; see Figure 4): While participants were initially somewhat confident (low experience: M = 4.90), as they gained experience, confidence decreased (low vs. early: M = 4.83, t(6,405) = 2.16, p = .03). As consumers gained more experience, confidence recovered (early vs. advanced: M = 5.14, t(6,405) = 6.25, p < .001).
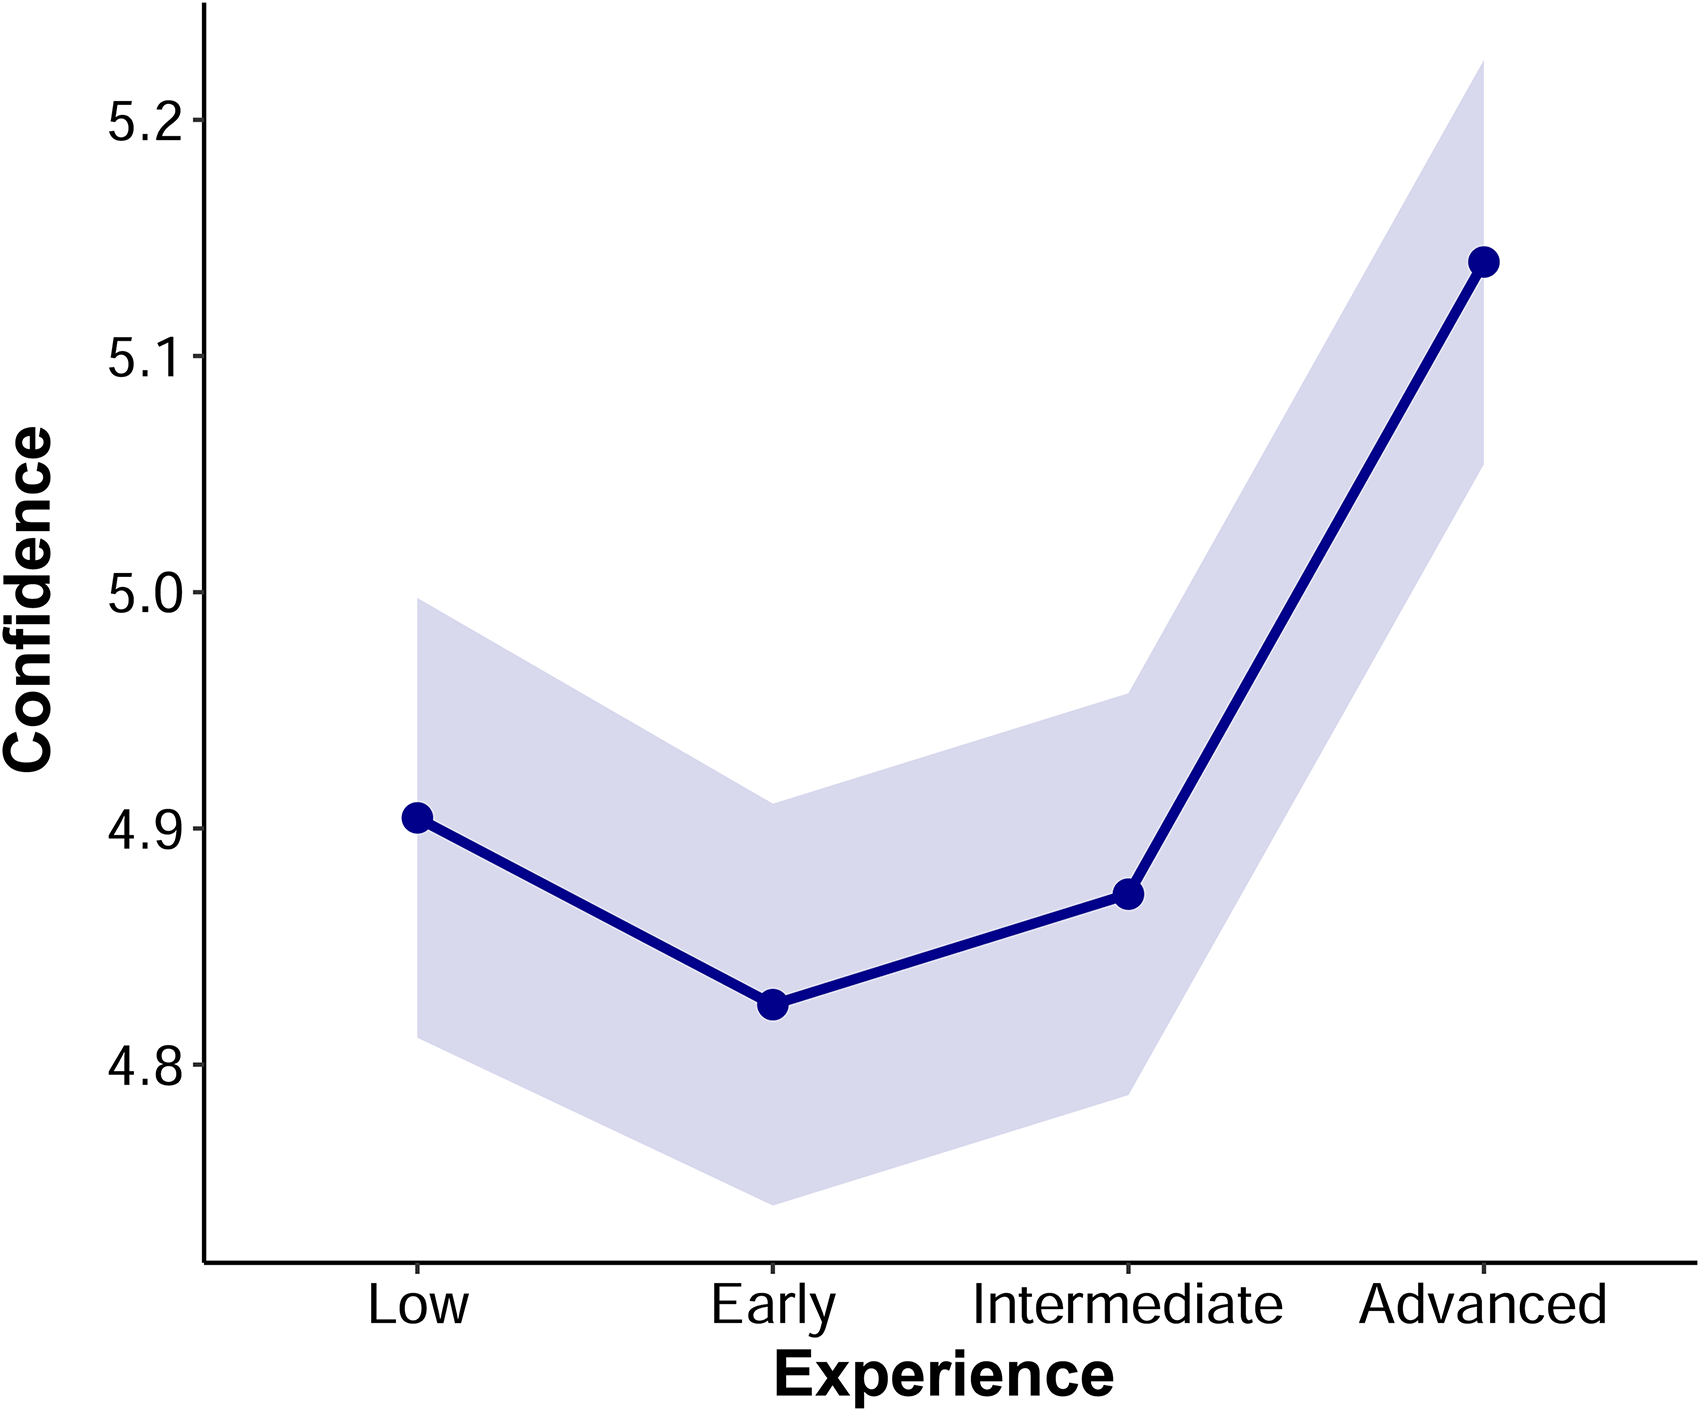
Confidence and Experience.
Analyzing each photograph separately showed similar results. Experience still influenced confidence (F(9, 6,399) = 20.35, p < .001): While participants were initially somewhat confident (Photograph 1: M = 4.90), as they gained experience, confidence decreased (Photograph 1 vs. Photograph 3: M = 4.78, t(6,399) = 2.57, p = .01). As consumers gained more experience, though, confidence recovered (Photograph 3 vs. Photograph 8: M = 5.15, t(6,399) = 7.89, p < .001).
Alternative Explanations
While the results are consistent with our theorizing, one could wonder whether the relationship between experience and confidence is driven by alternative explanations. Maybe specific photographs were particularly high or low quality, or participants became more fatigued or less engaged as the task went on, and one of these factors drove the effect. To test these possibilities, in addition to reporting quality after each photograph (as noted previously), between each block participants reported fatigue (1 = “Not at all fatigued,” and 7 = “Very fatigued”) and engagement in the task (1 = “Not at all,” and 7 = “Very much so”).
Even controlling for quality judgments, fatigue, and engagement, though, results remain the same (F(3, 6,402) = 65.22, p < .001). 12 Analyzing each photograph separately showed similar results. This casts doubt on the notion that photograph quality, fatigue, or engagement can explain the results.
Discussion
Study 5a underscores confidence's U-shaped pattern in a more controlled setting. Consistent with the field data, consumers began relatively confident, lost that confidence with more experience, and recovered that confidence with even greater experience. In addition, the fact that the link between experience and certainty holds using an alternate way of measuring certainty (i.e., a scale measure rather than through language) speaks to the generalizability of the effect.
Moderation by Quality of Experience
While a great deal of research notes that experience quantity shapes knowledge and behavior (Alba and Hutchinson 1987; Hutchinson and Eisenstein 2008), one could wonder whether the quality of those experiences also plays a role. One key determinant of learning is the extent to which consumers take an analytical approach (Hutchinson and Alba 1991). Analytical processing involves deliberation and decomposing an experience into constituent parts to better understand it (Alba and Hutchinson 1987). Given that such processing can accelerate learning and knowledge accumulation (MacInnis and Jaworski 1989), we hypothesized that taking a more analytical approach to one's experiences would accelerate learning and lead consumers to recover confidence sooner (i.e., a quantity by quality interaction).
To test this possibility, we quantified analytical processing using LIWC's analytic measure, which captures the extent to which people engage in “a deliberate mode of thought wherein complex concepts are deconstructed into more manageable components and their interrelations” (Jordan et al. 2019, p. 3477). Some people may just be more analytical in general, and such differences may also be correlated with things like confidence. Consequently, following convention to isolate within-person variation and avoid such alternative explanations in mixed-effects models (Hamaker and Muthén 2020), we computed the analytic measure for each experience, created a running average of each individual's last three experiences (results are similar using other numbers), and then mean-centered this score based on the individual's average. Results are similar when including a fixed effect for each individual instead (see the Web Appendix).
Consistent with our theorizing, results indicate that the more analytically consumers processed recent experiences, the sooner their confidence recovered after its initial dip (quantity by quality interactions: Study 1a: γ = .0007, t(1,007,866.21) = 7.34, p < .001, see Figure 5; Study 2a: γ = .0003, t(1,418,404.08) = 2.63, p = .009; Study 3a: γ = −.0007, t(963,825.86) = 4.03, p < .001; Study 4a: γ = .002, t(213,308.35) = 2.40, p = .02; see the Web Appendix for figures). Importantly, even controlling for this interaction, the quantity of experiences continued to predict a U-shaped pattern of confidence (ps < .01).
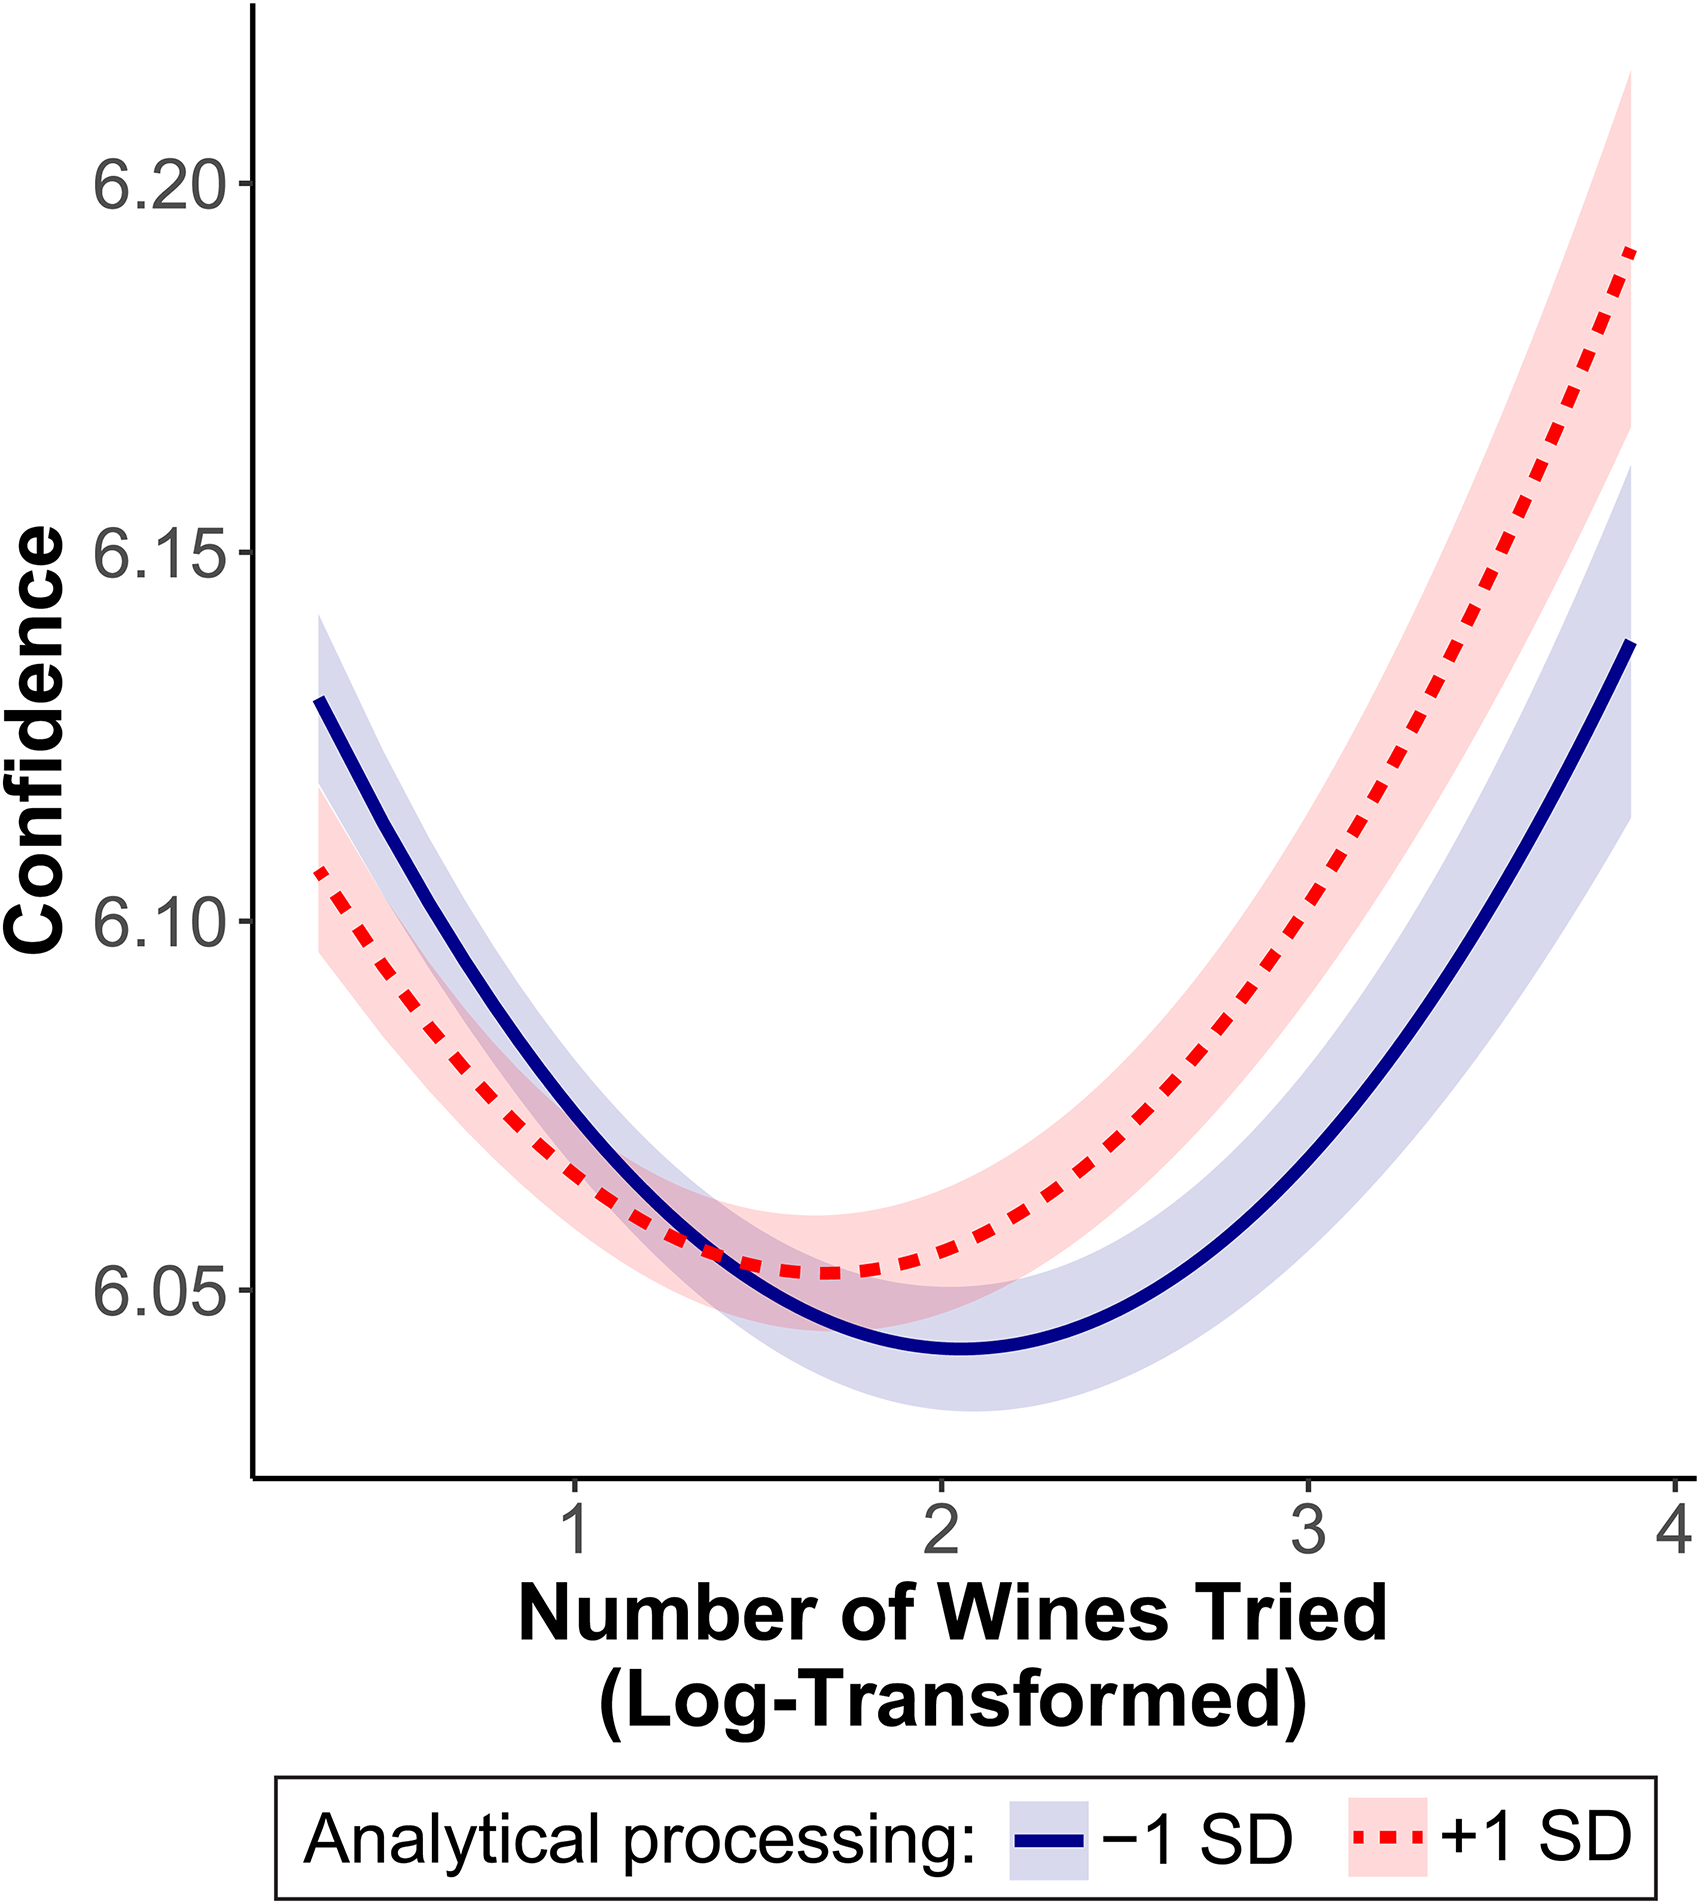
Confidence and Experience at High and Low Analytical Processing, Study 1a.
Taken together, these results indicate that both quantity and quality matter: The number of experiences a consumer has shapes their confidence, but the quality of those experiences, particularly how analytically they approach them, predicts how soon they regain confidence.
Consequences for Choice
The results so far demonstrate that as consumers gain experience, their confidence initially decreases before eventually rebounding. But might these shifts influence subsequent consumer choice? And if so, how? We suggest that as consumers gain experience, uncertainty can lead them to avoid products associated with that uncertainty.
Uncertainty is aversive. It evokes negative emotions (Dugas, Gosselin, and Ladouceur 2001), indicates a loss of control (Fan and Jiang 2018), and often requires cognitive resources to navigate (Chaiken, Liberman, and Eagly 1989). Consequently, people strategize and pay to avoid uncertainty, and it can lead them to avoid making a choice altogether (Dimoka, Hong, and Pavlou 2012; Iyengar and Lepper 2000; Reich and Wheeler 2016). Further, a lack of subjective understanding can generalize to the domain as a whole, becoming associated with the products and brands within it. Consequently, we suggest that as consumers gain experience, feeling uncertain will lead them to avoid options associated with that uncertainty.13, 14, 15, 16
Study 1b: Consequences for Wine Choice
Method and results
To begin to investigate whether feeling uncertain predicts choosing something more different, we used machine learning to quantify how similar the wines of Study 1 are to one another. 17
Specifically, we used doc2vec (Le and Mikolov 2014) to create a multidimensional, numeric representation of each wine. Similar to word embeddings, document embeddings represent documents (in this case, tasting notes) as points in a multidimensional space, where a given document's position depends on its similarity to other documents. We trained a doc2vec model on all tasting notes for each wine, where each note was treated as a document. This generated a numeric vector, or “embedding,” for each note based on the language used, and transformed it into a numerical representation that encoded the semantic information. We averaged this across all notes for each wine, and similarity between wines was measured by the cosine similarity of the embeddings between each wine, ranging from −1 (perfect dissimilarity) to +1 (perfect similarity). See the Web Appendix for validation that this captures similarity. Finally, a linear growth curve model predicted the similarity between consumers’ current and subsequent wine choice based on their confidence (consumer mean-centered).
Consistent with our theorizing, the more uncertain consumers felt, the more they chose a more different wine next (γ = .001, t(999,692.76) = 6.63, p < .001).18,19,20
Discussion
Study 1b shows that the more uncertain consumers felt, the more they chose something different from what they chose previously.
Note that these shifts can be consequential. Although it is challenging to contextualize changes in cosine similarity, moving from high to low confidence (maximum to minimum confidence observed) results in a .008 shift in similarity, which is approximately 5% of the gap between the average similarity of wines (.54) and the similarity level of the most dissimilar wines (.37; first quartile). Experience predicts dips in confidence, which leads consumers to shift from choosing the same variety of wine (two chardonnays) to a different variety (a chardonnay to a red Bordeaux). Across millions of purchases, such shifts lead to tens of thousands of instances in which consumers choose noticeably different wines than they would have otherwise, thereby redirecting substantial spending.
Based on the link between experience and confidence, one could wonder whether experience initially decreases confidence, which predicts choosing something different next. That is what the data show (see the Web Appendix for mediation analyses for all studies). Thus, dips in confidence that occur with early experience predict that consumers will pick something more different, switching from a chardonnay (described with words like “apple,” “pear,” and “crisp”) to a red Bordeaux (often described with distinct words like “black cherry,” “smoky,” and “tobacco”). In contrast, accruing even greater experience shows increasing confidence, which predicts switching from one chardonnay to another.
Studies 2b and 3b: Consequences for Beer Choice
We used the same approach to examine similarity between beers. As hypothesized, uncertainty was again linked to choosing something different. Across both datasets, the more uncertain consumers felt, the more they picked something different next (BeerAdvocate: γ = .001, t(1,404,743.19) = 7.95, p < .001; RateBeer: γ = .001, t(918,027.94) = 8.73, p < .001). 21
Given that the beer data contained information about brands and beer types, we also investigate uncertainty's relationship with brand and beer type choice.
Brand choice
Specifically, we examined whether consumers’ next choice was from the same brand (i.e., brewer) or a different one (coded as 1 or 0, respectively) and how long it took (in days, log-transformed) for consumers to choose from the same brand again. All subsequent results control for valence and emotionality.
Consistent with our theorizing, in both cases, uncertainty was detrimental to brands. When consumers felt more uncertain, they were more likely to pick a different brand next (BeerAdvocate: γ = .02, Z = 5.61, p < .001; RateBeer: γ = .01, Z = 5.19, p < .001). They also took longer to choose from that brand again (BeerAdvocate: γ = −.01, t(1,242,926.30) = 4.95, p < .001; RateBeer: γ = −.01, t(828,622.49) = 10.76, p < .001).
Beer type
Consumers also chose different types of beers. Beers are characterized by different styles (e.g., “American pale ale” or “Kölsch”), so we used the websites’ categories to examine whether consumers chose beers of a different style. More specific styles (e.g., “American pale ale”) can also be categorized into broader, more general styles (e.g., “pale ales”), so we used style guides to categorize each lower-level style into a higher-level one.
Consistent with our theorizing, consumers who felt more uncertain were more likely to pick a different style of beer next. This was true at the more specific style level (e.g., American pale ale; BeerAdvocate: γ = .02, Z = 5.55, p < .001; RateBeer: γ = .02, Z = 4.76, p < .001) and more general beer style (e.g., pale ales; BeerAdvocate: γ = .02, Z = 6.84, p < .001; RateBeer: γ = .02, Z = 8.48, p < .001).
Further, this again generalized across time. Uncertain consumers took longer to choose that given style (e.g., American pale ale; BeerAdvocate: γ = −.01, t(1,289,578.11) = 11.50, p < .001; RateBeer: γ = −.01, t(826,685.74) = 13.14, p < .001) and higher-level style again (e.g., pale ale; BeerAdvocate: γ = −.01, t(1,171,876.05) = 9.20, p < .001; RateBeer: γ = −.01, t(828,300.68) = 12.53, p < .001).
Discussion
Studies 2b and 3b provide additional evidence regarding how confidence shapes choice. Consistent with our theorizing and with Study 1b, the less confident consumers felt, the more they chose something different next. This was true whether difference was measured using multidimensional embeddings or using simpler measures like choosing a different brand or style of beer. Consumers also took longer to return to the brand or style of beer associated with the uncertainty.
While one could wonder whether uncertainty leads consumers to return to previously tried products, this does not appear to be the case. Ancillary analyses (Web Appendix) show that the more uncertain consumers are about their current choice, the less familiar they were with the style or brand of beer they chose next (i.e., they had tried it fewer times previously). Study W3, an experiment, shows similar results (Web Appendix). Thus, consumers are choosing something different.
These shifts in confidence that occur with early experience can be consequential. The confidence dip that occurs within the first eight beers a consumer tries predicts decreased brand loyalty. Specifically, a consumer on BeerAdvocate with low confidence (the minimum confidence observed) waits 18.12% longer before buying the same brand again. If they used to buy once per week, that delay reduces annual purchases from 52 to about 44. In addition, 1.4% more of those remaining purchases go to a competing brand due to brand switching, dropping the focal brand's annual count to around 43. At $12 per six-pack of beer, spending per consumer falls from $624 to about $516—a $108 difference. For a customer base of 100,000, dips in confidence that occur with initial experience could amount to roughly $10.8 million in lost revenue each year. RateBeer shows a similar pattern.
Study 4b: Consequences for Product Choice
While consumers often purchase different types of wine or beer, for cosmetics, purchase often happens within a product category (e.g., different foundations or mascaras). Consequently, we examine whether uncertain consumers are more likely to choose a different brand in a subcategory next. If their next mascara is from a different brand, for example, it was coded as 1 (switched); otherwise it was coded as 0 (did not switch). 22 This was done separately for each subcategory (e.g., mascara or foundation) so that a consumer could switch products in one subcategory and not others. 23
Consistent with our theorizing and with the results of Studies 1b, 2b, and 3b, uncertainty predicted switching. The less confident consumers felt, the more likely they were to try another brand (γ = −.005, Z = 4.02, p < .001). This holds controlling for valence and emotionality (γ = −.005, Z = 3.74, p < .001). 24 Thus, further highlighting generalizability, when consumers felt uncertain, they were more likely to avoid the brand they chose previously and switch to a different one.
As consumers gain experience and experience a dip in confidence within their first ten products, moving from high to low confidence (maximum to minimum observed), they are 4.5 percentage points more likely to switch brands, and 54% of these switchers never return. Female consumers, for example, typically spend $23 per month on makeup and $28 on skincare products, which translates to five-year totals of $1,380 and $1,680, respectively (Advanced Dermatology 2022). Thus, if a customer switches, the brand effectively loses those entire amounts. For a customer base of 100,000, that means 2,430 customers do not return (4.5% × 54%). Consequently, the brand would lose approximately $3.4 million from makeup and $4.1 million from skincare.
Study 5b: Consequences for Photograph Choice
We also conducted a similar analysis for Study 5. For each photograph, we asked participants whether they preferred to see a similar or different photograph next (1 = “Very similar,” and 7 = “Very different”).
Consistent with the field data, the more uncertain participants felt, the more they preferred to see a different photograph next (γ = −.38, t(7,204.90) = 17.70, p < .001). This held controlling for quality judgments, fatigue, and engagement (γ = −.19, t(7,202.31) = 9.67, p < .001).
Manipulating Confidence
One could wonder whether confidence is truly driving choice, and why. Consequently, we conducted three additional experiments that manipulate confidence between subjects.
In each, participants selected a music genre, were induced to feel either uncertain or confident about their music understanding, and chose songs from a list of genres. We predicted that feeling less certain would encourage participants to choose something different (i.e., in this case, songs from a different genre). Given space constraints, we summarize the results briefly; see the Web Appendix for full results.
Consistent with our theorizing, feeling uncertain led participants to choose something different. They were more likely to avoid their initially-selected genre, for example, and choose songs from different ones (genre-switching rate: MLow Confidence = .53 vs. MHigh Confidence = .43, p = .01; Study W1 in the Web Appendix). An additional experiment replicated these results with a control condition (MLow Confidence = .64 vs. MControl = .51, p = .03; Study W2 in the Web Appendix), and a final experiment demonstrated the underlying process: Uncertainty leads consumers to pick different items because it encourages avoidance of the initial genre (MLow Confidence = .76 vs. MHigh Confidence = .69, p = .009; Study W3 in the Web Appendix).
General Discussion
Confidence has an important impact on consumer behavior. Yet, surprisingly little research exists on how confidence changes with experience. By enhancing knowledge and skill, gaining experience seems like it might increase confidence. But is that actually the case?
Four large-scale field studies, using natural language processing and almost 100,000 consumers, and an experiment show a common and nuanced journey (Studies 1–5). Specifically, there is a consistent U-shaped relationship between confidence and experience. While confidence starts relatively high, it drops as consumers gain experience. But with more experience, confidence eventually recovers. The pattern generalizes across product categories (e.g., wine, beer, and cosmetics), time, and types of consumers. Further, it holds beyond a host of alternative explanations (e.g., the specific products selected, attrition, self-selection into review writing, emotionality and valence of reviews, social influence, social norms, and product price).
These studies, and additional experiments, also indicate that uncertainty leads consumers to switch to something different, such as a different product type (Studies 1b, 2b, 3b, and 4b) or brand (Studies 2b, 3b, and 4b). It also leads consumers to take longer to choose from the same brand again. The results generalize across domains (e.g., wine, beer, cosmetics, and music) and hold controlling for a range of potential alternative explanations. Directly manipulating uncertainty underscores its causal impact (Studies W1–W3) and demonstrates the underlying process: Consumers switch to avoid uncertainty (Study W3).
Contributions
This research makes several contributions. First, it demonstrates a nuanced, nonlinear relationship between experience and confidence. Relatively little is known about how experience shapes confidence. Moreover, while past work might suggest that experience increases or decreases confidence (e.g., Hutchinson and Eisenstein 2008; Høegh-Larsen et al. 2023), our more detailed examination indicates a U-shaped pattern. This pattern is similar across product categories, websites, time periods, and demographics, indicating a common developmental progression as consumers gain experience and knowledge. This suggests that rather than being solely driven by individual reactions to idiosyncratic product experiences, the evolution of confidence is also shaped by underlying phases of experiential growth.
Second, this research contributes to work on consumer learning and knowledge (e.g., Alba and Hutchinson 1987), demonstrating a new critical phase in consumer learning. Specifically, given that confidence reflects consumers’ subjective sense of understanding, this work identifies a “metacognitive recalibration” stage where consumers’ confidence decreases as they reevaluate their understanding. Consumers are learning what they do not know. Put differently, they are transitioning from an unawareness of their lack of knowledge to an awareness of their lack of knowledge and adjusting their confidence accordingly. This is a novel phase not identified in previous research.
Third, by leveraging large-scale field data, our research provides a unique examination of how direct experience shapes outcomes. Consumer research has largely focused on effects of indirect experience (Hamilton and Thompson 2007; Hoch and Deighton 1989), in part because tracking direct experience over time is difficult. Our research thus complements work on single direct experiences by offering a longitudinal lens into how confidence develops dynamically through direct experience over time.
Fourth, this work highlights a paradigm for studying the development of experience across time. Given the amount of time it takes to develop experience (e.g., days, months, years) and the difficulty of observing this experience, we show that online reviews can help. The language consumers use over multiple experiences provides a way to study experience across time. Future work can leverage this method to deepen understanding of how accumulating firsthand experience influences consumer psychology across contexts.
Fifth, this research has implications for the literature on consumer beliefs and attitudes. Work in this area suggests that greater experience and knowledge tend to lead to greater confidence and therefore stronger beliefs and attitudes (e.g., Tormala and Rucker 2018). The U-shaped relationship between confidence and experience, however, underscores that beliefs and attitudes do not necessarily strengthen linearly with experience. Confidence demonstrates more complex trajectories, and thus experience is unlikely to universally lead to stronger beliefs and attitudes.
Sixth, this research sheds light on an important driver of choice. While satisfaction shapes repeat purchases (e.g., Oliver 1999), we demonstrate that certainty also plays a role. We find that consumers’ initial experience within a domain leads them to feel uncertain and that this uncertainty about the domain generalizes to the product, leading them to choose something different. Further, uncertainty affects brand and product category choice. Consumers who felt more uncertainty around a particular beer, for example, avoided other beers made by that brand, others of that style (e.g., American pale ales), and others of that higher-level style (e.g., pale ales in general). They also waited longer to choose those types of things again. The fact that uncertainty generates avoidance and reduces brand loyalty indicates that retention is not just about satisfaction with prior choices, but also about how certain the consumer feels.
Seventh, this work also deepens understanding of what drives varied choices. A great deal of research has examined variety-seeking (Ratner, Kahn, and Kahneman 1999), and consumers’ tendency to seek variety has been attributed to motivations like satiation, boredom, or desire for novelty (Galak and Redden 2018; Kahn 1995; McAlister and Pessemier 1982). We document that uncertainty can also lead to varied choices. As consumers gain experience, they feel uncertain and avoid similar products, leading to varied choices over time. 25
Implications for Practice
These findings also have a variety of useful implications for practice. First, firms that have access to the confidence consumers express (e.g., through the reviews they write) can use this information to improve customer satisfaction, retention, and purchase likelihood. Platforms (e.g., Amazon or Sephora) that offer recommendations about products to try next, for example, could benefit from taking confidence into account when making such recommendations. Our results suggest that consumers who express more uncertainty may be more interested in trying something different, so recommending more differentiated products (e.g., a different style or brand) should make them more likely to accept the recommendation (i.e., because it fits what they are looking for), and increase their use of and satisfaction with the platform.
Second, our results provide insights into how companies should frame offerings. When communicating with customers, for example, marketers may benefit from framing offerings differently based on how much certainty the person expresses. If someone recently expressed more uncertainty, for example, framing a product as more different from what they just tried (e.g., highlighting unique attributes or dimensions) should make them more interested in purchasing it. Indeed, ancillary analyses suggest that rather than returning to more familiar products when uncertain, consumers are likely to try something more different (Web Appendix). In contrast, if someone recently expressed more certainty, framing that product as more similar to what they just tried previously (e.g., highlighting similar characteristics) should be more beneficial.
Third, even without direct access to how confident consumers feel, firms can use these results to improve interactions. Knowing how experience changes confidence can help marketers manage customers who are looking to switch. For example, knowing that novice consumers will soon lose confidence, which makes them more open to trying different offerings, can help marketers intervene to keep them in the fold. Raising awareness of other products in the product line or other offerings from the same brand, for example, can help marketers manage those customers’ desire to do something different, without losing them entirely.
Fourth, our results highlight that even beyond how much consumers like something, how certain they feel about it can shape their subsequent choices. Consequently, when trying to retain customers, marketers would be wise to help them feel more certain. Rather than just asking what they liked about a given product, for example, companies would benefit from highlighting aspects they know consumers tend to feel certain about, or asking consumers to share aspects they felt certain about (e.g., when asking consumers what they thought in a follow-up email). Such communications should encourage consumers to feel more certain about the product or service they just used and, consequently, make them less likely to switch to something else.
Directions for Future Research
This work also highlights several interesting avenues for future research. First, research might examine moderators of the experience–confidence relationship. One factor might be the depth or type of processing induced by the experience. Experiences that encourage deeper processing and more integrated, abstract knowledge could generate faster confidence recovery given that they help consumers fill knowledge gaps more quickly and lead to more generalizable insights. Individual differences may also play a role. Need for closure (Webster and Kruglanski 1994), for example, may lead some consumers to rebound faster from the initial confidence dip as they may be more motivated to assimilate and organize their knowledge from experience.
Second, while the current research focuses on direct experience, it would be interesting to consider whether similar confidence trajectories might hold for indirect experience (e.g., advertising, word of mouth). These dynamics may be specific to direct experience. Consumers might need to directly interact with products to confront gaps in their knowledge, and indirect experience may allow people to believe they understand a domain without facing uncertainties firsthand. Still, tracing trajectories based on indirect experience could provide insight into learning from external sources and how this compares to direct experience. Comparing direct and indirect experiences could also reveal relative rates of knowledge acquisition.
Third, some work (O’Connor and Cheema 2018) suggests that repeated evaluations can lead to more fluent decision-making, and thus more positive evaluations. Given this, one could wonder whether experience increases fluency, which could lead to confidence and potentially to positivity. That said, the relationship between experience, confidence, and valence may also be more complex. Greater experience can sometimes lead to lower evaluations (Alba and Williams 2013) as people become more critical, and experience can lead to less extreme evaluations (Nguyen et al. 2021). Examining our own data shows that valence changes in different ways with experience across studies. While some studies (Studies 1a and 4a) show a U-shaped relationship, others show a general decrease (Studies 2a and 3a; see the Web Appendix for results). Further research could explore these complex interactions between experience, confidence, and valence to improve understanding of their influences on one another.
Fourth, future research could also examine what consumers learn from experience, or what concepts and processes they acquire along the way. While a complete examination of this question would require a separate line of research, preliminary analyses are intriguing. We started by comparing early and later reviews from the same consumers, using a method that identifies terms that maximally differentiate between classes of text (Hovy, Melumad, and Inman 2021). Results indicate that as consumers gain experience, they learn to identify and articulate specific product characteristics, shifting from general terminology (e.g., “drinkable,” “foundation”) to more nuanced and specific descriptors (e.g., “vanilla,” “dark fruit,” “retinol”; see the Web Appendix for all terms). This suggests that consumers may also become more concrete and precise as they gain experience, improving their ability to notice and identify specific characteristics and articulate them (see also Lawless 1984). Indeed, analyzing linguistic concreteness (Brysbaert, Warriner, and Kuperman 2013) shows that consumers use more concrete language as they gain experience, which may reflect an increased ability to perceive and understand specific attributes (e.g., flavors, aromas, textures; see the Web Appendix). Results examining analytical language also suggest that experience helps consumers learn to be more analytical (see the Web Appendix).
Taken together, these analyses indicate that experience helps consumers shift from holistic, general assessments to more analytical and nuanced ones as they learn to decompose products into specific attributes and articulate subtle distinctions. Adding to prior work about consumer learning with similar findings (Alba and Hutchinson 1987; LaTour and LaTour 2010; Maciel and Wallendorf 2017), our analyses indicate that consumers learn nuanced product attributes and how best to systematically break down and understand their experiences. To our knowledge, these results are the first to provide such evidence longitudinally by following the same consumers as they gain experience, speaking to the advantages of the current approach.
Conclusion
Surprisingly little is known about consumer confidence over time and how experience shapes it. The present research reveals a nuanced, U-shaped relationship between experience and confidence. Further, it demonstrates the downstream consequences of experience, illustrating that the uncertainty it generates encourages product and brand switching. Overall, this work underscores complexities in the confidence journey and its impact on choice.
Supplemental Material
sj-pdf-1-mrj-10.1177_00222437251372928 - Supplemental material for The Trajectory of Confidence: Experience, Certainty, and Consumer Choice
Supplemental material, sj-pdf-1-mrj-10.1177_00222437251372928 for The Trajectory of Confidence: Experience, Certainty, and Consumer Choice by Matthew D. Rocklage, Jonah Berger and Reihane Boghrati in Journal of Marketing Research
Footnotes
Coeditor
Rebecca Hamilton
Associate Editor
Xin (Shane) Wang
Declaration of Conflicting Interests
The author(s) declared no potential conflicts of interest with respect to the research, authorship, and/or publication of this article.
Funding
The author(s) received no financial support for the research, authorship, and/or publication of this article.
Notes
References
Supplementary Material
Please find the following supplemental material available below.
For Open Access articles published under a Creative Commons License, all supplemental material carries the same license as the article it is associated with.
For non-Open Access articles published, all supplemental material carries a non-exclusive license, and permission requests for re-use of supplemental material or any part of supplemental material shall be sent directly to the copyright owner as specified in the copyright notice associated with the article.