
Abstract
Some retailers use stars while others use Arabic numerals to present product ratings. Do consumers evaluate product ratings differently depending on the format? Which format more accurately represents the true magnitude of ratings? Across 12 experiments, we find that neither format is veridical. Consumers overestimate fractional star ratings (e.g.,  ) and underestimate fractional Arabic numerals (e.g., 3.5). The overestimation of graphical ratings arises from the visual-completion effect: When the visual system perceives an incomplete image of a star, it instinctively activates the complete image, causing consumers to anchor their magnitude judgments on rounded-up numbers (i.e., evaluation of
  is anchored on
  ). Importantly, our results show that this overestimation of star ratings can be mitigated by using visually complete stars (e.g.,
  ). Conversely, the underestimation of Arabic numeral ratings stems from the left-digit effect, which leads consumers to anchor magnitude judgments on rounded-down numbers (i.e., evaluation of 3.5 is anchored on digit 3). Thus, both star and Arabic numeral ratings are systematically misestimated by consumers, with the extent of misestimation varying based on the fractional value and the star-filling technique employed. These findings demonstrate that prevalent rating formats are misleading, highlighting the need for new industry standards.
Product ratings have become increasingly prevalent. Most commercial and social interaction platforms incorporate some form of numeric rating system. Numerical ratings are used to evaluate books, movies, and products on commercial platforms; social communications on social media platforms; places to visit on navigation platforms; and even people on dating and relationship facilitation platforms. It has been suggested that product rating is one of the significant factors influencing purchase decisions, as important as price, brand, and recommendations from friends and family (PowerReviews 2021). According to a recent report, even a small increase in product ratings, such as .2, can lead to a significant increase in product sales, ranging from 30% to 200% (Fedewa et al. 2021).
Although the use of ratings is ubiquitous, there is considerable heterogeneity in the format of ratings. Different platforms use different symbols to communicate the ratings. The two most popular forms of rating formats are graphic symbols, such as stars or circles, and Arabic numerals. Some platforms, such as Amazon, Yelp, and Tripadvisor, use graphic symbols to represent ratings (e.g.,  ). Others, such as Uber, Facebook, and Airbnb, use Arabic numerals (e.g., 3.5). And some platforms, such as Google Maps, Walmart, and Goodreads, use a combination of both types of symbols—stars and numerals together (e.g., 3.5
  )—to represent ratings.
1
This heterogeneity raises the question of whether consumer evaluations of ratings depend on the rating symbol.
)—to represent ratings.
1
This heterogeneity raises the question of whether consumer evaluations of ratings depend on the rating symbol.
Recent research has begun to address this critical question. Jia, Wan, and Zheng (2023) compare the effects of different types of graphical ratings: nonrectangular rating formats such as star ratings and rectangular rating formats such as bar ratings. They find that star ratings, in comparison to bar ratings, increase product preference for ratings below the nearest integer (e.g., 3.8), whereas bar ratings increase preferences for ratings above the nearest integer (e.g., 3.2). Mousavi et al. (2024) study how different formats of representing distribution of ratings—proportional bar graphs and simple bar graphs—influence consumer evaluations. More pertinent to the present research, Abell, Morgan, and Romero (2024) compare graphical ratings and Arabic numeral ratings. They find that fractional Arabic numeral ratings (e.g., 2.75) are perceived to be lower than their graphical counterparts (e.g., two full stars and one three-quarter-filled star), though not always.
These findings raise an important but hitherto unaddressed question: Which rating format is more veridical of the underlying magnitude? In other words, which format truthfully communicates the actual rating magnitude? Prior research has not tackled this question, as it has focused only on relative perceptions. Although Abell, Morgan, and Romero (2024) find that Arabic numeral ratings are perceived to be lower in magnitude compared with star ratings, their studies do not determine whether this bias is caused by underestimation of Arabic numeral ratings (i.e., whether Arabic numeral ratings are perceived to be lower than the actual magnitude), overestimation of star ratings (whether star ratings are perceived to be higher than the actual magnitude), or both. Additionally, it is conceivable that star ratings are misestimated in some situations while Arabic numeral ratings are misestimated in others.
Our primary objective in this research is to move beyond relative perceptions and examine the accuracy of star and Arabic numeral rating perceptions. We use the number line estimation task to test the accuracy of each magnitude perception, specifically investigating whether star ratings are overestimated and whether Arabic numerals are underestimated. The number line estimation task, novel in the context of ratings, enables us to investigate the veridicality of product rating formats by drawing on a numerical cognition methodology established in cognitive psychology literature (Booth and Siegler 2008; Dehaene et al. 2008; Schley and Peters 2014; Siegler and Opfer 2003).
A second important, but previously unaddressed, question pertains to the effect of different filling techniques used to create fractional star ratings. These ratings are typically represented using partially filled stars. For instance, a 3.25 rating is depicted by three full stars and one quarter-filled star. There are at least two different methods for filling the quarter star: the proportion-of-area method and the proportion-of-width method. In the proportion-of-area method, the fractional quantity represents the fraction of the star's total area filled (e.g., a .25 star is represented by a star with 25% of its area filled). Conversely, in the proportion-of-width method, the fractional quantity represents the width of the star filled from the left vertex (e.g., a .25 star is represented by a star with 25% of its width filled).
Which of these two methods produces more veridical perceptions of the underlying magnitude? Addressing this question is important for two reasons. First, e-commerce platforms currently employ both fill methods to display fractional graphical ratings (see Table W2 in Web Appendix A). Second, a vast majority of star ratings on these platforms are fractional, with very few ratings being whole numbers, making the accuracy of fractional representations particularly significant. The number line estimation task that we use in this research also enables us to test the accuracy of these two methods of creating fractional star ratings, providing insights into which method better conveys the actual rating magnitude.
To presage our results, we demonstrate that neither star ratings nor numerical ratings serve as veridical representations of underlying magnitudes. Specifically, fractional star ratings are prone to overestimation, while fractional Arabic numeral ratings tend to be underestimated, with varying degrees of misestimation between these two formats. Additionally, our research highlights the influence of fill methods on the perception of fractional star ratings; stars created using the proportion-of-area method are perceived differently from those created with the proportion-of-width method. These discrepancies have significant implications for consumers and industry stakeholders. Misestimations in perception can mislead consumers, impacting their purchase intentions and the products’ perceived value. Thus, it is crucial to explore strategies that reduce such perceptual biases. Our findings offer an initial step by proposing visually complete graphical ratings, which, on average, minimize misestimation. Furthermore, we emphasize the need for industry standards to ensure uniformity in rating formats. The current lack of standardization can hinder consumers’ ability to make informed decisions, underscoring the importance of consistent rating representations across e-commerce platforms.
The present work advances the extant literature in multiple ways. First, it advances the literature on numerical cognition. While previous studies have focused on how the encoding of Arabic numerals influences aspects of consumer behavior, including magnitude judgments (Bagchi and Li 2011; Monga and Bagchi 2012; Pandelaere, Briers, and Lembregts 2011) and consumer preferences (King and Janiszewski 2011; Lembregts and Pena-Marin 2021; Thomas, Morwitz, and Sirwani 2025), limited attention has been given to graphical representations of magnitudes. With the growing prevalence of digital commerce and wearable devices, such graphical representations are increasingly common. Examples include product ratings depicted as stars, health metrics on wearable devices shown as concentric circles, and battery levels on gadgets represented through fractional bars. Our research extends the traditional understanding of numerical cognition by illustrating how magnitude judgments of Arabic numerals differ from those of graphical symbols, thereby addressing an increasingly relevant dimension of modern consumer interactions.
By delineating biases in rating perceptions, our research contributes to the literature on product ratings (Fisher, Newman, and Dhar 2018; De Langhe, Fernbach, and Lichtenstein 2016; Schoenmueller, Netzer, and Stahl 2020). Importantly, our findings qualify some recent insights on consumer perceptions of ratings. Jia, Wan, and Zheng (2023) theorize that star ratings are rounded to the nearest integer, positing that star ratings with fractions below .5 (e.g., 3.2) are rounded down, whereas star ratings with fractions above .5 (e.g., 3.8) are rounded up. We show that these results are not generalizable; they are restricted to fractional stars created using the proportion-of-width method. When fractional stars are created using the proportion-of-area method, all fractional star ratings, regardless of magnitude—such as 3.8, 3.5, and even 3.2—are overestimated due to the visual-completion effect identified in this research.
Our results also qualify the findings reported by Abell, Morgan, and Romero (2024). These authors theorize that fractional numeric ratings are underestimated because magnitude perceptions of multidigit numbers are anchored on the leftmost digits. According to their theory, fractional star ratings are not misestimated because graphical images are processed holistically, suggesting that star ratings are more veridical than numeric ratings. We demonstrate that this is not true (see Figure W3 in Web Appendix B for a visual illustration of the discrepant findings). Neither rating format is veridical. Fractional star ratings are, in fact, overestimated, and this overestimation is central to understanding the discrepant perceptions of star and numeric ratings.
Theoretical Background
Our research systematically compares consumer perceptions of product ratings expressed as Arabic numerals versus star ratings. While previous research (Abell, Morgan, and Romero 2024) has documented that Arabic numeral ratings are generally perceived as lower than equivalent star ratings, the question of veridicality—or accuracy—of these two rating formats remains unaddressed. Figure 1 illustrates three plausible scenarios of misestimation using a representative example of a 3.50 rating, expressed either as an Arabic numeral or graphically as three full stars and a half star. The y-axis quantifies the deviation of perceived magnitude from the actual rating (i.e., perceived magnitude minus 3.5). Panel A depicts a scenario in which the Arabic numeral rating is underestimated while the star rating is accurately perceived. Panel B illustrates an alternative possibility: accurate perception of Arabic numerals but overestimation of star ratings. Finally, Panel C represents a scenario where both rating formats are subject to misestimation, albeit in opposite directions.
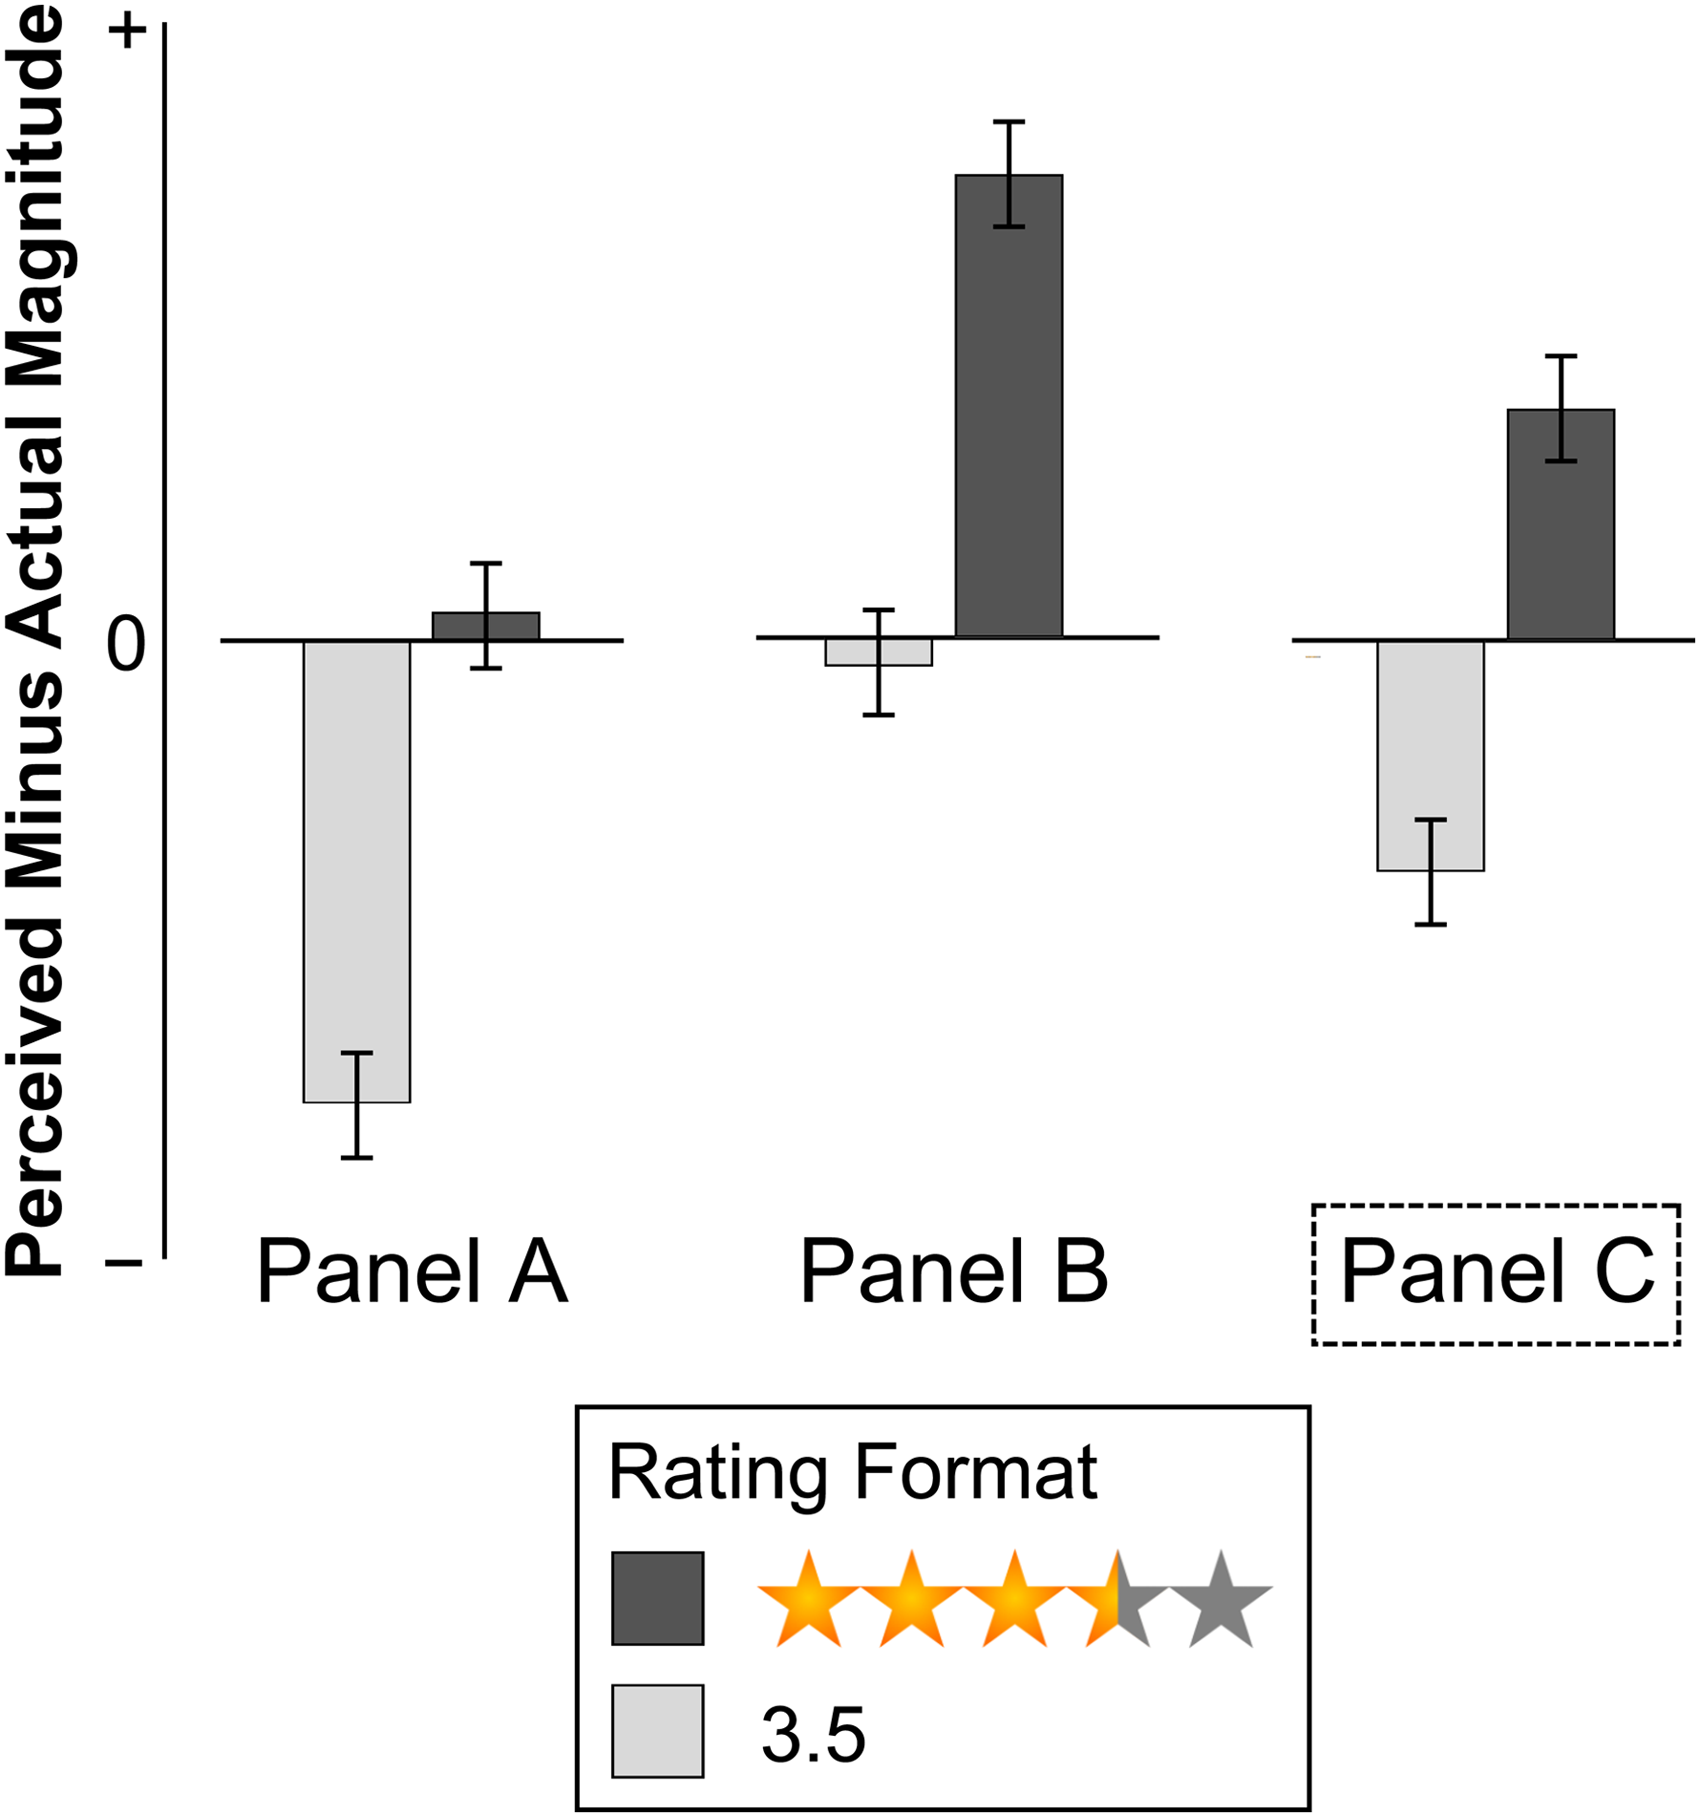
Different Accounts for Consumer Misestimation of Product Rating of 3.5.
Our theory predicts the outcomes depicted in Panel C of Figure 1. We posit that both star ratings and Arabic numeral ratings independently introduce biases in magnitude perceptions, albeit through distinct mechanisms. Fractional star ratings are subject to overestimation due to the phenomenon of visual completion, wherein the human perceptual system tends to “fill in” incomplete visual elements. We refer to this phenomenon as the visual-completion effect. Conversely, fractional Arabic numerals are prone to underestimation because of the left-digit effect, whereby the leftmost digit disproportionately influences overall magnitude perception. Thus, perceptions of fractional star ratings are anchored on the rounded-up integer (e.g., the perception of 3.5 stars is anchored on 4), whereas perceptions of fractional Arabic numerals are anchored on the rounded-down integer (e.g., the perception of 3.5 is anchored on 3).
Our conceptualization of how consumers perceive star and Arabic numeral ratings is predicated on two postulates. First, given that processing fractional numbers is cognitively more demanding than processing whole numbers, individuals tend to rely on heuristic strategies for magnitude judgments. Specifically, we propose that when evaluating the magnitude of fractional numbers, people utilize nearby whole numbers as cognitive anchors. Second, the selection of these anchors varies systematically depending on the type of rating symbol employed. In the case of graphical ratings, such as stars, the automatic visual completion of fractional stars prompts individuals to anchor their judgments on rounded-up numbers, consequently resulting in overestimation. Conversely, for Arabic numerals, disproportionate emphasis on the leftmost digit leads people to anchor on rounded-down numbers, thus resulting in underestimation.
Processing Fractional Quantities
The analog model of numerical cognition posits that people make sense of numeric symbols by converting the symbols into internal approximate magnitudes along a mental number line, a process known as mapping of symbolic representation to analog magnitudes (Dehaene 1997; Dehaene, Dupoux, and Mehler 1990; Schley and Peters 2014). Inaccurate mapping can lead to biases in magnitude judgments.
Humans exhibit an intuitive grasp of whole number magnitudes, particularly for small quantities like 1, 2, and 3—a capacity likely shaped by evolutionary pressures favoring rapid quantitative assessments and reinforced through frequent encounters with these numbers in daily life. That is, people can easily map whole numbers such as 1, 2, and 3 on their mental number line that they use for magnitude judgments. However, this is not true for fractions. Although children can count from a young age, they do not understand fractions until later in their development (Dehaene 1997). Even adults struggle to assess the magnitudes of fractional numbers, such as 3.2, 3.5, or 3.8 (Gigerenzer and Hoffrage 1999). When they encounter such fractional numbers, salient round numbers serve as initial anchors that help them judge the magnitude of the fractional numbers (Rosch 1975). That is, when mapping a fractional number onto the internal mental number line, the human mind often starts with a salient round number as an anchor and adjusts from there. However, the adjustments in this anchoring-and-adjustment heuristic are usually insufficient (Epley and Gilovich 2004; Tversky and Kahneman 1974), leading to estimates that may be lower or higher than the actual number, depending on whether the chosen anchor is below or above the actual number.
Anchors Differ by Rating Symbols
We posit that rating symbols can influence the initial anchor. When presented with graphical symbols, people tend to anchor on rounded-up numbers, leading to an overestimation of the magnitude of fractional ratings. However, when presented with Arabic numerals, people are likely to anchor on rounded-down numbers, leading to an underestimation of the magnitude of fractional ratings. This systematic proclivity to anchor on rounded-up (vs. rounded-down) numbers during the encoding of fractional graphical (vs. Arabic numeral) ratings is influenced by two distinct processes.
Visual completion bias
Magnitude judgments of fractional star ratings are influenced by visual completion of incomplete images, which leads to the overestimation of fractional graphical ratings. Visual completion is the psychological process by which the brain uses contextual clues, prior knowledge, and expectations to fill in gaps in sensory information and create a coherent perception of the world around us (Kanizsa 1979; Pessoa and De Weerd 2003; Pessoa, Thompson, and Noë 1998; Van Lier and Gerbino 2015). This process is a fundamental aspect of human perception as it enables us to perceive objects and scenes as complete, even when our sensory information is incomplete or degraded (Ramachandran 1992). Our innate need for visual completion leads us to perceive images as complete, even when they are not (Foley et al. 1997, 2007; Kanizsa 1979; Pessoa, Thompson, and Noë 1998). Research has shown that visual completion is a rapid, automatic process that occurs at early stages of vision (Rensink and Enns 1998). It involves removing occlusion edges and linking fragments together, enabling us to perceive objects as whole and complete. The completed structures, and not the fragments, then become the units that subsequent recognition processes work with.
Fractional ratings shown using graphical symbols, such as an image of three and a half stars, are visually incomplete, and the visual system automatically attempts to complete the images. For example, when people see the image of three and a half stars, the fourth star is incomplete as it is only half-filled. In the early stages of perception, visual completion causes people to perceive the image of three and a half stars as four complete stars. This rapid, automatic, and unconscious process, occurring within tens of milliseconds and well before conscious recognition, causes the magnitude judgment of three and a half stars to be anchored on 4. Even when people subsequently correct their initial perception, these initial anchors surreptitiously influence their magnitude judgments. This results in an overestimation of the fractional star ratings. Figure 2 provides a schematic depiction of the postulated mechanism.
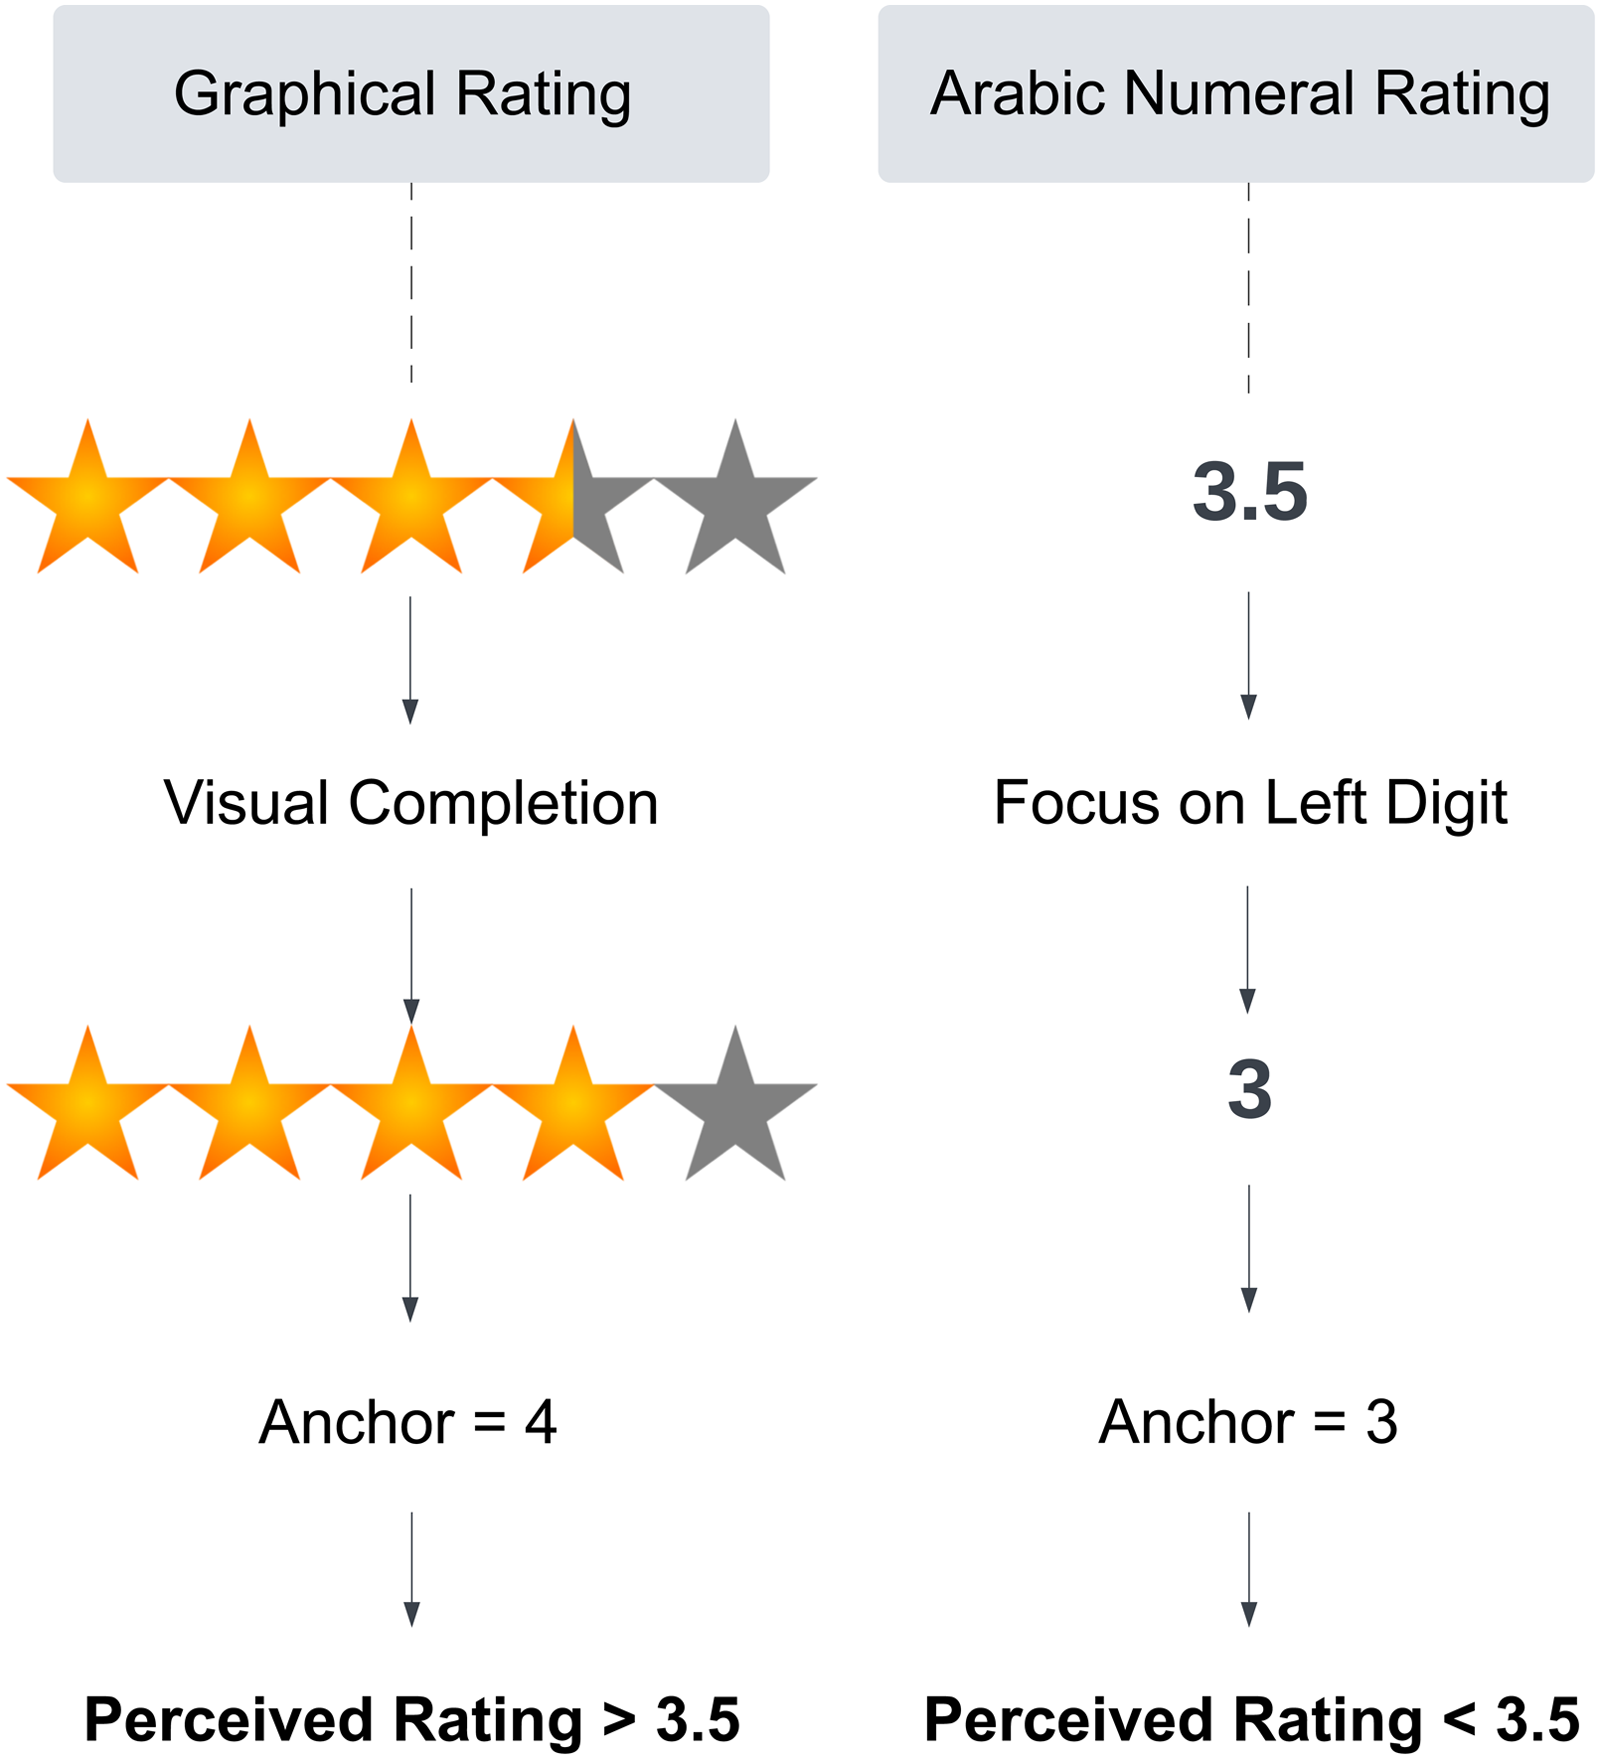
Initial Anchors Elicited by Fractional Ratings.
Left-digit bias
As suggested by Abell, Morgan, and Romero (2024), fractional ratings using Arabic numerals, in contrast, are biased by left-digit anchoring, which leads to the underestimation of fractional Arabic numeral ratings. Research has shown that people tend to focus heavily on the leftmost digit when processing numbers written in Arabic numerals (Thomas and Morwitz 2005). This phenomenon leads people to anchor on the leftmost digit, that is, rounded-down numbers in the case of fractional Arabic numeral ratings. One of the proposed reasons for this bias is the way the human mind reads numbers, which is typically from left to right. While reading multidigit numbers, the encoding process begins with the leftmost digit and then proceeds to the right. For example, when presented with the number “3.5,” people are more likely to first attend to “3” and anchor their judgment of the number on this digit, leading to an underestimation of the actual magnitude. Previous research has found that the left-digit bias can lead to significant biases in judgments and decisions in consequential settings including stock market transactions and public utility evaluations (Bhattacharya, Holden, and Jacobsen 2012; Jiang 2022; Manning and Sprott 2009). For example, one study showed that even small changes in a school's numerical average grades that changed the leftmost digit of the grade resulted in large shifts in people's evaluation of the school's performance (Olsen 2013).
Hypotheses
Our conceptualization of how rating format influences magnitude perception yields several novel predictions about the veridicality of ratings. We hypothesize that star ratings will activate rounded-up numbers as anchors due to visual completion (e.g., four will serve as the anchor for three and a half stars). In contrast, Arabic numeral ratings will activate the leftmost digits as anchors, which will be the rounded-down numbers (e.g., 3 will be the anchor for 3.5). Thus, both fractional ratings will be misestimated depending on the rating format, driven by the visual-completion effect and the left-digit effect. Formally, we hypothesize:
 ) are perceived as higher than their actual numerical value.
Round Numbers Not Misestimated
Our conceptualization of the effect of rating format on perceived magnitude identifies an important boundary condition. It predicts that visual completion will increase the perceived magnitude of fractional star ratings (e.g.,  ), but not whole-numbered star ratings (e.g.,
  ), since there is no scope for visual completion for the latter. Similarly, we expect that left-digit bias will reduce the perceived magnitude of fractional Arabic numerals (e.g., 3.50), but not whole numbered Arabic numerals (e.g., 4.00), as the left digits of the latter do not elicit a lower anchor. Thus,
It is worth clarifying that this boundary condition does not limit the scope or the impact of the proposed effect, as a large number of products sold on e-commerce platforms tend to have fractional average ratings. For instance, in an examination of the snack category on Amazon’s U.S. site, we observed that approximately 80% of snack products (out of 8,637 items) had a fractional average rating; see Web Appendix A for details.
Distance from Anchors Changes Misestimation
Our theory predicts that the accuracy of star and Arabic numeral ratings will vary with distance from the anchor. Fractional star ratings are overestimated because of anchoring on the higher round numbers; thus, we predict that the smaller fractions will experience greater overestimation. For example, quarter star ratings (e.g., 3.25) will be overestimated more than three-fourths star ratings (e.g., 3.75). In contrast, fractional Arabic numerals are underestimated due to anchoring on the lower round numbers, leading to greater underestimation for larger fractions. That is, three-fourths ratings (e.g., 3.75) will be underestimated more than quarter ratings (e.g., 3.25).
These predictions stem from the anchoring and adjustment literature, as demonstrated in Epley and Gilovich's (2004, 2006) work, which posits that the insufficiency of the adjustment increases as the distance between the anchor and the stimulus increases. Because of the iterative nature of the anchoring and adjustment process, in a magnitude estimation task, people begin by making small adjustments from the initial anchor and evaluate the plausibility of the adjusted estimate. If the estimate appears plausible, the adjustment halts; otherwise, further adjustments are made in small steps until a plausible value is reached. As Epley and Gilovich (2006) empirically demonstrate, the adjustments are typically insufficient. Furthermore, the larger the gap between the anchor and the stimulus, the greater the insufficiency of the adjustment. This literature suggests that the error in estimations of fractional ratings will be in the direction of the anchor and proportional to the distance between the anchor and the rating.
In the case of star ratings, people will start with rounded-up anchors and then adjust downward. For example, when they see 3.25 stars and 3.75 stars, they will anchor their judgment on 4 stars, and start adjusting downward. The adjustment will be less sufficient for smaller fractions (e.g., 3.25 stars) than for larger fractions (3.75 stars). In contrast, when these same ratings are presented as Arabic numerals, they will anchor their judgments on the lower round number 3 and start adjusting upward. The adjustment will be less sufficient for larger fractional numbers (3.75) than for smaller numbers (3.25). Formally, the degree of misestimation for fractional ratings will be proportional to the distance between the anchor and the fractional rating, such that:
Fill-In Method for Stars
To further complicate matters, there are two different methods for creating fractional star ratings: the proportion-of-area method and the proportion-of-width method. In the proportion-of-area method, the fractional quantity represents the fraction of star's total area. For example, to represent a 3.25-star rating, the fourth star can be depicted as a star with 25% of its area filled in. In the proportion-of-width method, fractional quantity represents the width of the star starting from the left vertex. In this case, the fourth star in a 3.25-star rating is represented as star with 25% of the width of the star filled. Figure 3 illustrates examples of fractional stars created using both the proportion-of-area and proportion-of-width methods. Notably, compared with the proportion-of-area approach, the proportion-of-width method creates stars with less fill-in for fractions less than .5 and more fill-in for fractions greater than .5. This discrepancy raises questions about consumer perceptions of these two types of fractional star representations. While we anticipated differences in perception, we did not formulate specific a priori hypotheses regarding how these differences might influence perceived magnitudes.
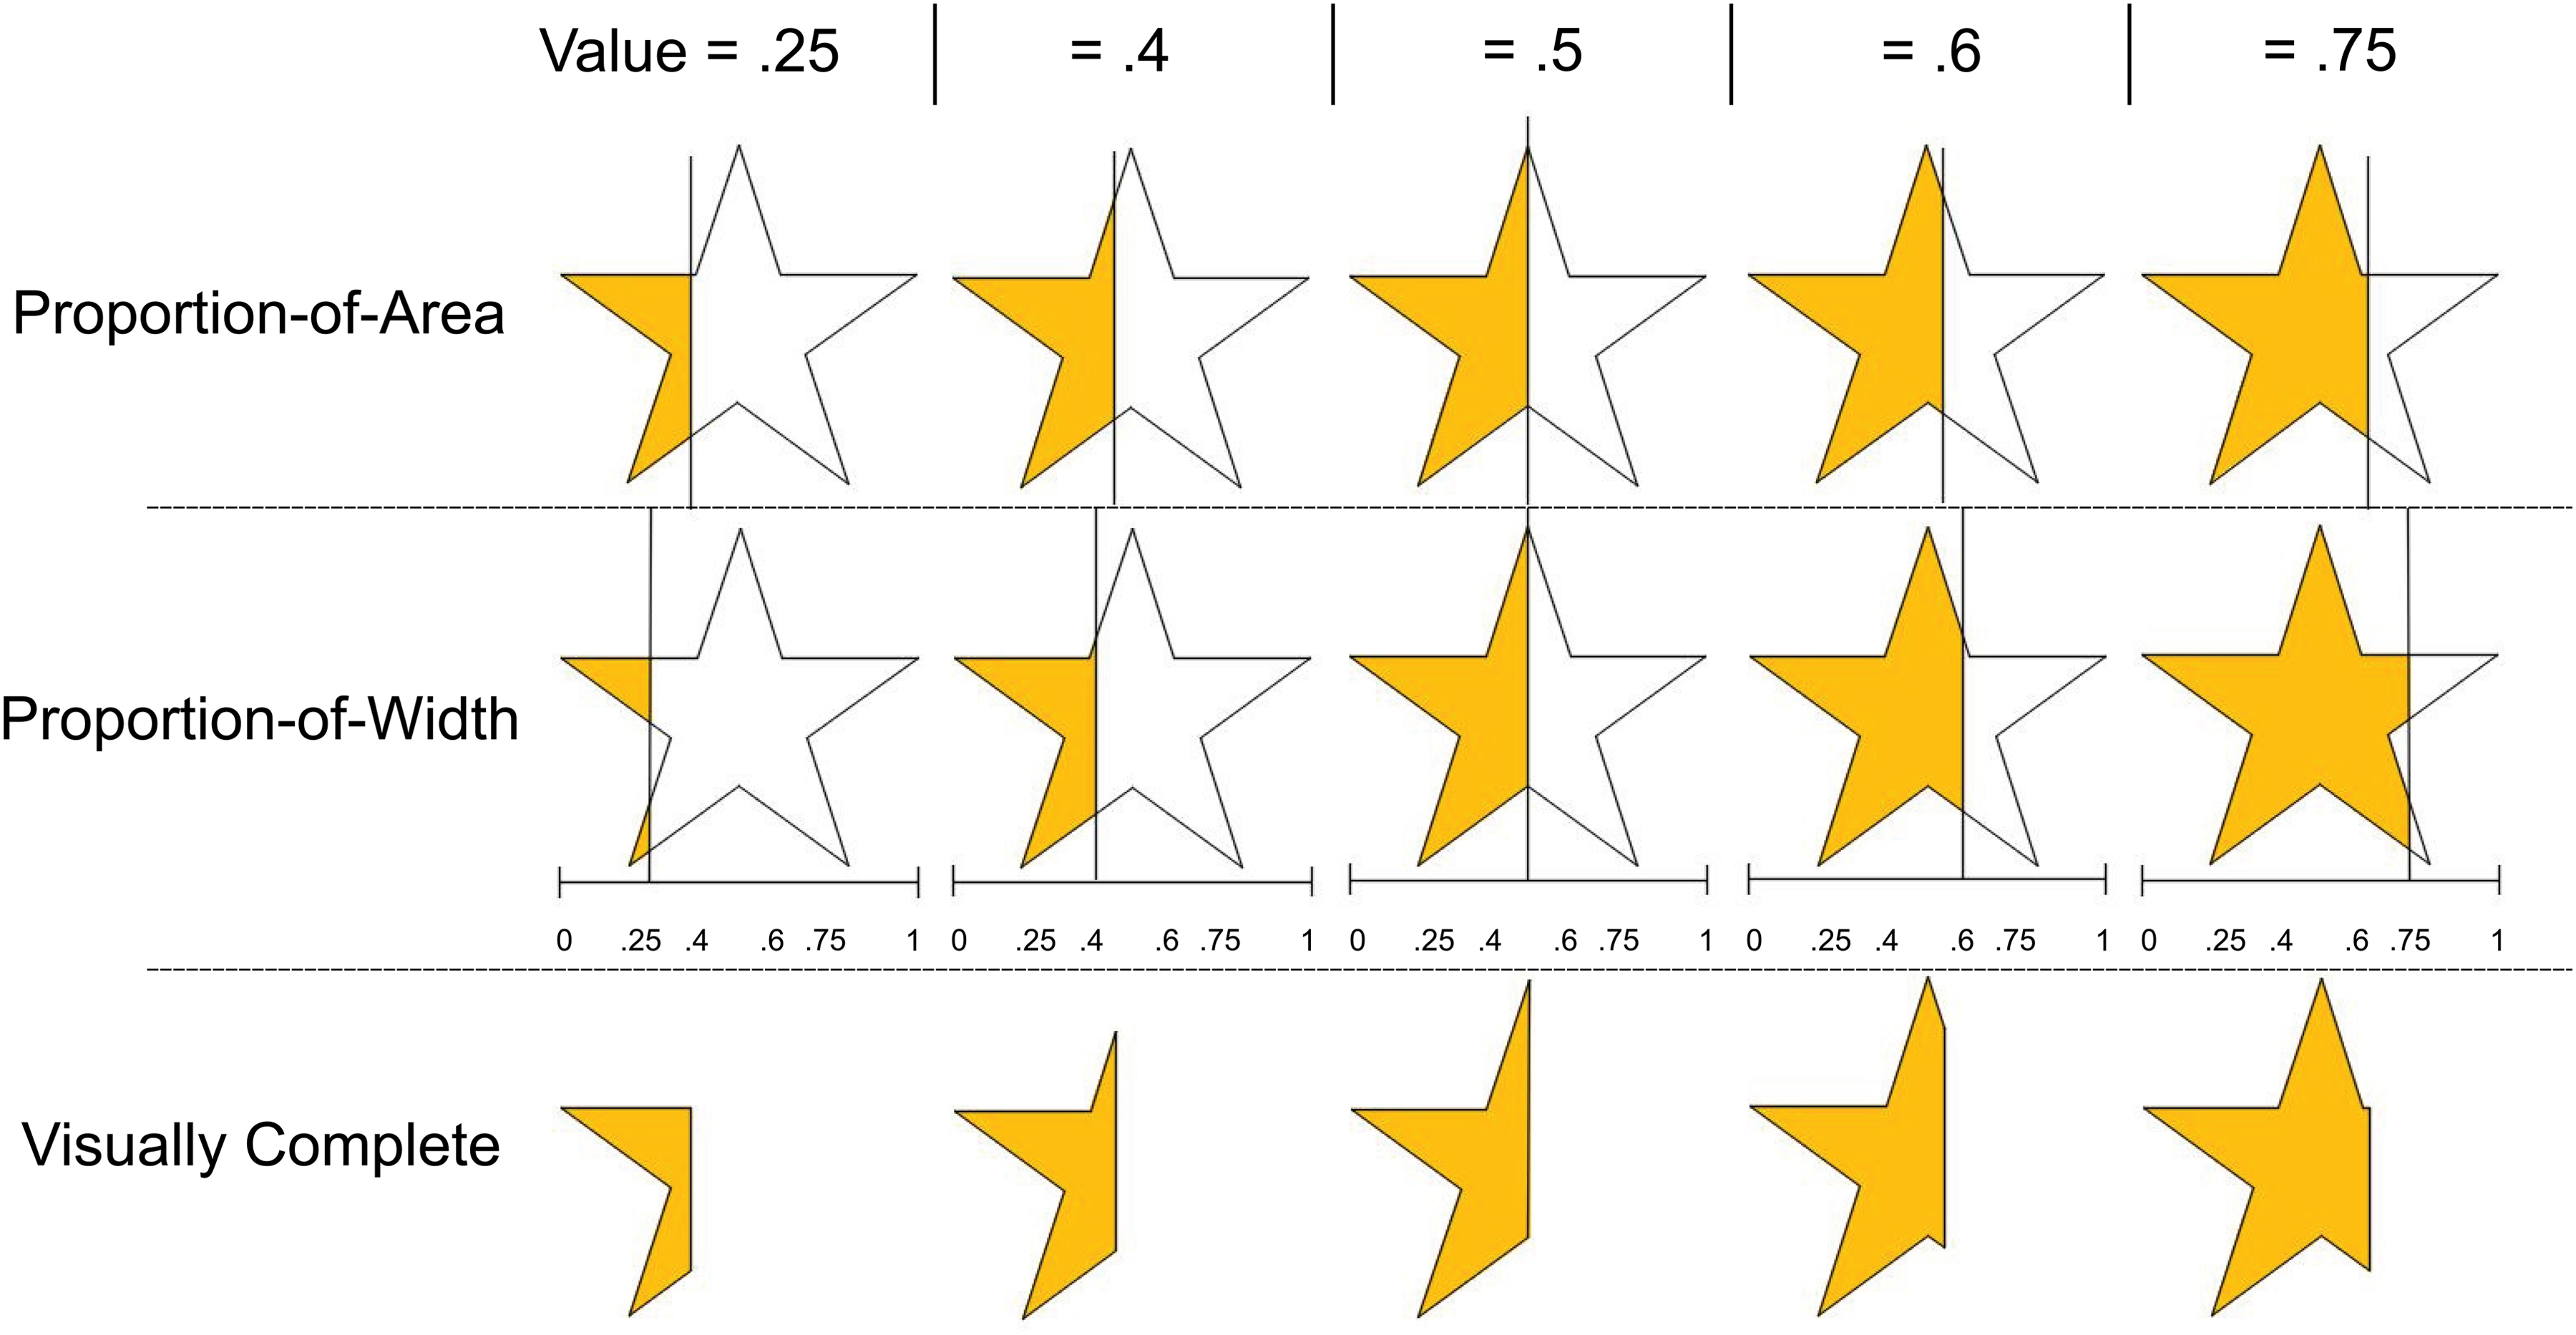
Visual Comparison of Different Types of Star Ratings.
Although marketers utilize both methods, guidelines from the field of data visualization advocate for the proportion-of-area approach as a more accurate and nondeceptive representation of fractional quantities (Tufte 2001). Adhering to these guidelines, our studies employed proportion-of-area graphical symbols. 2
Visually Complete Stars
How can star ratings be made more veridical? The root cause of the overestimation of graphical ratings is the automatic propensity to complete visually incomplete pictures. It is possible to mitigate this effect by creating graphical ratings that do not appear visually incomplete (see third row in Figure 3 and Study 4 stimuli in Figure 4). We hypothesize that when visually complete images are used to depict fractional ratings, the perceptual system will be less inclined to complete the graphical symbols. Consequently, this approach should attenuate the overestimation of graphical ratings.
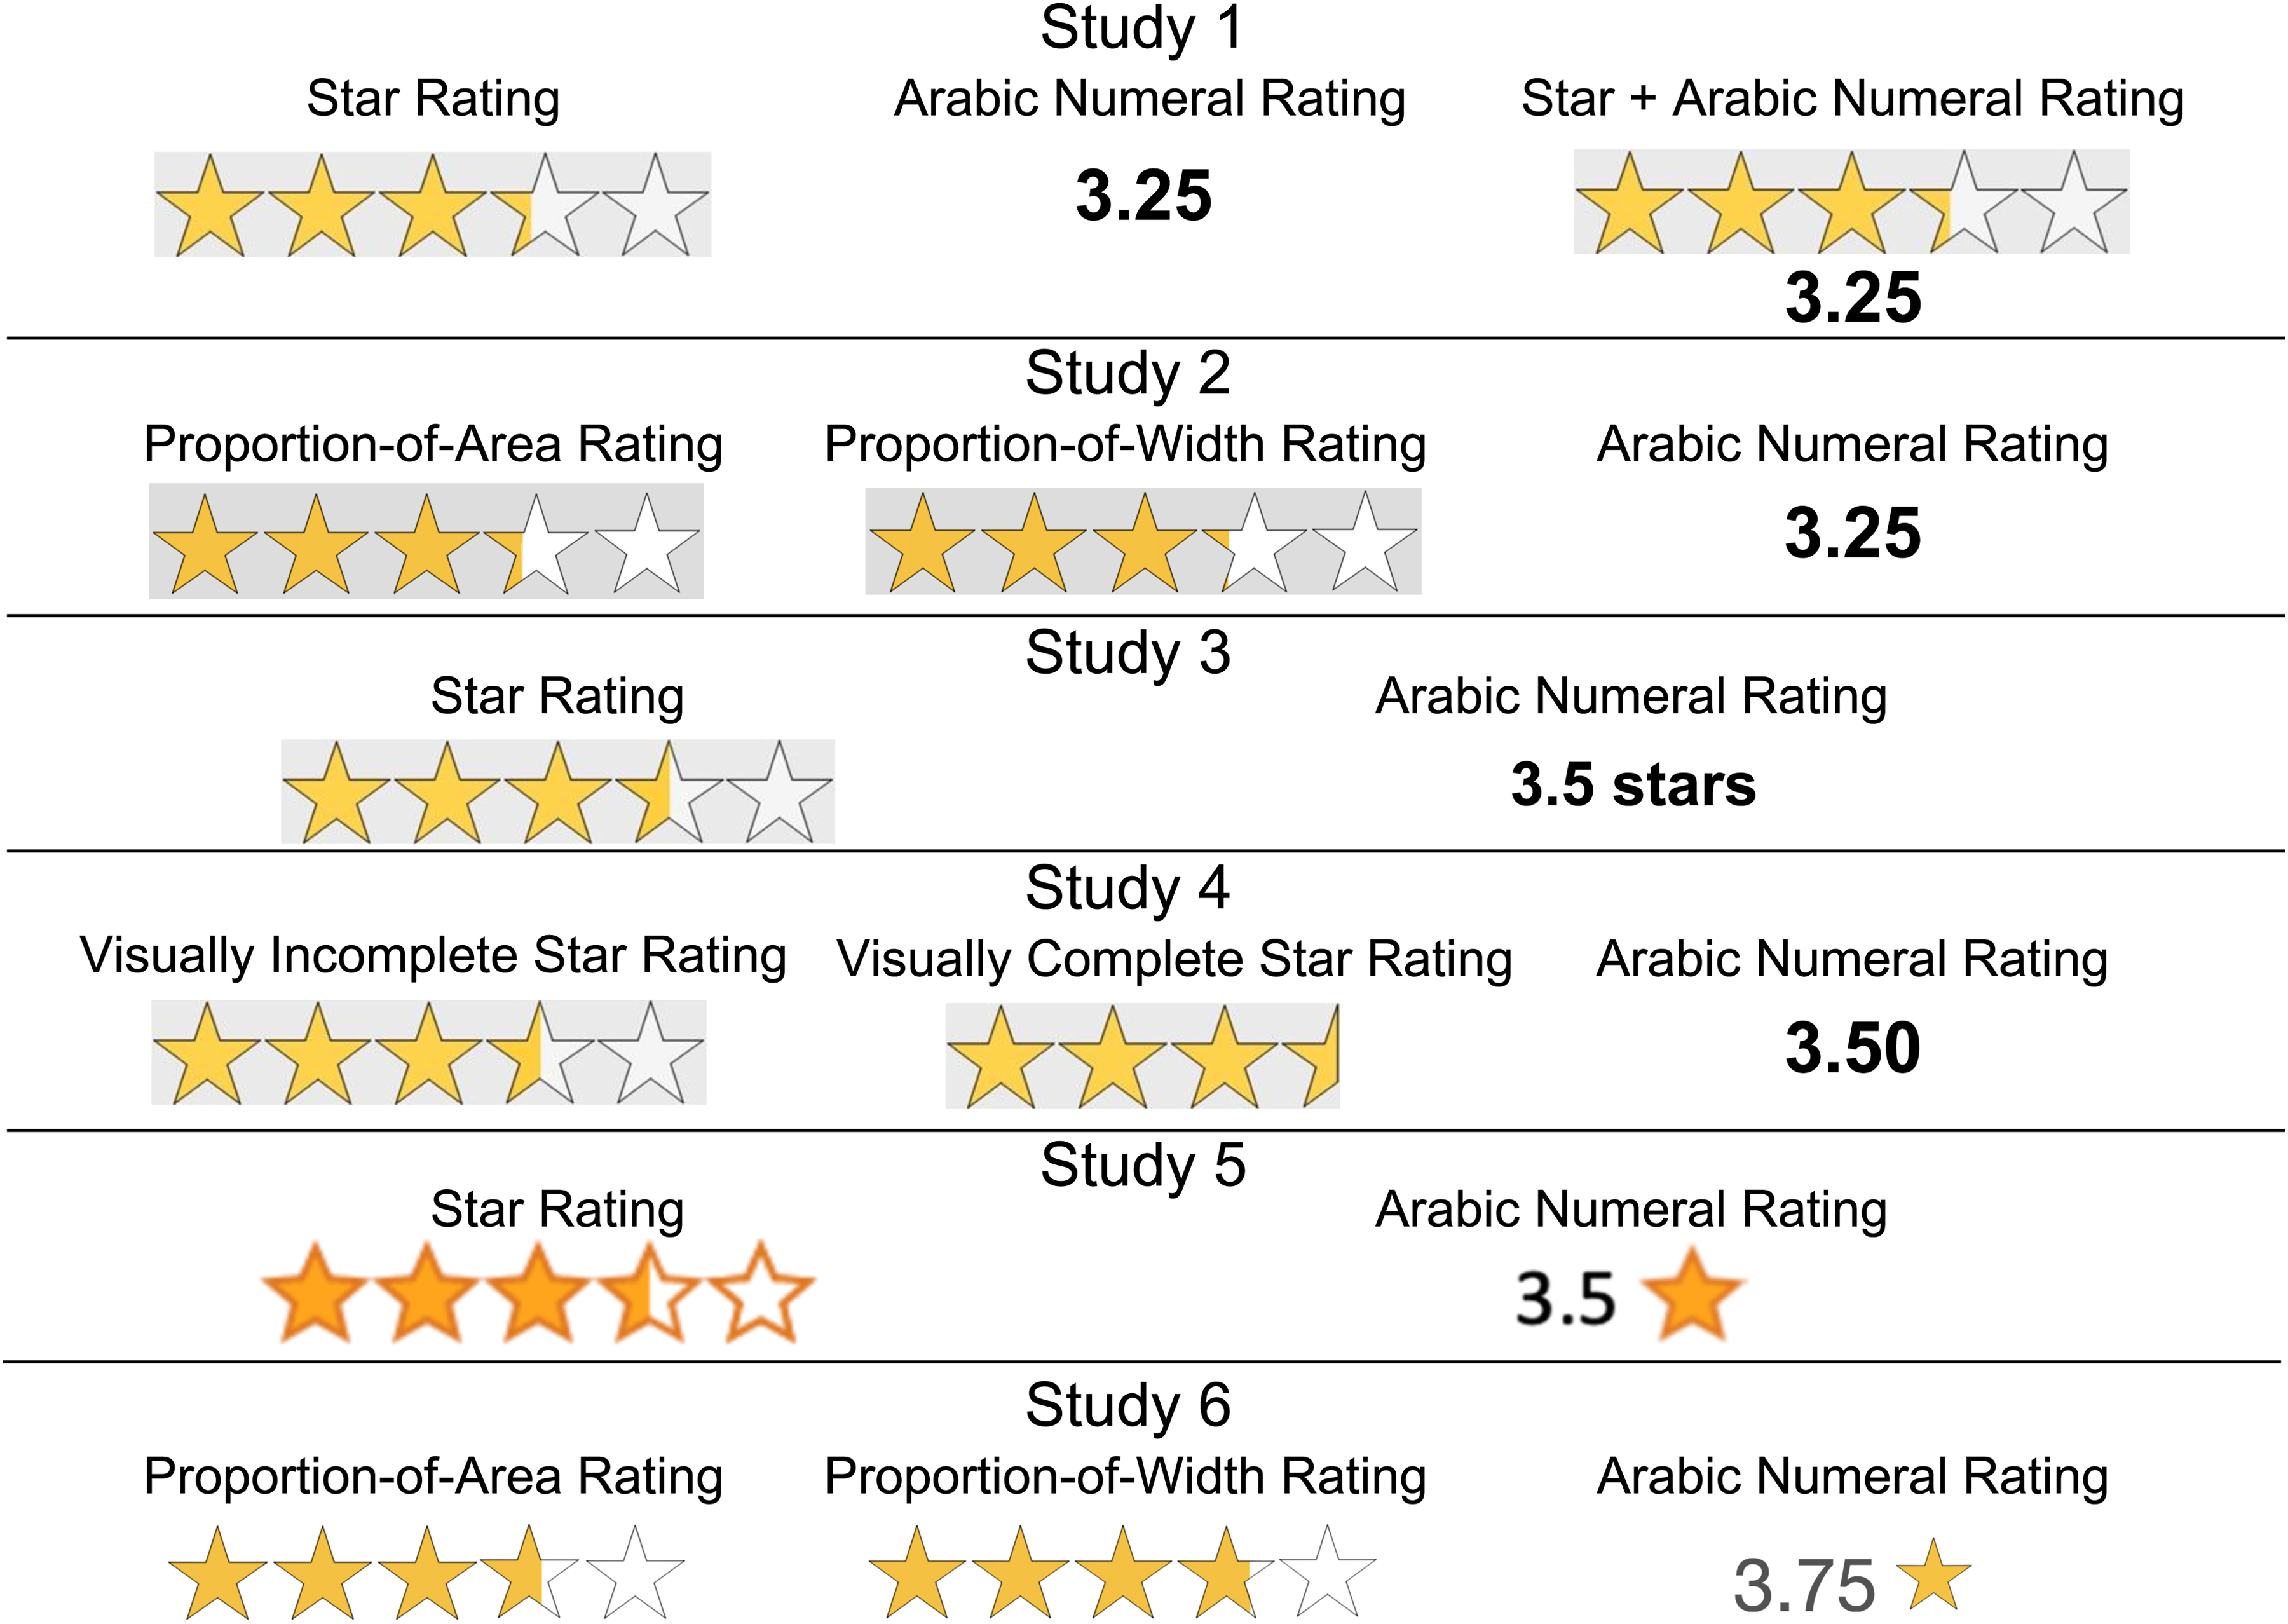
Rating Formats Used in Studies 1–6.
We conducted 12 experiments (six of which are detailed in the Web Appendix) to test our predictions. All studies were preregistered, and the materials, surveys, raw data, and R code used in the experiments are publicly accessible online (https://osf.io/wq7hr/).
Study 1: Accuracy of Rating Perceptions
Study 1 was designed to investigate the accuracy of star ratings and Arabic numeral ratings. For this study, we employed a number line estimation task, commonly used in numerical cognition research to examine intuitive magnitude judgments. The number line task is a widely accepted method to measure the accuracy of people's intuitive magnitude judgments (Booth and Siegler 2008; Dehaene et al. 2008; Schley and Peters 2014; Siegler and Opfer 2003). We adapted this task to test our hypotheses. Participants were shown several product ratings and asked to indicate their perceived magnitude on a number line. The ratings were presented as either stars, Arabic numerals, or both stars and Arabic numerals (see Study 1 stimuli in Figure 4). The number line task enabled us to test whether each rating is underestimated or overestimated on the number line. This study was preregistered at OSF (https://osf.io/rmjub).
Participants and Procedure
We recruited 624 participants and analyzed data from 616 participants (44.5% female, 54.5% male, 1% nonbinary; Mage = 41 years) who were part of a U.S. standard sample from Prolific. For more detailed information regarding data exclusions, see Web Appendix C. Participants were randomly assigned to one of three conditions that varied in the type of symbols used: star ratings, Arabic numeral ratings, or both star and Arabic numeral ratings. All participants estimated the position of several ratings on an unmarked horizontal line with endpoints 1 and 5. Before the number line task was administered, participants were put through a calibration phase in which they were trained to correctly identify the position of three numeric ratings—1, 3, and 5—on a marked horizontal line with markers at 1, 2, 3, 4, and 5 (see Web Appendix C for details). The numeric ratings in the calibration phase and in the number line task were shown using rating symbols based on the assigned rating symbols condition; participants in the star rating condition saw the ratings represented as stars, those in the Arabic numeral condition saw the ratings as Arabic numerals, and those in the third condition saw both star and Arabic numeral ratings (see Study 1 stimuli in Figure 4).
In the number line task, participants were presented with 17 numeric ratings from 1 to 5 in increments of .25, one at a time. The order of the 17 judgments was randomized for each participant. They were asked to estimate the position of each rating on an unmarked horizontal line with endpoints 1 and 5 (see Web Appendix C for visuals). The ratings included five whole numbers (1.00, 2.00, 3.00, 4.00, 5.00), four fractional numbers with quarters (1.25, 2.25, 3.25, 4.25), four fractional numbers with halves (1.50, 2.50, 3.50, 4.50), and four fractional numbers with three-fourths (1.75, 2.75, 3.75, 4.75). For each judgment, participants indicated their estimate of the rating's magnitude on the unmarked horizontal line with 1 and 5 as its ends. At the end of the study, all participants were asked standard demographic questions such as age, gender, income, and education level.
Analyses and Results
Before we report specific analyses, it might be instructive to look at the graphical depiction of means of perceived magnitudes across the three conditions. Figure 5, Panel A, depicts the perceived magnitudes of the 17 stimuli in the three conditions.
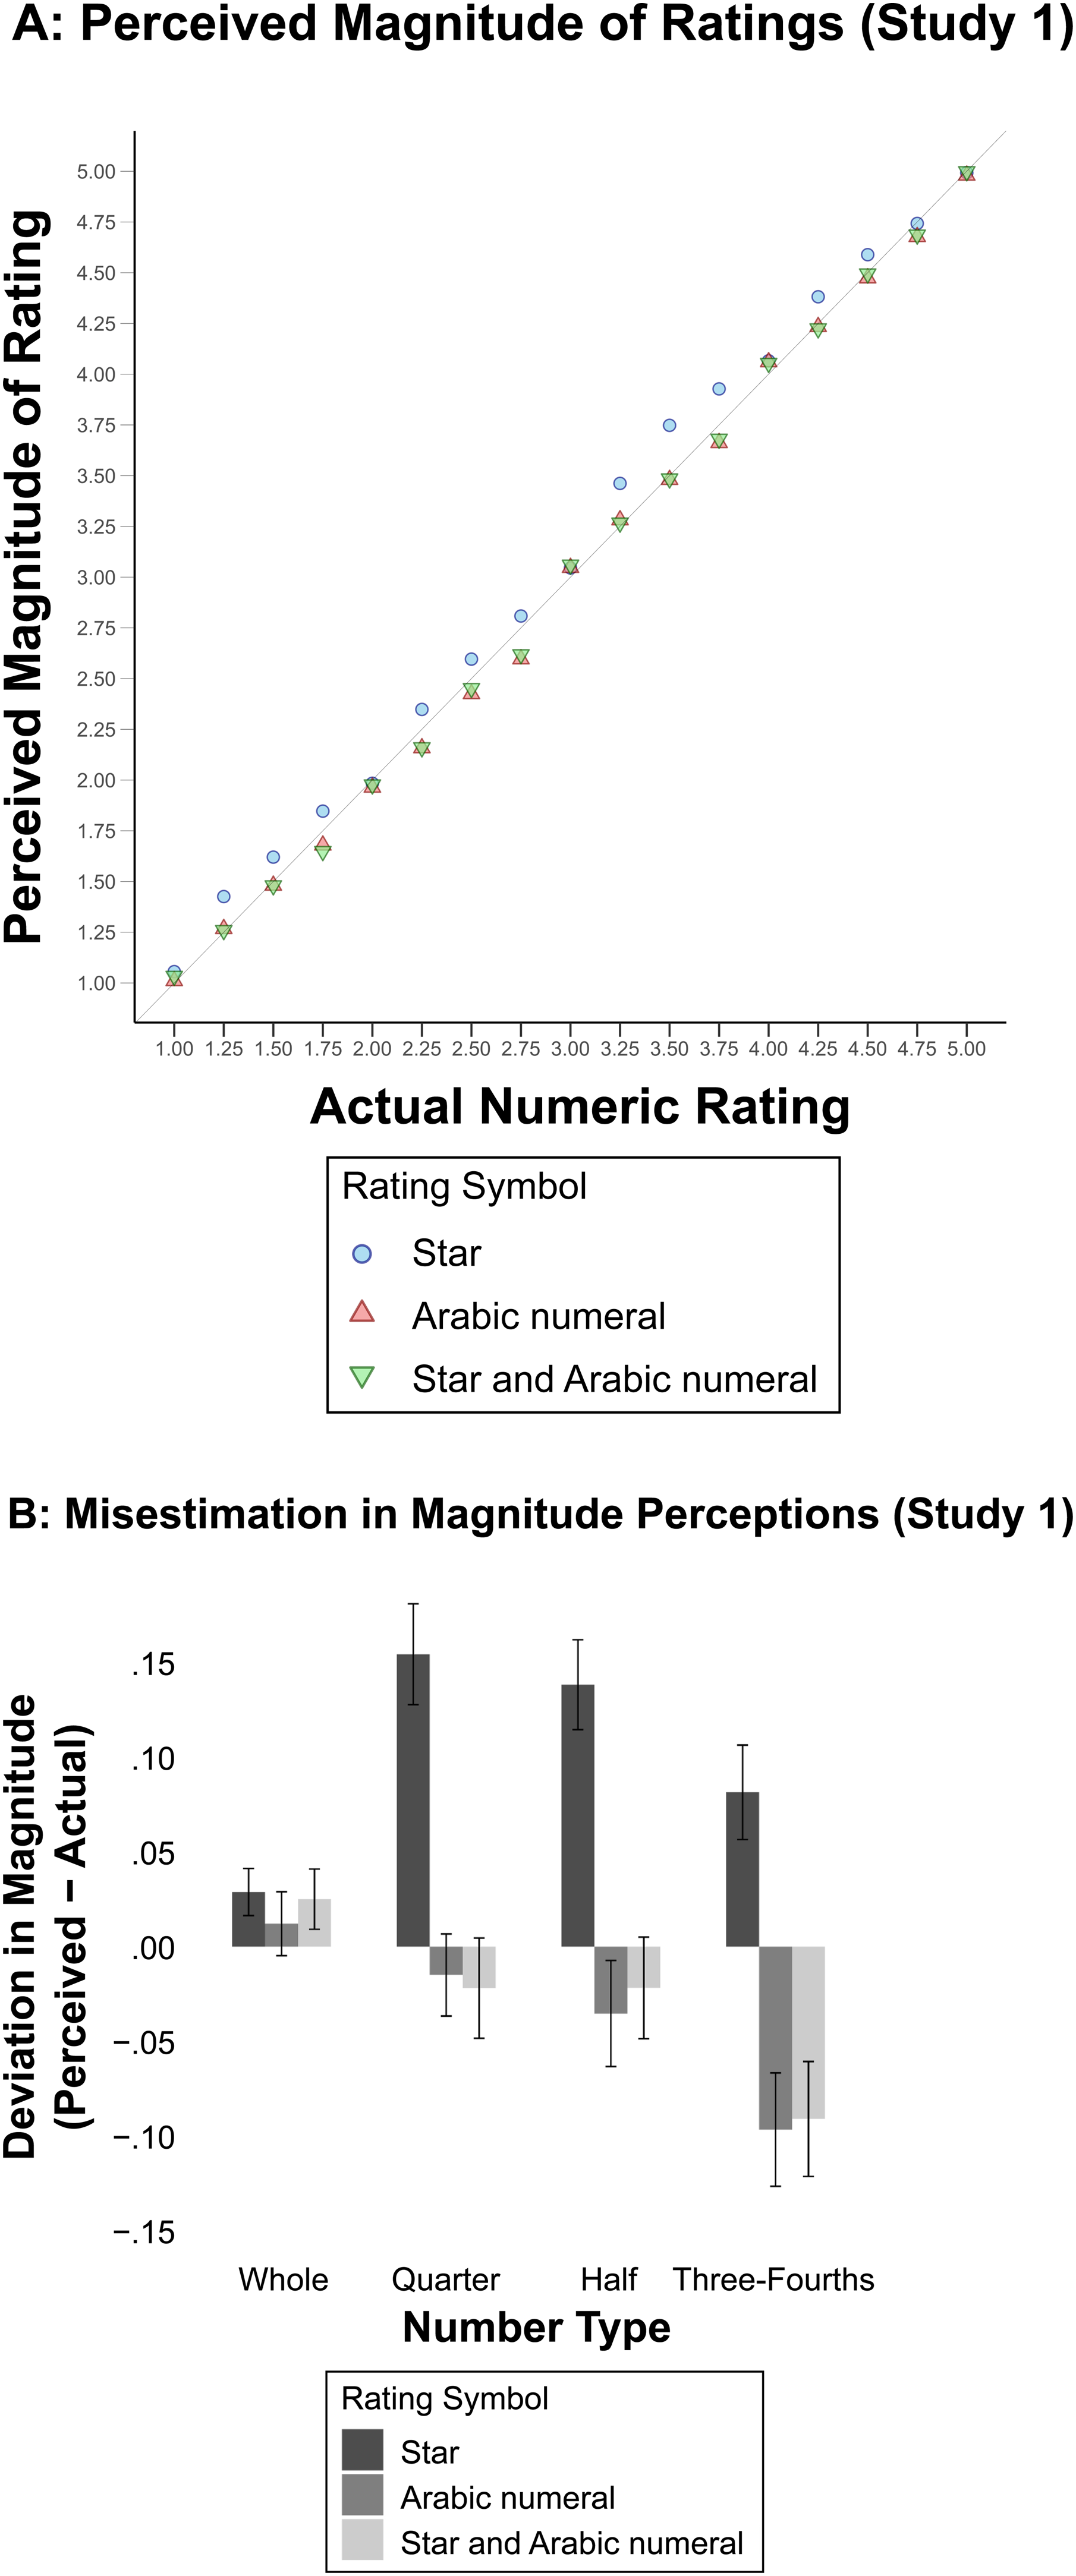
Study 1 Results.
Three patterns can be observed in this figure. First, participants overestimated the magnitude of fractional star ratings and underestimated the magnitude of fractional Arabic numeral ratings. Second, participants’ responses to the combination of star and Arabic numerals were almost identical to their responses to Arabic numerals only, suggesting that Arabic numerals play a dominant role when both Arabic numerals and star symbols are present.
Third, the misestimation was more pronounced for fractional ratings than for whole number ratings.
3
To assess the accuracy of rating perceptions, we calculated the deviation between perceived magnitude and actual magnitude of the ratings (i.e., perceived magnitude minus actual magnitude) for each response. Then we averaged the deviations for whole numbers (1.00, 2.00, etc.), fractional numbers with quarters (1.25, 2.25, etc.), fractional numbers with halves (1.50, 2.50, etc.), and fractional numbers with three-fourths (1.75, 2.75, etc.). These average deviations were analyzed using a 3 × 4 mixed factorial ANOVA with rating symbol type (star, Arabic numeral, both star and Arabic numeral) as the between-subjects factor and number type (whole, quarter, half, and three-fourths) as the within-subjects factor.
4
The main effect of rating symbol was significant (F(2, 613) = 52.76, p < .0001,
Figure 5, Panel B, displays the deviation of subjective magnitude perception from the actual magnitude of the ratings for these number types. Participants displayed a tendency to overestimate ratings shown as fractional stars, whereas they underestimated ratings presented as fractional Arabic numerals on average 5 (MStar = +.12, SD = .30; MArabicNumeral = −.05, SD = .30), providing support for H1a and H1b. Participants also underestimated ratings presented using both star and Arabic numeral symbols (MStar + ArabicNumeral = −.04, SD = .29); refer to Table 1 for the corresponding F and p values of misestimations across rating symbols and number types.
Accuracy of Rating Perceptions (Perceived Magnitude Minus Actual Magnitude).
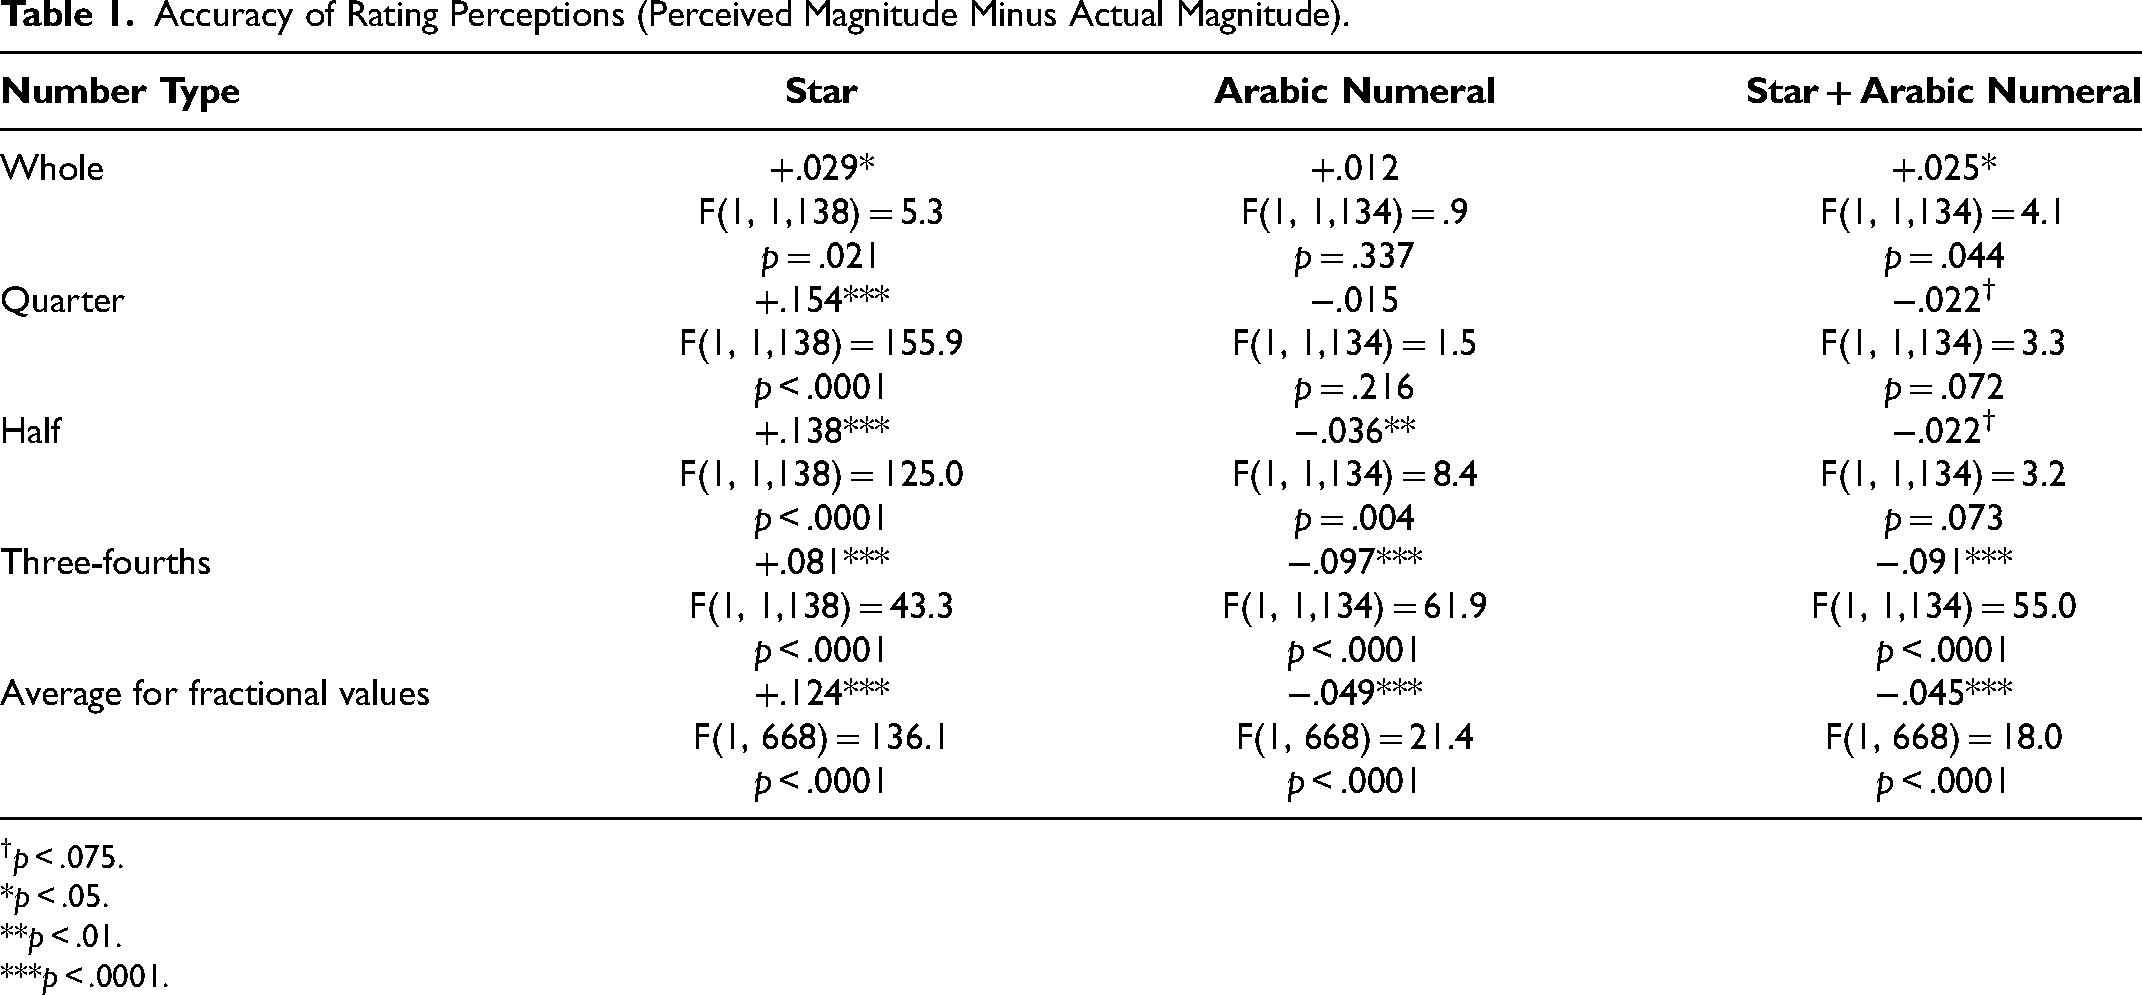
p < .075. *p < .05. **p < .01. ***p < .0001.
Supporting H2, the overestimation in fractional stars was reduced when whole numbers were used
6
(MFractionalStars = +.12, SD = .30; MWholeStars = +.03, SD = .18; F(1, 1839) = 119.33, p < .0001,
Next, we tested H3, which posits that the size of misestimation of fractional ratings will be proportional to the distance between the anchor and the fractional rating. Given that the distance between the anchor and rating is larger for quarter star ratings (e.g., 3.25) than for three-fourths star ratings (e.g., 3.75), we observed a more pronounced overestimation for quarter stars (M.25Stars = +.15, SD = .29) compared with three-fourths stars (M.75Stars = +.08, SD = .31; F(1, 1,839) = 45.95, p < .0001,
Finally, we looked at the effect of using star and Arabic numerals combined. There was no significant difference in participants’ responses in the Arabic numeral and the combined rating conditions (MArabicNumeral = −.03, SD = .27; MStar + ArabicNumeral = −.02, SD = .27) for any of the four number types (F(4, 1,132) = .64, p = .636,
We also evaluated participants’ response times for each magnitude judgment task. We averaged the response times for each number type and then analyzed the logarithmically transformed average response times using the same 3 × 4 mixed factorial ANOVA as in the magnitude judgment analysis. The results revealed that the type of rating symbol used—be it star symbols, Arabic numerals, or a combination thereof—did not significantly influence the response times (F(2, 613) = .86, p = .43,
Discussion
Results from this study advance the extant literature in several ways. First, we find that both star ratings and Arabic numerals are misestimated. Fractional star symbols are overestimated whereas Arabic numerals are underestimated. Furthermore, as we can see from Table 1, contrary to what is suggested in the published literature (e.g., Abell, Morgan, and Romero 2024), the biasing effect of visual completion seems to be stronger than that of left-digit anchoring.
The pattern of results also offers insights into the mechanisms underlying such misestimations. Overestimation in star symbols was stronger for quarter ratings than for three-fourths ratings. Conversely, the underestimation in Arabic numerals was stronger for three-fourths ratings than for quarter ratings. This shows that the further the anchor is from the actual number, the greater the deviation from the actual rating is. Thus, these results support our rating symbol contingent anchoring hypothesis.
Furthermore, Study 1 revealed that when participants made magnitude judgments using both star symbols and Arabic numerals, their evaluations aligned closely with those using only Arabic numerals. This finding may highlight the influential role of Arabic numerals in the encoding process. It appears that in contexts where both star ratings and Arabic numerals are presented, the latter may inadvertently dominate the judgment process. This phenomenon likely stems from the ubiquitous use of Arabic numerals in denoting numerical quantities, which renders them more familiar and thus more readily processed by the brain for making numerical judgments.
Importantly, this study also rules out the alternative hypothesis that participants rounded fractional star ratings to the nearest whole number due to cognitive shortcuts (e.g., Jia, Wan, and Zheng 2023). If rounding were the explanation, we would expect an underestimation of quarter ratings due to rounding down and an overestimation of three-fourths ratings because of rounding up. However, our results showed overestimation of both quarter and three-fourths star ratings, consistent with our theory of contingent anchoring. These findings provide further evidence for the influence of initial anchors on subsequent judgments, rather than simple rounding, as an explanation for the observed effects (see Web Appendix C for a detailed discussion of alternate accounts).
Supplementary Studies
In Study 1, we used stars as graphical symbols, given their widespread use across rating platforms. However, this raised the question of whether the observed overestimation effect might also apply to other graphical representations. Our theory suggests that overestimation occurs due to visual completion of partially filled symbols, implying that incomplete circles or squares should similarly be overestimated. To test the generalizability of our findings, we conducted two follow-up studies with circles (Supplementary Study 1) and squares (Supplementary Study 2), using the same methodology as Study 1. Detailed results are provided in Web Appendix D.
Figure 6 summarizes the key findings. Both studies revealed a similar overestimation effect, reinforcing that this perceptual bias applies across shapes. Particularly in Supplementary Study 2, incomplete rectangular shapes also led to visual completion-driven overestimation, challenging Jia, Wan, and Zheng's (2023) theorizing, which predicts that rectangular shapes would not result in misestimations. This consistency across symbols strengthens our proposed visual completion mechanism and calls into question the notion of shape-specific heterogeneity suggested by Jia, Wan, and Zheng. Overall, these supplementary studies support our hypothesis that overestimation effects extend beyond stars to other shapes.
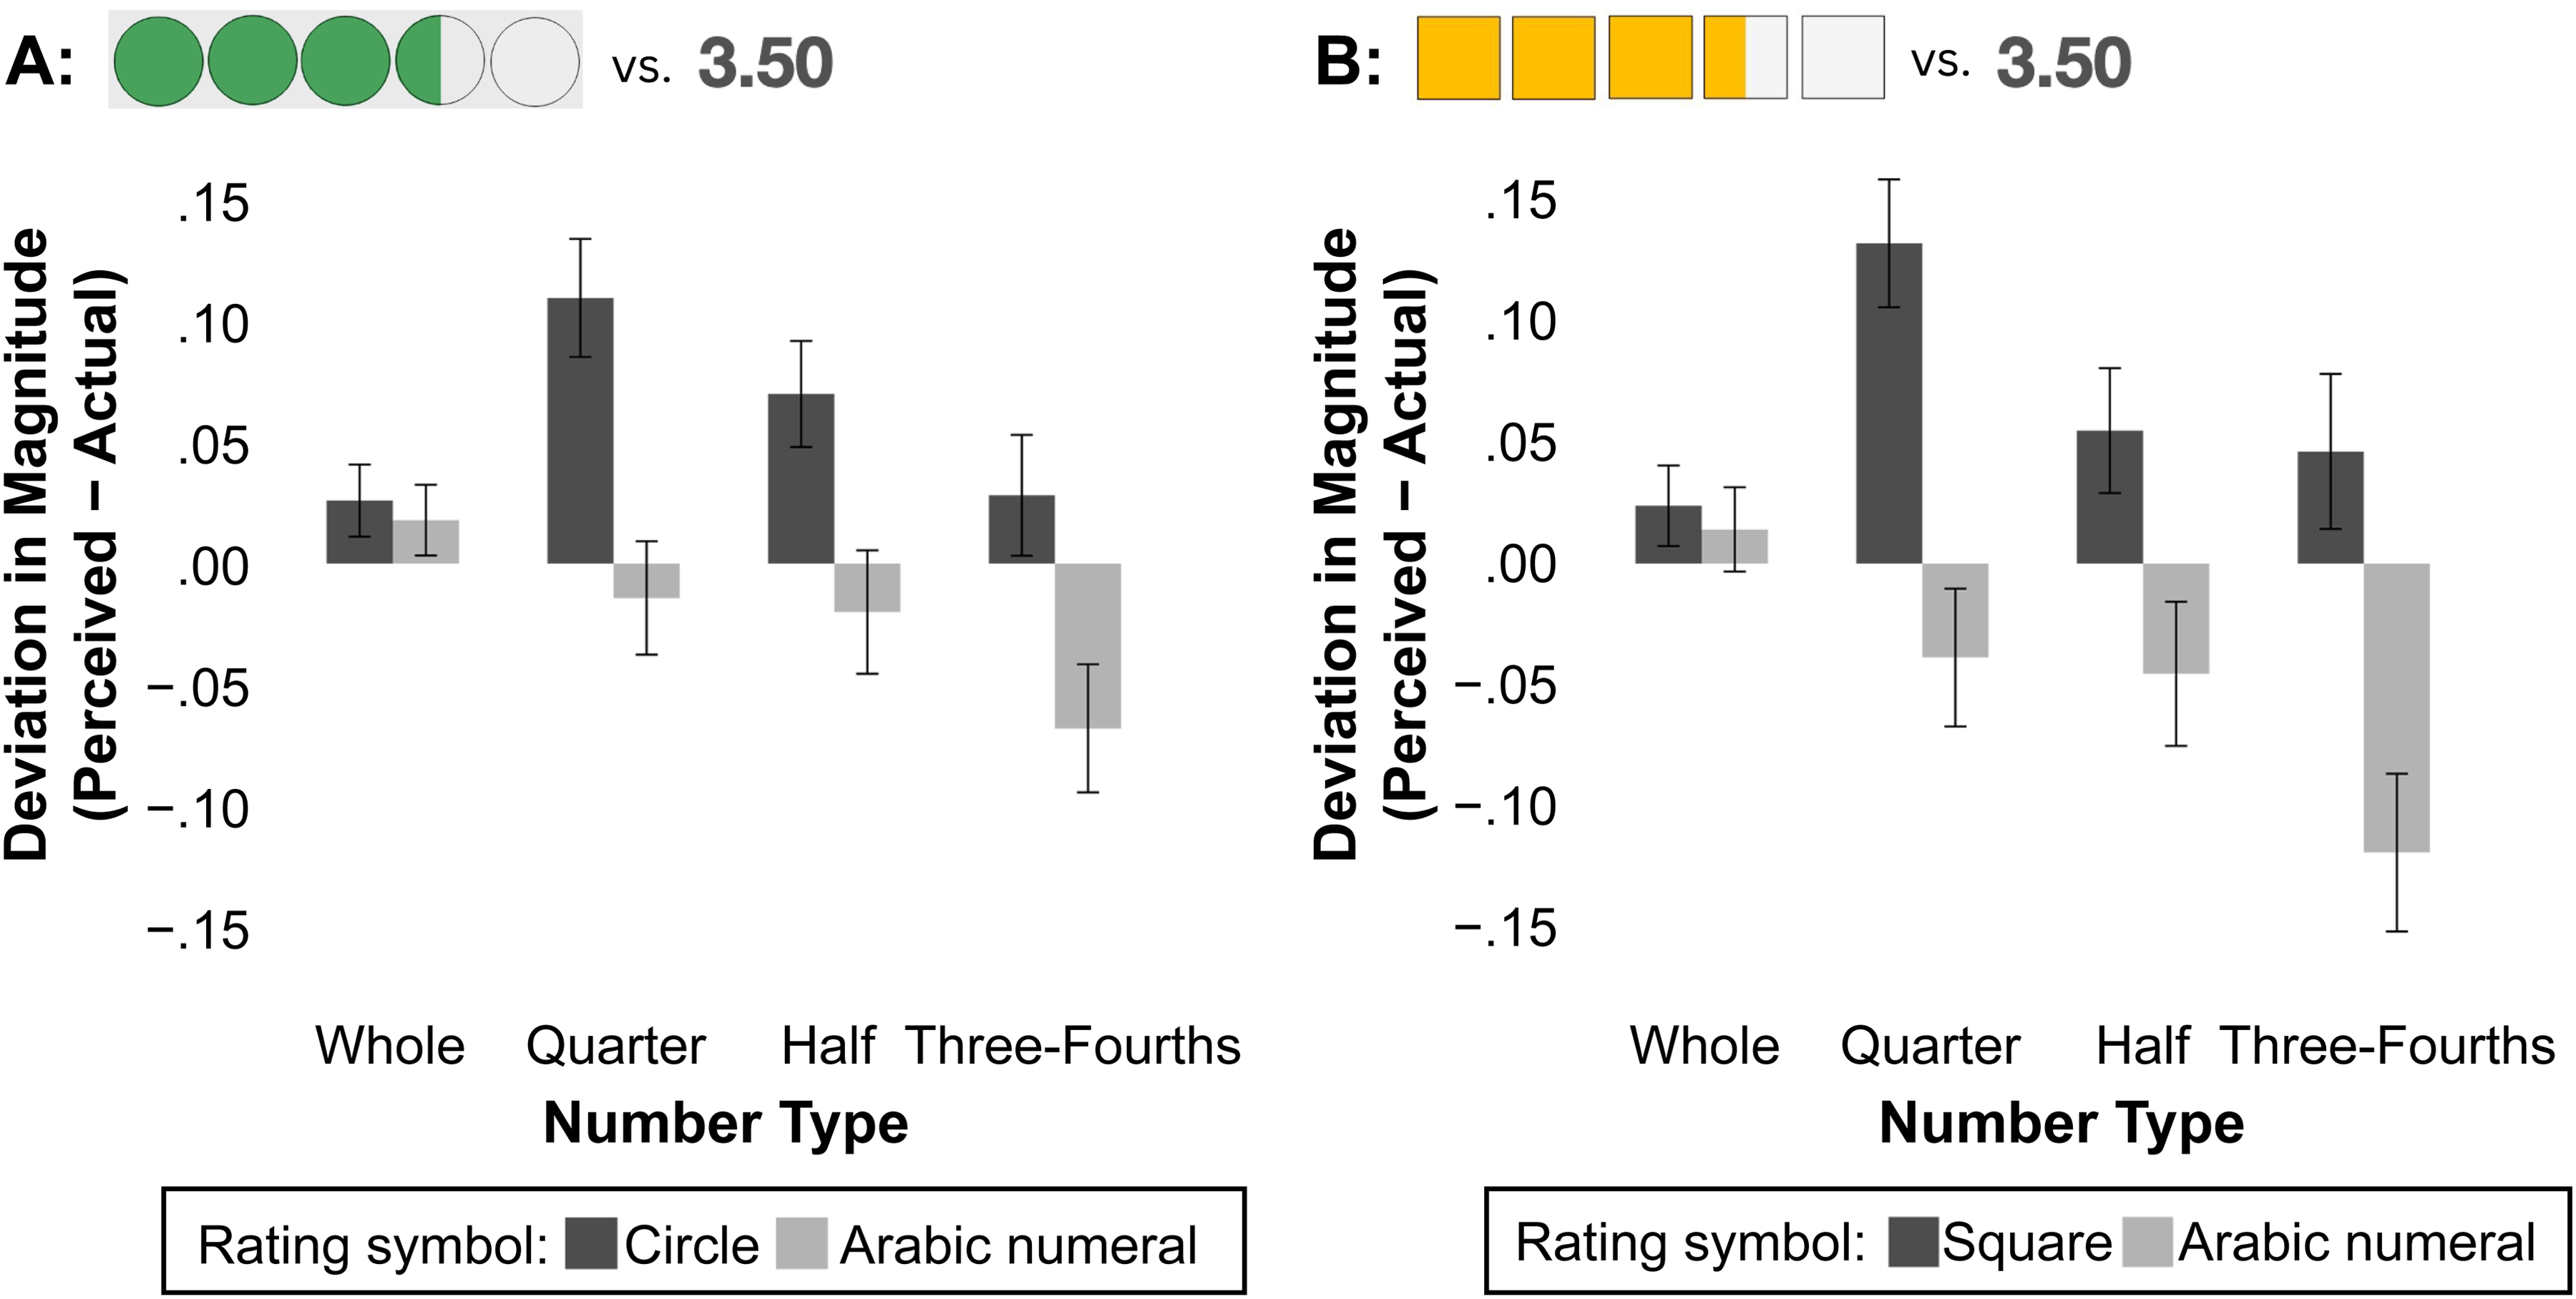
Misestimations in Magnitude Perceptions: Circles, Squares, and Arabic Numerals.
Study 2: Star Fill Method
This study investigates how star fill method influences the accuracy of rating magnitude perceptions. As noted previously, there are two methods to fill fractional stars: the proportion-of-area method and the proportion-of-width method. To visually depict a fractional rating, graphic designers typically divide a star symbol vertically into two segments: a filled left portion representing the fraction, and an empty right portion. This division can be determined using either the proportion-of-area method (the filled left portion represents the percentage of the star's total area) or the proportion-of-width method (the filled left portion represents the percentage of the star's width).
Due to the nonrectangular shape of stars, these two methods produce visually distinct representations for the same fractional values. For fractions less than .5, the proportion-of-width method results in less filling (i.e., less ink), while for fractions above .5, the proportion-of-width method shows more filling; see Figure 3. Importantly, even though researchers from the field of data visualization (Bergstrom and West 2016; Tufte 2001) suggest that the proportion-of-area method is more representative of the magnitude than the proportion-of-width method because the latter method violates the “principle of proportional ink,” the extant research has not compared how these two methods influence magnitude perceptions. Thus, our main aim in this study is to examine how the star fill method affects consumer perception of rating magnitudes. Additionally, we sought to explain why some of our findings differ from those reported by Abell, Morgan, and Romero (2024) and Jia, Wan, and Zheng (2023); see Figure W3 in Web Appendix B for a visual illustration of the discrepant findings. Both of these teams of researchers exclusively used the proportion-of-width method to depict fractional stars, which raises the possibility that their findings might not generalize to stars created using the proportion-of-area method. This study was preregistered at OSF (https://osf.io/arzm7).
Participants and Procedure
We recruited 677 participants and analyzed data from 665 participants (48.7% female, 49.3% male, 2% nonbinary; Mage = 38 years) drawn from a U.S. standard sample via Prolific. Detailed information on data exclusions is provided in Web Appendix C. Participants were randomly assigned to one of three conditions, each featuring different symbol types: proportion-of-area star ratings, proportion-of-width star ratings, or Arabic numeral ratings. We used the same paradigm as in the first study, which included a calibration phase followed by the number line task for 17 numerical quantities, with the only exception that we replaced the “both stars and Arabic numerals” condition with a new condition in which we used stars created using the proportion-of-width approach (see Study 2 stimuli in Figure 4).
Analyses and Results
As in the previous study, to assess the accuracy, we calculated the deviation between perceived magnitude and actual magnitude of the ratings (i.e., perceived magnitude minus actual magnitude). We averaged the deviations for whole numbers (1.00, 2.00, etc.), fractional numbers with quarters (1.25, 2.25, etc.), fractional numbers with halves (1.50, 2.50, etc.), and fractional numbers with three-fourths (1.75, 2.75, etc.) to examine their average deviations. These average deviations were analyzed using a 3 × 4 mixed factorial ANOVA with rating symbol type (proportion-of-area star, proportion-of-width star, and Arabic numeral) as the between-subjects factor and number type (whole, quarter, half, and three-fourths) as the within-subjects factor.
The main effect of rating symbol was significant (F(2, 662) = 49.90, p < .0001,
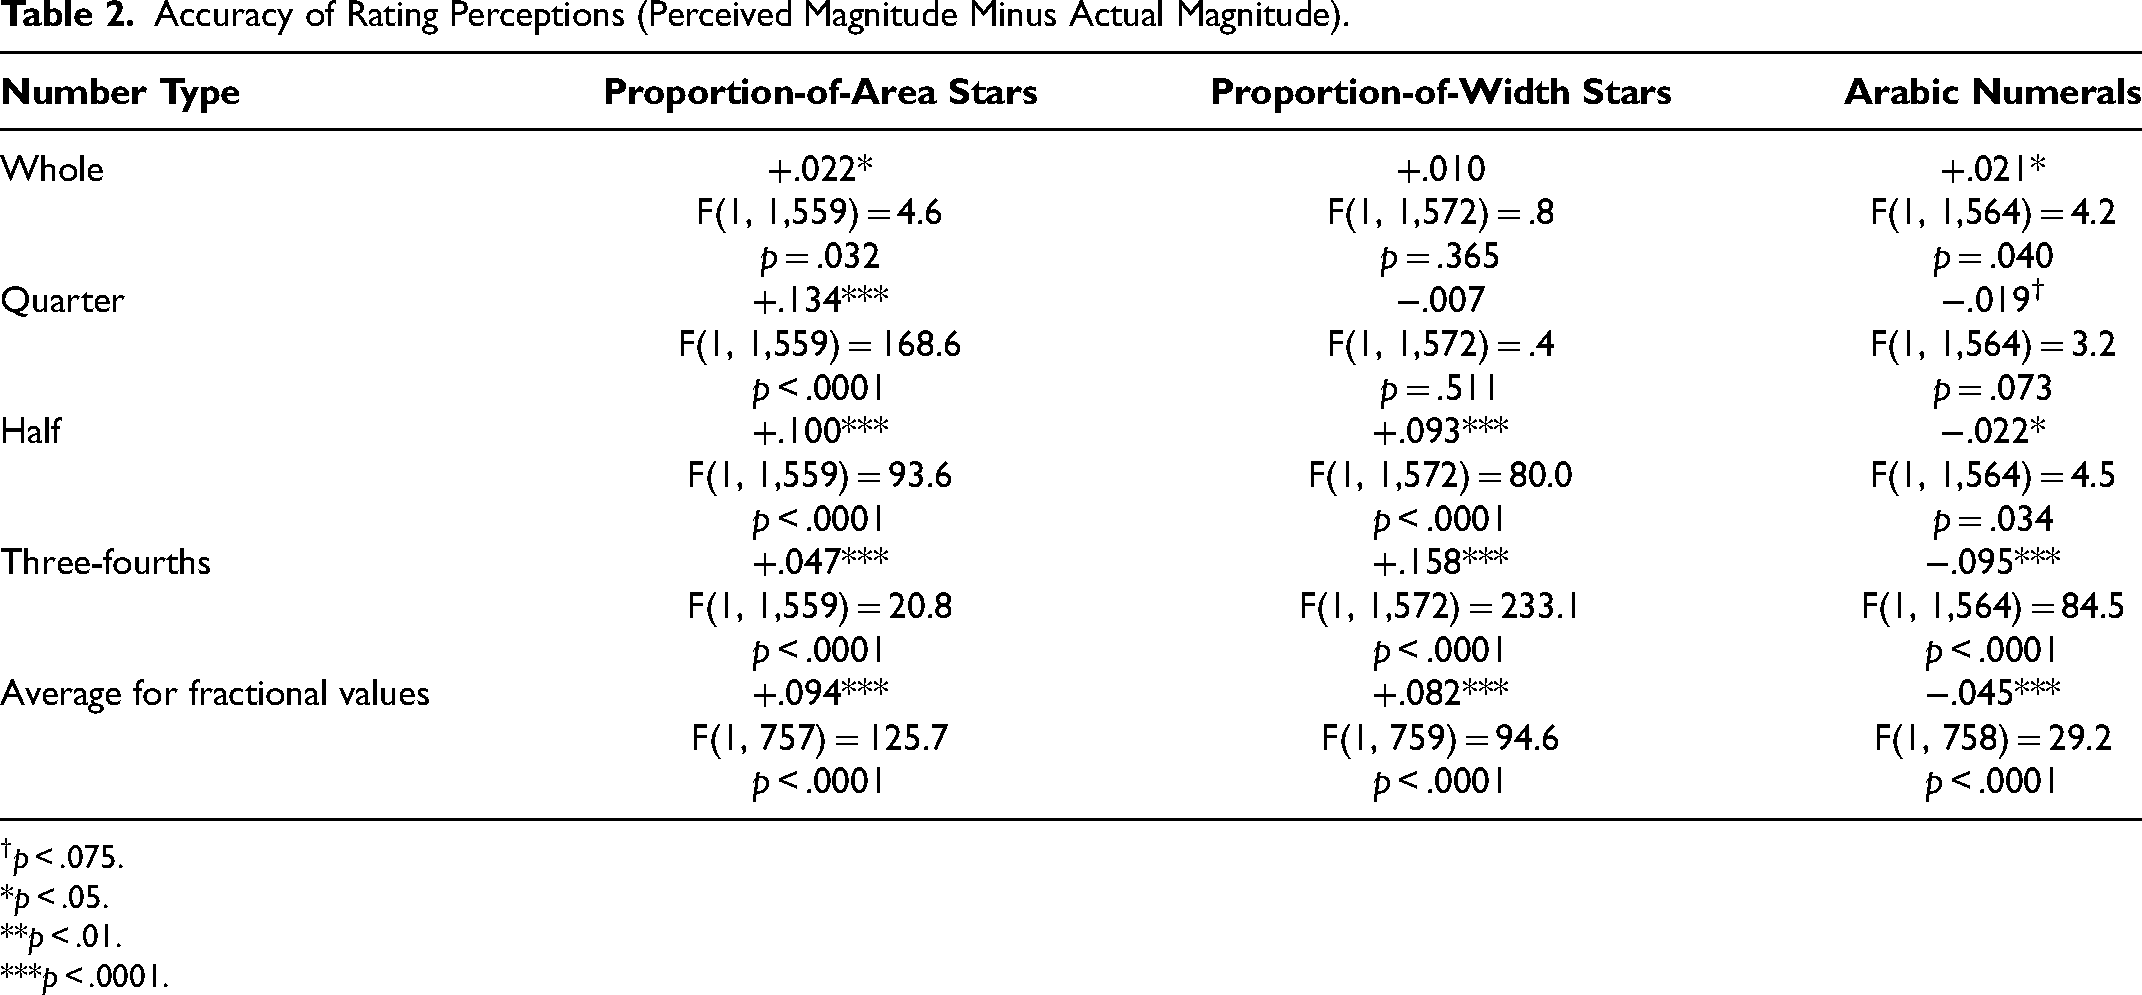
Figure 7 illustrates the deviation between subjective magnitude perception and the actual magnitude of ratings across different number types. Participants tended to overestimate ratings that were presented as fractional proportion-of-area stars (MProportion-of-Area-Star = +.09, SD = .30), while they underestimated ratings shown as fractional Arabic numerals (MArabicNumeral = −.05, SD = .30). Refer to Table 2 for the corresponding F and p values, as well as the average deviations across rating symbols and number types. Overall, the pattern of results for proportion-of-area stars and Arabic numerals across all number types nicely replicate those observed in Study 1 (see Web Appendix C for additional analysis). Therefore, we will next focus on the effect of fill type by comparing proportion-of-width stars with proportion-of-area stars.
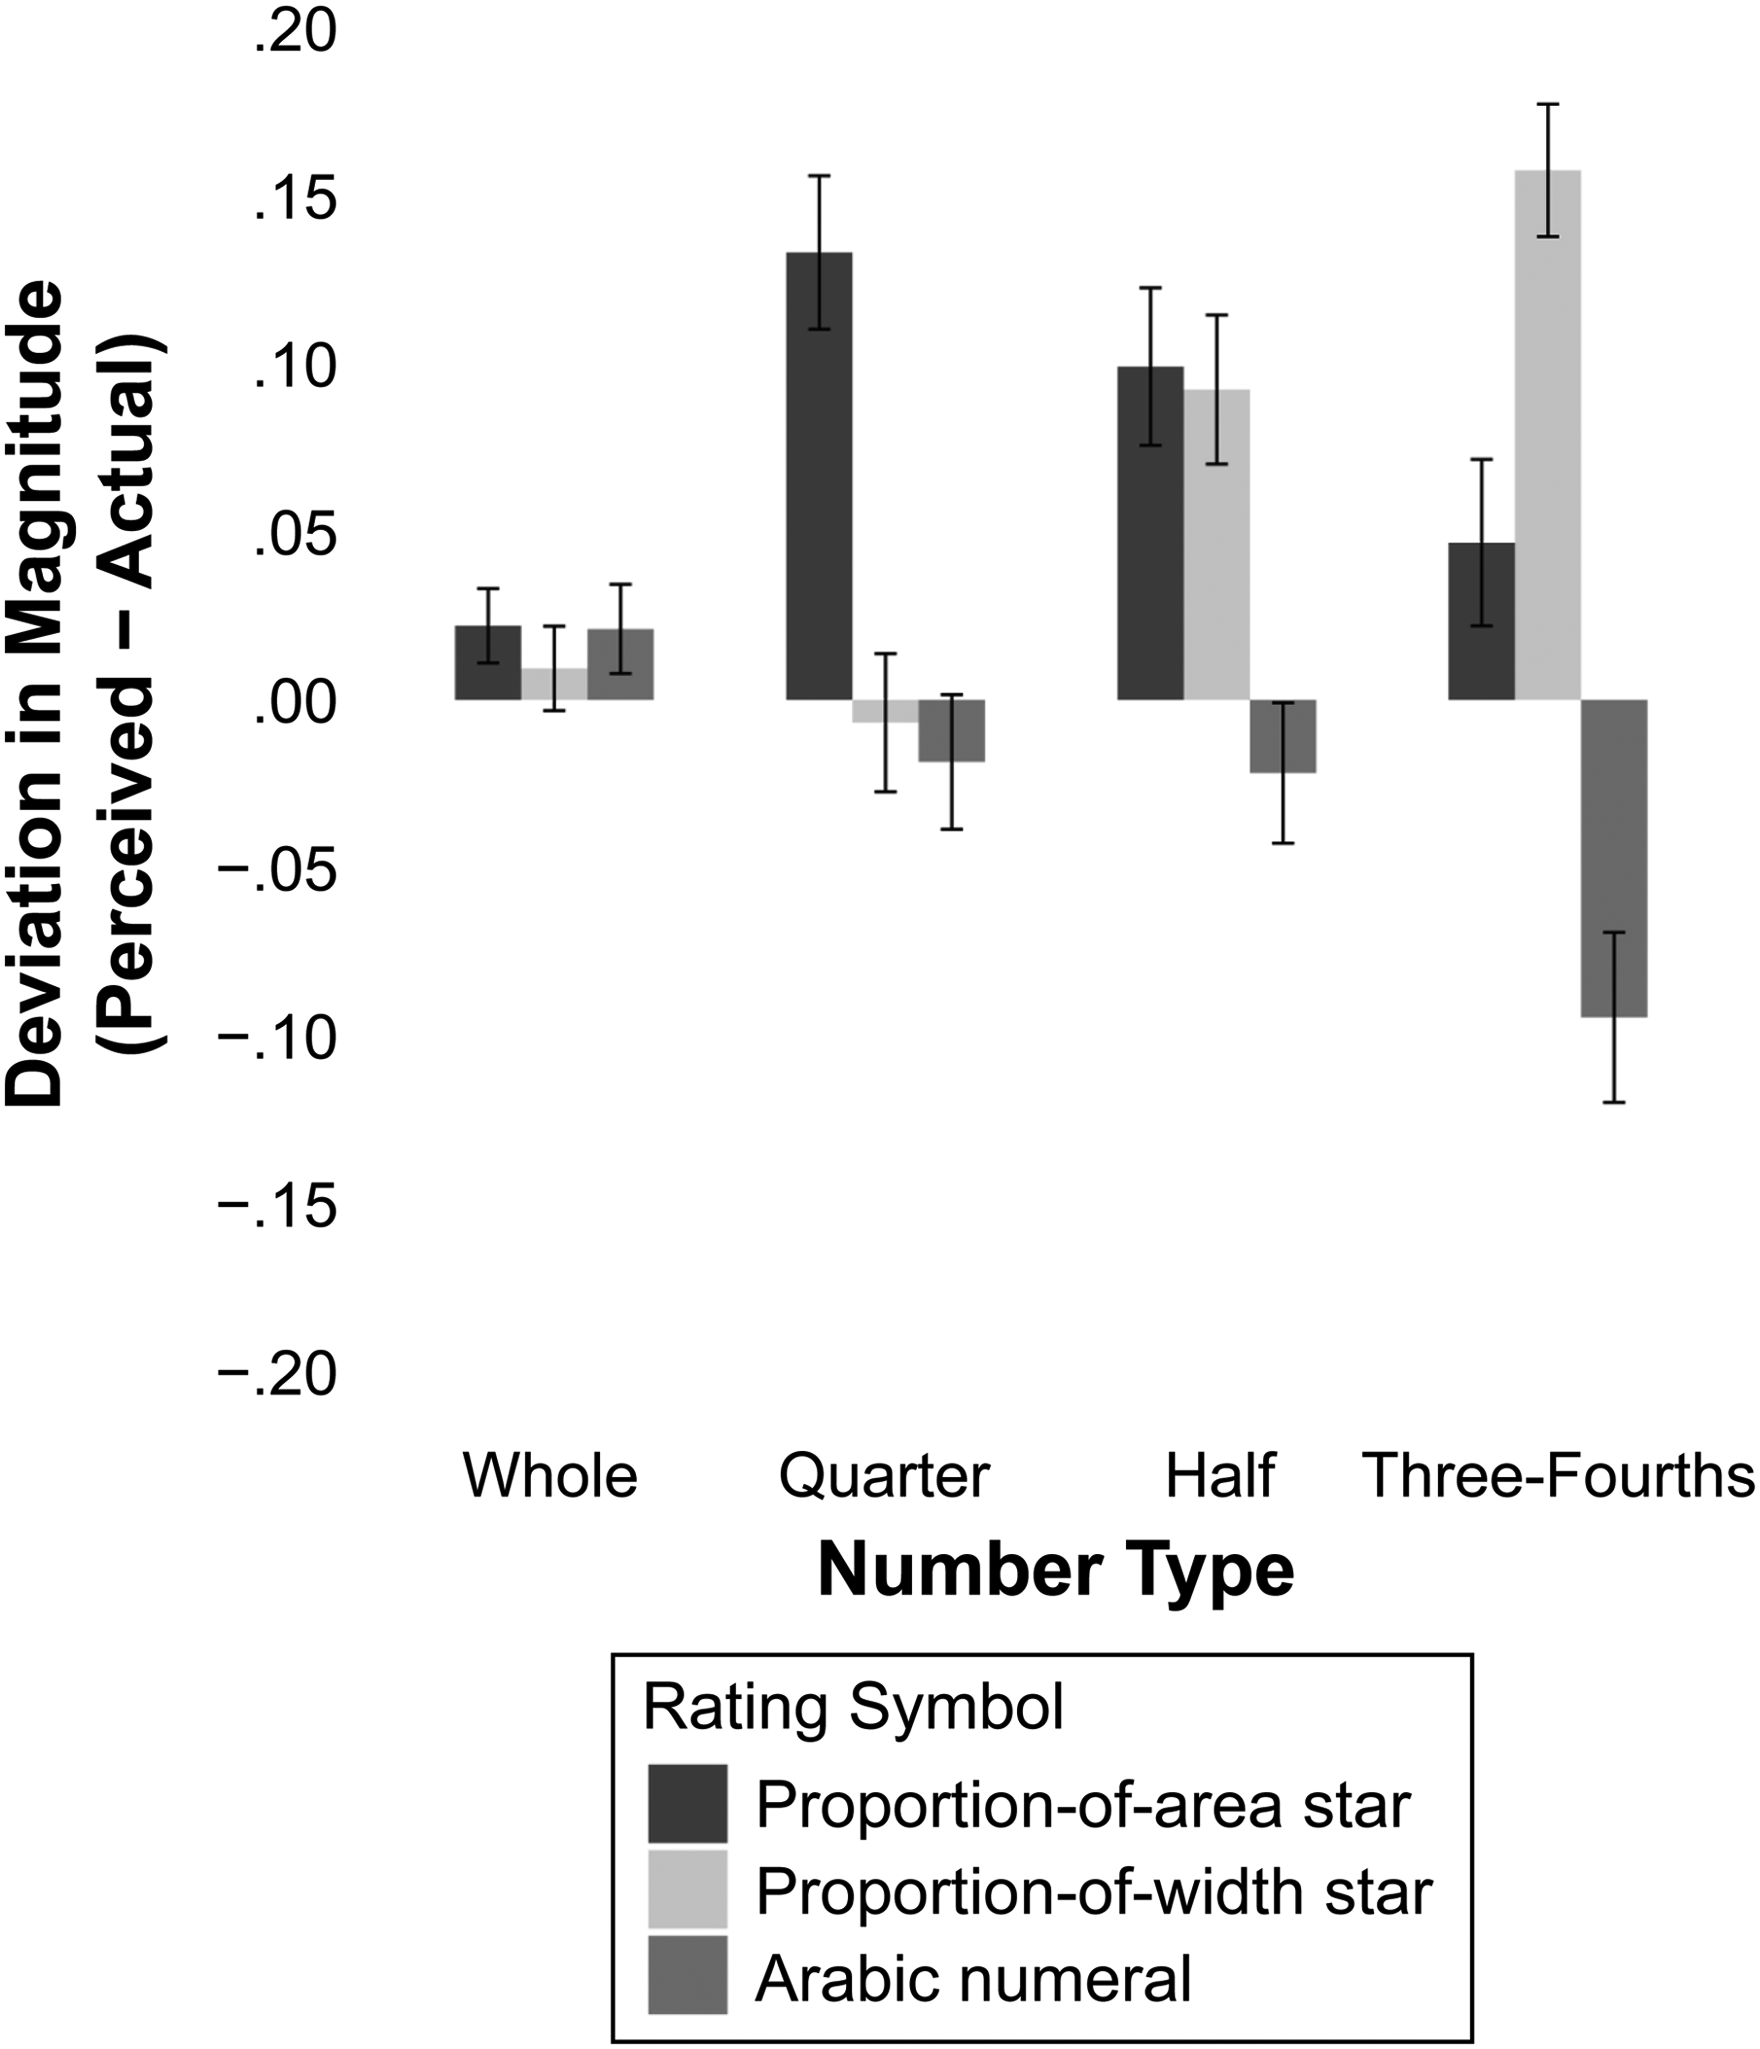
Misestimation in Magnitude Perceptions (Study 2).
Accuracy of Rating Perceptions (Perceived Magnitude Minus Actual Magnitude).
p < .075. *p < .05. **p < .01. ***p < .0001.
Proportion-of-width versus proportion-of-area stars
As depicted in Figure 3, whole stars and half stars are identical for both fill methods. Consequently, for whole-star ratings (F(1, 1,565) = .76, p = .383,
However, for quarter stars, proportion-of-area stars were relatively overestimated, compared with proportion-of-width stars (F(1, 1,565) = 92.49, p < .0001,
These patterns mirror the results reported by Jia, Wan, and Zheng (2023), while offering a different interpretation. Jia, Wan, and Zheng compare proportion-of-width stars with bars. Because bars are rectangular, both fill methods (proportion-of-width and proportion-of-area) yield identical images. Thus, their study effectively juxtaposed two graphical symbols distinguished by their method of fill—one with proportion-of-width and the other with proportion-of-area filling. Notably, for fractions less than .5, proportion-of-width filled stars had less fill than proportion-of-area filled bars, whereas for fractions greater than .5, proportion-of-width filled stars displayed more fill. Jia, Wan, and Zheng's results would likely have been different if they had used proportion-of-area stars. Thus, the results in their studies can be attributed to their use of proportion-of-width stars rather than intrinsic shape differences between stars and bars. See Supplementary Study 3 in Web Appendix D for a replication of these results with different fractional values (e.g., 3.2, 3.8).
Proportion-of-width stars versus Arabic numerals
We also compared proportion-of-width stars with Arabic numerals. For whole ratings, there were no significant differences in misestimation between proportion-of-width stars and Arabic numerals (F(1, 1,565) = .65, p = .421,
These findings replicate those of Abell, Morgan, and Romero (2024), who compared proportion-of-width stars and Arabic numerals. Replicating their results, we find that fractional Arabic numerals are underestimated relative to proportion-of-width stars for fractions at or above .5, while this relative underestimation was absent for fractions below .5.
However, and importantly, our results reveal that this pattern is unique to proportion-of-width stars and does not hold for proportion-of-area stars. For fractions below .5, even when Arabic numerals are not underestimated, proportion-of-area stars are overestimated, resulting in a significant relative underestimation of Arabic numerals compared with stars. 7 This distinction is crucial, as Abell, Morgan, and Romero (2024) attribute their results solely to the left-digit bias. In contrast, our findings qualify their conclusions by identifying two distinct sources of misestimation: underestimation in Arabic numerals and overestimation in graphical symbols, with the latter dependent on the fill method. Notably, while Abell, Morgan, and Romero do not focus on the overestimation in star ratings, we find that the most egregious misestimation is due to overestimation of star ratings rather than underestimation of Arabic numerals.
Discussion
Study 2 demonstrates that the method used to fill stars significantly influences consumers’ magnitude judgments. We found that both proportion-of-area stars and proportion-of-width stars are prone to overestimation. Some researchers have argued that the magnitude of a stimulus should correspond to the amount of ink used (Bergstrom and West 2016; Tufte 2001). Since the area method adheres to this “principle of proportional ink,” we default to this fill type for the remainder of our studies. Moreover, the results of Study 2 reconcile the apparent discrepancies between our findings and those reported in prior research (Abell, Morgan, and Romero 2024; Jia, Wan, and Zheng 2023).
Study 3: Different Anchors
In Study 3, we aimed to verify a critical assumption in our theory, namely, that people tend to instinctively round up fractional star ratings and round down fractional Arabic numeral ratings, thus creating divergent anchor points that influence their subsequent judgments. To test this, we analyzed participants’ rounding tendencies for half ratings presented either as star symbols or as Arabic numerals. This study was preregistered at OSF (https://osf.io/bpqzs).
Participants and Procedure
We recruited 327 participants from the U.S.-based CloudResearch panel, of whom six were excluded from the analysis. The final sample comprised 321 participants (38.6% female, 59.2% male, 2.2% nonbinary; Mage = 39 years). In line with our preregistered exclusion criteria, we also excluded choice responses where neither the rounded-up nor rounded-down rating values were selected (n = 7). This resulted in a final dataset of 1,277 choice responses. Additional details on data exclusions and procedures are available in Web Appendix C.
Participants were randomly assigned to either the star or Arabic numeral rating symbol condition. In each condition, they were shown four half ratings (1.5, 2.5, 3.5, 4.5) in a random order, one at a time, and were asked to indicate how they would approximate these ratings to round numbers. Those in the star rating condition saw these ratings depicted using images of stars (e.g.,  ). Those in the Arabic numeral condition saw the ratings in Arabic numerals (e.g., 3.5 stars). Participants responded by picking one of the five options: “around 1 star,” “around 2 stars,” “around 3 stars,” “around 4 stars,” and “around 5 stars.” They were informed that there were no right or wrong answers and that they should answer based on their instinct. Note that these response options required participants to round the fractional ratings up or down. We chose ratings ending in halves (e.g., 3.5) as stimuli because they provided equally valid options for rounding up or down, enabling us to test how the rating symbols influence participants’ initial instincts in this regard. All participants were asked standard demographic questions such as age, gender, income, and education level at the end of the study.
Analyses and Results
To test our theory, we coded participants’ responses as a binary variable (1 = rounded up, 0 = rounded down) to record whether they rounded up or rounded down the fractional ratings. For example, if a participant described 3.5 as “around 4 stars,” it was coded as 1, and if they described it as “around 3 stars,” it was coded as 0. We then submitted this binary measure to a mixed-effects logistic regression that accounted for the random effect of participants and included rating symbol (star vs. Arabic numeral; coded as a dummy variable) and numeric rating (1.5, 2.5, 3.5, 4.5; standardized with mean zero and standard deviation of one) as predictor variables, along with their two-way interaction term.
Consistent with our prediction, the effect of the rating symbol was significant (β = 2.21, SE = .29, z = 7.70, p < .0001, d = 1.22). Participants rounded up 79% of the half star ratings (MStar = .79, 95% CI = [.72, .85], SE = .03). However, only 29% of the same half ratings were rounded up when expressed in Arabic numerals (MArabicNumeral = .29, 95% CI = [.22, .37], SE = .04). The two-way interaction (β = .17, SE = .15, z = 1.14, p = .25, d = .09) was not significant, indicating that the effect was consistent across all rating values (see Table 3). Notably, in both rating symbol conditions, approximately 50% of participants consistently either rounded up or rounded down across all four trials, while the remaining participants displayed less consistent behavior across the trials.
Percentage Rounding Up (vs. Rounding Down) to Approximate.
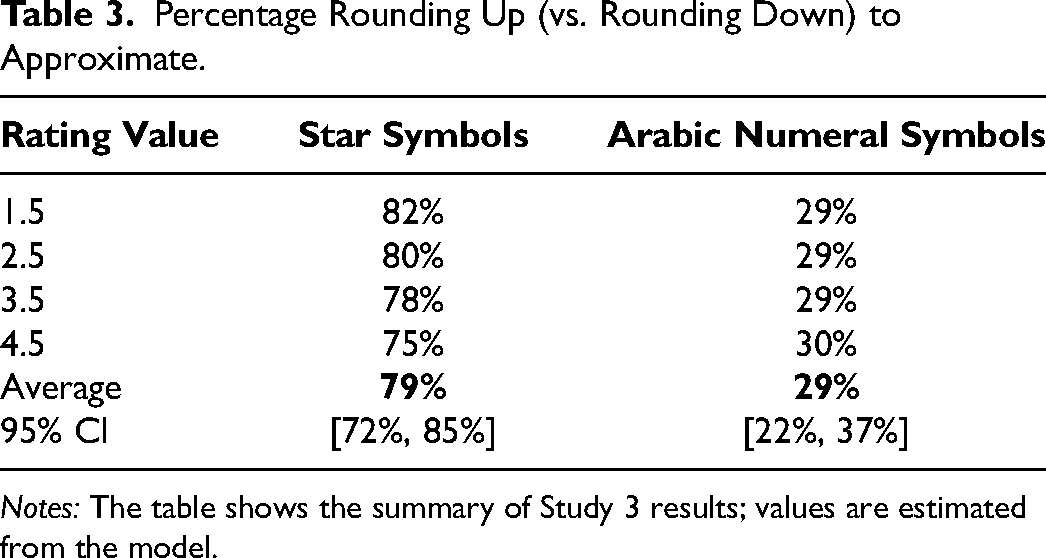
Notes: The table shows the summary of Study 3 results; values are estimated from the model.
Discussion
Study 3 shows that people tend to round up fractional star ratings, whereas they round down identical fractional Arabic numerals. This pattern of results is consistent with our theory: Magnitude judgments are anchored on the rounded-up numbers when encoding fractional graphic ratings but are anchored on rounded-down numbers for the same fractional values expressed in Arabic numerals.
Study 4: Role of Visual Incompleteness
Why do people overestimate fractional stars? Our theory posits that the tendency to mentally complete incomplete pictures is the root cause of the overestimation of fractional graphical ratings. This tendency for mental completion is activated by visual cues of incompleteness. Previous studies have demonstrated that providing visual cues of completion can alleviate this tendency (Gerbino 2020; Kanizsa 1979). For example, when viewing a picture of a human body with a missing hand, the visual completion process is activated, which makes people incorrectly recall seeing the complete hand in the picture. But this propensity to incorrectly complete the picture of a human body is reduced when the hand is depicted as amputated, which makes the picture visually complete (Kanizsa 1979). Based on this prior work, we hypothesized that visual cues of completion might reduce the overestimation of fractional star ratings. As noted previously, since visual completion is an automatic process, we did not expect this intervention to completely remove the overestimation; we expected it to reduce the extent of overestimation.
We used two different types of star ratings in this study, visually complete stars and visually incomplete stars. Using the same number line estimation task as in the first two studies, we compared the magnitude judgments for visually incomplete and visually complete star symbols. This study was preregistered at OSF (https://osf.io/74fzn).
Participants and Procedure
We recruited 551 participants using a U.S. standard sample from Prolific in exchange for monetary compensation and used the data from 543 participants (54.7% female, 44.6% male, .7% nonbinary; Mage = 42 years). See Web Appendix C for details on data exclusions and procedure.
This study employed a mixed design in which the type of star (visually complete vs. visually incomplete) was a between-subjects factor and the rating symbol (star vs. Arabic numeral) was a within-subjects factor. Participants were randomly assigned to one of two groups. One group was asked to estimate the magnitude of 17 visually complete stars, while the other group was asked to estimate the magnitude of 17 visually incomplete stars on an unmarked number line. (See Study 4 stimuli in Figure 4.) We used the same paradigm as in the first study, that is, a calibration phase followed by the number line task for 17 numerical quantities.
In addition to its primary aim, this study had a secondary objective: testing the robustness of the underestimation of Arabic numerals using a within-subjects design. Participants in this study had to respond to two sets of ratings within a span of minutes. Immediately after they evaluated the star ratings, we asked participants to evaluate the same ratings in Arabic numerals. Using this within-subjects approach, we examined whether the overestimation of star ratings in the first task had an impact on their subsequent judgments of Arabic numeral ratings. We hypothesized that these misestimations, like perceptual illusions, are largely driven by salient perceptual representations. Therefore, even after overestimating star ratings, and regardless of whether the stars are visually complete or incomplete, participants would underestimate the Arabic numeral ratings.
Thus, in summary, the 17 ratings were first presented as complete or incomplete star ratings. One group evaluated visually complete stars, while the other group evaluated visually incomplete stars. Immediately after that, both groups evaluated the same 17 ratings represented as Arabic numerals. At the end of the study, all participants answered standard demographic questions such as age, gender, income, and education level.
Analyses and Results
We calculated the deviation between the perceived magnitude of the ratings and their actual magnitude. We averaged the deviations for whole numbers, fractional numbers with quarters, fractional numbers with halves, and fractional numbers with three-fourths and submitted the average deviations to a 2 × 4 × 2 mixed ANOVA with type of stars (visually complete vs. visually incomplete) as the between-subjects factor and number type (whole, quarter, half, and three-fourths) and rating format (star vs. Arabic numeral) as within-subjects factors.
8
All three main effects were significant (type of stars: F(1, 541) = 16.57, p = .0001,
Panel A of Figure 8 shows how providing visually complete stars influenced participants’ magnitude perceptions. Our interest is in comparing the magnitude perceptions of visually complete and incomplete stars for each type of number. For quarter stars, using visually complete stars reduced overestimation from +.15 (95% CI = [+.13, +.17]) to +.10 (95% CI = [+.08, +.12]) (F(1, 1,760) = 10.12, p = .002,
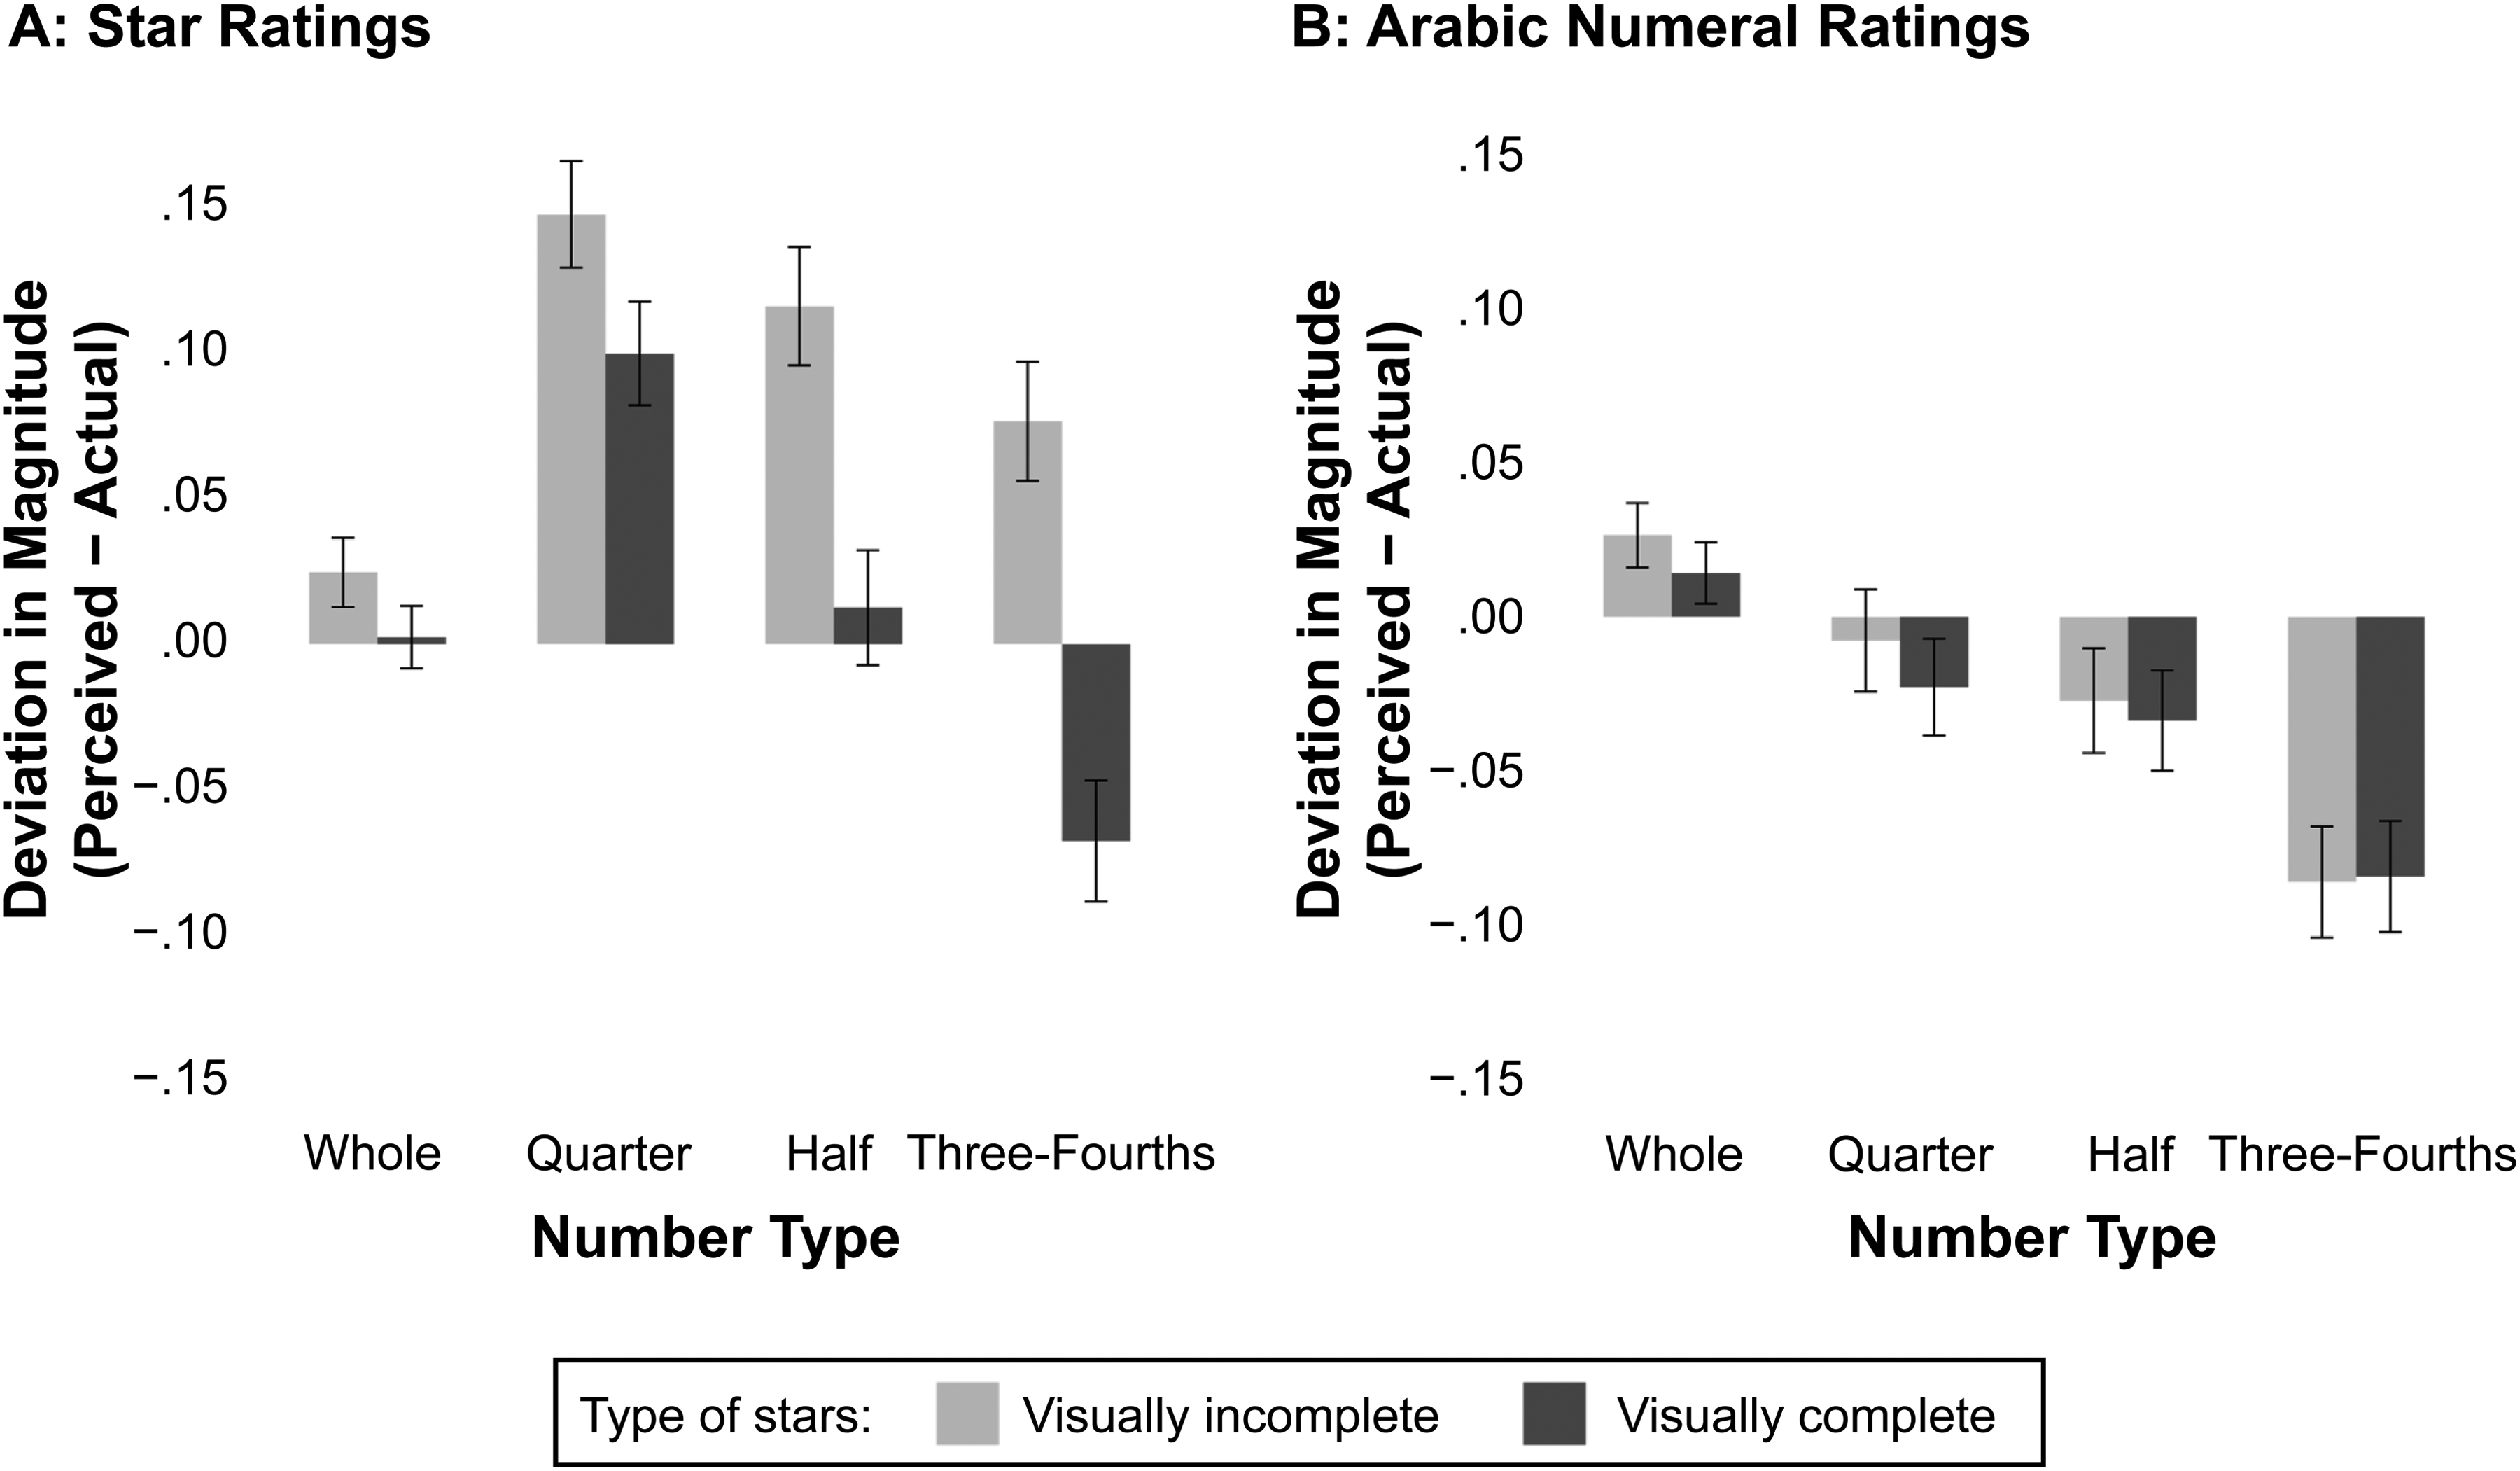
Effect of Visual Completeness by Number Type (Study 4).
In the case of half stars, using visually complete stars completely reduced the overestimation from +.12 (95% CI = [+.10, +.14]) to +.01 (95% CI = [−.01, +.03]) (F(1, 1,760) = 47.46, p < .0001,
For three-fourths stars, the use of visually complete stars shifted the misestimation in magnitude from an overestimation of +.08 (95% CI = [+.06, +.10]) to an underestimation of −.07 (95% CI = [−.09, −.05]) (F(1, 1,760) = 91.97, p < .0001,
Importantly, averaging across all fractional numbers (quarters, halves, and three-fourths), using visually complete stars sharply reduced the overestimation by about 86% from +.11 (95% CI = [+.10, +.13]) to +.015 (95% CI = [−.00, +.03]) (F(1, 958) = 59.88, p < .0001,
Next we turn to Panel B of Figure 8, depicting the magnitude perception of Arabic numerals. Recall that all participants responded to the Arabic numeral magnitude judgment task immediately after evaluating either visually complete stars or incomplete stars. Our intention here was to see whether their perceptions of star ratings would in any way carry over and influence their perception of Arabic numerals. We found that fractional Arabic numeral ratings were on average underestimated, irrespective of whether the previously evaluated stars were visually incomplete (MVisuallyIncomplete = −.04, 95% CI = [−.06, −.02], SD = .29) or complete (MVisuallyComplete = −.05, 95% CI = [−.06, −.03], SD = .28; F(1, 958) = .27, p = .60,
Discussion
Replicating the pattern observed in Studies 1 and 2, in this study we find that participants overestimate ratings when represented by visually incomplete stars. Notably, this visual-completion effect was attenuated when stars were presented as visually complete. Furthermore, Study 4 reveals that even when star ratings and Arabic numeral ratings are shown sequentially, participants continue to underestimate the Arabic numerals. These findings indicate that the visual-completion effect and the left-digit effect are primarily perceptual in nature, occurring during the encoding stage. Even when star and numeral formats are interspersed, consumers may still exhibit these effects.
Study 5: Memory Recall of Ratings
How does the rating format influence short-term memory of ratings? Addressing this question has both practical and theoretical implications, providing us with more insight into how different symbolic representations influence magnitude judgments.
In everyday conversations, people typically use Arabic numerals rather than graphical images to discuss ratings. When consumers remember or talk about ratings, they usually do so using Arabic numerals. We posited that when the encoded format and the recalled format are the same, recalled magnitudes of ratings should be accurate. Specifically, when ratings are presented as Arabic numerals and consumers later recall them as Arabic numerals, the recall from short-term memory should be precise. This process essentially involves memorization and recall of the same set of Arabic numerals, much like recalling a string of telephone numbers.
In contrast, when consumers see star ratings and later try to recall them as Arabic numerals, we expect their recall to be overestimated. This process involves two steps: first, the star ratings are mapped onto an internal magnitude scale, and then this magnitude is converted into an Arabic numeral. Because the magnitude representations of star ratings are overestimated, we predict that the recalled values of star ratings will also be overestimated.
Study 5 was designed to test the effect of mismatch between encoding and retrieval formats of ratings. Participants were shown products with various ratings and were later asked to recall these ratings using an Arabic numeral slider scale. Half of the participants viewed star ratings, while the other half saw numeral ratings. The objective was to assess whether the initial format of the ratings influenced recall accuracy. The methodology for this study was preregistered at OSF (https://osf.io/wfapm).
Participants and Procedure
We recruited 379 participants using the CloudResearch panel of U.S. participants and analyzed data from 355 of them (52.4% female, 47% male, .6% nonbinary; Mage = 40 years). See Web Appendix C for details of data exclusions and stimuli.
Participants were shown four perfumes listed on an e-commerce website, along with their average ratings out of five. They were randomly assigned to either the star or Arabic numeral rating symbol condition (see Study 5 stimuli in Figure 4). Participants saw four perfumes, each with a different rating (e.g., 1.5, 2.5, 3.5, 4.5), in a random order. After seeing each perfume, they were asked to recall the name and average rating of each perfume on the subsequent screen. Participants used a text box to recall the name of the perfume and used a numbered slider scale with endpoints 0 and 6 to recall the rating of the perfume. The slider scale allowed them to see the exact value of their response.
At the end of the study, we verified that participants were aware that the product ratings shown were out of five and asked participants standard demographic questions.
Analyses and Results
To analyze the recall errors, we calculated the deviation between the recalled and actual magnitude of the rating. We then conducted a 2 × 4 mixed-factorial ANOVA on these deviations, with rating symbol (star vs. Arabic numeral) as the between-subjects factor and rating value (1.5, 2.5, 3.5, 4.5) as the within-subjects factor. The analysis revealed a significant main effect of rating symbol (F(1, 347) = 20.40, p < .0001,
Participants’ recalls of star rating magnitudes were higher than the true values, with the average deviation significantly differing from zero (MStar = +.14, SD = .56; F(1, 347) = 54.7, p < .0001,
Average Recalled Ratings in Study 5.
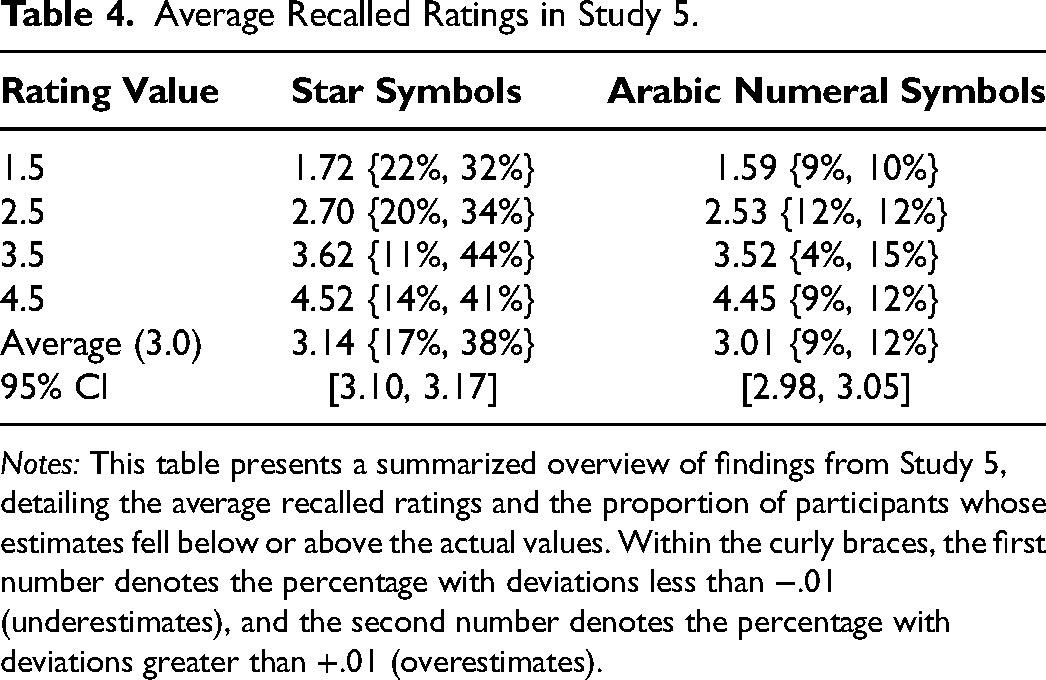
Notes: This table presents a summarized overview of findings from Study 5, detailing the average recalled ratings and the proportion of participants whose estimates fell below or above the actual values. Within the curly braces, the first number denotes the percentage with deviations less than −.01 (underestimates), and the second number denotes the percentage with deviations greater than +.01 (overestimates).
Discussion
Recalls of star ratings tended to exceed their true values, whereas those of Arabic numerals were accurate on average. This discrepancy has implications for consumer behavior, particularly in how product ratings are remembered and communicated through word of mouth. The use of star ratings (instead of Arabic numerals) may significantly inflate the consumer's memory of the rating, potentially shaping their purchase decisions and the recommendations they share with others based on those recalls.
Study 6: Consequential Monetary Decisions
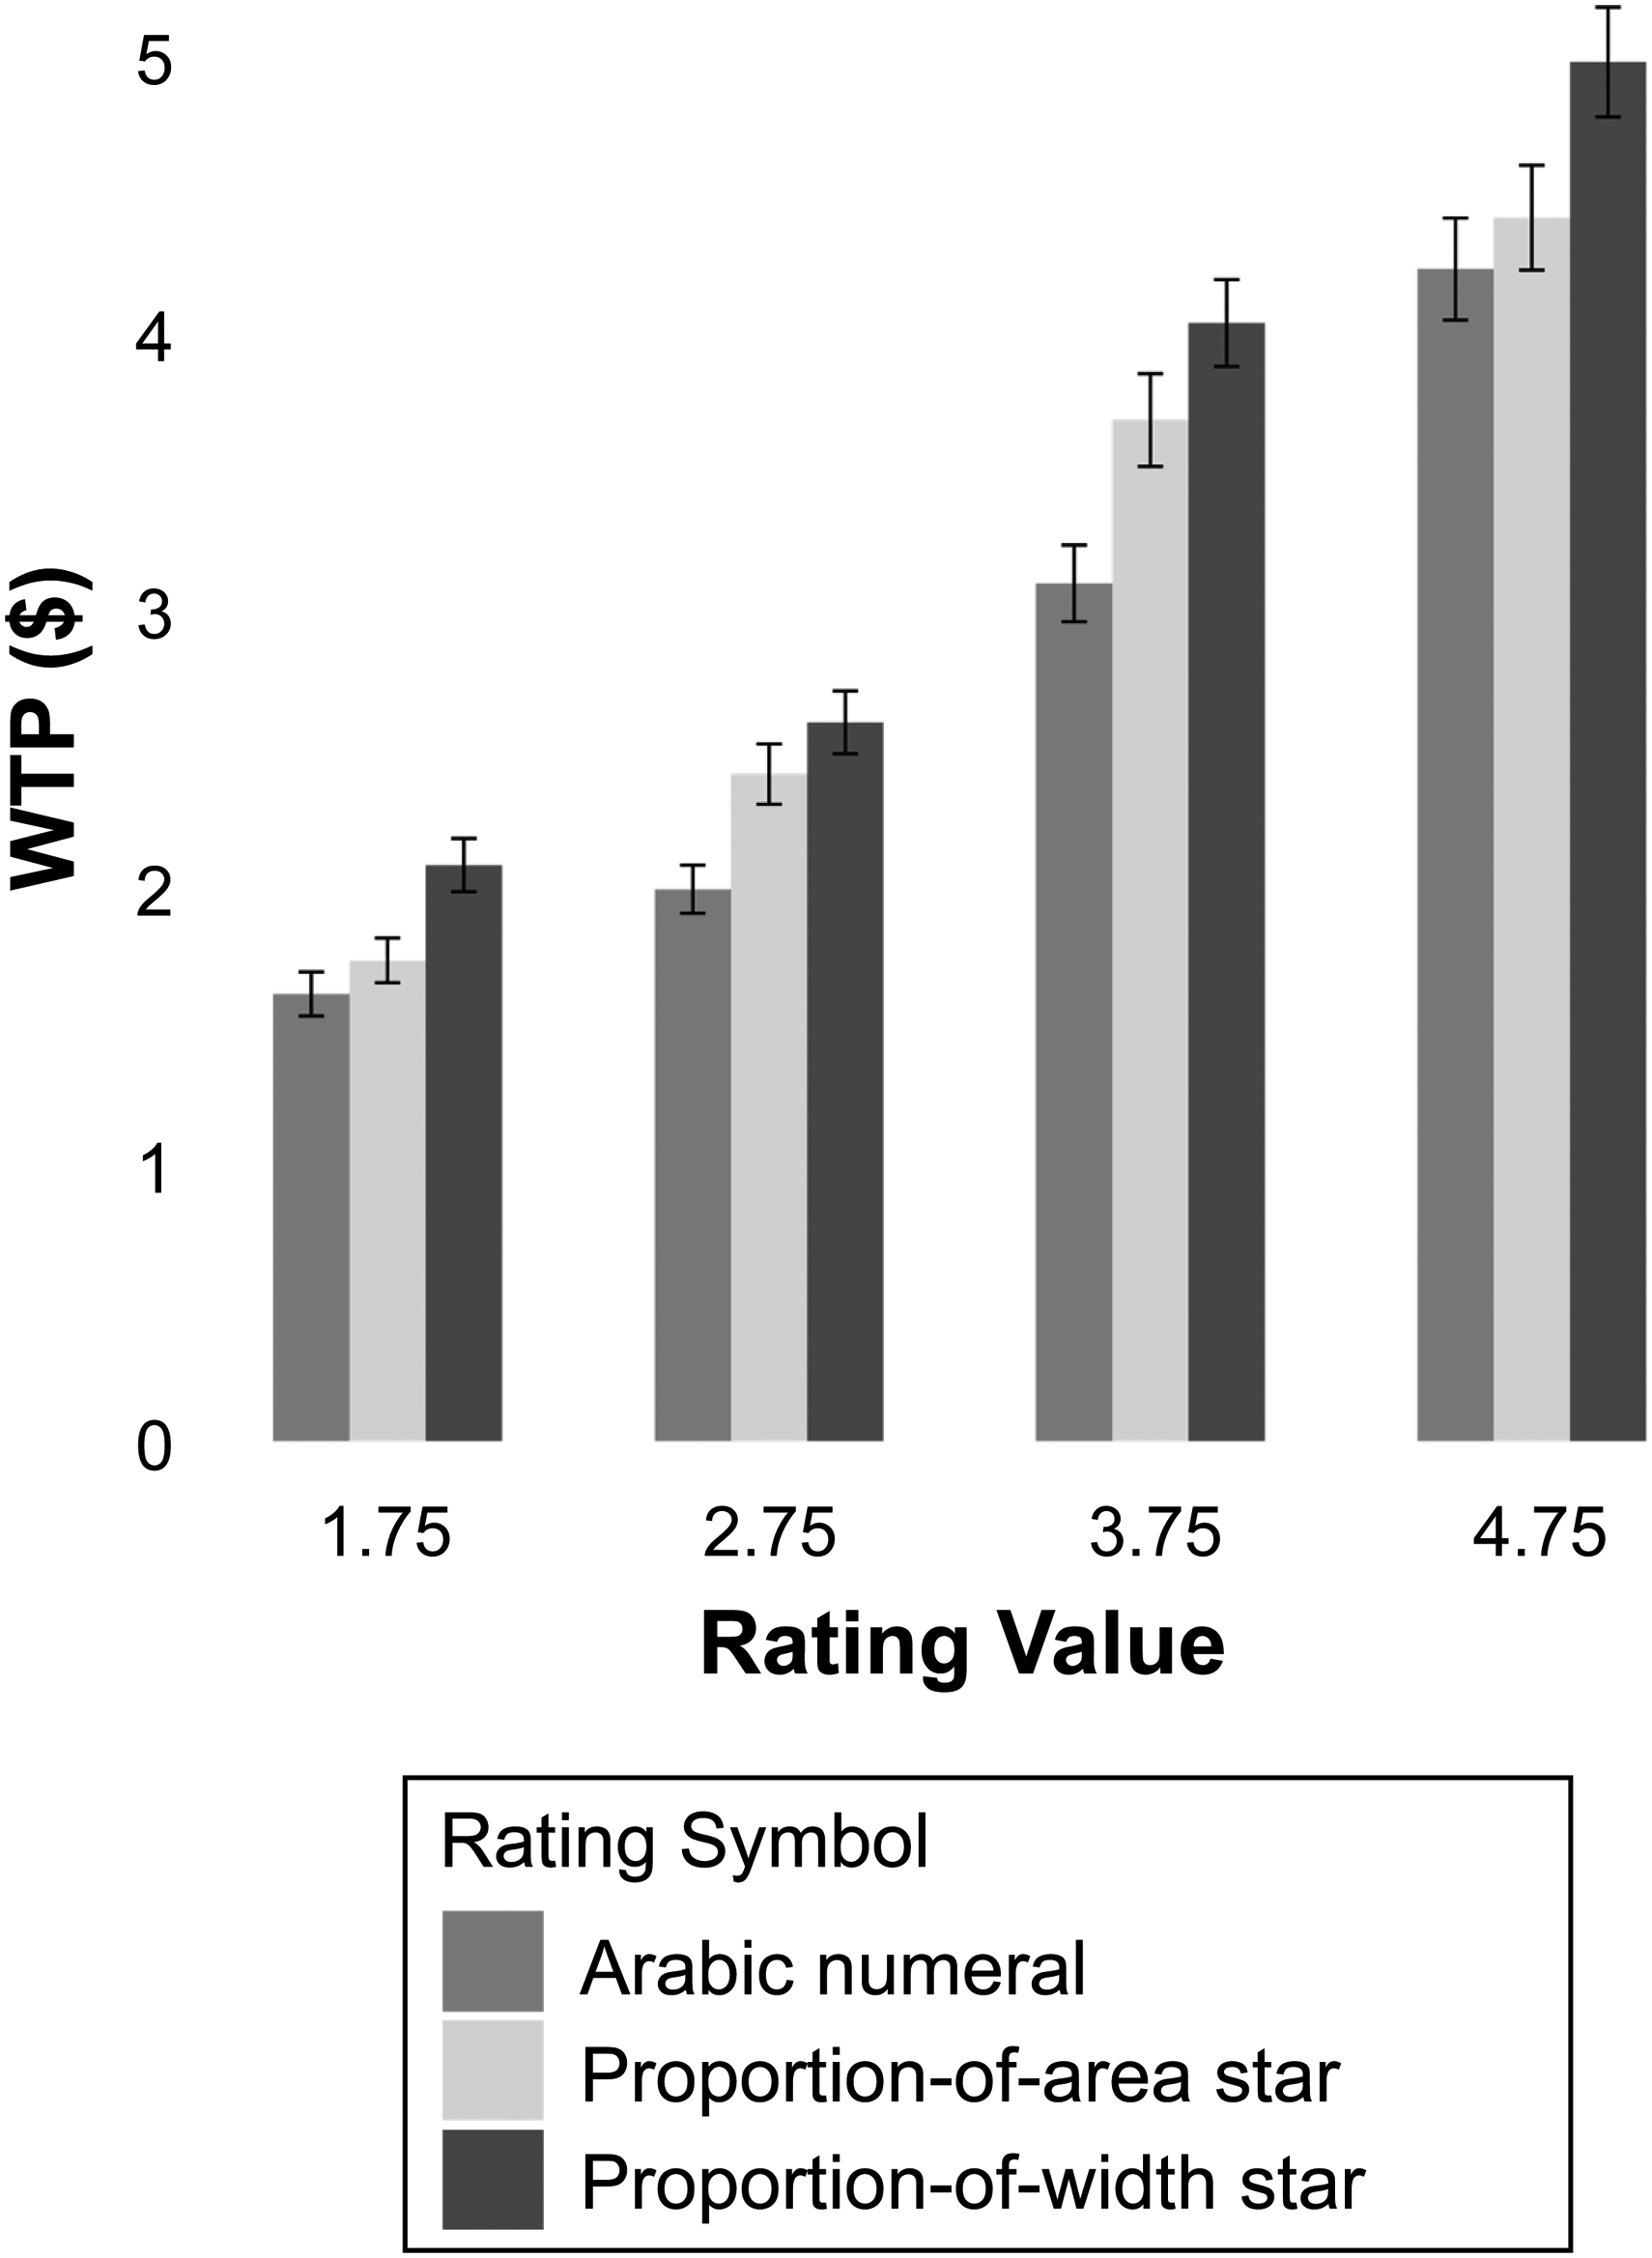
In previous studies, we examined how different rating symbols influence rating perception using various subjective magnitude measures. While these assessments provided valuable insights, they did not capture participants’ actual monetary decisions. In other words, we have yet to demonstrate whether participants are willing to pay different amounts for products solely based on variations in rating symbols. To address this gap, Study 6 investigates whether consumer willingness to pay (WTP) for identical products with the same average ratings varies based on the type of rating symbols displayed by the platform. We focused on three distinct rating symbols—proportion-of-width star symbols, proportion-of-area star symbols, and Arabic numeral symbols—commonly utilized by online platforms.
Participants were shown four ballpoint pens, each with an average rating displayed in one of the three formats: proportion-of-width stars, proportion-of-area stars, or Arabic numerals. They were then asked to state their maximum WTP using an adapted incentive-compatible Becker–DeGroot–Marschak (BDM) lottery (Becker, DeGroot, and Marschak 1964). The ratings chosen for this study were 1.75, 2.75, 3.75, and 4.75. Results from Study 2 indicate that, for these values, ratings displayed as proportion-of-width stars are overestimated compared with those shown as proportion-of-area stars, which, in turn, are overestimated relative to Arabic numerals. We predicted that these magnitude judgments would lead to corresponding variations in WTP estimates. This study was preregistered at OSF (https://osf.io/pje23).
Participants and Procedure
We recruited 500 participants using a U.S. standard sample from Prolific. Data analysis was conducted on responses from 475 participants (46.3% female, 51.6% male, 2.1% nonbinary; Mage = 41 years) after applying data exclusions based on preregistered criteria. See Web Appendix C for details on data exclusions and procedure. Participants were randomly assigned to one of three conditions: proportion-of-width stars, proportion-of-area stars, or Arabic numerals (refer to Study 6 stimuli in Figure 4). They were presented with four six-packs of ballpoint pens listed on an e-commerce website, each with an average rating out of five (1.75, 2.75, 3.75, or 4.75). The pens were shown in a random order, with the specific rating symbol format (proportion-of-width stars, proportion-of-area stars, or Arabic numerals) corresponding to the participant's assigned condition. Participants indicated their maximum WTP for each six-pack of pens using a text box, with responses ranging from $1 to $10. At the conclusion, participants confirmed their understanding that product ratings were out of five and completed standard demographic questions.
To ensure incentive compatibility, we employed a modified version of the BDM lottery, a widely recognized approach for eliciting true WTP, known for its reliability and validity in consumer research (Wertenbroch and Skiera 2002). This method has been extensively utilized in marketing studies (e.g., Franke, Schreier, and Kaiser 2010; Nunes and Boatwright 2004). In the traditional BDM procedure, participants indicate the maximum price they are willing to pay for a product, after which a random price is drawn from a predetermined range. If a participant's stated WTP is greater than or equal to the randomly drawn price, they purchase the product at that price; if it is lower, they do not purchase the product. This structure incentivizes participants to reveal their true WTP.
To simplify logistics for our online study, we adapted the BDM procedure by incorporating an additional lottery, consistent with approaches used by Fuchs, Schreier, and Van Osselaer (2015). Participants were informed that they would enter a lottery for a $10 bonus. The lottery winner proceeded to the BDM procedure for one randomly selected six-pack of pens they had rated. If their stated WTP was greater than or equal to the randomly drawn price, they purchased the product at the random price and retained the remaining balance of the $10 bonus. If their WTP was lower than the random price, they kept the entire $10 bonus without purchasing the product. Participants who did not win the lottery did not participate in the BDM procedure.
Analyses and Results
To examine the effect of rating symbols on participants’ WTP, we conducted a 3 × 4 mixed factorial ANOVA with rating symbol (proportion-of-width stars, proportion-of-area stars, and Arabic numerals) as the between-subjects factor and rating value (1.75, 2.75, 3.75, and 4.75) as the within-subjects factor. The analysis revealed a significant main effect of rating symbol (F(2, 466) = 8.70, p < .001,
Participants were willing to pay, on average, 25.2% more for pens described using proportion-of-width star symbols compared with those described with Arabic numeral symbols (MProportion-of-Width-Star = $3.44, SD = 2.19; MArabicNumeral = $2.74, SD = 1.90; F(1, 466) = 17.31, p < .0001,
WTP Values for Ratings Ending in .75 (Study 6).
Discussion
Study 6 demonstrates that the format used to represent product ratings—whether through proportion-of-width stars, proportion-of-area stars, or Arabic numerals—significantly impacts consumers’ WTP. For ratings ending in .75, consumers exhibited the highest WTP when ratings were presented using proportion-of-width stars, followed by proportion-of-area stars, with the lowest WTP for Arabic numeral representations. Notably, our theory suggests that these patterns will shift based on the type of fractions used in ratings. For example, for ratings ending in .25, we predict that WTP will be higher when the rating format uses proportion-of-area stars compared with proportion-of-width stars (see Figure 7 for the basis of these predictions). See Supplementary Study 4 in Web Appendix D for an analysis of how WTP varies by rating format for values ending in .5.
We conducted several additional studies to test the robustness of our findings; these supplementary studies are reported in Web Appendix D. The two field experiments (Supplementary Studies 5A and 5B) that we conducted on Meta are particularly noteworthy. These studies assessed the influence of rating symbols on consumer engagement with social media advertising campaigns, demonstrating that rating format significantly influences consumer interactions in real-world contexts. The consistency of these findings across both laboratory and field settings underscores the practical relevance of choosing specific rating symbols in marketing and highlights their potential to shape consumer perceptions and purchasing behavior.
General Discussion
Despite the ubiquity of product ratings on online platforms, there has been a surprising lack of standardization in rating formats. Platforms vary in their presentation, with some using graphic symbols like stars or circles, others using Arabic numerals, and some employing a combination of both. Recent research has begun to examine the effects of different rating formats (e.g., Abell, Morgan, and Romero 2024; Jia, Wan, and Zheng 2023; Mousavi et al. 2024), but the extant literature fails to address which format offers a more accurate representation of the underlying magnitude. While Abell, Morgan, and Romero (2024) argue for underestimation of Arabic numerals due to the left-digit bias, they do not test the accuracy of these perceptions, focusing instead on relative perceptions of Arabic numeral versus star ratings.
Our research is among the first to examine the veridicality of product ratings, whether star and Arabic numeral ratings are accurately perceived by consumers. Additionally, we uniquely investigate the effect of various fill-in methods on perceptions of star ratings. Our findings reveal a concerning picture: Both star ratings and Arabic numeral ratings are misestimated, albeit in different ways, driven by the visual-completion effect and the left-digit effect.
Fractional ratings presented graphically (e.g.,  ) are consistently overestimated because of the visual-completion effect. This overestimation is more pronounced for quarter-star ratings than for three-quarter-star ratings. Conversely, the same ratings presented in Arabic numerals (e.g., 3.5) tend to be underestimated due to the left-digit effect, with this underestimation being more pronounced for three-quarter ratings than for quarter ratings.
These findings support our proposed contingent anchoring framework. This framework posits that the type of symbol used triggers specific mechanisms driving misestimations in magnitude judgments of fractional ratings. For graphic symbols like stars, visual completion prompts consumers to use complete stars as anchors, resulting in overestimation. For Arabic numerals, left-digit anchoring leads to underestimation. We believe this framework can explain how visual processing of symbols influences magnitude perception of fractional numbers, predicting when they will be over- or underestimated.
Practical Implications
Our research on the perception of ratings has significant practical implications for various stakeholders, including marketers, regulatory bodies, and industries beyond e-commerce.
Regulatory considerations
Studies 1, 2, and 4 reveal that magnitude judgments for fractional ratings are consistently misestimated, regardless of the rating symbol used. Graphical symbols are often overestimated, while Arabic numerals tend to be underestimated on average.
Which rating format is best to minimize consumer misinterpretation? While our research was not specifically designed to determine the optimal format for product ratings, we recognize that this is an important question for future research. To the extent that minimizing misestimation of product quality benefits consumers, we recommend the use of visually complete stars.
Furthermore, to ensure fair competition among retailers using different rating formats, we advocate for the standardization of rating formats by industry associations or regulatory bodies. This standardization should extend to the fill methods used for star ratings, as neither the proportion-of-area nor the proportion-of-width methods are consistently perceived accurately by consumers across all magnitudes. Additionally, our data indicate that the average extent of misestimation for fractional ratings is more than twice as large for star symbols alone compared with either Arabic numerals or a combination of numerals and stars. We urge regulatory bodies to take these findings into account when establishing guidelines for rating displays.
Choice for marketers
The insights from our study provide crucial guidance for managers regarding the selection of rating symbols. Using star ratings instead of Arabic numeral ratings may boost consumer perceptions of product quality, potentially leading to higher sales conversion rates, decreased cart abandonment, and increased product expectations. However, our research reveals that when star ratings and Arabic numerals are displayed concurrently, consumers primarily focus on the Arabic numerals. This suggests that Arabic numerals may be more familiar or easier for consumers to interpret. Marketers should consider this trade-off when deciding on their rating display format.
Broader applications
The implications of our research extend well beyond product ratings to encompass a wide range of applications where graphical symbols are used to convey numerical information. These include areas as varied as mobile battery indicators, vehicle fuel gauges, activity tracking on smartwatches, energy efficiency ratings, and vehicle safety ratings. Our finding that graphical representations can lead to the overestimation of numerical magnitudes is valuable for the design and interpretation of graphical displays across multiple sectors, including technology, transportation, and consumer electronics.
Theoretical Implications
Our findings make several tangential yet noteworthy contributions to the literature at the intersection of visual perception and numerical cognition.
Visual versus verbal processing
While prior studies have indicated a human propensity for processing visual object representations more effectively than verbal ones (Lieberman and Culpepper 1965; Paivio, Rogers, and Smythe 1968), our findings present a more nuanced view in the context of numerical quantities. Studies 1 and 2 demonstrate that verbal representations (Arabic numerals) yield more accurate estimations of fractional ratings, compared with graphical representations (star symbols). This is further underscored by the observation that participants, when presented with both types of symbols, predominantly relied on Arabic numerals for magnitude estimation. These results challenge the conventional wisdom and suggest that in scenarios involving numerical information, verbal representations may lead to more efficient processing than graphical representations.
New insights into left-digit bias
Our findings provide new insights into the left-digit bias, particularly regarding its magnitude across different fractional values. While previous research has shown that fractional numbers (e.g., 3.99) are underestimated, it has not examined how the distance of the number from the leftmost digit influences this bias. That is, previous research suggests that the perceived magnitude of 2.25, 2.50, 2.75, and 2.99 will be anchored on the 2, the leftmost digit. But it does not answer whether and how the bias in magnitude judgments varies across these four values. This is the first research to show that the left-digit bias is more pronounced for values that are farther from the leftmost digit. Hence, the underestimation of magnitudes of fractional numbers is the strongest for 2.99 and the weakest for 2.25. In other words, the extent of the left-digit bias in magnitude judgments is proportional to the distance between the leftmost digit and the actual stimulus. This finding significantly advances our understanding of the left-digit bias, extending beyond recent work such as that of Abell, Morgan, and Romero (2024).
Limitations and Future Research
We have identified several areas that future research could explore to deepen our understanding of the influence of rating formats on consumer perception. First, while our research uses controlled experiments to study the impact of rating symbols on rating perception, the complex dynamics of real online marketplaces, where multiple factors interplay in product comparisons and ratings, remain unaddressed. An important aspect not covered in our experiments is direct product comparison with different ratings. To robustly validate our findings, field studies in these multifaceted shopping environments are crucial, as they would provide insights into the natural interplay between various products and their ratings. Second, while our research shows overestimation of graphical ratings when the ratings were presented using discrete shapes (e.g., coloring three and a half stars out of five), we have not explored whether this effect persists if the rating is presented using a continuous shape, such as by proportionately filling a single circle or a bar to represent the rating magnitude. Future research could investigate whether the observed overestimation persists or varies when a continuous representation using a single shape is employed and how it compares to the overestimation with discrete shapes.
Moreover, while our findings lean toward the anchoring and insufficient adjustment theory to explain how people interpret fractional ratings, we cannot say for sure that this is the only explanation. Alternative explanations, such as a cognitive weighing function whereby the round-number value is disproportionately emphasized over the fractional value, are also consistent with our data. This opens the door for future research to dive deeper into these possibilities, helping clarify how exactly consumers process and interpret numerical ratings.
Supplemental Material
sj-pdf-1-mrj-10.1177_00222437251322425 - Supplemental material for Overestimating Stars, Underestimating Numbers: The Hidden Impact of Rating Formats
Supplemental material, sj-pdf-1-mrj-10.1177_00222437251322425 for Overestimating Stars, Underestimating Numbers: The Hidden Impact of Rating Formats by Deepak Sirwani, Srishti Kumar and Manoj Thomas in Journal of Marketing Research
Footnotes
Acknowledgments
The authors extend their sincere gratitude to the Marketing and Behavioural Science Division at the UBC Sauder School of Business and the marketing group at the Cornell SC Johnson College of Business, including both faculty and doctoral students, for their invaluable support, constructive feedback, and insightful suggestions on this project. They also wish to thank the amazing JMR review team for their thoughtful guidance and efforts in seeing this article through, ultimately helping shape a much stronger version of the work.
Coeditor
Karen Page Winterich
Associate Editor
Julie Irwin
Declaration of Conflicting Interests
The authors declared no potential conflicts of interest with respect to the research, authorship, and/or publication of this article.
Funding
The authors received no financial support for the research, authorship, and/or publication of this article.
Notes
References
Supplementary Material
Please find the following supplemental material available below.
For Open Access articles published under a Creative Commons License, all supplemental material carries the same license as the article it is associated with.
For non-Open Access articles published, all supplemental material carries a non-exclusive license, and permission requests for re-use of supplemental material or any part of supplemental material shall be sent directly to the copyright owner as specified in the copyright notice associated with the article.