
Abstract
Although the power held by the marketing department can determine key organizational outcomes, including firm performance, this power seemingly has been decreasing. To address this apparent disconnect, the authors propose that the board of directors is a critical but overlooked antecedent of marketing department power (MDP). In particular, the authors demonstrate that directors’ exposure through board service at other firms (i.e., board interlocks) affects MDP in the firms on whose boards they also serve (i.e., focal firms). A sample of 6,008 firms, spanning 2007–2021, reveals that MDP in board-interlocked firms has a positive effect on MDP in focal firms. Despite evidence that board interlock effects have diminished or even disappeared, the findings suggest the board interlock effect remains a potent antecedent of MDP—and this effect did not decrease during the observation period. Adapting the 3R (reach–richness–receptivity) framework, the authors also find that the board interlock effect increases with greater reach and richness of a focal firm's board interlock network and its executives’ receptivity to information. The marketing department's decreasing power is concerning for the discipline; the robust results of this study suggest that firms need to get the board “on board” to stem this diminishing trend.
Depending on the firm, functional departments such as marketing, finance, or engineering enjoy varying degrees of power, defined as their ability to influence other departments and the top management team (TMT; Hickson et al. 1971; Pfeffer 1981). The more powerful a department, the greater its control over firm decisions (Brass and Burkhardt 1993; Feng, Morgan, and Rego 2015). Notably, power held by the marketing department can have positive effects on firm performance. For example, Feng, Morgan, and Rego (2015) find that a powerful marketing department enhances both returns on assets and shareholder value, and Homburg et al.’s (2015) study of the performance impacts of intrafirm power distributions indicates that a powerful marketing department makes the greatest contribution to firm performance.
Despite these positive performance implications, marketing department power (MDP) often appears modest (Ambler 2003; Verhoef and Leeflang 2009). Whereas Feng, Morgan, and Rego (2015) report increases in MDP between 1993 and 2008, several researchers argue that the marketing department's power and influence has dwindled (e.g., Sheth and Sisodia 2005; Verhoef and Leeflang 2009; Webster, Malter, and Ganesan 2005). For example, surveying a broad set of firms and industries, Homburg et al. (2015) report that marketing departments lost substantial influence over pricing, new product development, and strategic decisions between 1996 and 2013, with stronger influence only over advertising. Thus, citing Lehmann (1996, p. 135), Homburg et al. (p. 9) argue that “the marketing department could devolve into a department of ad-copy and cent-off coupons.” Similarly, the Marketing Science Institute (2022, p. 12) discloses that “member firms report decreasing influence of marketing in the C-Suite,” prompting it to designate research on the “influence of marketing in the firm” as a 2022–2024 research priority. Our own findings (Figure 1), obtained on the basis of 6,008 firms, indicate that MDP decreased markedly between 2007 and 2021. 1 For example, having a marketer on the TMT (which admittedly is only one of several measures that comprise MDP) demonstrates some clear trends: Whereas 37.0% of the sample firms had a marketer on the TMT in 2007, only 28.9% did so in 2021. This drop in marketing presence on the TMT, and more broadly of MDP, is alarming for the marketing discipline and indicative of the need for a clearer sense of MDP's antecedents.
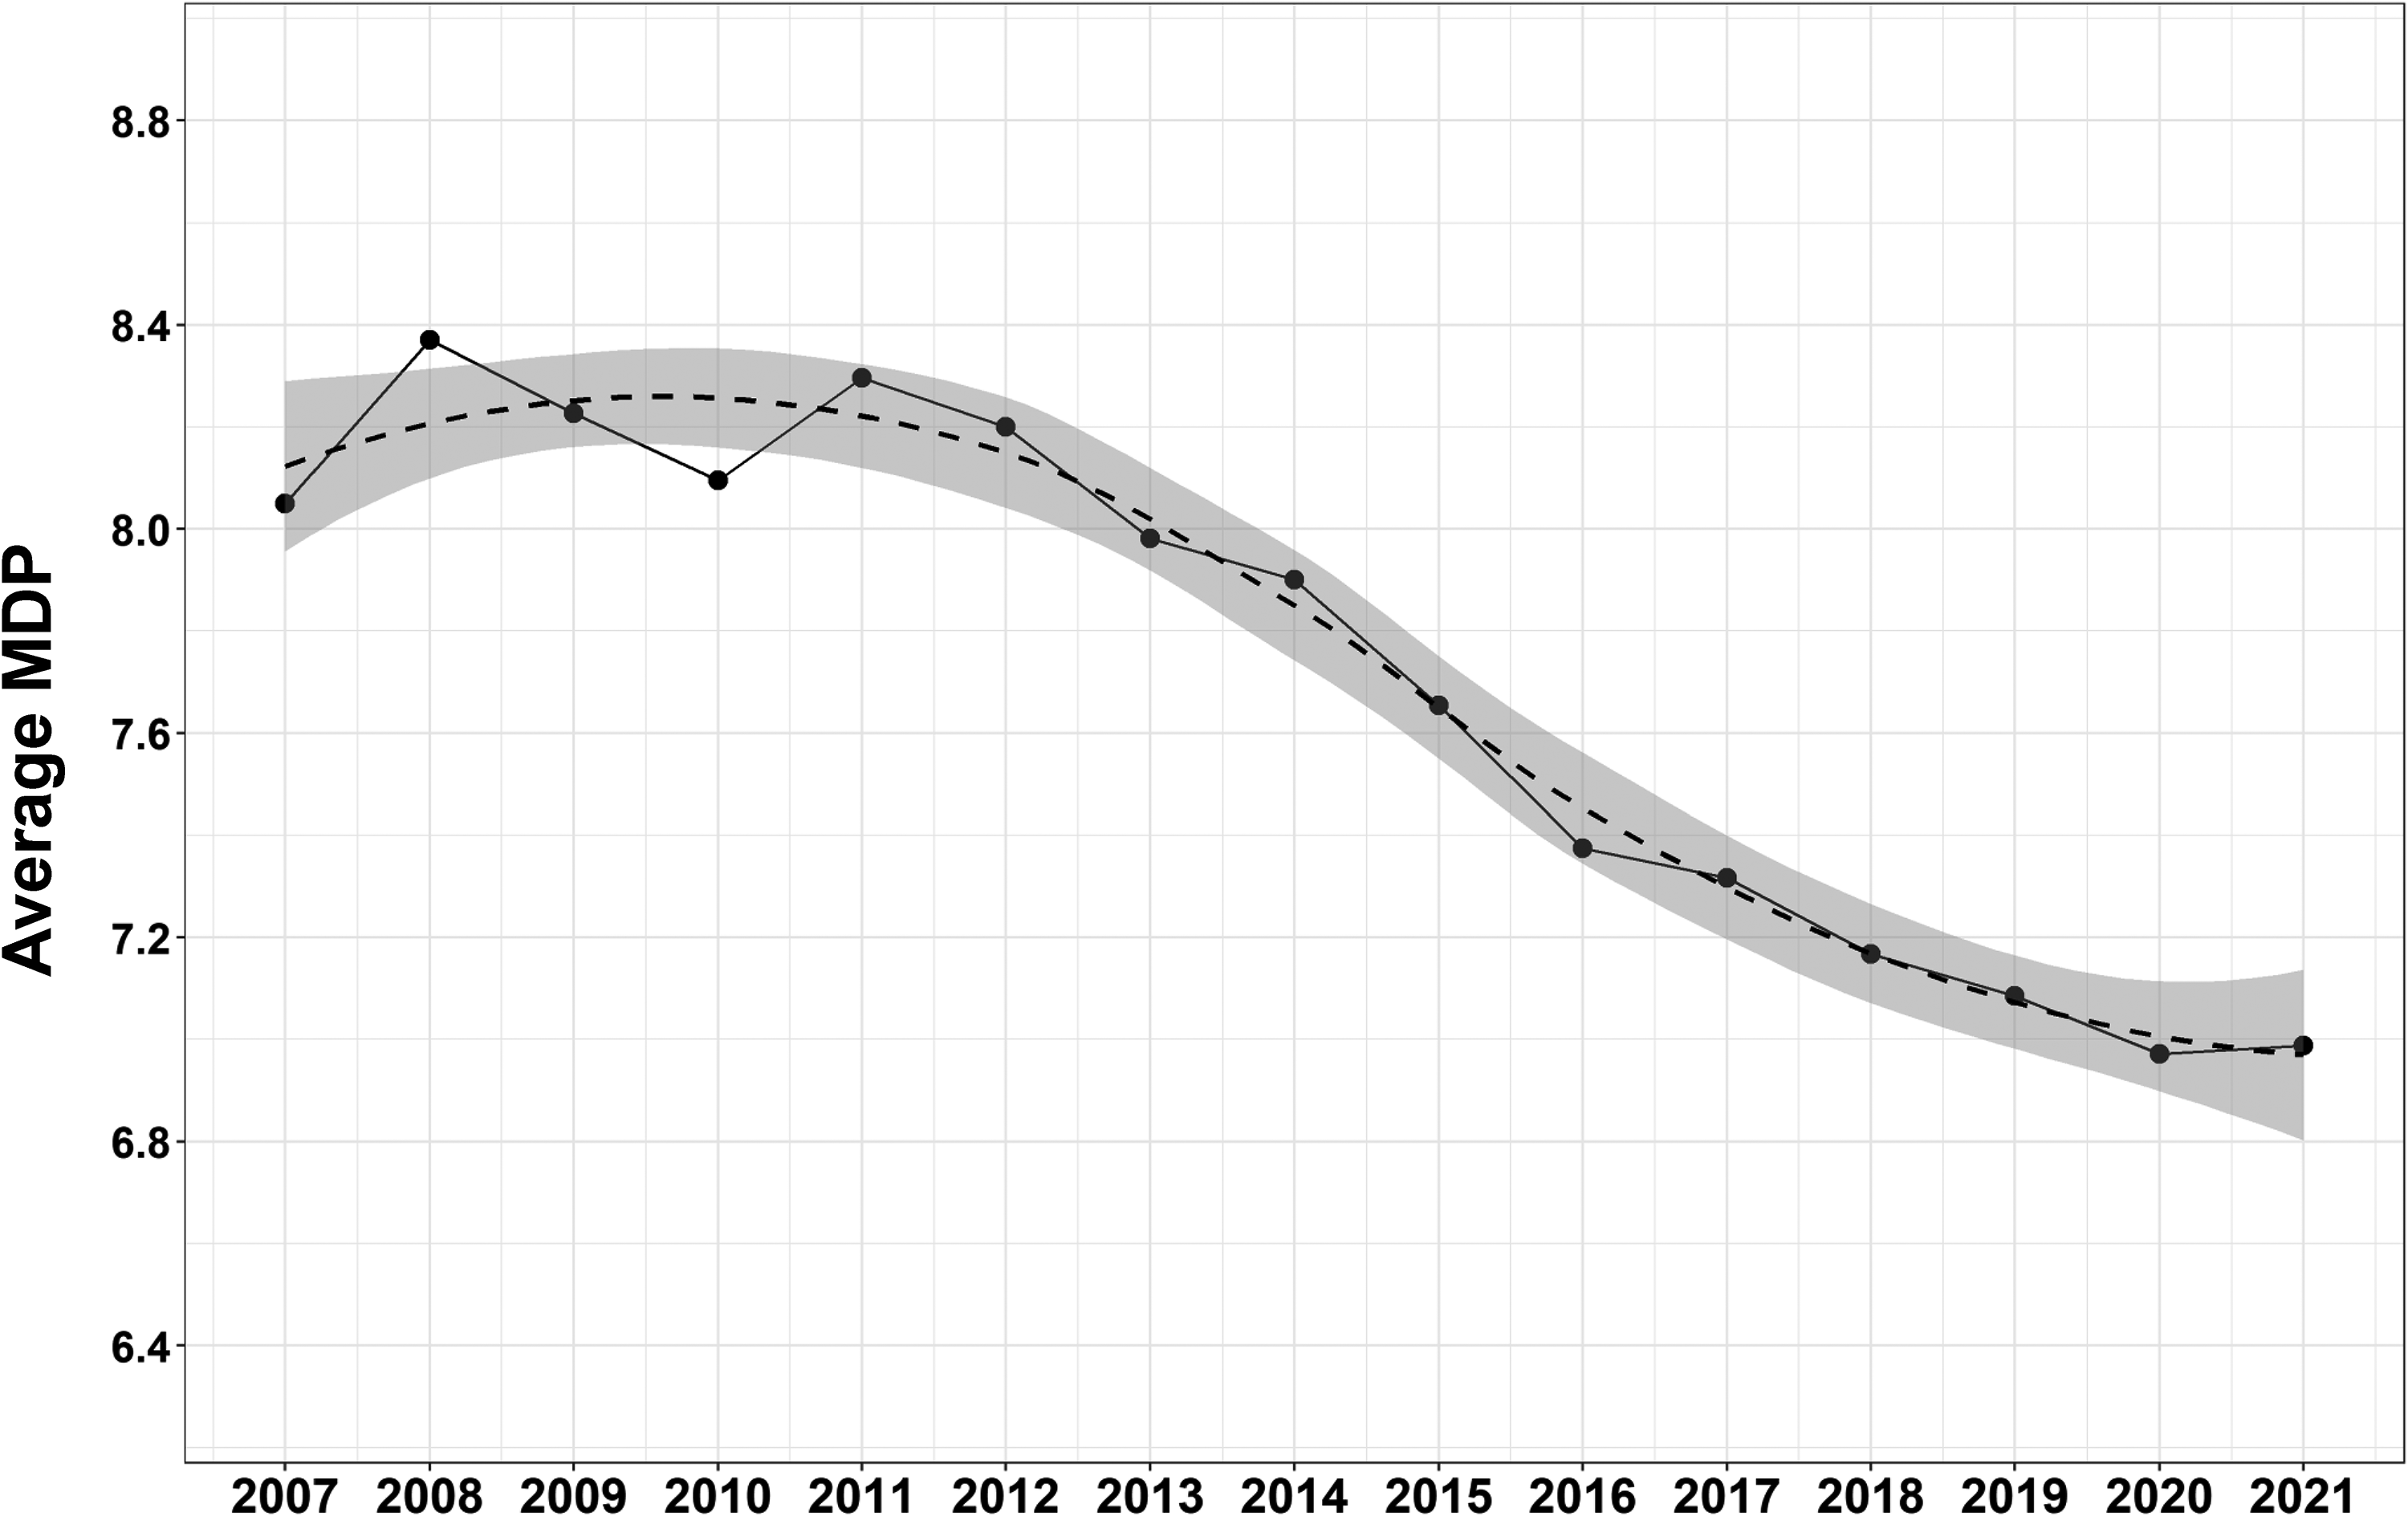
Average MDP Across All Sample Firms 2007–2021.
These findings are puzzling, considering the positive performance implications of powerful marketing departments (Feng, Morgan, and Rego 2015; Homburg et al. 2015) and studies that show that marketing departments are the primary driver of organic firm growth (e.g., Lehmann 2015). Indeed, these findings suggest that there is a need for firms to foster MDP and reverse the prevailing trend. Considering that power resides with top managers, including chief executive officers (Appelbaum, St-Pierre, and Glavas 1998; Barnett and Carroll 1995), we propose that corporate boards, which oversee TMTs (Finkelstein, Hambrick, and Cannella 2009; Luciano, Nahrgang, and Shropshire 2020), can be important stakeholders for such an endeavor. A dominant characteristic of corporate boards is that board members of one firm often serve on boards of other firms, leading to board interlocks (Mizruchi 1996; Zajac and Westphal 1996), which facilitate the adoption of organizational practices (Martin, Gözübüyük, and Becerra 2015; Srinivasan, Wuyts, and Mallapragada 2018). Therefore, we investigate whether board interlocks may serve as conduits influencing a firm's MDP.
Our results, based on board interlock panel data of 6,008 firms from 2007 to 2021, provide empirical evidence that the MDP in a firm is positively associated with the MDP in its board-interlocked firms. Building on Gulati, Lavie, and Madhavan’s (2011) theoretical 3R (reach–richness–receptivity) framework, we further show that this board interlock effect varies considerably depending on the reach and richness of the firm's board interlock network, as well as the board's and TMT's receptivity to information furnished by the board interlock network. To the best of our knowledge, the board interlock network constructed for the purpose of this study is the largest one established for any academic board interlock study to date.
Our research accordingly contributes to literature that investigates MDP (Feng, Morgan, and Rego 2015; Moorman and Rust 1999; Verhoef and Leeflang 2009) and corporate board interlocks (Chu and Davis 2016; Martin, Gözübüyük, and Becerra 2015; Srinivasan, Wuyts, and Mallapragada 2018). In particular, extant research indicates that marketers pay little attention to the board of directors (Whitler, Krause, and Lehmann 2018). We show that this inattention is ill advised. Rather than ignoring the board, marketers should regard it as a key stakeholder that can help them gain and retain power. With regards to the broader board interlock literature, Chu and Davis (2016) suggest that firms are now less connected to one another through their board interlock network, a trend our data confirm (see Figure WA1 in Web Appendix A1). In failing to find previously established board interlock effects, Chu and Davis (2016) assert that board interlocks no longer serve as conduits influencing the adoption of corporate practices. But our comprehensive data and analyses indicate that the board interlock effect not only exists but has remained remarkably stable in the past 15 years, despite a sparser board interlock network overall. Thus, claims that “established understandings of the effects of board interlocks no longer hold” (Chu and Davis 2016, p. 714) require caution. To the best of our knowledge, we are the first to adopt Gulati, Lavie, and Madhavan’s (2011) theoretical 3R framework to predict and assess heterogeneity in a board interlock context. The findings indicate that the framework can be used effectively to investigate and explain why the board interlock effect varies so much across firms.
Background
Marketing Department Power (MDP)
Most firms maintain a marketing department, along with other functional departments such as accounting and engineering. Depending on the firm, these departments enjoy varying degrees of power, defined as each department's ability to influence other departments and the TMT (Hickson et al. 1971; Pfeffer 1981). Functional departments with greater power have greater control and authority over decisions within the firm (Brass and Burkhardt 1993). Powerful departments also are better positioned to attract scarce firm resources, and they tend to be more efficient and effective at coordinating tasks with those of other departments—a goal that is especially important for marketing departments that frequently need to rely on the collaboration and involvement of other departments to accomplish their activities and tasks (Feng, Morgan, and Rego 2015).
As we noted, MDP has a positive effect on firm performance. Feng, Morgan, and Rego (2015) detail how a powerful marketing department enhances both a firm's return on assets and its shareholder value. Homburg et al. (2015), studying the performance implications of intrafirm distributions of power among marketing, sales, R&D, operations, and finance departments, determine that a powerful marketing department makes the greatest contribution to firm performance. Despite such substantial evidence that MDP positively influences firm performance, in most firms, MDP appears modest (Ambler 2003; Verhoef and Leeflang 2009), and arguably has dwindled in recent years, as our Figure 1 indicates (see also Sheth and Sisodia 2005; Webster, Malter, and Ganesan 2005).
Board of Directors
By law, the board of public firms is their highest-ranking decision-making body, above the TMT in the firm hierarchy (Zahra and Pearce 1989). Board accountability increased with the passage of the Sarbanes–Oxley Act (Linck, Netter, and Yang 2009), such that since 2002, boards have taken a much more active role in organizational affairs (Finkelstein, Hambrick, and Cannella 2009). McKinsey & Co. (2016) estimates that a typical director spends 33 days on board work annually. Active boards fulfill two main roles (Carpenter and Westphal 2001; Finkelstein, Hambrick, and Cannella 2009). First, they deal in administration and internal control, responsible for appointing (and firing) senior executives, setting compensation, evaluating firm strategy, and generally acting as overseers of the business (American Law Institute 1984). Second, the board acts as a boundary spanner, linking the firm to external resources and information (Hillman and Dalziel 2003; Pfeffer and Salancik 1978).
Board Interlocks
Many directors sit on multiple boards (Srinivasan, Wuyts, and Mallapragada 2018). For example, in January 2022, nearly all of the Walt Disney Company's 11 directors served on multiple boards (e.g., Mary Barra served on the boards of both General Motors Company and Disney, Mark Parker sat on the boards of both Disney and Nike). Through its board members, Disney thus is connected with multiple other firms (Figure 2). Such mutual directors create a firm-to-firm network in which each firm's board becomes a node—that is, a board interlock network (Burt 1983; Mizruchi 1996; Palmer 1983).
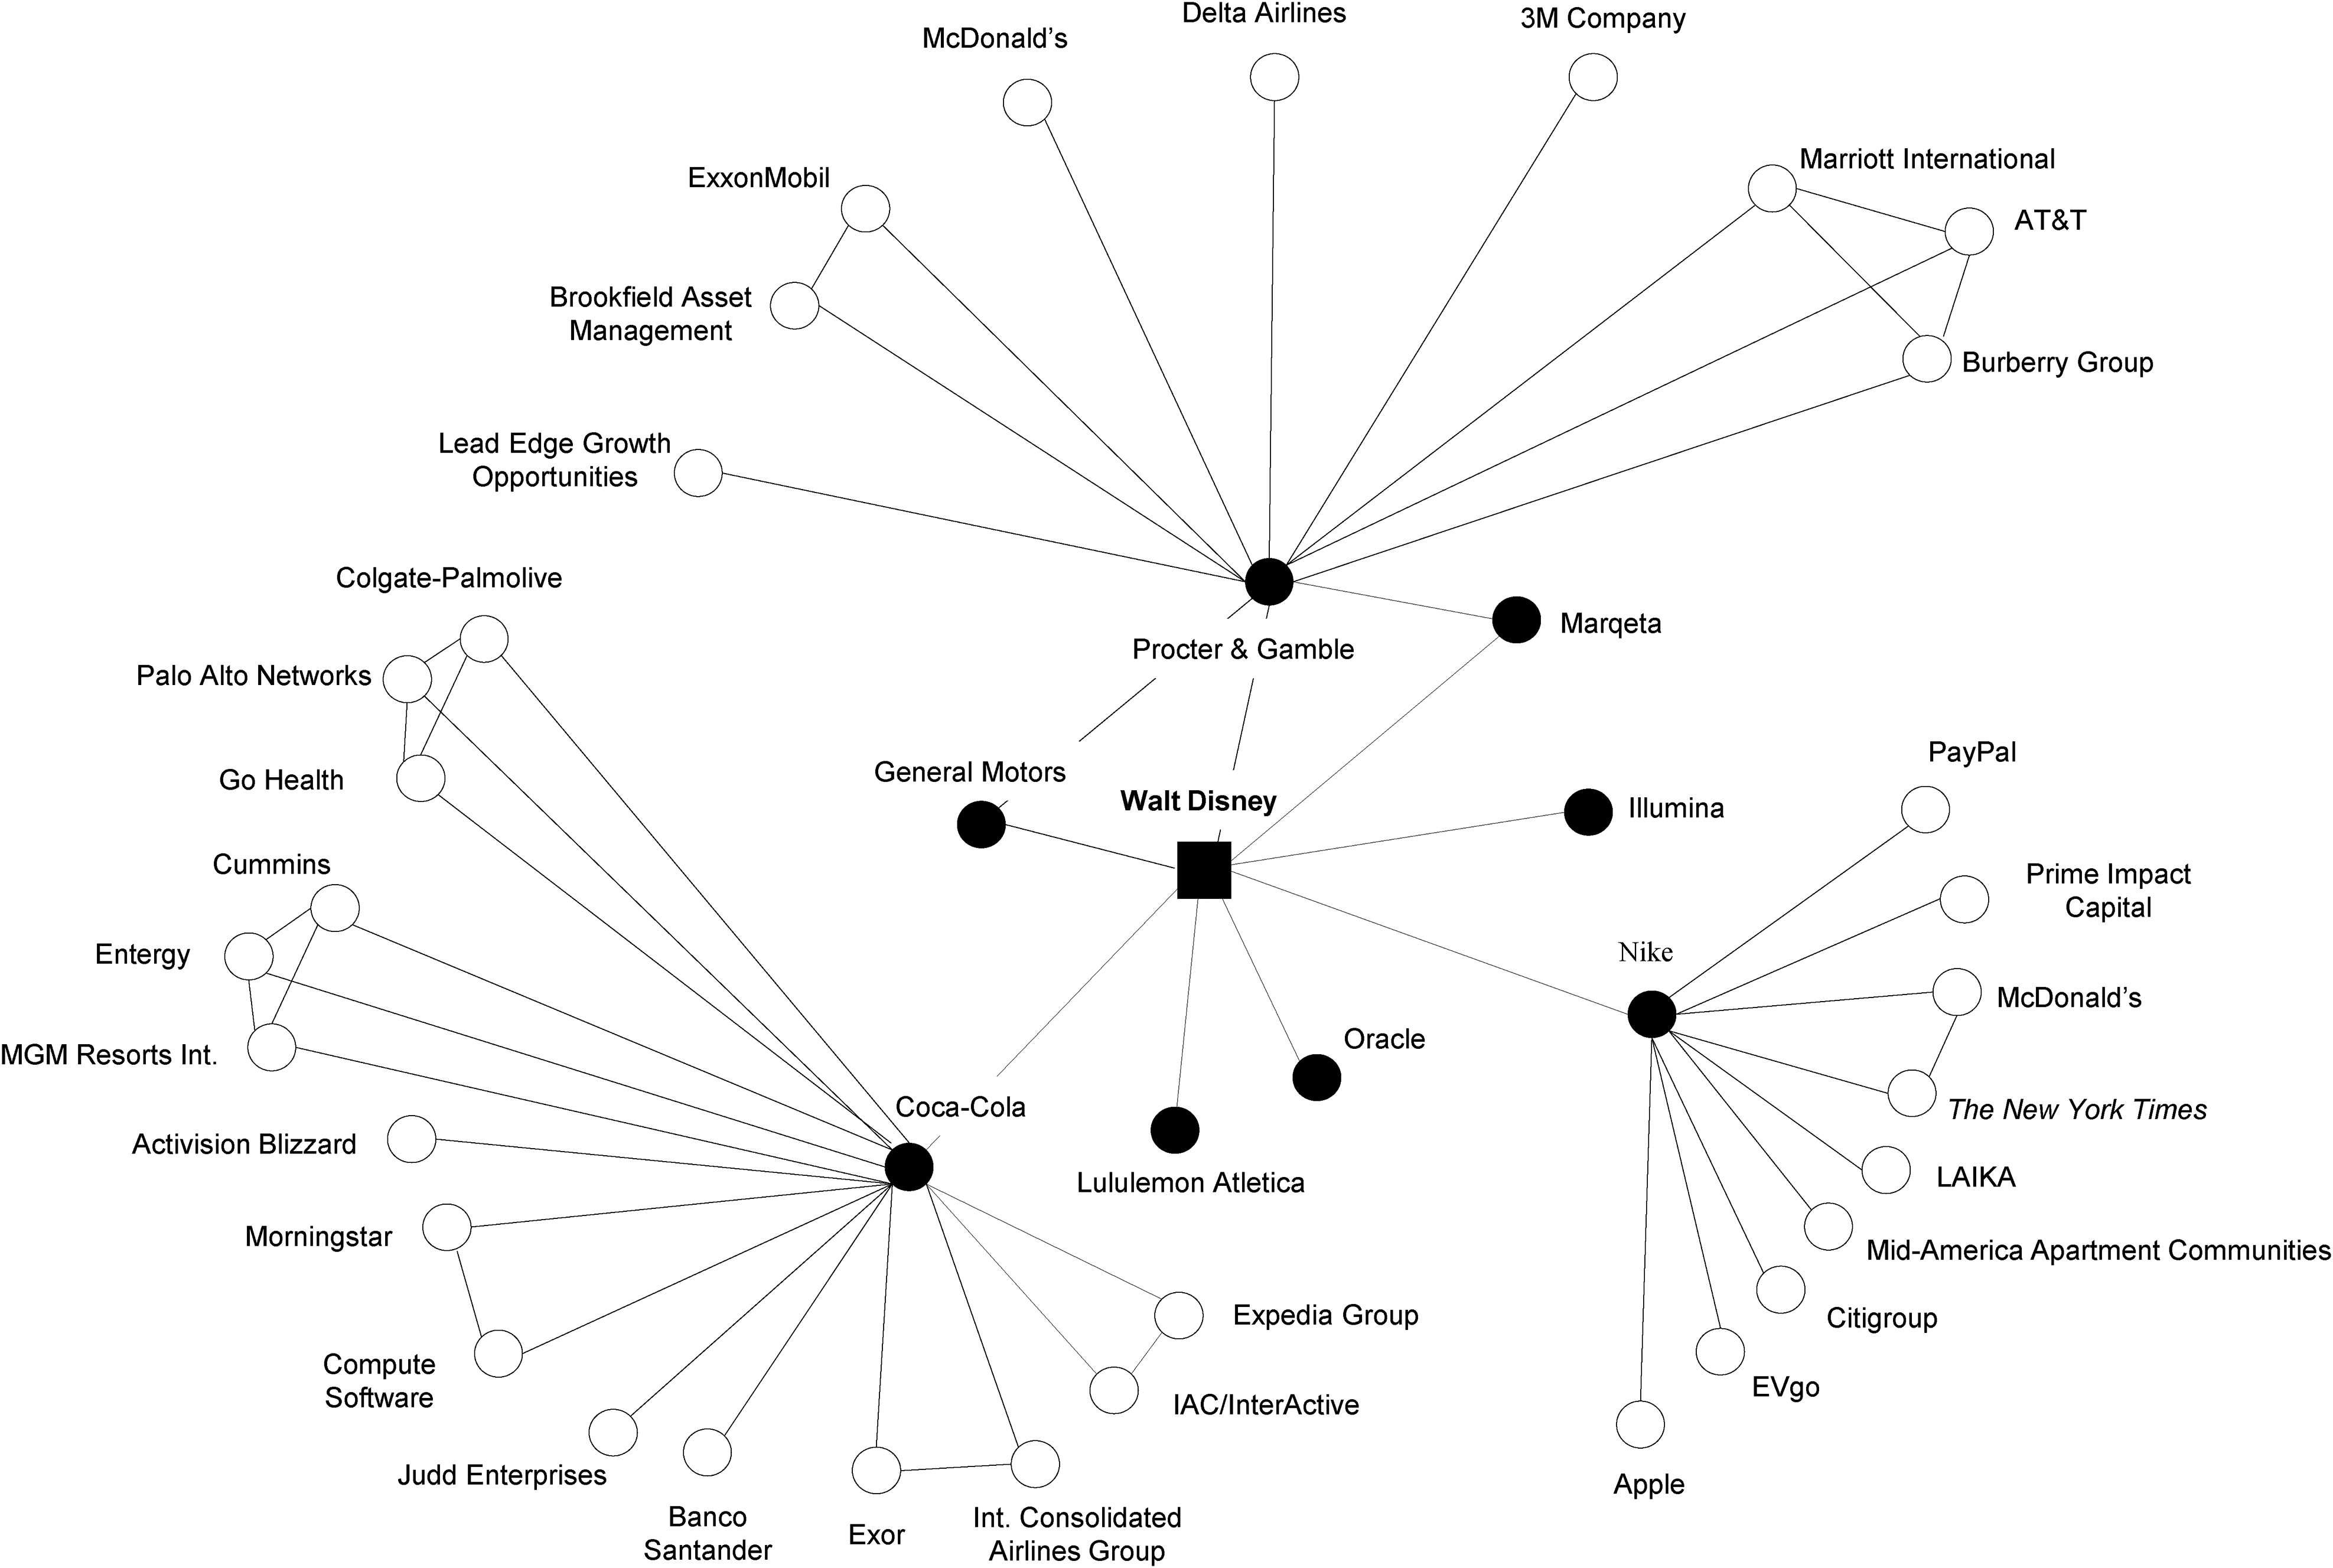
The Walt Disney Company's Board Interlock Network.
Board interlock networks are among “the most studied network[s] in the social sciences” (Chu and Davis 2016, p. 714), partly because they are thought to function as conduits of information, allowing best practices to traverse links throughout the board interlock network and prompt adoption of these practices in board-interlocked firms (Srinivasan, Wuyts, and Mallapragada 2018; Stuart and Yim 2010). For example, in studying firms that managed their earnings between 1997 and 2001, Chiu, Teoh, and Tian (2013) find that other firms are significantly more likely to manage their earnings if they share a director with one of the firms that did so. However, some studies also note that board recruiting practices have changed since the Sarbanes–Oxley Act, such that boards recruit fewer well-connected directors and rely more on existing partners to fill their board seats (Chu and Davis 2016; Withers, Kim, and Howard 2018). As an important consequence of such changes, board interlock networks have grown sparser and more fractured. That is, firms are now less connected, as we illustrate in Figure WA1 in Web Appendix A1, which might limit a board interlock network's capacity to serve as a conduit influencing the adoption of corporate practices (Benton 2021). Supporting this notion, Chu and Davis (2016) examined S&P 1500 firms and board interlock data from 1997 to 2010, revisiting several influential board interlock studies (e.g., Davis 1991). They report that the anticipated adoption of corporate practices through board interlocks had largely disappeared.
Thus, we cannot assert with certainty whether the adoption effect, long embraced in board interlock literature, still occurs. Board interlocks still exist, so some effect seems likely, but if the connectedness of board interlock networks diminish too much, they may become ineffective and irrelevant and hence no longer influence the adoption of corporate practices. In particular, and germane to our research, it is not evident if board interlocks serve as conduits influencing a firm's MDP.
Hypotheses
Board Interlocks and MDP
Information-based explanations of board interlocks suggest that interlocked directors serve as conduits of information and knowledge resources (which we refer to as “information” hereinafter), such that best practices traverse active links in the board interlock network (e.g., Mizruchi 1996). Essentially, the board interlock network serves as a conveyer of information across connected firms (Howard, Withers, and Tihanyi 2017). However, as indicated, Chu and Davis (2016) question this claim on the grounds of the “inner circle” disappearing; we seek to test this claim for MDP. Considering the traditional view (e.g., Davis 1991), and recognizing that board interlocks are still prevalent today (Figure 2), we reason that board members serving on multiple boards transmit marketing-relevant information from one board to the others when pertinent. As such, board interlocks should still serve as conduits influencing a firm's MDP. In turn, we expect two factors to promote this effect: economic rationality (Bikhchandani, Hirshleifer, and Welch 1992) and psychological forces (Asch 1951).
The economic rationality argument rests on an established premise that public firms face a growth imperative (Gordon and Rosenthal 2003), which continues to be a pressing issue for boards (Deloitte 2011; McKinsey & Co. 2016; Whitler, Krause, and Lehmann 2018). Such an imperative brings organic growth to the forefront of boardroom discussions (Bahadir, Bharadwaj, and Parzen 2009). As noted by Spencer Stuart (2016, p. 4), “low prospects for growth as well as the unpredictable economic outlook are what keep board members awake at night.” These considerations should drive greater embrace of marketing as an engine for growth. Indeed, the importance of marketing for growth is affirmed by The CMO Council and Deloitte (2016) study that suggests that corporate boards expect marketing departments to drive growth. O’Brien and DeHaas (2017, p. 76) go a step further to establish the link between marketing and corporate boards by suggesting that the marketing department and chief marketing officer (CMO) “can strategically contribute to the board by establishing a unified approach to using the brand as a lever for growth while also more quickly managing brand and reputation risks across customers, business partners, employees, and other stakeholders.” Thus, public firms face a growth imperative, the corporate board is cognizant of this imperative, and it recognizes marketing as a potentially vital function for fulfilling the imperative.
To develop an economic rationale for the link between MDP in a focal firm and MDP in its board-interlocked firms, we build on the resource dependence perspective (Pfeffer and Salancik 1978) and the associated knowledge-based view of the firm (Grant 2006). From a resource dependence perspective, understanding the determinants of organic growth represents information (i.e., knowledge resource), and the TMT is expected to share this information with its board. In turn, board members receiving the information likely transmit it to the other boards on which they serve (i.e., board-interlocked firms). The research cited above (Grant 2006; Pfeffer and Salancik 1978) suggests, on one hand, that the focal firm would seek to rely on marketing to deliver on the growth imperative and, on the other hand, that marketing activities should yield the desired outcomes. Hence, it is not only the information that marketing is important for organic growth that is likely transmitted by the board interlock network, but also the potential evidence, either anecdotal with associated “war stories” or quantifiable with associated effect sizes, that gets shared. If marketing activities do not yield the desired growth outcomes, that knowledge and associated evidence seems certain to be shared among top managers, board members, and board-interlocked firms too. From an economic rationality perspective, we thus argue that MDP in a focal firm should be positively associated with the MDP in board-interlocked firms.
The psychological forces perspective also suggests that the board interlock network should influence a firm's MDP. Actors in groups tend to conform in their behavior (Asch 1951), especially if they recognize an ingroup of close associates (Gino, Ayal, and Ariely 2009). Board-interlocked firms might represent different industries but still constitute an ingroup, created by their mutual directors and shared private information (Chiu, Teoh, and Tian 2013). These ingroups tend to work cohesively and share information freely. Considering the importance of growth, we expect cohesive ingroups to share information about marketing as a potential engine to power growth. Thus, MDP in the focal and board-interlocked firms should be positively associated. In summary, we propose:
Even if a firm's interlocks with other boards provide opportunities to access information, some firms might have more opportunities to access and act on the information than others, which would increase the value a firm obtains from its board interlock network and positively moderate the predicted effect. Building on Gulati, Lavie, and Madhavan’s (2011) 3R framework of mechanisms that underlie interorganizational networks, we propose that the reach and richness of a firm's board interlock network, as well as the receptivity of the firm's TMT and board to information furnished by the board interlock, constitute three fundamental moderators of the effect predicted in H1. We elaborate on these three moderators next and summarize their role in Table 1 (which is akin to Table 2 in Gulati, Lavie, and Madhavan [2011]).
The Moderating Role of Reach, Richness, and Receptivity in a Board Interlock Network.
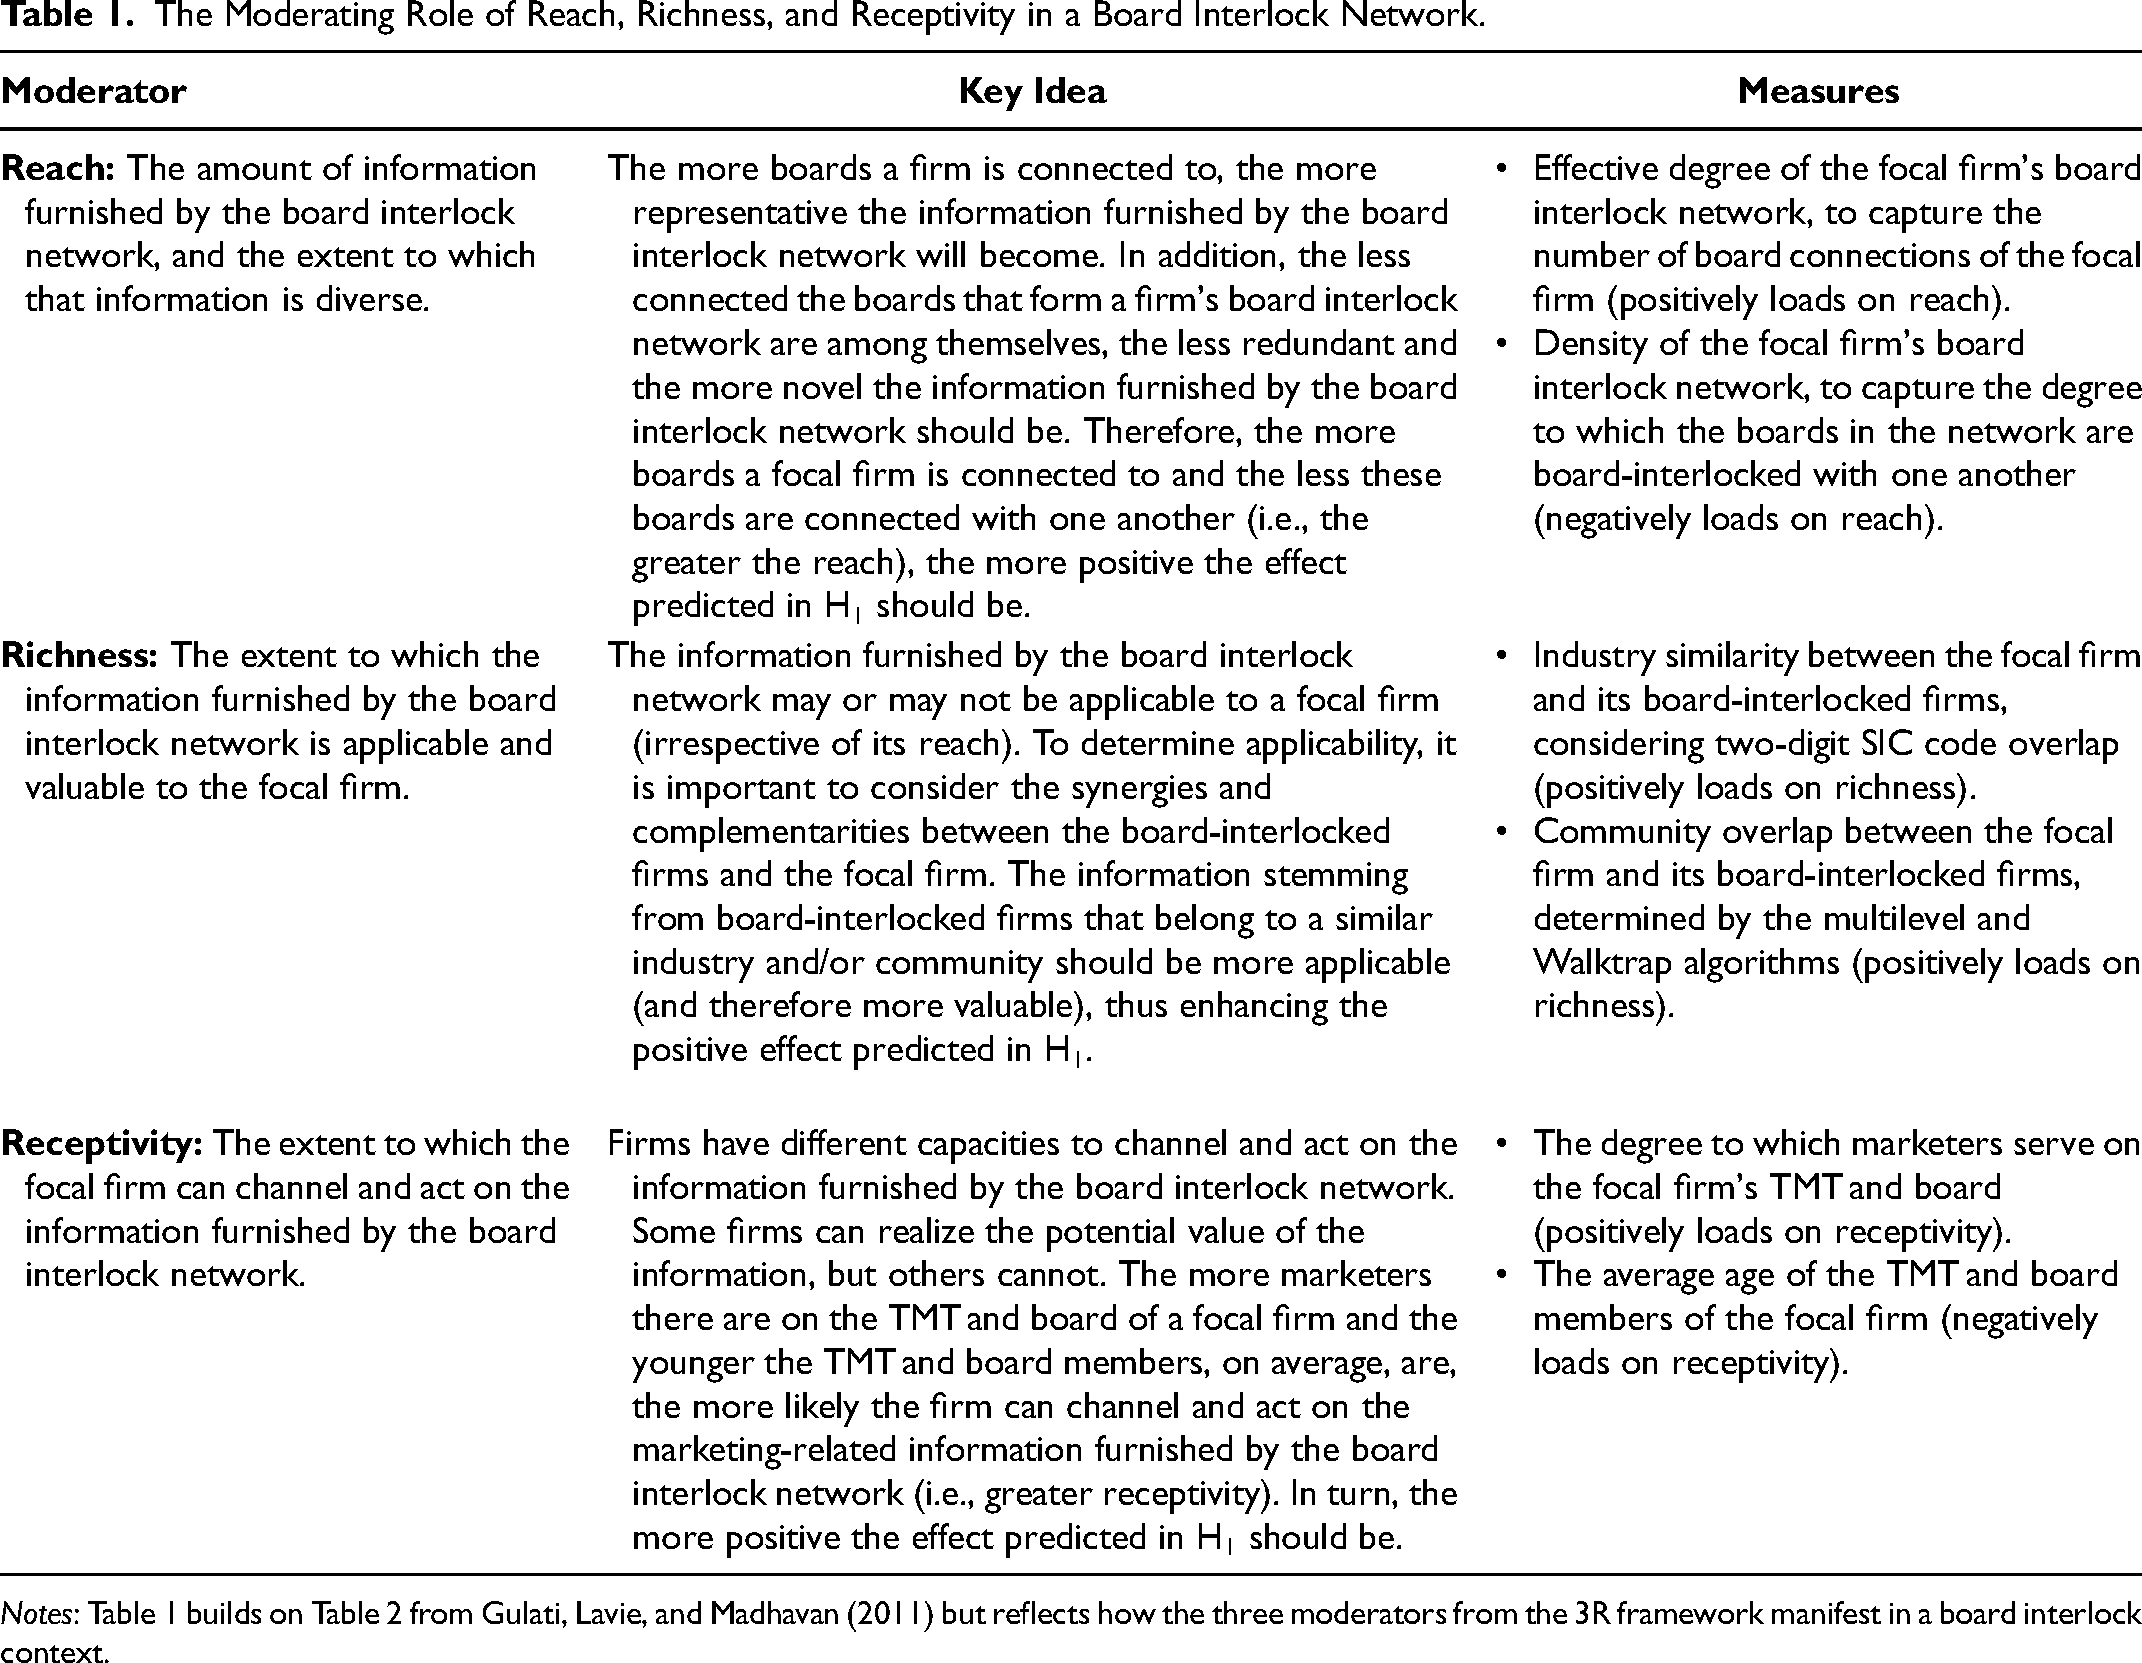
Notes: Table 1 builds on Table 2 from Gulati, Lavie, and Madhavan (2011) but reflects how the three moderators from the 3R framework manifest in a board interlock context.
Impact of MDP in Board-Interlocked (BI) Firms and Control Variables on MDP in Focal Firms (DV = MDP in Focal Firms).
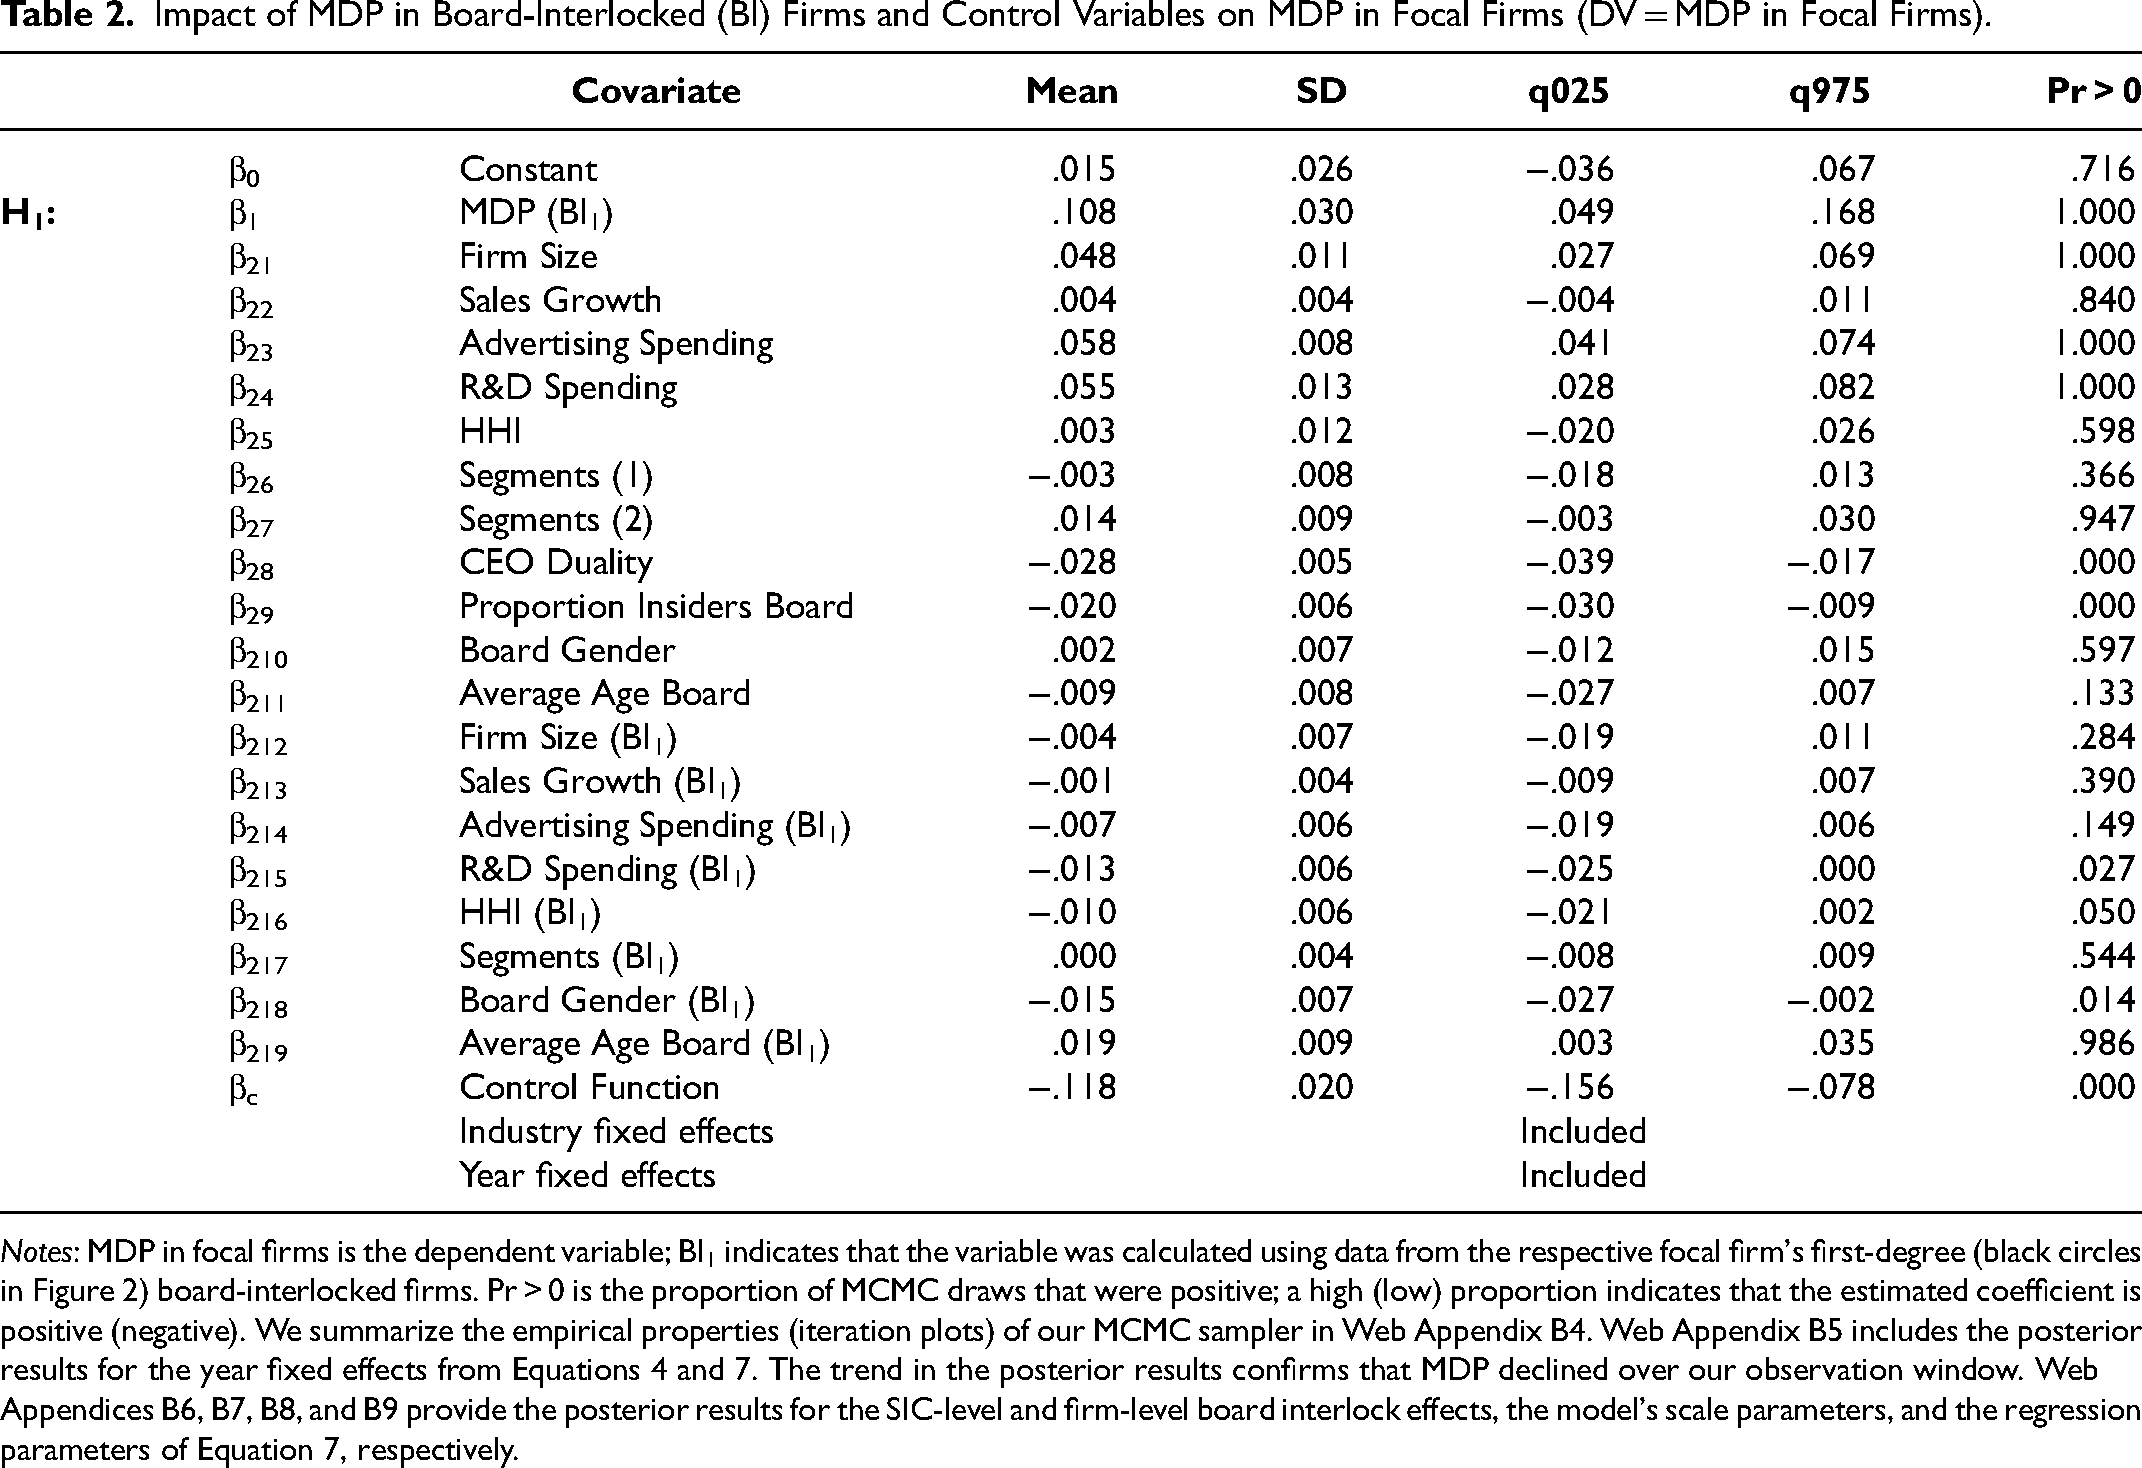
Notes: MDP in focal firms is the dependent variable; BI1 indicates that the variable was calculated using data from the respective focal firm's first-degree (black circles in Figure 2) board-interlocked firms. Pr > 0 is the proportion of MCMC draws that were positive; a high (low) proportion indicates that the estimated coefficient is positive (negative). We summarize the empirical properties (iteration plots) of our MCMC sampler in Web Appendix B4. Web Appendix B5 includes the posterior results for the year fixed effects from Equations 4 and 7. The trend in the posterior results confirms that MDP declined over our observation window. Web Appendices B6, B7, B8, and B9 provide the posterior results for the SIC-level and firm-level board interlock effects, the model's scale parameters, and the regression parameters of Equation 7, respectively.
Reach
Gulati, Lavie, and Madhavan (2011, p. 212) define reach as “the extent to which the organization's network of ties connects it to distant and diverse partners.” In board interlock networks, firms with wide-ranging connections are in a better position to access novel information (Burt 1992). Therefore, key facets of reach for board interlock networks are the amount of information furnished by the network (Wasserman and Faust 2009) and the diversity of that information (Burt 1992). As the amount and diversity of the information furnished by the board interlock network increases, so does the reach of the focal firm.
A network's structure is an important determinant of network actors’ ability to gain access to information (Granovetter 2005), and we reason that reach can be conceptualized according to the structural properties of the board interlock network. In particular, the extent to which a firm's board interlock network connects it to other firms’ boards should determine the amount of information the board-interlocked firms have to offer (Wasserman and Faust 2009). Moreover, the extent to which a focal firm's interlocked boards are themselves board-interlocked with one another (i.e., are cohesive) should determine the diversity of the information that interlocked boards provide (Burt 1992). Thus, we consider two network characteristics that should inform the reach of a focal firm's board interlock network: (1) the number of board connections to capture the amount of information and (2) the cohesiveness of board connections to capture the diversity of information.
Number of board connections (amount of information)
Some firms are connected to more boards and, hence, firms through their board interlock network than others. Thus, firms with more board connections should have higher reach. In an MDP context, when a firm is connected to many boards and observes that most of the connected firms increase MDP, this focal firm likely considers following suit, due to the economic and psychological forces we discussed previously. In contrast, if a firm is only connected to a few boards, information reaching it through its board interlock network will be less representative and more ambiguous, ultimately rendering the information less impactful.
Cohesiveness of board connections (diversity of information)
If the boards to which a firm is connected are themselves more connected, the board interlock network becomes more cohesive, which implies greater homogeneity among the boards in the network (cf. Wasserman and Faust 2009). Collins (1988) argues that the reason highly cohesive subgroups of networks have homogenous beliefs is because they tend to be more isolated. Such isolated network subgroups tend to have access to similar information (Burt 1992; Granovetter 1973). In turn, the information the focal board receives tends to lack diversity and instead grows redundant and nonnovel (Podolny 2001). Thus, as the boards to which a firm is connected become more connected among themselves, reach of the firm should decrease. In an MDP context, if board interlock network cohesiveness is high, boards that are part of the network already likely are well aligned in their thoughts about the appropriate level of MDP and also receive little novel information about whether they should alter this level. In contrast, if the focal firm's board interlock network is less cohesive, its connected boards might offer novel, diverse information about MDP.
In summary, firms that have more board connections and whose interlocked boards are less connected among one another (i.e., are less cohesive) should be able to reach more (novel) information, which should increase the positive effect predicted in H1. Stated formally:
Richness
Richness refers to the extent to which the information furnished by the board interlock is applicable and valuable to the focal organization (Gulati, Lavie, and Madhavan 2011). A key aspect of richness is that the value of information furnished by board-interlocked firms can differ substantially across the firms, which also is an important distinction between reach and richness. That is, a given reach network position is conceptualized as being of equal value to network actors, but richness is “in the eyes of the beholder” (Gulati, Lavie, and Madhavan 2011, p. 2145), so whether the given furnished information is “rich” depends on the firm. Even if two firms had similar reach positions, one firm might enjoy a richness-based advantage because the given information is applicable and hence valuable to it, whereas it is not to the other firm.
To assess the richness of a firm's network resources, we must consider possible synergies and complementarities that can emerge through external ties (Lavie 2006). Gulati, Lavie, and Madhavan (2011, p. 214) define richness as “the value of external resources that complement … an organization's own internal resources.” Network ties with similar backgrounds are usually more credible, and the information thus obtained is often more relevant to the firm (Haunschild and Beckman 1998). In turn, we consider two network characteristics that should inform the richness of information conveyed through the board interlock network: (1) industry similarity and (2) community overlap. As these characteristics increase, so should the richness of the information furnished by the board interlock network.
Industry similarity
By law, board members of for-profit firms are not permitted to serve on competitors’ boards (American Law Institute 1984), but some board-interlocked firms clearly are more closely related to the focal firm than others, such that they likely offer more synergistic value and superior complementary insights. For example, firms operating in a similar industry are more likely to be recognized as an ingroup member, evoking the psychological forces we discussed previously, and have pertinent economic information that would be viewed as more useful and prescriptive too (Haveman 1993).
To illustrate, consider Harmonic, a video streaming and broadband services firm. In 2015, it had board interlocks with several other firms, among them Ciena (which offers networking systems, services, and software) and Viavi Solutions (which offers network, communications, and electronics technology). Both connections operate in a similar industry. But for Kapstone Paper & Packaging, another sample firm from 2015, this pulp and paper company had no board interlock overlaps with firms that operate in similar industries. Rather, it was, for example, connected to the Movado Group, a U.S. luxury watchmaker, and Kemper, an insurance company. Such firms necessarily pursue different strategies, offer different products, and serve distinct markets. Thus, for Harmonic, MDP-related information from Ciena and Viavi would likely be more synergistic and complementary than MDP-related information that Kapstone Paper & Packaging might obtain from its board interlock. Accordingly, we predict that MDP-related information obtained from connected boards that operate in similar industries is more applicable and valuable than MDP-related information obtained from board-interlocked firms that operate in dissimilar industries.
Community overlap
Similar to clusters in data, communities in networks are usually latent (Yang, Algesheimer, and Tessone 2016). However, they can be detected by algorithms, and firms belonging to the same community have been found to exhibit similar traits and characteristics, compared with firms belonging to other communities (Piccardi, Calatroni, and Bertoni 2010; Radicchi et al. 2004). In the context of board interlocks, Heemskerk, Daolio, Tomassini (2013) report that board interlock communities consist of firms that are similar in their geographic location, industry type, and firm size. Our own community analyses, reported in Web Appendix A2, yield similar insights. Thus, akin to our logic regarding industry similarity, MDP-related information from firms that belong to the same community is likely more applicable than MDP-related information from firms that belong to a different community.
In summary, because MDP-related information furnished by board-interlocked firms that operate in an industry and community similar to those of the focal firm should be more applicable, we predict that these board connections constitute a more valuable, or richer, resource (Gulati, Lavie, and Madhavan 2011), which should increase the positive effect predicted in H1. We propose:
Receptivity
Receptivity represents the extent to which the firm can channel and act on information furnished by its board interlock network. A key premise is that firms have different levels of absorptive capacity (Cohen and Levinthal 1990) for the information furnished by their networks (Gulati, Lavie, and Madhavan 2011; Lane and Lubatkin 1998; Tsai 2001) and thus varying capacities to channel and leverage the information acquired. Reach and richness pertain to the board interlock's potential value; receptivity captures the degree to which that value can be acted on by the firm. Again, we consider two firm characteristics that likely inform a firm's receptivity to MDP-related information conveyed through the board interlock network: (1) whether or not a marketer is on the TMT and board and (2) average age of the TMT and board members. Receptivity should increase when more marketers are on the TMT and board and when the TMT and board members are younger.
Marketers on the TMT and board
Between 25% and 40% of publicly traded firms in the United States have a marketer on their TMT (Germann, Ebbes, and Grewal 2015; Nath and Mahajan 2008), so the majority of U.S. firms lack such a person. Moreover, Whitler, Krause, and Lehmann (2018) find that only about 16% of S&P 1500 firms’ boards include marketers, and Daum and Welch (2013) report that only 38 of 9,800 board members for Fortune 1000 firms are active marketing leaders. Marketing-experienced board members thus appear rare, even more so than marketing TMT members. Without marketers among their leadership, firms have less capacity to absorb MDP-related information provided by their board interlock network. Indeed, prior research has established that firms without a marketer on the TMT tend to view the marketing function as less critical (e.g., Germann, Ebbes, and Grewal 2015; Nath and Mahajan 2008; Webster, Malter, and Ganesan 2005), and board members who lack marketing experience sometimes even argue that marketing is not value-creating (Whitler 2016; Whitler, Krause, and Lehmann 2018). Furthermore, firms without marketers as leaders tend to pursue cost leadership as opposed to differentiation strategies (McAlister et al. 2023), which give precedence to throughput (e.g., accounting, finance) as opposed to output functions (Hambrick and Mason 1984). Thus, firms without marketers among their leaders are likely less receptive to MDP-related information provided by their board-interlocked firms.
Average age of TMT and board members
Top managers and board members vary in terms of their flexibility and resistance to change. While multiple variables might explain this variation, age is directly observable and has been found to be an important predictor. For example, Wiersema and Bantel (1992) report that firms run by younger top managers are significantly more likely to undergo strategic change, whereas firms with older top managers engage in substantially less change. Moreover, Hambrick, Geletkanycz, and Fredrickson (1993, p. 403) report that an executives’ tenure in an industry (which usually correlates with age) is a strong determinant of commitment to the status quo and a “belief in the enduring correctness of current policies and profiles.” As members spend more time with a firm, they become convinced of the correctness of its ways of doing things. Even in the face of pressures stemming from the board interlock, older executives may lack the conviction to change or provide the leadership needed to act on MDP-related information furnished by their boards.
Therefore, firms with marketers on the TMT and board, as well as younger TMT and board members, should exhibit greater receptivity and leverage the MDP-related information acquired through their board interlock network more. As this receptivity increases, so should the positive effect predicted in H1. Stated formally:
Figure 3 summarizes our conceptual framework.
Data and Measures
Board Interlock Networks
To construct the board interlock network and calculate MDP scores, we use a data set from Equilar, Inc., provided in part by the Wharton Customer Analytics Initiative. The data set includes detailed information (e.g., board and TMT members, titles, compensation) about firms listed in the Russell 3000 Index and TSX composite indices for 2006–2021. We construct a separate board interlock network for each year and consider all directors that served on a firm's board for at least six months during a given year.
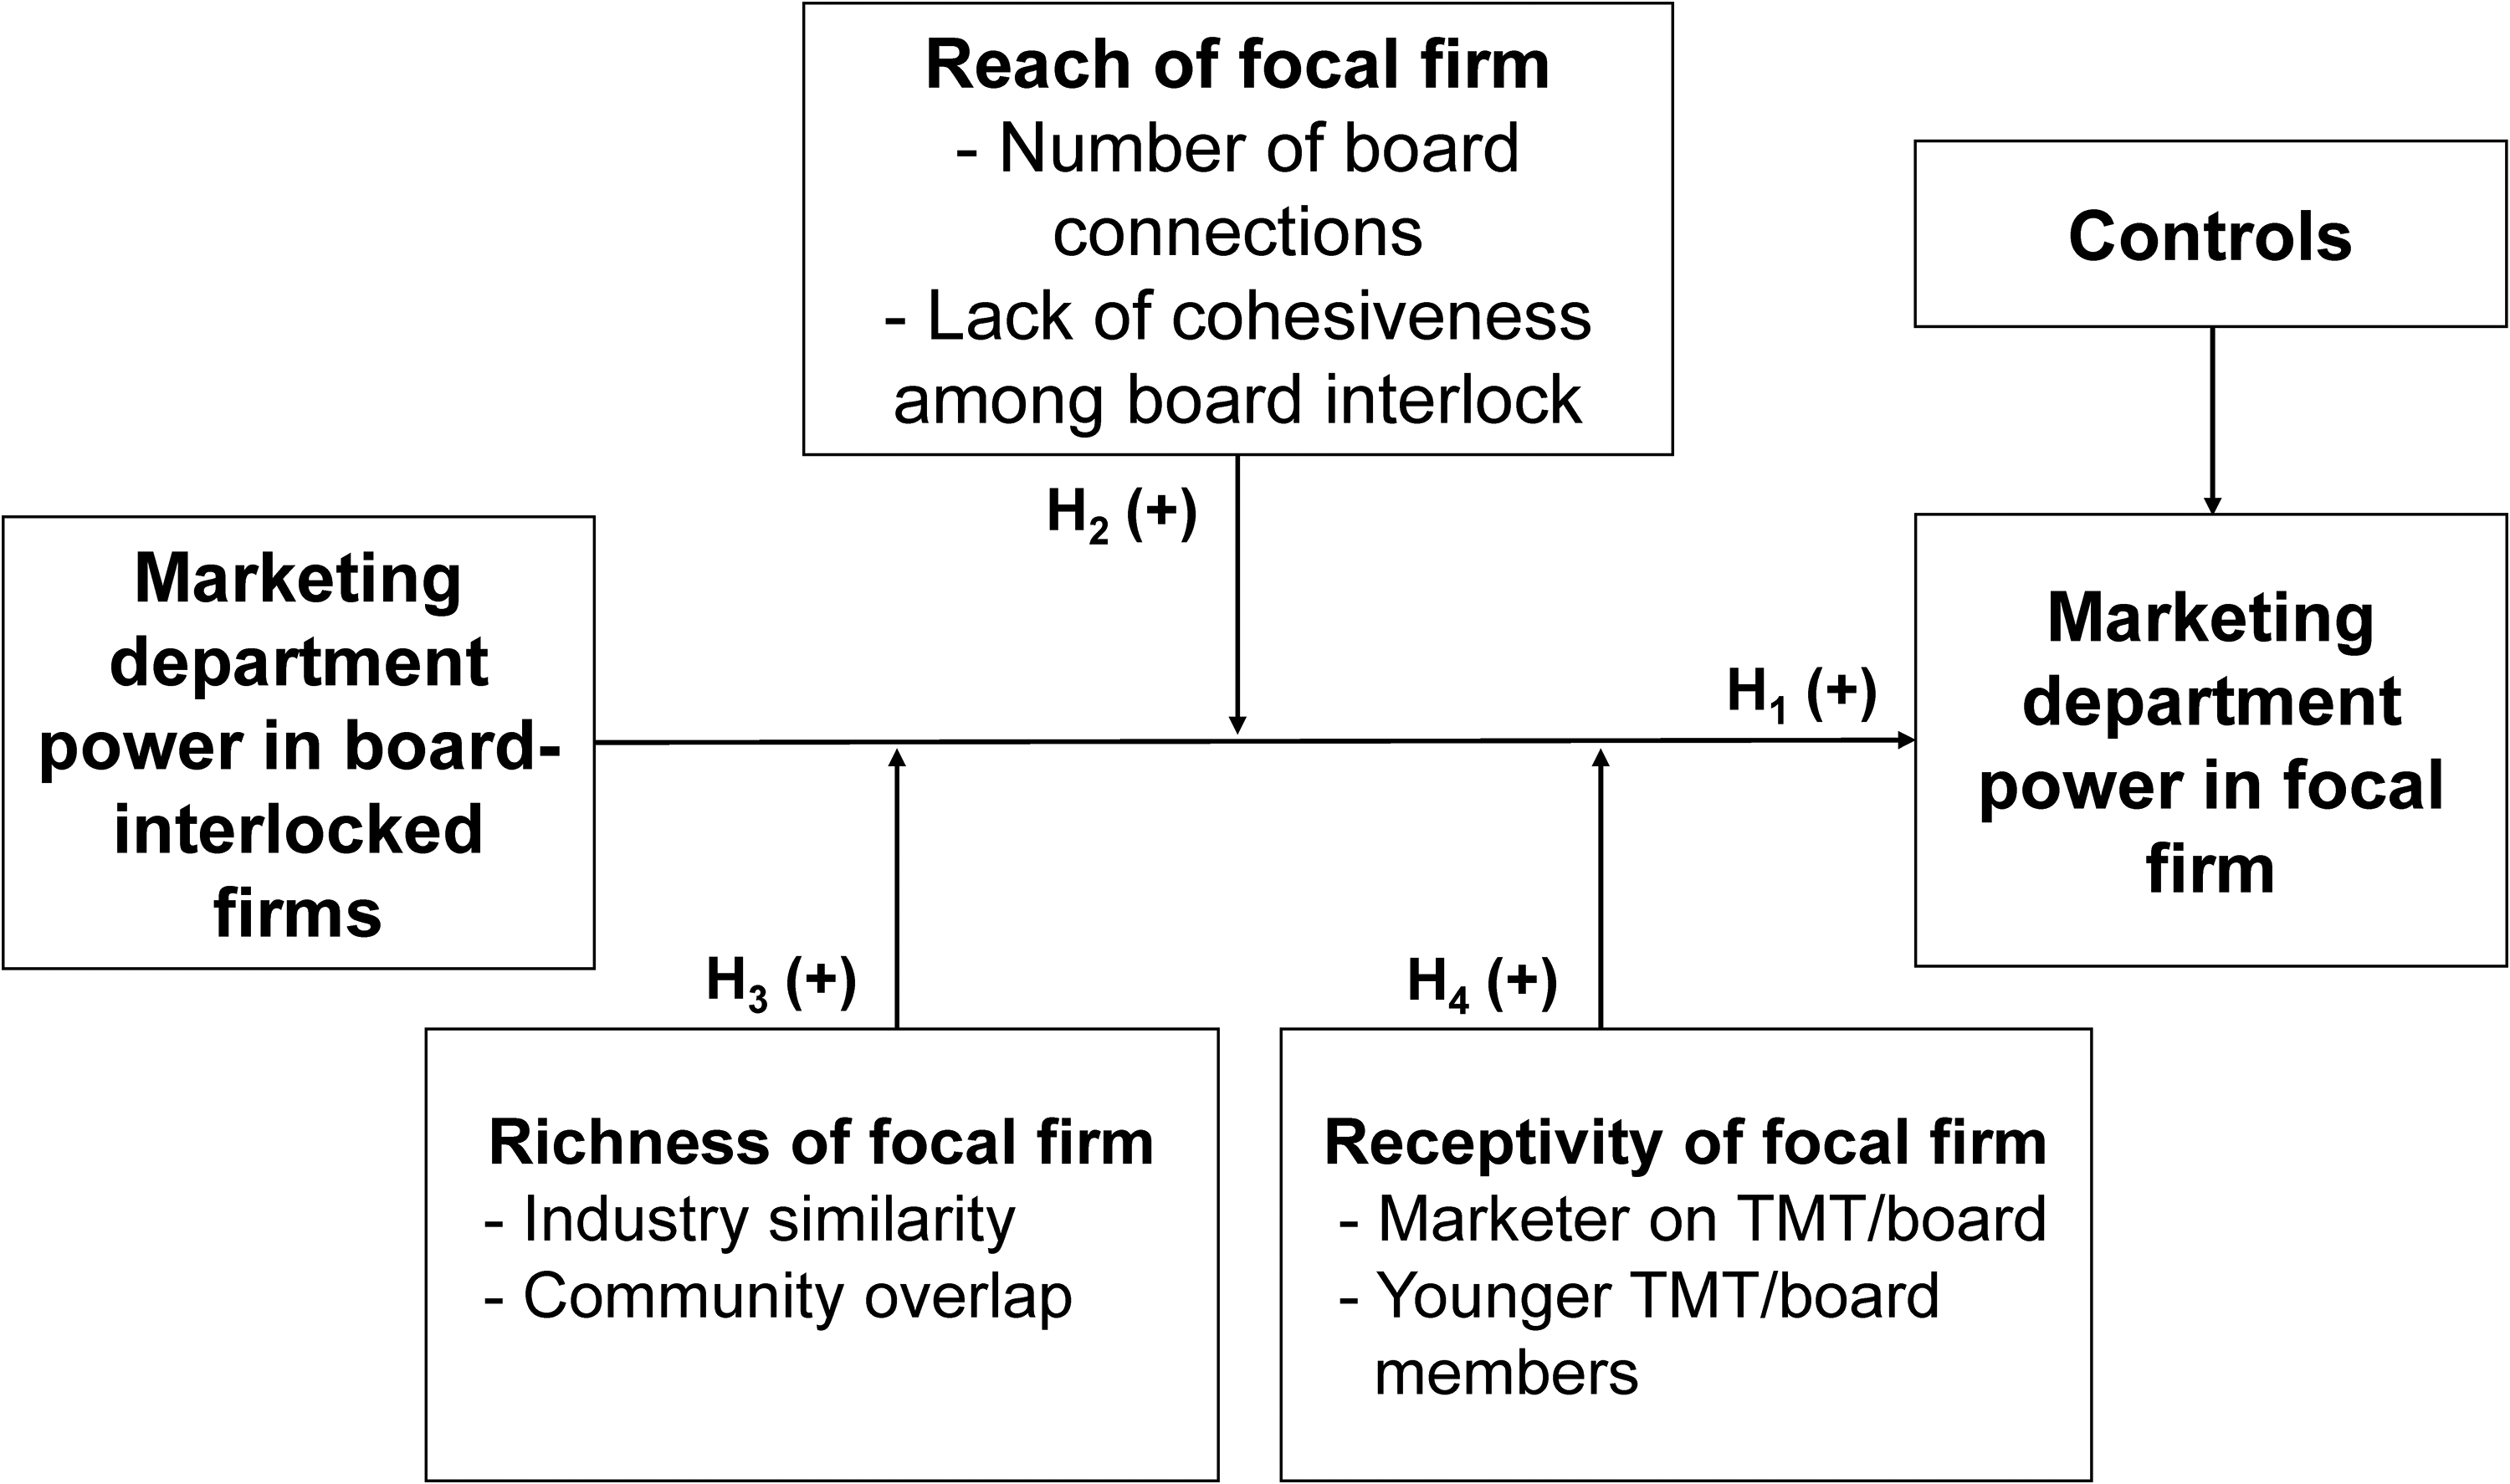
Conceptual Framework.
Marketing Department Power (MDP)
Different approaches can capture the marketing department's power within the firm. For example, Verhoef and Leeflang (2009) use a survey-based approach (see also Homburg et al. 2015; Homburg, Workman, and Krohmer 1999). We assess the board interlock network on the basis of archival data, which makes it difficult to employ surveys to measure MDP. Nath and Mahajan (2008) propose that the presence of a CMO is an indicator of MDP (see also Boyd, Chandy, and Cunha 2010; Germann, Ebbes, and Grewal 2015). Similarly, Feng, Morgan, and Rego (2015) validated measure of MDP relies on the department's representation in the TMT, in accordance with an upper echelon perspective (Hambrick and Mason 1984). These authors make a compelling case that marketing's influence on strategy should increase as its power within the firm increases. They also confirm the validity of their TMT-based MDP measure. Accordingly, we follow Feng, Morgan, and Rego’s (2015) approach and calculate the following indicators of MDP: (1) the number of marketing executives 2 in the TMT, divided by the total number of TMT executives; (2) marketing TMT executives’ compensation relative to the total TMT executives’ compensation, considering both executives’ base salary and total compensation; 3 (3) the hierarchical level of the highest-ranking marketing TMT executive's title; (4) the cumulative hierarchical level of all marketing executives in the TMT; and (5) the number of responsibilities reflected in marketing TMT executives’ job titles, based on the length of their titles. These indicators naturally exhibit high intercorrelations, so, following Feng, Morgan, and Rego, we extract the first principal component underlying the indicators to represent MDP. The first principal component explains 89.3% of the variation in the indicators, 4 and we standardize it across all firm–year observations to have mean 0 and standard deviation 1.
Reach
Number of board connections (amount of information)
The number of board connections of a focal firm in the board interlock network defines its network degree (Van den Bulte and Wuyts 2007; Wasserman and Faust 2009). Similar to Borgatti (1997), we use effective degree as our board interlock network degree measure. The effective degree captures the number of board interlock ties the focal firm has with other firms while controlling for redundancy (i.e., extent that connections connect to one another as well). 5 Both versions are commonly used in resource dependence theory studies (e.g., Beckman, Haunschild, and Phillips 2004), and several studies link these measures to theoretical information sharing mechanisms (e.g., Ahuja 2000; Beckman and Haunschild 2002; Davis 1991).
Cohesiveness of board connections (diversity of information)
Similar to Wasserman and Faust (2009), we use the density of the focal firm's ego board interlock network to capture cohesiveness. Following convention, we calculate density as the number of board interlocks present in a focal firm's board interlock network, divided by the total number of board interlocks that could be present. A firm whose board-interlocked firms are all connected has a density of 1; if none of the firm's board-interlocked firms are connected, the density is equal to the inverse of its number of board interlock connections. Although (effective) degree and density correspond to different types of information benefits, 6 such that effective degree captures information volume whereas density captures information diversity, the two measures are highly correlated (r = −.79; see the correlation matrix in Web Appendix A5). Thus, to account for the likely multicollinearity issues in our analysis, we included these two measures in a principal component analysis, which revealed that they both load on the same principal component, with loadings of .884 for effective degree and −.988 for density. Therefore, we include this component in our subsequent moderation analysis, instead of the individual measures. Firms with high effective degree and low density score high on the component, indicating high reach. In contrast, firms with low effective degree and high density earn a low score, signaling low reach. As predicted in H2, we expect positive board interlock network effects to grow stronger as the focal firm's score on the component (i.e., reach) increases.
Richness
Industry similarity
As demonstrated by Haunschild and Beckman (1998), we measure industry similarity using overlap in the two-digit Standard Industrial Classification (SIC) code between a focal firm and its board-interlocked firms, according to the industry classification provided by Equilar. For each focal firm, we compute two-digit SIC code overlap as the ratio between the number of connected firms with the same two-digit SIC code as the focal firm and its total number of board-interlocked firms.
Community overlap
With both the multilevel and Walktrap algorithms, we capture community overlap in the board interlock networks (Yang, Algesheimer, and Tessone 2016). These algorithms detect communities on the basis of the interconnectivity and weights of the links in the full board interlock network. In additional analyses (reported in Web Appendix A2), we find that firms within communities tend to be geographically closer and operate in more similar industries than firms in randomly created communities.
Although the two-digit SIC code and community overlap measures capture distinct aspects of information richness, both measures (along with degree and density) refer to the board interlock network; as is commonly the case with network-based variables, they tend to be empirically correlated, and in our case, the absolute correlations across the four measures range from .03 to .79. To be consistent, we therefore included all four measures in the aforementioned principal component analysis, which indicated that the two reach measures loaded on the first component, whereas community overlap was the only measure that loaded strongly on the second component (loading = .981), and two-digit SIC code overlap was the only measure that loaded strongly on the third component (loading = .991). We relied on Varimax rotation to aid in the interpretation of the components. Thus, along with the component capturing reach, we include two additional components to capture the two richness measures. Per H3, we expect the positive board interlock network effect to strengthen as a focal firm's score on the two richness components increases.
Receptivity
Marketers on the TMT and/or board
We use the Equilar data to determine if a marketer serves on a focal firm's board and/or TMT. We quantify the measure as a categorical variable, equal to 1 if the focal firm has a marketer on the TMT, the board, or both (and 0 otherwise).
Average age of TMT and board members
We calculate the average age of a focal firm's board and TMT using data provided by Equilar. Consistent with H4, we expect the predicted positive board interlock network effect to strengthen if the focal firm has a marketer on the board and/or TMT and as the top managers trend younger, resulting in greater receptivity to information furnished by the board interlock network.
Control Variables
We include several firm- and industry-specific covariates to control for other factors that might affect MDP. Unless otherwise noted, the control variables come from COMPUSTAT. First, larger firms often have larger TMTs, which increases the likelihood of a marketer being present on the TMT (Boone et al. 2007). We use the number of employees as a proxy for firm size. With this variable, we also can control for explanations that draw on the tendency of leading firms to initiate organizational change (Nath and Mahajan 2008), such as adjusting the level of power of the marketing department. Second, noting Nath and Mahajan's (2008) finding that a firm's advertising and R&D spending significantly increase the likelihood that it has a marketer on the TMT, we include each firms’ advertising and R&D spending as control variables. They take zero values if they are not reported in COMPUSTAT (Henderson, Miller, and Hambrick 2006). Third, firms that operate in less competitive industries may experience faster growth and have less need to increase MDP, so we include sales growth and the Herfindahl–Hirschman index (HHI) to control for competitive intensity. We measure HHI by calculating the sum of the squared market shares of all firms in an industry (i.e., four-digit SIC code; Feng, Morgan, and Rego 2015).
Fourth, we include a control variable to capture the influence and corporate board involvement of the focal firm's CEO. From the Equilar data, we obtain a categorical variable that captures whether the focal firm's CEO also serves as the chairperson of the board. A CEO with this dual role is generally quite powerful (Krause, Semadeni, and Cannella 2014), which can reduce the power and influence of any individual department, including marketing. Fifth, using Equilar data, we capture how many board members are inside directors (i.e., proportion of inside directors), such that they serve in another capacity (e.g., chief financial officer [CFO], chief operating officer [COO]) in the firm. Other than the CEO, the CFO and COO are the roles most likely to be appointed to the board (Board Director 2023). As the number of inside directors increases, the voices of functions other than marketing are better represented, which could diminish MDP.
Sixth, following Feng, Morgan, and Rego (2015), we control for the number of business units (obtained from COMPUSTAT's segments database) to control for possible effects of strategic business unit–level versus corporate-level differences in the marketing organization and thus MDP (Arrfelt et al. 2015; Misangyi et al. 2006). Seventh, using Equilar data, we include demographics of the board members (age and gender, measured as the proportion of male board members); younger and female board members may be more open to increase MDP in firms. Eighth, the marketing function is more prominent in some industries (e.g., consumer packaged goods) and less so in others (e.g., steel processing). Thus, we control for industry fixed effects with four-digit SIC code dummies. Ninth, using year fixed effects, we control for macroenvironmental factors or exogenous shocks that might affect aspects such as MDP within firms (Germann, Ebbes, and Grewal 2015). Tenth, we also include these control variables for the board-interlocked firms (by taking the average across a focal firm's board-interlocked firms), except for the CEO duality, proportion of inside directors, and industry classification control variables. Finally, we log-transform the following variables to account for skewness in the data: firm size, advertising spending, R&D spending, sales growth, and HHI.
Sample Details
We construct the board interlock networks, MDP scores, and covariates for 9,368 firms per sample year on average. 7 Of these firms, approximately 34% were isolates, that is, not board-interlocked with other firms, so we exclude them from our subsequent analyses. Moreover, COMPUSTAT data were missing for about 33% of the firms, so we exclude those firms from our final panel data set as well. 8 Dropping isolates and firms not tracked by COMPUSTAT left us with 6,008 firms from 411 industries (four-digit SIC code). The dependent variable (focal firm's MDP) refers to the 2007–2021 time frame, and our independent variables (including those based on the board interlock network) span 2006–2020, because they are lagged by one year in our (subsequent) model. Thus, our analysis period covers 15 years. On average, there are 2,869 unique firms in a year, with a maximum of 3,102 (in 2011) and a minimum of 2,227 (in 2007). In addition, we observe a firm for 7.2 years on average, and we use an unbalanced panel of 43,033 firm–year observations in our analysis. We provide the correlation matrix, means, and first and third quartiles of the variables in Web Appendix A5.
Model-Free Evidence
Figure 4 depicts the (model-free) cross-sectional association between MDP in the focal firms and their board-interlocked firms. We performed a median split on the focal firms’ average MDP and a tercile split on the board-interlocked firms’ average MDP. When MDP in board-interlocked firms is low (left panel), the probability that the focal firm's MDP falls below the median (L) is 64.3%. In contrast, when MDP in board-interlocked firms is high (right panel), this probability drops to 39.1%, indicating a significant association between the focal and board-interlocked firms’ MDP (χ2 = 267.1, p < .001, d.f. = 2). We report findings from some additional model-free analyses in Web Appendix A6.
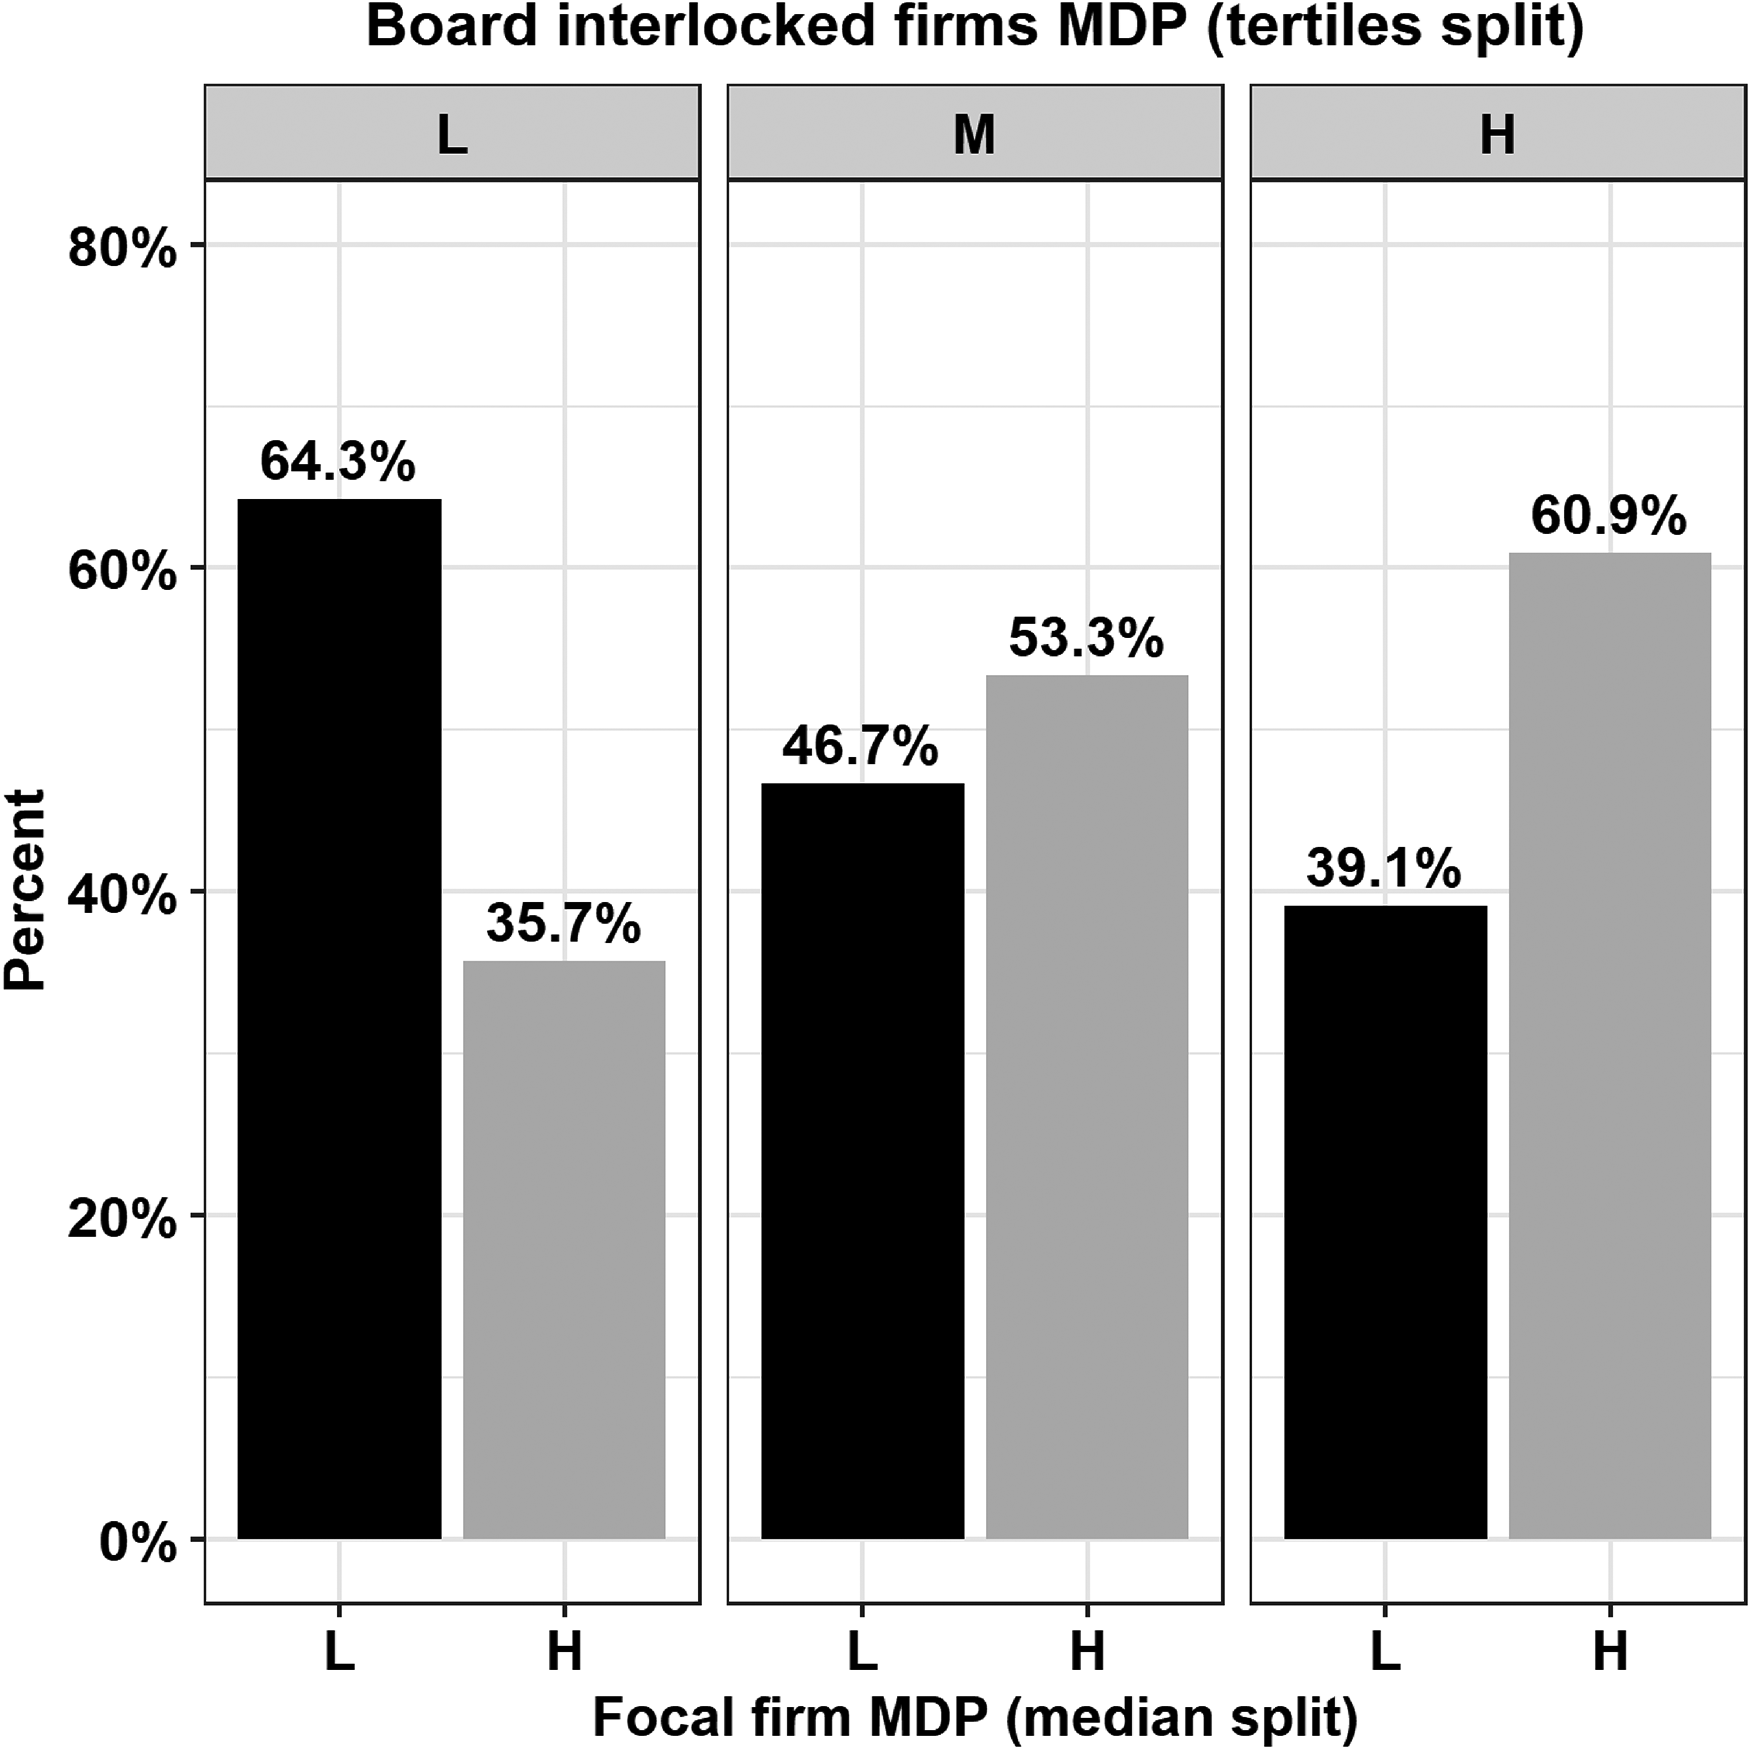
Cross-Sectional Association of MDP In Focal Firms and MDP in Board-Interlocked Firms.
Modeling Approach
In Figure 2, we depicted Disney as the focal firm in the middle (black square), with board interlocks with eight other firms (black circles). In turn, these eight board-interlocked firms have board interlocks with several other firms (white circles) that do not share direct board interlocks with Disney. We use this sample network structure to explain our modeling and identification strategy.
To estimate how MDP in board-interlocked firms (black circles) influences MDP in a focal firm (black square), we let MDP in (focal) firm i in year t be yit, which reflects the value of the first principal component that captures the MDP indicators (discussed previously). We represent the complete board interlock network in year t by the graph Gt = (Vt, Et), where Vt is the set of firms, and Et is a set of links that consists of unordered pairs {f, h} of distinct firms f, h 

With a linear-in-means model, we investigate how MDP in board-interlocked firms affects MDP in a focal firm (Bramoullé, Djebbari, and Fortin 2009, Godinho de Matos, Ferreira, and Krackhardt 2014). Using a weighted average, we grant board-interlocked firms with stronger performance a larger share in the calculation of the MDP average.
9
That is, MDP of board-interlocked firms with stronger performance carries more weight than MDP of board-interlocked firms with weaker performance. To construct the weights wjt − 1, we normalize the average sales growth and return on assets ranks of the interlocked firms, as captured by Bit − 1.
10
Thus, we compute the weighted average MDP in the board-interlocked firms in the previous year as: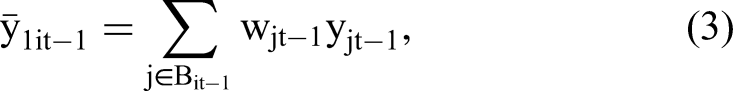


In summary, the coefficient β1it is the board interlock effect, which is the predicted change in focal firm i’s MDP in year t due to a one-unit change in the average MDP in its board-interlocked firms in year t − 1 (everything else being equal). We interpret β1it as the reduced form outcome. We describe how we relate β1it to the moderators (H2–H4) in the “Model Estimation” section.
Identification Strategy
Estimating the effect of MDP in board-interlocked firms on focal firms from observational data using the model in Equation 4 is challenging (Bramoullé, Djebbari, and Fortin 2009; Manski 1993; Nair, Manchanda, and Bhatia 2010). Unless we can theoretically rule out or account for alternative explanations, correlated unobservables, and/or simultaneity, the main covariate of interest
First, we lagged the covariate
That said, other correlated, unobserved effects might exist. For example, some firms’ (unobserved) organizational culture might facilitate greater MDP, which would imply higher levels of yit. If these firms are connected to other firms with similar (unobserved) organizational cultures (i.e., “birds of a feather flock together”), it would imply a positive correlation between
Third, we rely on an instrumental variables (IVs) approach to address any remaining endogeneity. The set of IVs we use reside in the board interlock network (Bramoullé, Djebbari, and Fortin 2009; Godinho de Matos, Ferreira, and Krackhardt 2014). To ensure their plausibility and validity, we calculate the averages of observed variables that reside in the second- and third-degree board-interlocked firms of a focal firm.
12
We compute the IVs using three observed variables: (1) CEO base salary share (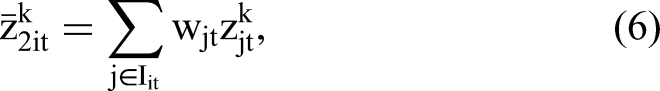
Model Estimation
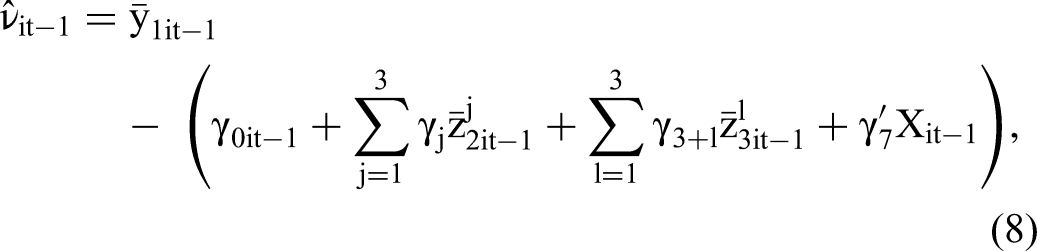
The dependent variable is quantitative, so we model it using a panel data IV linear regression approach (Verbeek 2017). Specifically, we estimate the model in Equation 4 using a control function approach (Petrin and Train 2010) and augment the model with the following first-stage IVs regression equation for the endogenous regressor: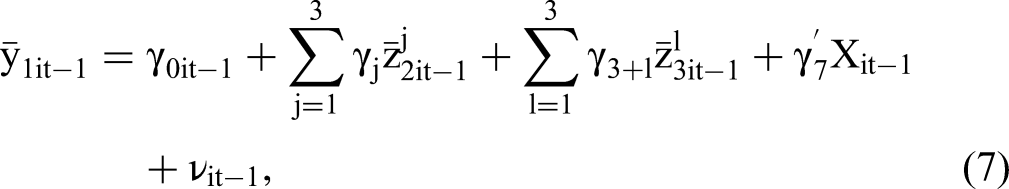
Results
Main Effects
We present the posterior results (mean, standard deviation, quantiles q025 and q975, and probability that the parameter is positive) for β0, β1, β2, and the control function term in Table 2. Our data were standardized before estimation, so we present standardized regression coefficients.
We find strong empirical support for H1; the MDP in board-interlocked firms has a positive effect on MDP in the focal firm. The posterior probability that the overall board interlock effect β1 is positive is 100%. The control function coefficient βc is negative and significant, indicating that controlling for endogeneity through IVs is pertinent here (Papies, Ebbes, and Van Heerde 2017). Considering the parameters captured by the K × 1 vector β2, we find that MDP in the focal firm is positively related to firm size, advertising spending, R&D spending, and the average age of board members of the board-interlocked (BI1) firms. In contrast, MDP in the focal firm is negatively related to CEO duality, the proportion of insiders on the board, and the proportion of men on the boards of the board-interlocked firms.
Antecedents of MDP
To compare the importance of our main covariate
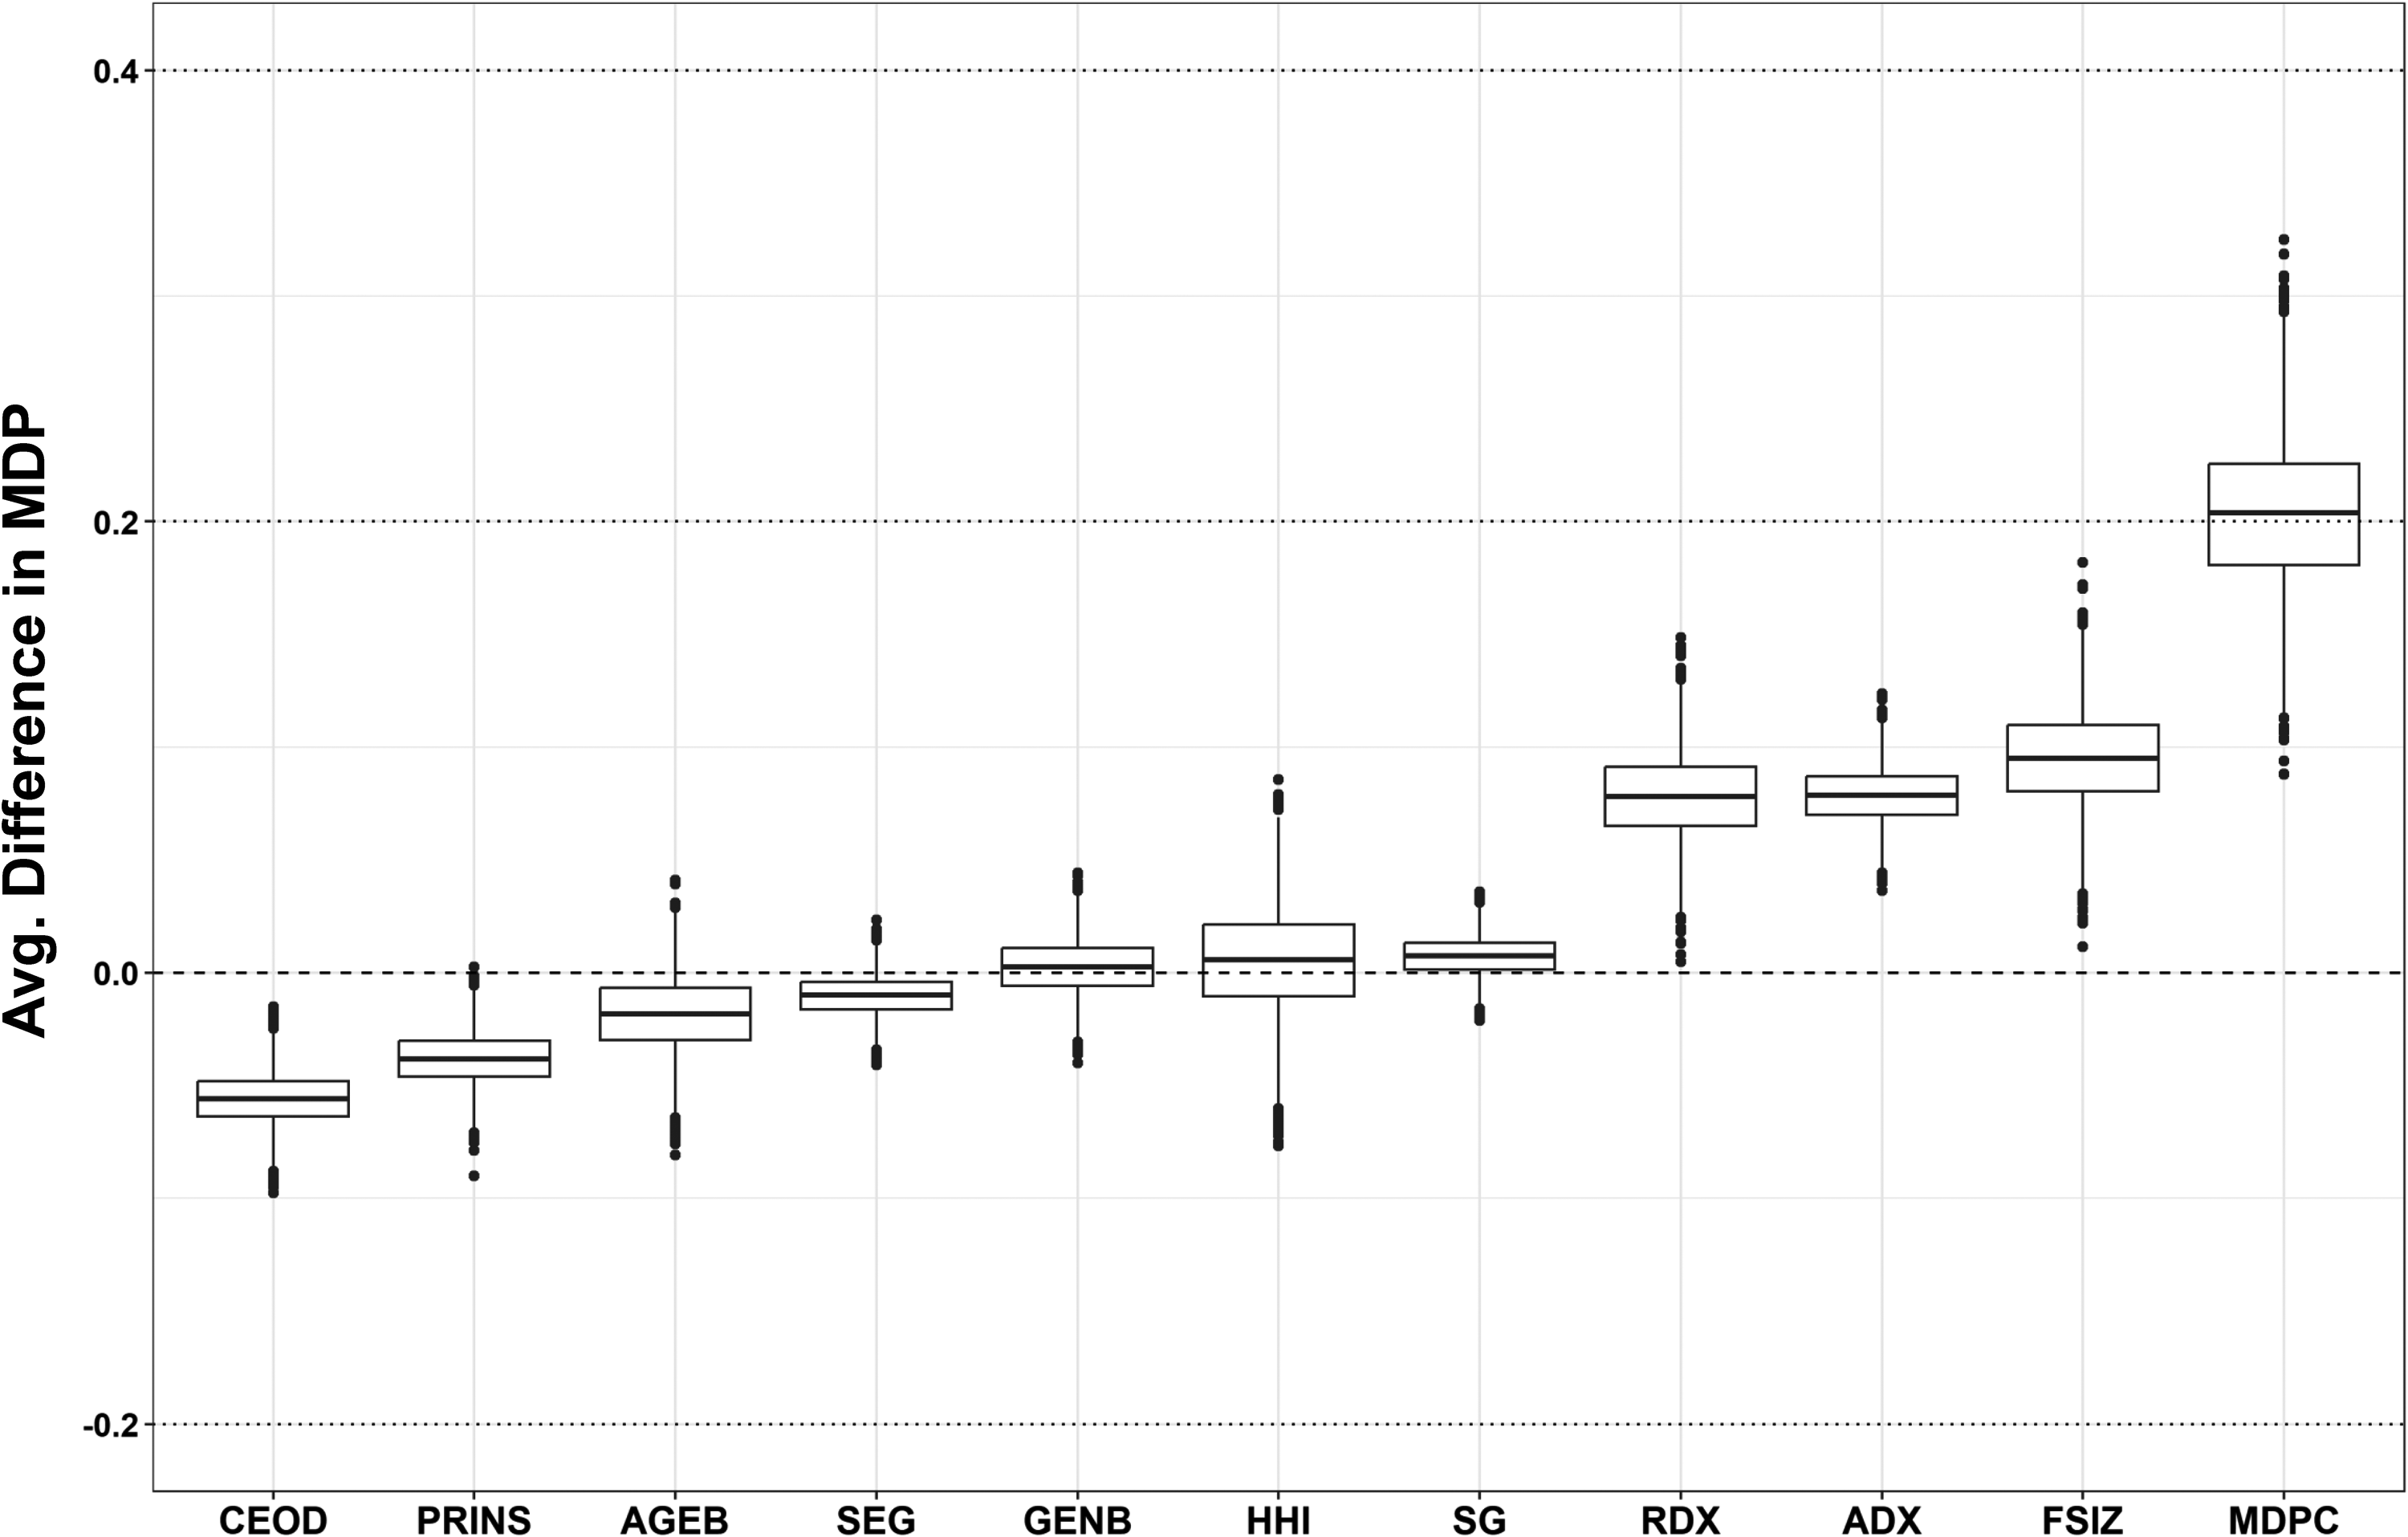
Posterior Distributions of the Average Difference in MDP When Exogenously Shocking Antecedents.
Moderation Results
We next analyzed variation in the posterior means of the effect of MDP in board-interlocked firms on MDP in a focal firm (i.e., the board-interlock effect β1it) from Equation 4 to test our moderating hypotheses. We exclude the year, in line with our findings (reported in the next section) that the board interlock effect is approximately time-constant. Thus, Table 3 contains the results of a between-firm regression, in which we regressed the 6,008 posterior means of β1i on our five mean-centered focal moderators that capture reach, richness, and receptivity.
Moderating Effect of Reach, Richness, and Receptivity (DV = Focal Firm's Board Interlock Effect).
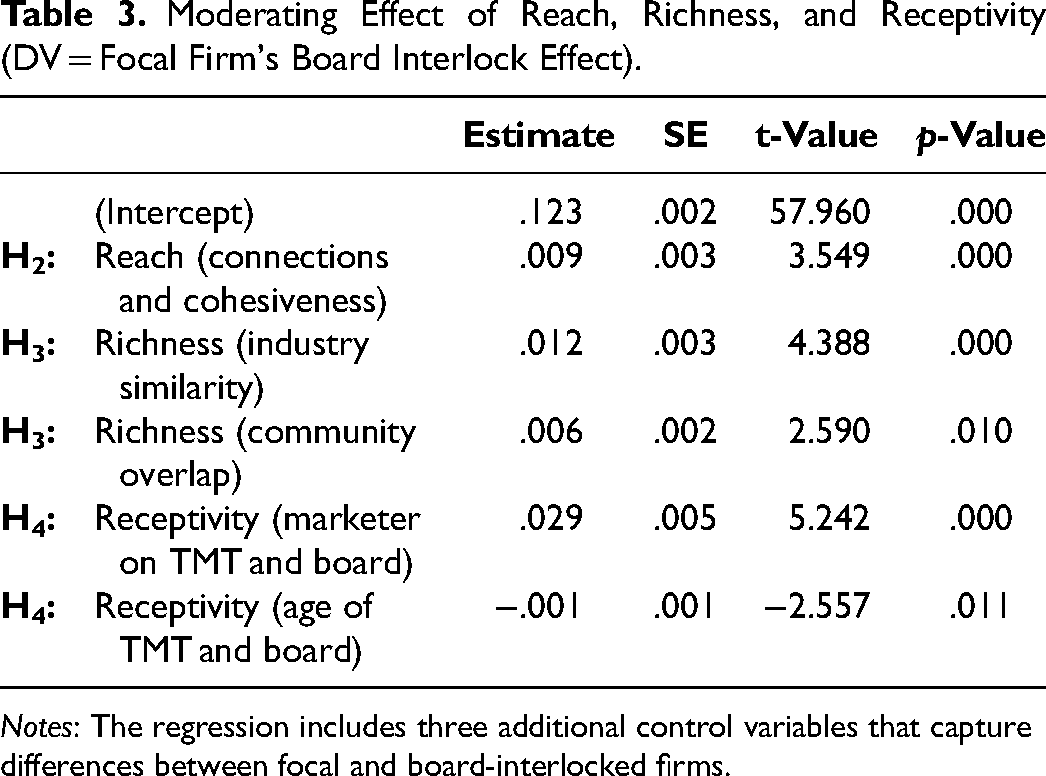
Notes: The regression includes three additional control variables that capture differences between focal and board-interlocked firms.
We find strong empirical support for H2–H4, in that all moderating effects are positive (p < .05). Specifically, the positive effect of MDP in board-interlocked firms on MDP in a focal firm strengthens when the reach and richness of the focal firm's board interlock network increases (H2: breach = .009, p = .000; H3: brichness_industry = .012, p = .000; brichness_community = .006, p = .010), as well as when the firm's executives’ receptivity to information furnished by the board interlock network increases (H4; breceptivity_Mktg = .029, p = .000; breceptivity_Age = −.001, p = .011).
Time Trends in the Board Interlock Effect
Adoption effects of the kind we examine here have been called into question, due to structural changes in board interlock networks (e.g., Chu and Davis 2016; Withers, Kim, and Howard 2018). Therefore, and against this backdrop, we also examine if the MDP effect weakens across our sample period (2007–2021). Recall that the model in Equation 5.2 includes year fixed effects (λ1t) in the upper-level model for the board interlock effect. These effects capture trends in the board interlock effect. Figure 6 presents the posterior intervals (q025, q975) for β1 + λ1t.
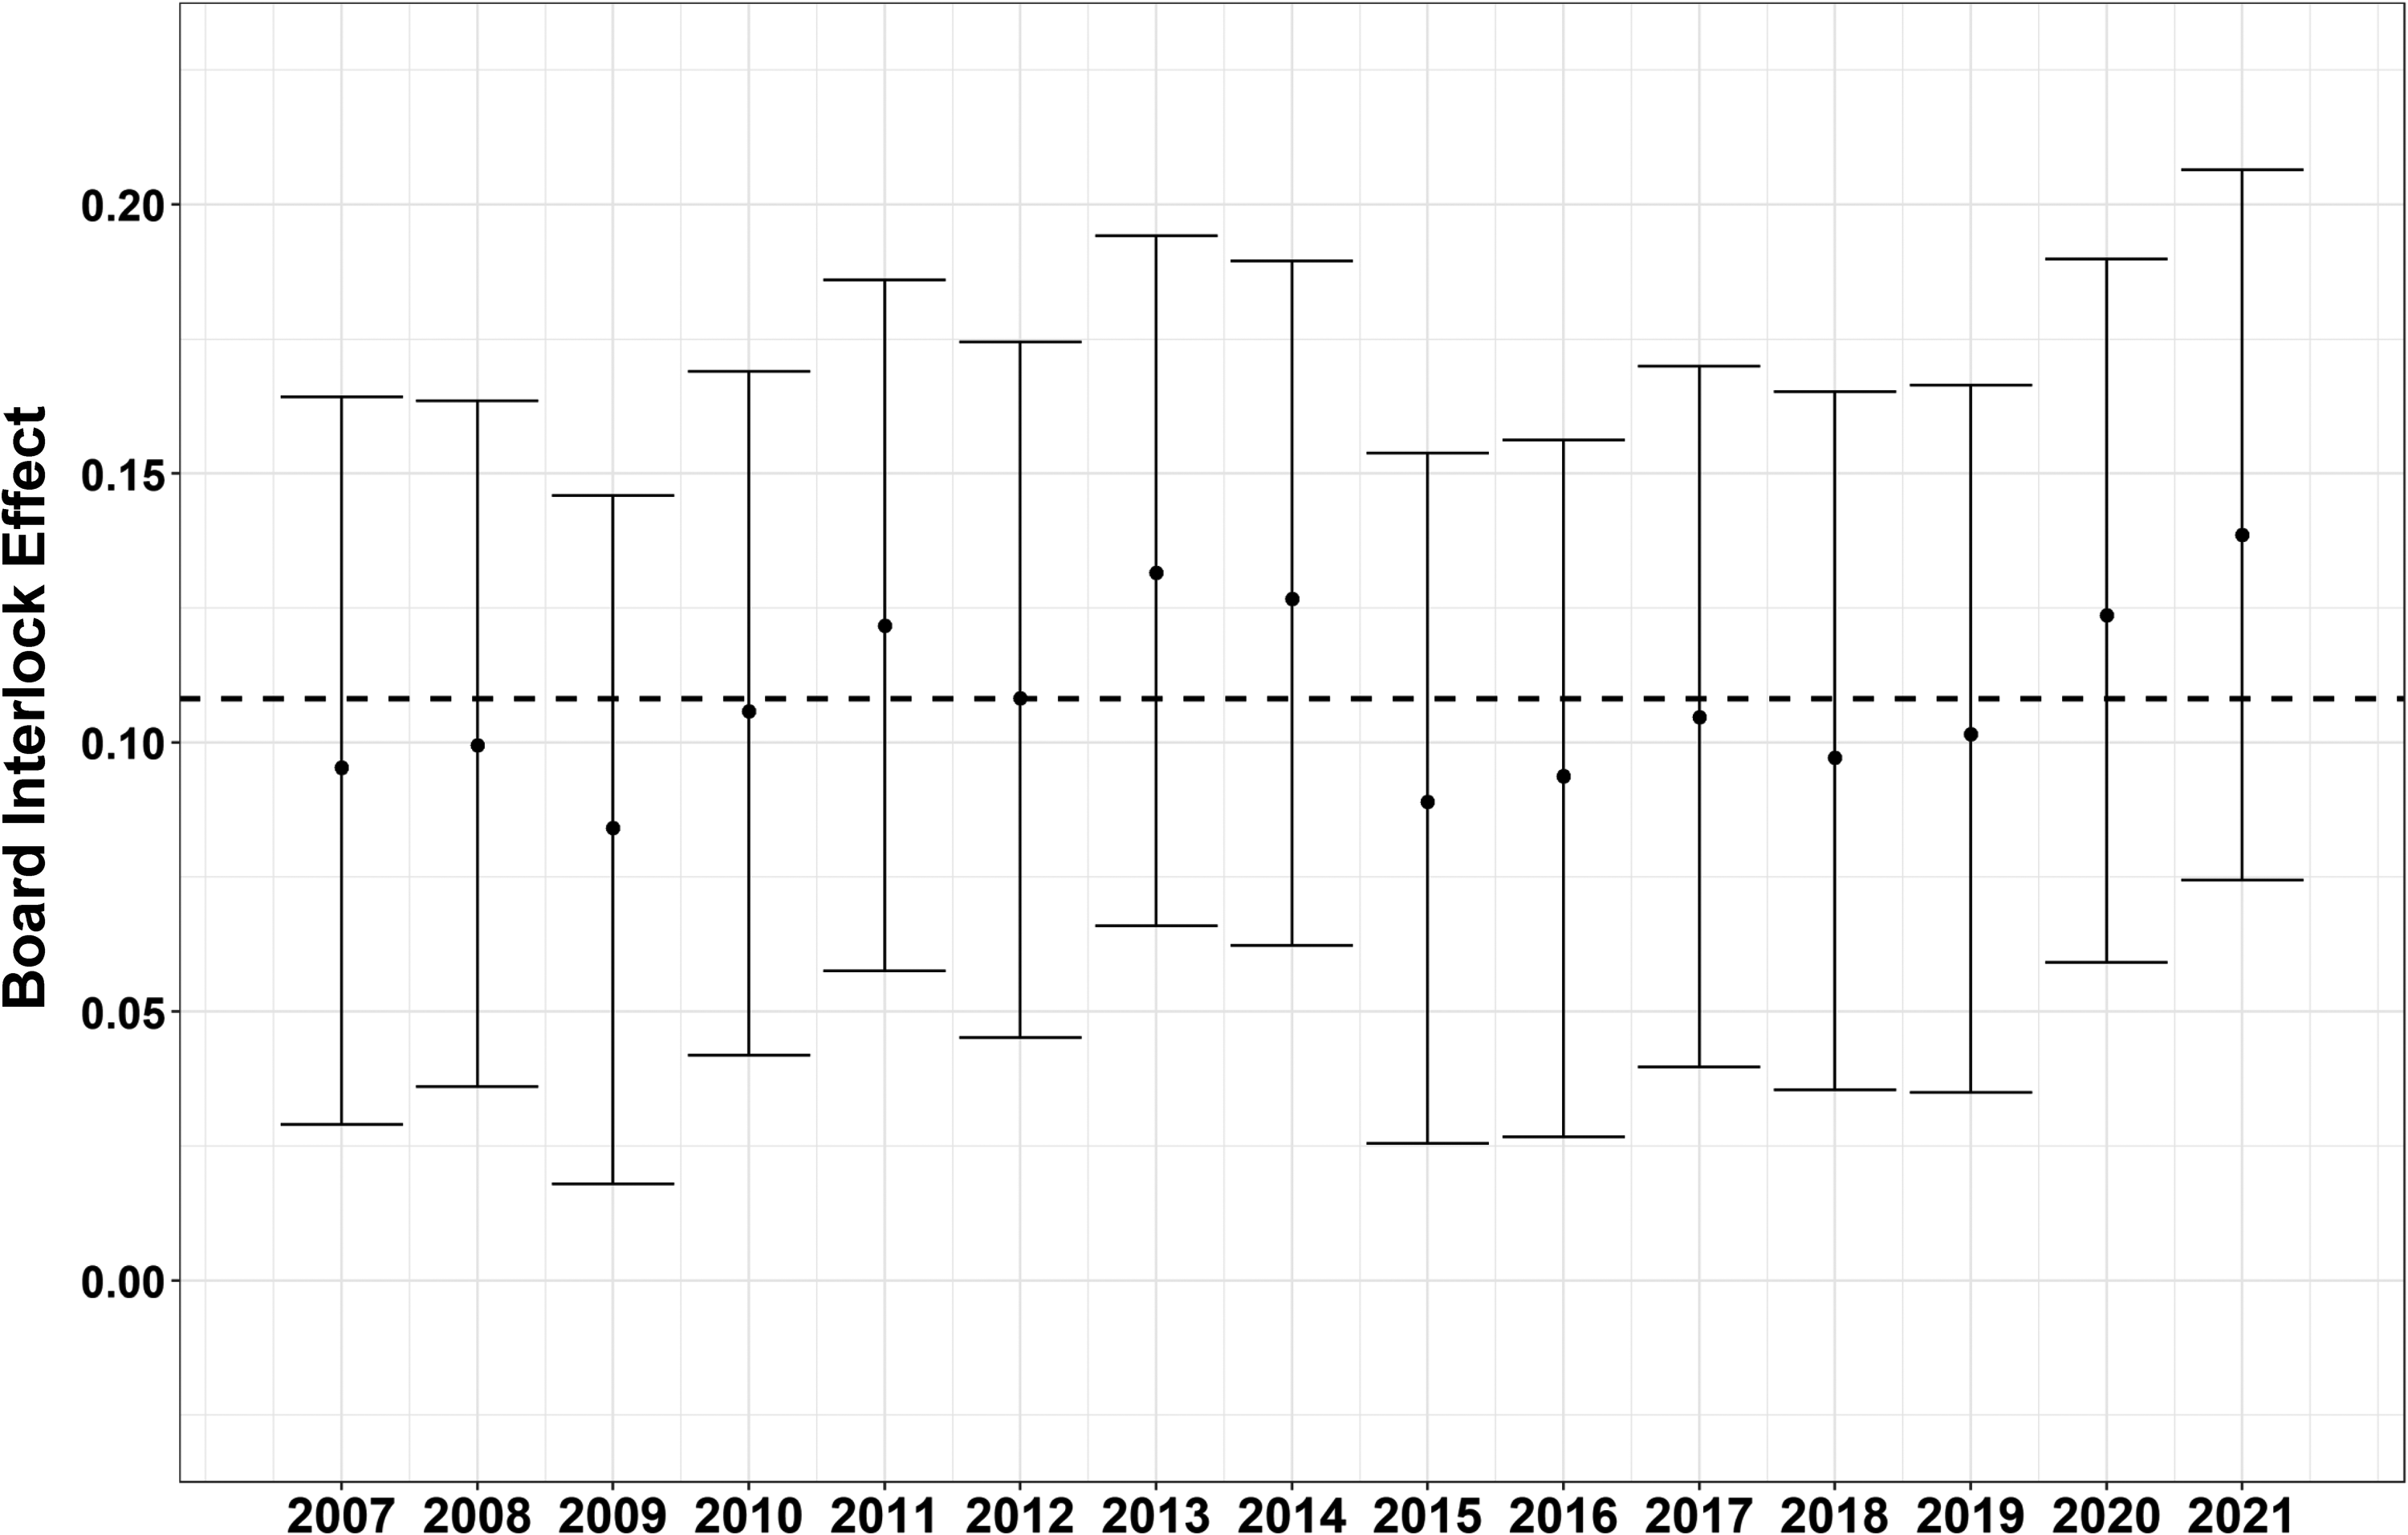
The Effect of MDP in Board-Interlocked Firms on MDP in Focal Firms in Each Sample Year (2007–2021).
Although there is some evidence of a cyclical pattern, such that the board interlock effect grew stronger in earlier years, declined, and then became stronger again in later years, the posterior intervals are overlapping and include the overall board interlock effect β1 (dashed line), suggesting that the cyclical pattern is weak at best. We find no evidence in our data that the effect of MDP in board-interlocked firms on MDP in a focal firm has been declining over time. In addition, zero (i.e., no board interlock effect) is never included in the yearly posterior intervals. Thus, contrary to Chu and Davis’s (2016) arguments, we demonstrate empirically that the MDP board interlock effect holds for our sample years (i.e., up until 2021) and has not weakened.
General Discussion
Firms can expect to benefit financially from a powerful marketing department (Feng, Morgan, and Rego 2015; Homburg et al. 2015). Considering such positive performance implications, we might expect that most firms would embrace powerful marketing departments. Yet several studies indicate that MDP is both modest and dwindling (e.g., Homburg et al. 2015; McAlister et al. 2023), and our findings in Figure 1 affirm this declining trend. We leverage Feng, Morgan, and Rego’s (2015) validated measure of MDP in our analysis. This measure is based on multiple indicators, including whether a firm has a marketer on the TMT. Although just one of the indicators that make up MDP, in our sample, we find that whereas 37.0% of firms featured a marketer on the TMT in 2007, only 28.9% did so in 2021. 16 Such declining trends are alarming for the marketing discipline and indicative of the need for a clearer sense of the antecedents of MDP. We propose that the board of directors is a critical but overlooked antecedent. To test this proposition, we study the board interlock network of a large sample of firms, which reveals empirical evidence in support of our predictions.
Theoretical Implications
Our findings contribute to research into MDP (Feng, Morgan, and Rego 2015; Homburg et al. 2015; McAlister et al. 2023; Moorman and Rust 1999; Verhoef and Leeflang 2009) and board interlocks (Chu and Davis 2016; Martin, Gözübüyük, and Becerra 2015; Mizruchi 1996; Palmer 1983; Srinivasan, Wuyts, and Mallapragada 2018). Extant research has emphasized the importance of MDP in firms (Feng, Morgan, and Rego 2015), as well as the relevance of marketing representation on the TMT (Germann, Ebbes, and Grewal 2015) and board of directors (Whitler, Krause, and Lehmann 2018). Much of this research focuses on the performance implications of marketing (broadly defined) rather than the antecedents of marketing TMT representation or MDP. By affirming that the board of directors represents an important antecedent of MDP, our research offers implications for marketing scholars concerned about the decline of the marketing department's power in firms (e.g., Homburg et al. 2015; McAlister et al. 2023). Our empirical findings indicate that MDP decreased markedly between 2007 and 2021, yet they also pinpoint the influential role that the board of directors can have in determining, and potentially reversing, this decline.
Extant board interlock literature has cast serious doubt on whether board interlocks still serve as conduits influencing the adoption of corporate practices among connected firms (Chu and Davis 2016). We confirm the assertion that firms today are less connected with one another through their board interlock network, with a comprehensive board interlock network—to the best of our knowledge, the largest such network assembled for academic research to date. Yet our analyses also reveal that the board interlock effect has remained remarkably stable between 2007 and 2021 and is still very much in place. In this way, our findings contribute to clarify the persistent value of sparser board interlock networks.
Finally, building on extant network literature and adapting Gulati, Lavie, and Madhavan’s (2011) theoretical 3R framework to the context of board interlock networks, we identify several moderators that are new to the board interlock network literature (reach, richness, and receptivity). The 3R framework can help inform continued board interlock research.
Managerial Implications
Whitler, Krause, and Lehmann (2018) report that marketers pay little attention to their firm's board of directors, but our findings indicate that board members should be a key target for marketers’ efforts. Considering board members’ invariable search for growth opportunities, during their interactions with the board, marketers should work to demonstrate how they can help drive firm growth, while also emphasizing the marketing department's accountability and innovativeness (O'Sullivan and Abela 2007; Verhoef and Leeflang 2009). Marketers would be well advised to make the link between marketing actions and financial results clear. Board presentations should always include a discussion of anticipated—or better yet, achieved—growth outcomes of the various activities marketers undertake, such as detailing how the new products they brought to market, the channel relationships they built, and new promotional campaigns they launched resulted in firm growth. Whenever possible, such demonstrations should cite rigorous analyses, such as field experimentation (A/B testing) and marketing mix modeling. To establish their accountability, marketers also should demonstrate a keen understanding of financial analysis and cost accounting. Doing so may enable them to compensate for the potentially negative effects of the board interlock network, to preserve (or improve) the marketing department's status, while also encouraging board members to share their (hopefully) positive experiences with the marketing departments of other boards on which they serve. Such efforts may help reverse the declining MDP trend we observe in Figure 1. Moreover, such efforts may lead to marketers being invited more frequently to serve on boards, countering a paradoxical observation: boards actively seek growth opportunities for their firms (Spencer Stuart 2016), and research underscores the positive link between board-level marketers and actual growth (Whitler, Krause, and Lehmann 2018). Despite this, marketers remain underrepresented in boardrooms. Greater marketer representation on boards holds promise in helping reverse the downward trajectory of MDP.
Although MDP is decreasing on average, we also note some industries in which MDP has been increasing. In Web Appendix A5, we list the 10 largest four-digit SIC codes (out of 411) for which MDP increased between 2007 and 2021. Perhaps we can learn from these firms and see what they did differently in the past 15 years that might have enhanced their MDP. Almost all of the 10 industries that witnessed an increase in MDP were either deregulated in the past decade or two or significantly affected by digital transformation (e.g., banking, energy, telecommunications, computer communications systems). Such changes resulted in tectonic shifts in the firms’ competitive landscape and business models. For example, energy companies (SIC 4911) such as American Electric Power and First Energy Corp. struggled with influxes of new competitors, made possible by deregulation, and the introduction of price-comparison tools (e.g., chooseenergy.com), made possible by digital transformation. Thus, one of their top priorities is to reduce customer churn (Meuer et al. 2019), a goal that requires marketing efforts, which may help explain the observed increase in MDP. As another example, largely due to new regulatory environments and digital transformation, many banks (SIC 6021) also face serious headwinds. Fintech firms such as Chime and Wise, as well as traditional tech firms such as Apple and Amazon, now offer products that previously were available only from traditional banks. Customer loyalty thus takes center stage (Dooley 2023), which similarly may explain the increased importance of MDP for these firms. Finally, as the digital economy keeps growing, cybersecurity technology and service providers, such as Radware, Extreme Networks, and CISCO Systems (SIC 3576), are looking at an estimated $2 trillion market opportunity, stemming from proliferating cyberattacks and the resulting trillions of dollars of damage (Aiyer et al. 2022). To seize this market opportunity, these firms likely rely more on marketing. Thus, it appears that when firms are confronted with serious challenges and opportunities, they call on marketers and marketing. But marketing efforts should not be limited to extreme circumstances. Going forward, we hope marketers and CMOs will focus more on educating their boards about how and why marketing is key for firm growth—a goal shared by virtually every board.
Limitations and Further Research
Our research is not without limitations. A firm might be connected to another firm through board members with a marketing background, in which case the board interlock network effect might be even stronger. Our statistical approach does not consider such board interlock connections, but we hope researchers will attempt such an extension. Moreover, some CEOs have a marketing background (Srinivasan, Wuyts, and Mallapragada 2018), and firms with such a CEO may be more receptive to MDP-related information furnished by the board interlock network. A CEO with a marketing background thus might represent an alternative receptivity measure. In addition, our results indicate that MDP is lower in firms in which the CEO chairs the board, but if the CEO has a marketing background, this negative effect might be attenuated or even reversed.
Because we use a rich set of control variables, including industry and year fixed effects, develop an identification strategy with an IV approach and check the information sharing mechanism with several theoretically derived moderators (i.e., process by moderation analysis), we believe our findings are plausibly causal. Yet in addition to the MDP in board-interlocked firms, other antecedents of MDP must exist, and we hope continued research explores those antecedents.
Finally, in addition to the moderators we consider, other factors could influence the strength of the identified network effect, and some of them constitute fruitful avenues for research. For example, network effects among boards might grow stronger as environmental dynamism increases. In such environments, there is often greater uncertainty about the best course of action, and managers may be more likely to look to their peers for cues on how to navigate uncertainty and reduce the risk associated with decision-making (DiMaggio and Powell 1983). In addition, the network effect could weaken when a board has a particularly powerful member (Shropshire 2010). Researchers should consider such extensions.
Conclusion
Although MDP in firms positively influences firm outcomes, MDP in firms has been declining. To address this apparent disconnect, we show that a firm's board of directors and the other boards on which these directors serve significantly influence MDP in firms. We hope our research stimulates marketing scholars’ and marketing practitioners’ interest in board-level phenomena. If marketing wants to increase its power in firms, it should seek to get the board “on board.”
Supplemental Material
sj-pdf-1-mrj-10.1177_00222437241272180 - Supplemental material for Getting the Board on Board: Marketing Department Power and Board Interlocks
Supplemental material, sj-pdf-1-mrj-10.1177_00222437241272180 for Getting the Board on Board: Marketing Department Power and Board Interlocks by Peter Ebbes, Frank Germann and Rajdeep Grewal in Journal of Marketing Research
Footnotes
Acknowledgments
The authors contributed equally and are listed alphabetically. They thank the Wharton Customer Analytics Initiative (WCAI) and Equilar Inc. for providing the board- and top management team–level data. They also acknowledge feedback from Tim Hubbard, Mitch Olsen, Hari Sridhar, Kapil Tuli, and Peter Verhoef as well as from participants in seminars at INSEAD, McGill University, University of Notre Dame, Technical University of Munich, University of South Florida, University of Mannheim, and Tilburg University. Peter Ebbes acknowledges research support from Investissements d'Avenir (ANR-11-IDEX-0003/LabexEcodec/ANR-11-LABX-0047) and the HEC foundation.
Coeditor
Rebecca Hamilton
Associate Editor
Jan Heide
Declaration of Conflicting Interests
The authors declared no potential conflicts of interest with respect to the research, authorship, and/or publication of this article.
Funding
The authors received no financial support for the research, authorship, and/or publication of this article.
Notes
References
Supplementary Material
Please find the following supplemental material available below.
For Open Access articles published under a Creative Commons License, all supplemental material carries the same license as the article it is associated with.
For non-Open Access articles published, all supplemental material carries a non-exclusive license, and permission requests for re-use of supplemental material or any part of supplemental material shall be sent directly to the copyright owner as specified in the copyright notice associated with the article.