
Abstract
This study presents the first field investigation of the sales impact of cause-related marketing promotions (CMPs) in retail settings. Whereas prior work primarily studies CMPs in simplified experimental settings, actual fast-moving consumer goods markets are considerably more complex; ergo, consumers are unlikely to consider and evaluate all brands and CMPs in detail. In this analysis based on 63 CMPs across 20 categories, the authors therefore investigate the short-term sales impact of CMPs as a function of the brand and category context in which they are executed. On average, CMPs run 11 weeks and donate 3.2% of product price, resulting in an average sales lift of 4.9% per week. The findings suggest that a necessary precondition for CMP success is that consumers notice it at the point of sale and hence have considered the CMP brand for reasons other than the CMP itself. Accordingly, the sales impact of CMP can more than double when the category assortment is smaller, the category has less price dispersion, the brand is a category leader, or the brand is priced below the category average. Brands operating in less favorable market conditions can still achieve above-average CMP impact by combining CMPs with price promotions to ensure consumer consideration.
Keywords
Tying consumer purchases to charitable donations using cause-related marketing promotions (CMPs) has a long tradition. In 1983, American Express ran one of the earliest CMPs, donating a penny toward the Statue of Liberty's renovation with each use of its credit cards. The campaign raised $1.7 million in donations and had a sizeable business impact in credit card use (Varadarajan and Menon 1988; Wall 1984). Since then, CMPs have proliferated. In the United States alone, CMPs have an annual growth rate of 6% and annual expenditures of $2.24 billion (IEG Sponsorship Report 2019).
Academic research has responded to the surge in CMPs with more than 150 published experimental articles, as summarized in Schamp et al.’s (2023) meta-analysis. These experiments find positive effects of CMP campaigns on brand attitudes (e.g., Chernev and Blair 2015), purchase intent (e.g., Koschate-Fischer, Stefan, and Hoyer 2012), and product choice (e.g., Arora and Henderson 2007; Barone, Miyazaki, and Taylor 2000; Winterich and Barone 2011). Although these studies provide insights into which CMPs are likely to be effective, they do not study sales lift at the point of sale, nor do they investigate the role of market context or brand positioning in retail environments.
By far the most common use of CMPs is within the fast-moving consumer goods (FMCG) industry (Edelman 2015). This industry's market conditions differ from both the American Express setting and that of experimental research. For example, a typical grocery store offers 30,000 to 50,000 stockkeeping units (SKUs) from which customers can choose (Sorensen 2009), whereas most research experiments focus on attitudes toward a single brand or preferences between a few alternatives. When there are only a few options to choose from, consumers can inspect them all. In an actual supermarket, consumers are bombarded with copious information and must decide what to focus on (Hauser and Wernerfelt 1990; Shugan 1980). To cope with this complexity, many consumers screen products by easily comparable and standout criteria, for instance searching for familiar brands or attractively priced products (Allenby and Ginter 1995).
The moral undertones of CMP campaigns, in contrast, are more difficult to compare and more complex to evaluate than price and brand information. They are also harder to find because they are not uniformly represented or prominently featured (see Figure 1 for examples of actual CMPs on FMCG packaging). Further complicating matters, CMPs often do not exist in a category at all. It would therefore require more effort to actively search for relevant CMP information than to screen products based on other traditional attributes, such as price and brand information. In contrast to price or price promotions (PPs), CMPs may therefore reach fewer consumers unless other factors ensure CMP consideration.

Examples of CMP Campaigns and Their Visibility at the Point of Sale.
Actual market sales of a beer brand and a honey brand serve to illustrate the potential role of consideration. Both brands conducted CMPs in cooperation with the World Wide Fund for Nature (WWF; also known as World Wildlife Fund) and donated similar amounts to reforestation projects. Based on prior research on CMP campaign execution alone, we would expect a similar sales lift. However, the beer brand (a market leader in its category) offered low prices relative to the category average, whereas the honey brand (not a market leader) was priced at an average level. The brands also differed in terms of concurrent PPs, as the beer brand combined its CMP with several deep PPs (nationwide average of 15% during the CMP campaign), whereas the honey brand offered negligible PP support.
Who has more to gain from these similar CMPs? On the one hand, many consumers might be uncertain about the nonleading honey brand, and CMP might tip the scales of their brand preferences (Arora and Henderson 2007). On the other hand, the leading beer brand is more likely to be considered in its category a priori and can thereby reach more potential customers. In fact, model-free evidence suggests the latter: comparing the average weekly sales during these CMPs with the sales before and after the CMPs shows that the honey brand achieved only a minimal sales lift (.4%), whereas the more prominent beer brand sold 14.4% more units during its CMP. Although other factors (e.g., previous PPs, category complexity, competitive dynamics) could have played a role in this anecdotal example, it indicates the potential impact of contextual moderators on the impact of CMP on sales.
The aim of this article is to investigate the size of CMPs’ sales lift as well as the role of contextual drivers with better econometric control than the preceding anecdotal example; that is, by leveraging a unique data set of 63 CMP campaigns in the German FMCG market. By doing so, we make the following three main contributions.
First, we provide the first large-scale field evidence on CMPs’ impact under actual market conditions. On average, CMPs run 11 weeks and donate 3.2% of product price, resulting in an average sales lift of 4.9% per week. Compared with traditional PPs, CMPs have lower promotion depths and run over longer durations. In contrast to PPs, we observe no postpromotion sales dips after CMPs end. These average effects suggest that CMPs might be a valuable instrument in a brand's promotion arsenal.
Second, we quantify the influence of the competitive context and brand-price positioning on CMP success. Specifically, the CMP sales impact can more than double when the brand is a category leader, the brand is priced below category average, or the category assortment is smaller with less price dispersion.
Third, we quantify the role of concurrent PPs during CMPs, because PPs can also drive consideration. Over and above the main effect of the PP itself, a 10% price reduction increases the CMP sales lift by an average of 6.64%. Moreover, we find that brands operating in less favorable market conditions (as described previously with regard to the competitive context and brand-price positioning) can achieve above-average CMP impact by combining CMPs with PPs to ensure consumer consideration.
The remainder of this article is structured as follows: After reviewing related research on CMP, we develop a conceptual model based on brand- and category-related drivers of consideration-set formation and discuss main and moderating effects on the CMP sales lift. Next, we describe the data and the measures we derive. Using a hierarchical Bayesian framework, we estimate the CMP sales lift and its interactions with contextual moderators while controlling for advertising, competitive CMPs, PPs, and other kinds of promotions. We compare CMP effectiveness to that of traditional PPs and compute the expected effects for individual CMP scenarios and counterfactuals for actual campaigns. Finally, we conclude when and how brands can achieve the highest possible CMP sales lift.
Prior Research
Most CMP research has compared different CMP campaigns in experimental lab settings with only a small set of alternatives (Schamp et al. 2023), where the formation of consideration sets is not relevant. Beyond reported social desirability surrounding hypothetical prosocial decisions (e.g., White, Habib, and Hardisty 2019), these simplified settings may have resulted in larger effect sizes than might have occurred under more complex market conditions.
As a first indication of an average CMP effect, a few studies have examined the impact of CMPs on coupon redemption in field experiments and suggest a significant small to moderate impact of CMP. However, these studies investigate opt-in choices featuring a single option, usually a single coupon-redemption offer (Andrews et al. 2014; Lichtenstein, Drumwright, and Braig 2004; Strahilevitz and Myers 1998; Winterich and Barone 2011). For example, Andrews et al.’s (2014) experiment adds CMPs to movie-theater coupons and reveals that this type of CMP has a sizeable effect on redemption. However, since the study only looks at whether someone redeems the coupon for a single product, it is less informative about the more general grocery context, in which consumers might consider only a subset of the numerous options.
Only a few factors that might also play a role in consideration have been studied, all under laboratory conditions with few available brands and/or hypothetical choices. Table 1 provides an overview of related research.
Overview of Prior CMP Literature.

Some studies have examined the role of brand leadership when few alternative brands are available. In these contexts, leading brands with high market share can have less to gain from CMPs than nonleading brands with a lower market share (Arora and Henderson 2007; Lafferty 2009). Others have tested whether large price differences between only two alternatives attenuate CMP effects (Barone, Miyazaki, and Taylor 2000). An exception is the laboratory evidence from Schamp, Heitmann, and Katzenstein (2019) suggesting that conclusions may not hold for larger assortments. In more complex markets, consumers may pay less attention to CMP and more attention to other attributes such as price or brand.
Schamp et al.’s (2023) meta-analysis summarizes the factors studied in prior laboratory work, and concludes that said work has mainly focused on campaign factors related to cause selection or campaign communication rather than the purchase context. This may be because the contextual factors that influence consumers’ consideration of CMPs are difficult to test in a laboratory setting, as some relevant factors may occur over time (e.g., frequency of PPs, which affects consumers’ expectations of future PPs) or are characteristics of the broader category context (e.g., price dispersion across all brands in a category). Consequently, their meta-analysis is based on research that studies simple decision environments (few alternatives, few characteristics) outside the actual marketplace. The meta-analysis by Schamp et al. therefore does not address the role of CMP when consumers first construct relevant sets of alternatives or contextual factors relevant in such situations.
Accordingly, prior work has called for research beyond the single-brand context (Robinson, Irmak, and Jayachandran 2012) and in more complex competitive settings (Kotler, Hessekiel, and Lee 2012). Before we empirically investigate CMP at the point of sale, we discuss the role of forming a consideration set for CMP success.
Theory
Consumers who shop for FMCGs are confronted with supermarket shelves containing large assortments of products that vary in price, brand, size, flavor, and other characteristics. All these features are fighting for consumer attention. According to the U.S. Bureau of Labor Statistics (2023), an average shopping trip takes around 40 minutes, with less than 12 seconds spent choosing each item purchased. Accordingly, a lot of information cannot be absorbed by consumers.
To deal with this complexity, consumers rely on screening approaches (e.g., Gigerenzer and Goldstein 1996; Hauser and Wernerfelt 1990; Payne, Bettman, and Johnson 1993) and construct manageable consideration sets, featuring a few products they subsequently evaluate in detail (consideration-then-choice decision making; Häubl and Trifts 2000; Hauser and Wernerfelt 1990; Roberts and Lattin 1997). According to industry estimates, the average shopper considers only about 1% of the products in an average supermarket (Catalina Marketing 2013), so landing in the consideration set is a critical condition for a CMP brand to end up in the shopping basket. Products not included in consideration sets are, by definition, excluded from the evaluation and choice stage and do not result in any sales. Hence, there is a large probability that many CMPs go unnoticed.
Once consumers notice and evaluate CMPs in more detail, CMPs can have sales potential, as exhaustively documented by prior experimental evidence (Schamp et al. 2023). While we find many CMPs across FMCG categories, the number of campaigns in each category remains limited, and some categories have none at all. Consumers cannot know whether a category features one CMP or more unless they scan all products in the category, which is a high-effort (and thus unlikely) activity. CMPs are also demanding to evaluate because of their heterogeneity in campaign communication and because of the difficulty in comparing the altruistic value of CMPs to the egoistic benefits and costs of the products themselves. These factors make the presence of a CMP a poor screening criterion for consumers. As a result, CMP sales potential is a function of the brand's ability to enter the consumer's consideration set for other reasons. In this study, we explicitly test these contextual drivers.
According to effort–accuracy trade-offs, consumers process less of the available information as markets become more complex (Payne, Bettman, and Johnson 1993); hence, whether a consumer considers a CMP is a function of the complexity of the category assortment. Any brand that features a CMP is less likely to stand out in markets with high levels of horizontal differentiation and multiple competing alternatives (i.e., high SKU breadth) than in simpler markets with less competition. Similarly, vertical market differentiation with high price dispersion also complicates comparisons and decision making, as larger differences between high and low prices make products more difficult to compare (e.g., Fok et al. 2006). More complex comparisons can, in turn, result in consumers reducing their levels of information processing (Gourville and Soman 2005; Johnson 1984). In summary, CMPs are less likely to be effective when a category's assortment is complex than when it is simple.
Consumers often screen products based on brand preference (Erdem and Swait 2004) or revert to choosing the brand they are most familiar with (Hoyer 1984). Leading category brands like Coca-Cola soft drinks or Wrigley's chewing gum benefit from asymmetric advantages, as all competitors are compared with them, but few other brands come to mind when they are in focus (Carpenter and Nakamoto 1990). This makes it difficult for products that are not category leaders to become part of consideration sets, and consequently their CMPs risk being unnoticed. Conversely, brand leadership increases the likelihood of a brand being in the consideration set, and the brand’s CMPs are more likely to lift sales as well.
In contrast to the difficulty of evaluating the altruistic benefits associated with CMPs, price information is easy to compare (Kalyanaram and Winer 1995; Mazumdar, Raj, and Sinha 2005; Russo 1977). Therefore, brands with attractive prices are more likely than other brands to enter the consideration set, and consumers are more likely to take their CMPs into account. Moreover, whether a price is attractive is not only a matter of its direct competition, but also a matter of how it compares to the price consumers expect in the future. Specifically, the frequency of PPs a brand has conducted in the past is projected by consumers into the future, so that frequent PPs can result in consumers waiting for the next PP to happen (e.g., Mela, Gupta, and Lehmann 1997). Whereas concrete details of an occurrence might be hard for consumers to recall in hindsight, automatic encoding of frequency in memory makes frequency a readily available criterion, in particular when consumers engage in fast and frugal screening (Hasher and Zacks 1984). Thus, consumers might actively search for PPs at the point of sales when they expect them, shifting attention away from other types of promotions such as CMPs. Note also that evaluations of CMPs become more complex because consumers are forced into complex trade-offs between the current CMP and the (high) likelihood of future PPs. Consequently, while low prices relative to the competition increase the likelihood that consumers will consider a product's CMP, a high frequency of PPs decreases it.
Whereas a frequent use of PPs is likely detrimental to CMP effectiveness, the short-term impact of concurrent PPs during a CMP is favorable. PPs are the most common (and most effective) instrument for driving both demand and short-term entry into a consideration set (e.g., Ailawadi et al. 2007; Blattberg, Briesch, and Fox 1995). This is evidenced by a sizeable short-term price elasticity of −2.62 as reported in a meta-analysis (Bijmolt, Van Heerde, and Pieters 2005). Since price is a readily available, easily comparable, and often subjectively important attribute, PPs create great potential for a brand to enter a consideration set. Other forms of nonprice promotions (non-PPs; e.g., sweepstakes, nonmonetary giveaways) are as heterogeneous as CMPs and similarly difficult to compare, and can even send mixed signals and backfire (Simonson, Carmon, and O’Curry 1994). In contrast, we expect that PPs drive consideration of CMP campaigns in the short term, which is a necessary condition for an additional CMP-based sales lift. Note that this CMP sales lift is in addition to the sales lift attained by the PP itself. Conversely, CMPs that are offered without concurrent PPs risk being unnoticed and ineffective if their brands fail to enter consumers’ consideration sets.
Brands that can ensure consideration with attractive pricing or are themselves leading brands in a category have a lower need for PPs to secure CMP consideration. For these brands, the impact of PPs on CMPs’ effectiveness is smaller than it is for higher priced or less reputable brands; this is because their brand pricing strategy or brand positioning already ensures consideration. Adding PPs on top cannot further amplify consideration for brands that are already considered for other reasons.
Similarly, in simpler markets with few alternatives (like those studied in many laboratory experiments), it is much more likely that consumers consider all alternatives, and PPs cannot further amplify consideration likelihood. Conversely, complex assortments can result in a higher effect of PPs on the CMP sales lift because consumers process a smaller share of alternatives and attributes, and are therefore more likely to miss CMPs if they lack PP support. Figure 2 summarizes these conjectures related to readily observable drivers of consideration-set formation and specifies the expected signs of the relations between each of the contextual variables and CMP consideration likelihood and sales.

Observable Drivers of CMP Consideration and Consequential Sales Effects.
Note that the framework in Figure 2 is not exhaustive and does not include all conceivable drivers of consumer consideration. Rather, we focus on practically relevant contextual factors that are observable in actual sales data. Empirically, such data do not enable us to directly test consideration decisions of consumers. However, logic dictates that all products purchased were previously considered by consumers. Conversely, consideration makes purchases more likely but does not guarantee transactions. Since consideration itself is not observable in sales data but is conceptually relevant, we include it as a dashed box in Figure 2. In the next section, we estimate the size of the actual CMP effect at the point of sale.
Data
We study the FMCG industry because of its practical relevance for CMPs (Edelman 2015). Rapid turnover of FMCG products also enables us to study how sales and sales promotions evolve over time, and to investigate CMP effectiveness under diverse competitive conditions, brand positions, and pricing strategies.
We use data from the German FMCG market covering 63 nationwide CMPs that were run in 20 product categories, including grocery products (e.g., soft drinks, dairy, pet food) and drugstore products (e.g., diapers, cough drops) provided by the market research agency GfK. The data cover an eight-year period (417 weeks of observations; January 2006–December 2013). We collected CMP information from the promotion database of a dedicated industry journal, Lebensmittel Zeitung, in which companies preregister promotion periods and details of special promotions several weeks ahead of execution for the information of retailers. We augment this information by utilizing prior descriptive research (Oloko 2010), press clippings, and contacts with major competitors in each of the categories to ensure coverage of all relevant CMPs during the observation period. We also contacted all brands for which we found a CMP to verify our records and obtain information not available in the promotion database (e.g., whenever monetary donation amounts were not communicated at the point of sale).
The resulting CMP-related data can be matched with sales per brand and week of the main retail chains in the market. We obtain this latter information by aggregating data from the representative household panel data of GfK. Following the approach of prior research concerning sales data in general (e.g., Pauwels, Hanssens, and Siddarth 2018; Van Heerde et al. 2013) and GfK panel data in particular (e.g., Jindal et al. 2020; Keller, Deleersnyder, and Gedenk 2019), we aggregate the data to brand-chain-week observations, so we can consider the competitive products (and their prices) that the household did not buy by imputing them from the transactions of other households. This type of aggregation also reduces measurement error, because price reports are not based on information provided by a single household, but on all households that purchased in a given week (Jindal et al. 2020).
We also include competing brands in the category that do not use CMPs, resulting in 123 brands in total. This enables us to compare sales during CMPs with periods before and after the CMPs, as well as sales of competing brands. Following prior research (e.g., Keller, Deleersnyder, and Gedenk 2019), we include all brands with at least 3% market share in their category per retail chain, to further reduce possible measurement error. This also excludes smaller regional brands. Note, however, that we did not find any CMPs for these brands during the period of interest and categories we study, so these restrictions are unlikely to bias our estimates regarding actual CMPs in the marketplace. To ensure that we have enough brands per category and chain, we use data from the four largest supermarket chains in Germany, which cover more than 73% of the national market. We exclude smaller retail chains, such as specialized retailers and gas stations, as well as discounters and drugstore chains, as these retailers do not provide enough observations per CMP-offering brand. We arrive at 241 CMP campaign-chain combinations over the full eight years.
The GfK household panel provides information for several other variables based on the promotion reports of panel members, especially indicating whether they bought products in response to a PP or a non-PP. Panel households report concurrent PPs during 25% of the CMPs in our data, but these combinations do not occur systematically for individual brands or firms, which suggests that strategic intent does not play a dominant role in the data and firms likely make decisions about PPs and CMPs independently. More important for our purposes is that these frequent combinations of promotions enable us to test the effects of concurrent PPs on CMPs’ sales lift. We also use the panel data to control for non-PPs such as nonmonetary giveaways or sweepstakes.
Theoretically, CMPs can be associated with increased advertising to make customers aware of the campaigns. If a shift in advertising activity corresponds with a CMP, then the CMP effects we observe could be confounded with salience driven by advertising. To control for this, we use data from Nielsen (i.e., advertising expenditures in television, radio, direct mail, and print) for all brands in our data set, reported separately for each category in which these brands operate. Web Appendix W1 provides further details on the data sources and their aggregation. Web Appendix W2 provides further details on the data preparation as well as the correlations between all variables.
Econometric Model
Since we study CMP's role as a sales promotion, we build on traditional sales promotion modeling for chain-level data (e.g., Van Heerde, Leeflang, and Wittink 2004; Wittink et al. 1988). The main dependent variable is unit sales of brand b in chain c in week t (qbct).
Model Specification
We estimate three models, starting by estimating CMPs’ average impact on brand sales in Model 1, adding the interaction between CMP and PP in Model 2. Model 3 is used to estimate the effects of the moderators of our conceptual framework (Figure 2) on CMP and the interaction variable (CMP × PP).
Although the CMPs we study are executed at the national level, the substantive moderators of interest—complexity of the category assortment and brand-price positioning—differ by chain and time of execution. Therefore, we estimate all effects based on brand-chain-time observations. Most brands in our sample feature only one CMP in our observation period. A few brands run multiple CMPs (i.e., we have more campaigns than CMP brands in our sample). Since a single brand can execute very different campaigns across time and the context of execution differs, we estimate CMP and CMP × PP on sales separately for each campaign (index i with a maximum of 3 in one case in Equation 1).
We use a multilevel approach with two levels to account for heterogeneity across brands and chains. The first level comprises the sales, whereas the second level accounts for heterogeneity in parameters. In terms of CMP and CMP × PP, Models 1 and 2 account for this heterogeneity with campaign-specific intercepts that vary by brand and chain for the first level estimates. Model 3 extends the second level by adding the set of contextual moderators to understand what drives the heterogeneity of effects.
As our data cover a period of eight years, potential shifts in market conditions or consumer preferences during this relatively long period can make sales comparisons difficult to interpret (e.g., comparing year 1 sales with CMPs to year 8 sales without CMP). To account for such shifts, we split the data into four periods of two years each (years 1–2, 3–4, 5–6, and 7–8). This is a common approach with regard to sales promotions (e.g., Neslin and Van Heerde 2009) and infrequent events (e.g., Cleeren, Van Heerde, and Dekimpe 2013). Specifically, we run a hierarchical Bayesian estimation with separate estimates for all parameters for each of the (four) two-year periods. We estimate all parameters simultaneously and then compute average effects across all two-year periods that we weight by the uncertainty of each parameter estimate. 1
The posterior densities of the parameters in our models are obtained using 100,000 Markov chain Monte Carlo draws (50,000 burn-in for calibration), following a hierarchical Bayesian specification. As a measure of statistical significance, we compute p-values that reflect the highest posterior density intervals.
According to the first-level equation, the unit sales q of brand b in chain c at week t are a function of the number of CMP campaigns i of brand b as well as the brands’ PPs, advertising, and controls:
2

When accounting for the interaction of CMP and lnPP, β1,ibc reflects the effect of CMP when lnPP = 0 (with PP measured as a price index and PP = 1 in times without promotion, such that lnPP = 0). Over the full length of the campaigns, we do not observe changes in PP activity with and without CMP, suggesting PP and CMP decisions are independent. This makes the estimated value of β1 an inadequate summary of the average effect of CMP, because it implicitly assumes brands would cease all PPs during CMP. We therefore first estimate a Model 1 without the CMP × PP interaction to obtain an average estimate of CMP effects, controlling for PP effects. This is of primary interest for brands that add CMP to their current marketing activity. Model 2 adds the interaction between CMP and PP. The estimated parameter β1 now represents the impact of CMP without a concurrent PP, and the estimated value of β3 represents the change in CMP effects due to PP. Model 2 therefore addresses the question of how firms can further optimize the mix of CMP and PP when joint decisions of both instruments are possible.
We take the effects of competitive CMPs into account by including a dummy for CMPs of competitors in the same product category as CompCMPbct. Competitive PP comprises two variables: price-based competition within chains, BRCompPPbct, and price-based competition across chains, ChainCompPPbct. We further control for other forms of brand sales support, specifically a brand's level of non-PP activities, NPPbct, as well as their advertising expenditures, Adstockbct. Additionally, we use two sets of control variables: a set with all seasonal dummies,
For CMPs, we test for lagged effects for the weeks after the CMP campaign ends by including dummy variables for each subsequent week. In a similar way, we account for dynamic lagged effects of PP. For both PP and CMPs we determine the relevant number of lags by starting with a lag length of six weeks and removing insignificant lags iteratively (Van Heerde, Leeflang, and Wittink 2000, 2004). Note that dynamics of advertising expenditures are already captured in the Adstock variable.
We assume that the error terms
We let all first-level parameters s beyond these fixed effects vary at the brand and chain levels. In the case of CMP and CMP × PP, the parameters also vary at the campaign level (i). Equation 2 models this latter heterogeneity:
Models 1 and 2 set all parameters γ1–7,s to zero (i.e., limit Equation 2 to γ0,s and vs,(i)bc). In this case, γ0,s represents the average effect of the first-level variable s. All second-level equations have their own normally distributed error term
Brand pricing strategy (BrPriceStratibc) comprises the two variables of relative price position compared with competition and the prior frequency of PPs. Regarding past PPs, we study frequency because brands that frequently promote signal to consumers that waiting for the next promotion may pay off (Foekens, Leeflang, and Wittink 1999).
Brand positioning (BrPosibc) is measured by a dummy for brand leadership. Category assortment (CatAssortibc) consists of two variables, horizontal and vertical differentiation.
The contextual controls
Table 2 provides an overview of which variables enter the first versus second level, their descriptives, and their exact operationalization.
Overview of Measures.

Descriptive statistics of the unit sales are not meaningful, as they are based on different measurement units (grams, milliliters, or pieces).
Variable based on another variable in this table.
Based on all brands that fulfill the selection criteria for the first-level analysis, that is, more than 3% market share within the two-year period. The latter is determined separately for each chain.
Scaled first by taking the logarithm, and then scaled to be between 0 and 1, where 0 means the lowest value of all brands or categories, and 1 the highest. Descriptives are without scaling.
Known donation percentages are standardized. When no monetary equivalent is given, the variable is zero, assuming an average donation amount. Descriptive statistics are without scaling.
Variable Operationalizations
Brand sales
Our primary dependent variable is unit sales. We aggregate the SKUs that are associated with an individual brand to obtain brand-level measures. Since some members of the household panel joined while others left during the eight-year observational period, we control for these fluctuations by scaling all purchase quantities relative to the number of respondents in the panel at each point in time.
CMP
Our key independent variable is execution of a CMP. The mean duration of a CMP in our data set is 11 weeks, contrary to traditional PPs, which are typically limited to a single week (e.g., Cooper et al. 1999). The CMPs we identified involved packaging adaptions and were carried out nationwide and simultaneously in all stores of the retail chains in question. Almost half of the campaigns in our data do not mention donation amounts on their packaging, but refer instead to the donation in nonmonetary terms (e.g., donating a tree or a vaccination). Since consumers do not know the monetary value of these donations, we could not compute meaningful elasticities based on a continuous measure of donation size. Therefore, building on other promotion research (e.g., Guyt and Gijsbrechts 2014), we use a dummy specification that reflects whether and when each brand executes a CMP. However, consumers could have responded to the donation amounts brands did actually communicate, or made inferences about amounts whenever this information was absent. To control for a potential impact, we collect information on donation amounts and include it as part of the control variables in the empirical model.
Price promotion
For PPs, we use an index that disentangles actual price from the regular price. We follow standard procedures in the PP literature and use cubic splines with asymmetric weights to smooth the regular price data. In the algorithm, positive errors are weighted ten times stronger than negative errors to construct a smooth regular price based on the observed price fluctuations (Fok et al. 2006). The cubic splines aim to capture the structural changes and patterns in price, but not short-term changes like discounts. Therefore, short-term price drops in the event of a discount are weighted less in the computation of the smoothed regular price. We divide the actual price by the smoothed regular price to obtain a PP index, which is 1 in periods when no PPs were offered and less than 1 in periods that featured PPs, with the amount below 1 reflecting the depth of the PP below the regular price. We use this continuous measure of PP depth because PP depth is highly visible and relevant to consumers during the PP itself. With a continuous measure, we also have, at least in principle, more explanatory power. Based on the continuous measure, we can compute price elasticities that compare to both prior research and the size of the CMP sales lift. This also allows us to understand which PP depth is needed to drive CMP sales lift.
Next, we outline the operationalization of the contextual moderators that we use in the second level of our model to explain the heterogeneity in CMP effects and their interaction with concurrent PPs. We operationalize these variables at the brand-chain-campaign level.
Brand pricing strategy
We capture the relative price position based on all brands in our sample, considering the average price for each brand over each two-year period. To make the measure of price position comparable across categories, we normalize it on a scale from 0 (the cheapest brand) to 1 (the most expensive brand) and place the CMP brand's price position on this spectrum. We compute the relative price position as the average of each of the two-year periods to capture long-term consumer price expectations. This also makes the measure of price position different from the measure of PP that fluctuates on a weekly level.
Since consumers can form expectations about the likelihood of future PPs based on past PPs, we take the brand's (perceived) frequency of PPs into account by computing the percentage of discount purchases that households in the GFK panel reported within the two-year period. We use this measure because it ensures that consumers noticed these promotions, so that they can recall them later, and said promotions are substantial enough to influence future expectations. Note that consumers may have failed to enter some of the past PPs into GfK's database. We expect that whenever they did not recall promotions directly after purchase, those promotions would not impact expectations of how long consumers would have to wait for the next PP to happen. We also scale the log of PP frequency between 0 (lowest value) and 1 (maximum) to make the effect comparable to the other variables and between categories.
Brand positioning
Leading brands are often part of consumers’ relevant consideration set. We identify the relevant leading brand by measuring the brand's average market share over each of the two-year periods, and code the brand with the highest average share as the category's brand leader. This approach is based on Gielens (2012), who also studies cross-category effects and shows the unique position of brand leaders. Note that market share itself would not identify market leaders with high consideration likelihood, as differences in maximum market share differ across the categories we study. It could also create unwanted correlations with other measures of competition because attainable share is a function of market fragmentation. We did investigate alternative specifications of brand leadership that control for market fragmentation, and found directionally and statistically consistent results in almost all cases (see Models RC4 and RC5 in Web Appendix W3).
Category assortment
To capture decision complexity for consumers, we include the number of category flavors and package sizes available to consumers (SKU breadth) as a measure of horizontal differentiation. As an operationalization of the vertical differentiation in a category, we compute the level of price dispersion by taking the difference between the maximum and minimum prices of all brands in a category. We follow prior research in normalizing this range by the average price level across all brands in the category (Fok et al. 2006) to disentangle price dispersion from differences in average price levels across categories. We log-transform both values and scale them between 0 and 1 to normalize the distribution of the variables and minimize the effects of outliers.
Given that the retail context can change with each two-year period and differ from retail chain to retail chain, we measure all relevant variables (including our main moderators related to pricing, brand leadership, and category competition) at the brand-chain-period level for each of the 63 CMP campaigns, the four retail chains, and the four two-year periods.
Control variables
We add several control variables to isolate the effect of CMP. Most importantly, we control for the role of advertising by constructing an Adstock variable (e.g., Guitart and Stremersch 2021; Van Ewijk et al. 2021), since advertising in one week can influence customers in the following weeks. To identify the optimal carryover parameter, we apply a grid search based on best model fit and obtain an optimal value of .77, which is comparable to meta-analytic values (Köhler et al. 2017). In addition, we perform a robustness check in which we control for total advertising expenditures directly (instead of stock values) and find that results are robust for these operationalizations, with similar effects in direction, size, and statistical significance (see Model RC1 in Web Appendix W3).
Still, brands could plan marketing actions in conjunction with launching CMPs to maximize their effect, resulting in correlations between CMPs and sales. We investigate whether brands systematically increase advertising in tandem with CMPs for exemplary firms that engage in low, medium, and high levels of advertising, and find no systematic correlation (see Figure W1.1 in Web Appendix W1).
We control for the effects of non-PPs (e.g., sweepstakes, premiums) on sales based on the fraction of the brand's SKUs purchased in response to these promotions, according to GfK panel data (see also Fok et al. 2006). Theoretically, these promotions are also less likely to drive CMP sales lift because they are as complex to process as CMPs are. Since they often do not exist within a category either, their selective availability also makes them less useful than PPs as a screening criterion that consumers could consistently apply. We still control for the information on these promotions at the brand-chain-week level to obtain the best possible estimate of the CMP effect on sales.
We control for competitive effects of CMPs and PPs in several ways. First, for the competitive CMPs, we use a dummy for a competing brand in the category offering a CMP. Second, following prior research (e.g., Fok et al. 2006), we focus on competitive PPs to control for the effects of competition in a category by constructing a sales-weighted average of the PP indices of all competing brands in the category of the same retail chain. Third, the GfK data indicate that households frequently purchase from multiple retail chains, which makes PP competition across chains potentially influential. In our data, customers switch chains to purchase the same brand in 17% of all shopping trips, perhaps because buying the same product for less at another chain involves lower subjective switching costs than choosing an entirely different product and brand, possibly due to the high density of supermarkets in the regions we study. To control for this impact of PPs in competitive chains, we compute a sales-weighted average of the focal brand's PP index in competing retail chains. Note that research with similar household data has also separated these two variables and obtained adequate estimates of sales promotions this way (Keller, Deleersnyder, and Gedenk 2019).
Finally, we follow standard modelling procedures in controlling for time-varying, unobserved components by including control variables for all major holidays (Easter, Pentecost, and Christmas), and dummies for the quarters of a given year. In addition, when we include the contextual moderators, we control for the donation amount and purchase frequency of a given category at the brand-chain-campaign level. We base the purchase frequencies on raw household data from GfK and calculate them as the average interpurchase time between two repurchases in the same product category. Following other continuous variables, we also take the log of interpurchase time and scale it between 0 and 1.
Endogeneity
The potential sources of endogeneity are brands’ self-selecting into conducting a CMP, and omitted variables that can correlate with both executing a CMP and brand sales. More generally, bias could arise because of unobservable variables that vary across time and/or brand. Unobserved time-specific confounders correlated with sales are controlled for via holiday and quarterly dummies. Brand-chain fixed effects account for time-invariant brand-specific variables (see also Papies, Ebbes, and Van Heerde 2017).
In terms of brand- and time-specific sources of endogeneity, certain brands may choose the timing of CMP strategically to counter (or capitalize on) negative (or positive) demand shocks. We consider this unlikely, as the brands that conducted multiple CMPs executed them in a relatively standard way in terms of both duration (number of campaign weeks) and timing in a given year. CMPs are also specified a priori in promotion calendars and are even communicated, as shown in our promotion database, several weeks ahead of time, based on negotiations and deliberations among brand and retail managers and nonprofit organizations. In addition, CMPs require changes to packaging, which cannot be implemented immediately. Therefore, for brand- and time-specific factors to play a role, brand managers would need to anticipate market conditions and sales several weeks before implementing a CMP.
Results
Table 3 reports the average CMP effect and the average impact of all other variables across brands, retail chains, and time.
Results on the CMP Main Effect on Unit Sales (First Level).

*p < .10.
**p < .05.
***p < .01.
The Average CMP Sales Lift
In Model 1, we find an average PP elasticity of β2 = −2.870. The size of this effect is comparable to the outcomes of the meta-analysis by Bijmolt, Van Heerde, and Pieters (2005) that finds an average elasticity of −2.62 across 81 different studies with 50% of observations ranging between −3 and −1.
In terms of postpromotional dips, we find significant lagged effects over five weeks; as expected, these diminish over time. Competitive price elasticities across retail chains are also in the expected direction, suggesting that consumers shop at multiple retailers and purchase the products they want wherever they are cheapest. Similarly, the effects of non-PPs and advertising are in the expected direction, both having a positive impact on sales. Specifically, the size of the advertising elasticity (β8 = .027, p < .01) is in line with prior empirical findings. For instance, Sethuraman, Tellis, and Briesch (2011) document an average advertising elasticity of .12 in a meta-analysis for studies between 1960 and 2008, also noting a significant decline in elasticities over time. More recently and in line with our observational period, Shapiro, Hitsch, and Tuchman (2021) find an average of .023 across 288 FMCG brands. These observations suggest the econometric model is a plausible representation with reasonable effect sizes of a typical FMCG market.
More central to this investigation, CMPs have a significant positive weekly multiplier effect (β1 = .048, p < .05). In contrast to many other forms of sales promotions, CMPs run for multiple weeks. The average duration of the CMPs we observe is 11 weeks, with a constant weekly multiplier effect of 1.049 (expβ1 = .049) compared with a nonpromotional week. In terms of competition, we find no impact when rival brands execute CMPs (p > .10), which is in line with the low competitive effects between brands within retail chains (Table 3).
Regarding the time period after the CMP, we find no significant lagged effects for CMPs, and adding them does not impact results (see Model RC3 in Web Appendix W3). Apparently, CMPs do not motivate customers to stockpile or accelerate consumption as do PPs. For this reason, we estimate the empirical models without CMP lags and refrain from studying potential interactions between lagged CMP and lagged PP.
To put the CMP multiplier effect into perspective, we can compare it to the change in sales of a 10% PP, which is 28.70% (given the price elasticity of 2.870). This effect would be almost six times that of an average CMP week (4.9%). However, for a fair comparison, we need to take differences between the two promotional instruments into account. Specifically, we observe that CMPs and PPs differ in their average promotion depths, their average promotion duration, and the occurrence of postpromotion dips.
The average CMP donation depth we observe is 3.2% of product price, which is well below conventional levels of PP depth. Specifically, PPs that offer savings of less than 10% are often ineffective because consumers do not notice them or do not consider them to be of relevant value (Gupta and Cooper 1992; Nunes and Park 2003; Van Heerde, Leeflang, and Wittink 2004). As a consequence, we usually observe PPs that are much higher than 10%. Based on the 3.2% average donation amount, we can compute an average donation elasticity. Specifically, a 3.2% donation results in a 4.9% increase in sales, corresponding to an elasticity of 4.9/3.2 = 1.531. This is a little over half of the PP elasticity of −2.870 in absolute terms.
Conventional one-week PPs are also much shorter than the average of 11 weeks for CMPs. Executing PPs over such durations is not advisable, because longer and repeated PPs can result in stronger postpromotion dips (e.g., Kopalle, Mela, and Marsh 1999; Van Heerde, Leeflang, and Wittink 2000). We also observe such dips with diminishing effects over five subsequent weeks (from .137 to .077, p < .01). An overuse of PPs can also erode consumers’ price expectations (Lattin and Bucklin 1989) and brand equity (Zenor, Bronnenberg, and McAlister 1998).
Taking these differences between CMPs and PPs into account, we can compute an illustrative longer-term comparison of CMPs and PPs with hypothetical sales numbers (Figure 3). We assume baseline sales of a hypothetical brand of 100 units without any PP or CMP: for each of the 11 weeks of CMP, the brand achieves additional sales of 4.9% compared with the weekly sales before the CMP, resulting in additional sales of 54 additional units at the end of week 11. To attain this sales lift the brand donates 3.2% of product price per week or a total donation value of 35.2% of product price over the full 11-week duration.

Sales Unit Lift of an 11-Week CMP and Two Comparable PPs.
We can compare this to an equivalent-sized PP with a single one-week rebate of 35.2% of product price or, more realistically, two weeks with a 17.6% discount each. For each week with a 17.6% PP, the additional sales lift for the brand with baseline sales of 100 units equals 50.2 units (given the price elasticity of −2.87). However, these two PPs do not sum to an effect of 100.4 because of postpromotion dips. Considering these dips, the net impact of the comparable two PPs is 80.9 additional units (Figure 3). The total CMP sales lift is therefore two-thirds of what comparable PPs can achieve in the same period.
This analysis of the relative effectiveness of CMPs versus PPs suggests that these promotional instruments have more comparable sales potential than a simple observation of weekly effects might indicate. As CMPs are, in contrast to PPs, under the full execution control of the brand, CMPs can be a valuable instrument in a brand's promotion arsenal, especially when planning with longer promotion periods.
Our conceptual framework (Figure 2) further suggests that the average CMP sales lift may underestimate its potential under individual circumstances. Also note that the average CMP effect includes average levels of concurrent PPs and we expect PPs to drive the CMP sales lift. To understand to what extent higher PPs moderate the CMP sales lift, we study the interplay between PPs and CMPs in more detail next.
Concurrent PPs’ Moderation of the CMP Sales Lift
In Model 2, PP is centered at a zero discount such that CMPs’ main effect is the effect without any discount. The interaction with PP reflects the increase in sales lift when a PP is added. We find that the average CMP main effect becomes insignificant when the PP moderation is included; that is, without any nationwide discounts over the full CMP duration, we find no statistically significant evidence that CMPs are, on average, effective sales promotions on their own (Table 3). The interaction CMP × PP is significant, with an estimated value of β3 = −.664 (p < .01). This means that a 10% price reduction increases the CMP sales lift by an average of 6.64% over and above the main effect of the PP. This result is in line with our theoretical prediction that a PP helps the CMP brand enter the consideration set. Once in the consideration set, CMPs are noticed and consumers respond to them beyond the effect of the PP itself. Given that PPs of up to 20% are not uncommon both in practice and in our data, CMPs can achieve a strong practically relevant sales lift during the weeks of PPs. We test for an interaction between CMP and non-PP and find it to be insignificant. In line with our theoretical predictions, non-PPs themselves are also likely not able to drive consideration (see Model RC2 in Web Appendix W3).
These findings suggest not only that PPs and CMPs are complementary instruments in terms of their immediate versus cumulative sales potential, but also that their simultaneous execution is preferable to a separate implementation. At the same time, it is important to realize that PP support over the entire length of a CMP campaign is unlikely to be an optimal strategy, as a prolonged PP is likely to be detrimental to future price expectations and brand image.
Contextual Factors’ Moderation of the CMP Sales Lift
While brands can execute PPs in the short term to boost their CMP effect, our conceptual model (Figure 2) contains additional contextual moderators that should be considered when deciding whether or in which context to pursue CMPs. Next, we discuss the parameter estimates of Model 3, which includes all contextual moderators related to a brand's pricing strategy, brand leadership, and category assortment. Table 4 summarizes these results.
Direct impact of contextual moderators on CMP sales lift
Model 3 reveals several ways that contextual variables impact the effects of CMP.
Brand leadership and attractive pricing drive CMP effects, as expected theoretically. Specifically, a 10% higher price relative to competition (i.e., a .1 change in the price range in a category) decreases the brand's CMP sales lift by 1.94% (γ1,1 = −.194, p < .05). Similarly, frequent PPs can result in purchase delay and reduce CMP effects (γ2,1 = −.359, p < .05). Recall that our model is centered on a zero discount during CMPs: brands that offer frequent PPs appear less attractive during periods when no PP is offered and are less likely to be considered in sufficient detail, thus lowering the CMP's effect. Conversely, brands can help ensure that CMPs will drive consideration when they lower prices relative to the competition and run minimal PPs outside of a CMP offering. Compared with other brands, brand leaders in the category are also more likely to be evaluated in greater detail even without PPs, resulting in a larger CMP sales effect for category leaders versus nonleaders (γ3,1 = .175, p < .01).
We do not find a significant impact of donation amount (p > .10), suggesting that whether a CMP is executed matters more than how much is being donated. This is consistent with prior experimental findings (Arora and Henderson 2007; Müller, Fries, and Gedenk 2014). However, the brands in the actual marketplace donated relatively little (3.2% of product price; SD = 3.5%). Based on our data we cannot know whether larger amounts would make a bigger difference.
Contextual moderators’ indirect effect on CMP via its interaction with PP
As Model 2 has demonstrated, a concurrent PP is a highly effective short-term instrument for ensuring that consumers consider a CMP and that the brand will attain a CMP-related sales lift. The negative interaction reflects the positive effects of price reductions on CMP effectiveness.
We observe that higher relative prices lessen the probability that a brand will enter a consideration set, and a concurrent PP can compensate for this. Accordingly, we find that higher prices are associated with stronger (more negative) effects of the CMP × PP moderation (γ1,3 = −1.527, p < .01). This means high-priced brands benefit more from concurrent PPs in terms of CMP sales lift than low-priced brands. Similarly, PP frequency has a negative effect on the CMP × PP moderation (γ2,3 = −1.904, p < .10). Brands that promote frequently also need PPs during CMPs to avoid being excluded from consumers’ consideration sets. Further, brand leaders have less need for concurrent PPs to benefit from CMPs, as evidenced by a positive impact on CMP × PP (γ3,3 = .788, p < .01).
In line with these observations, the assortment complexity of the category in terms of both vertical (γ4,3 = −1.747, p < .01) and horizontal differentiation (γ5,3 = −.773, p < .05) increases the negative CMP × PP interaction. Apparently, more complex assortments that complicate comparisons of options make PPs more helpful in attaining the CMP sales effect.
Predicted CMP Sales Lifts as a Function of PP and Contextual Moderators
To understand the nature of these interactions among PPs and contextual moderators in more detail, we compute the predicted sales lift from Model 3 as a function of the depth of the PP for both high and low values of each contextual moderator (Figure 4). We average PPs over the full CMP period and find that brands do not systematically alter PP activity during CMPs, and are not inclined to cease PPs during CMPs. They may not even be able to do so, as retailers also execute PPs. To make our analysis managerially meaningful, we therefore investigate a relevant range of discount levels between 5% and 20% over the duration of the CMPs. Each resulting plot in Figure 4 keeps all other contextual variables at their means, and plots the PP effect for each contextual moderator one standard deviation above and below each respective mean. The percentages on the y-axis represent the expected sales lifts.
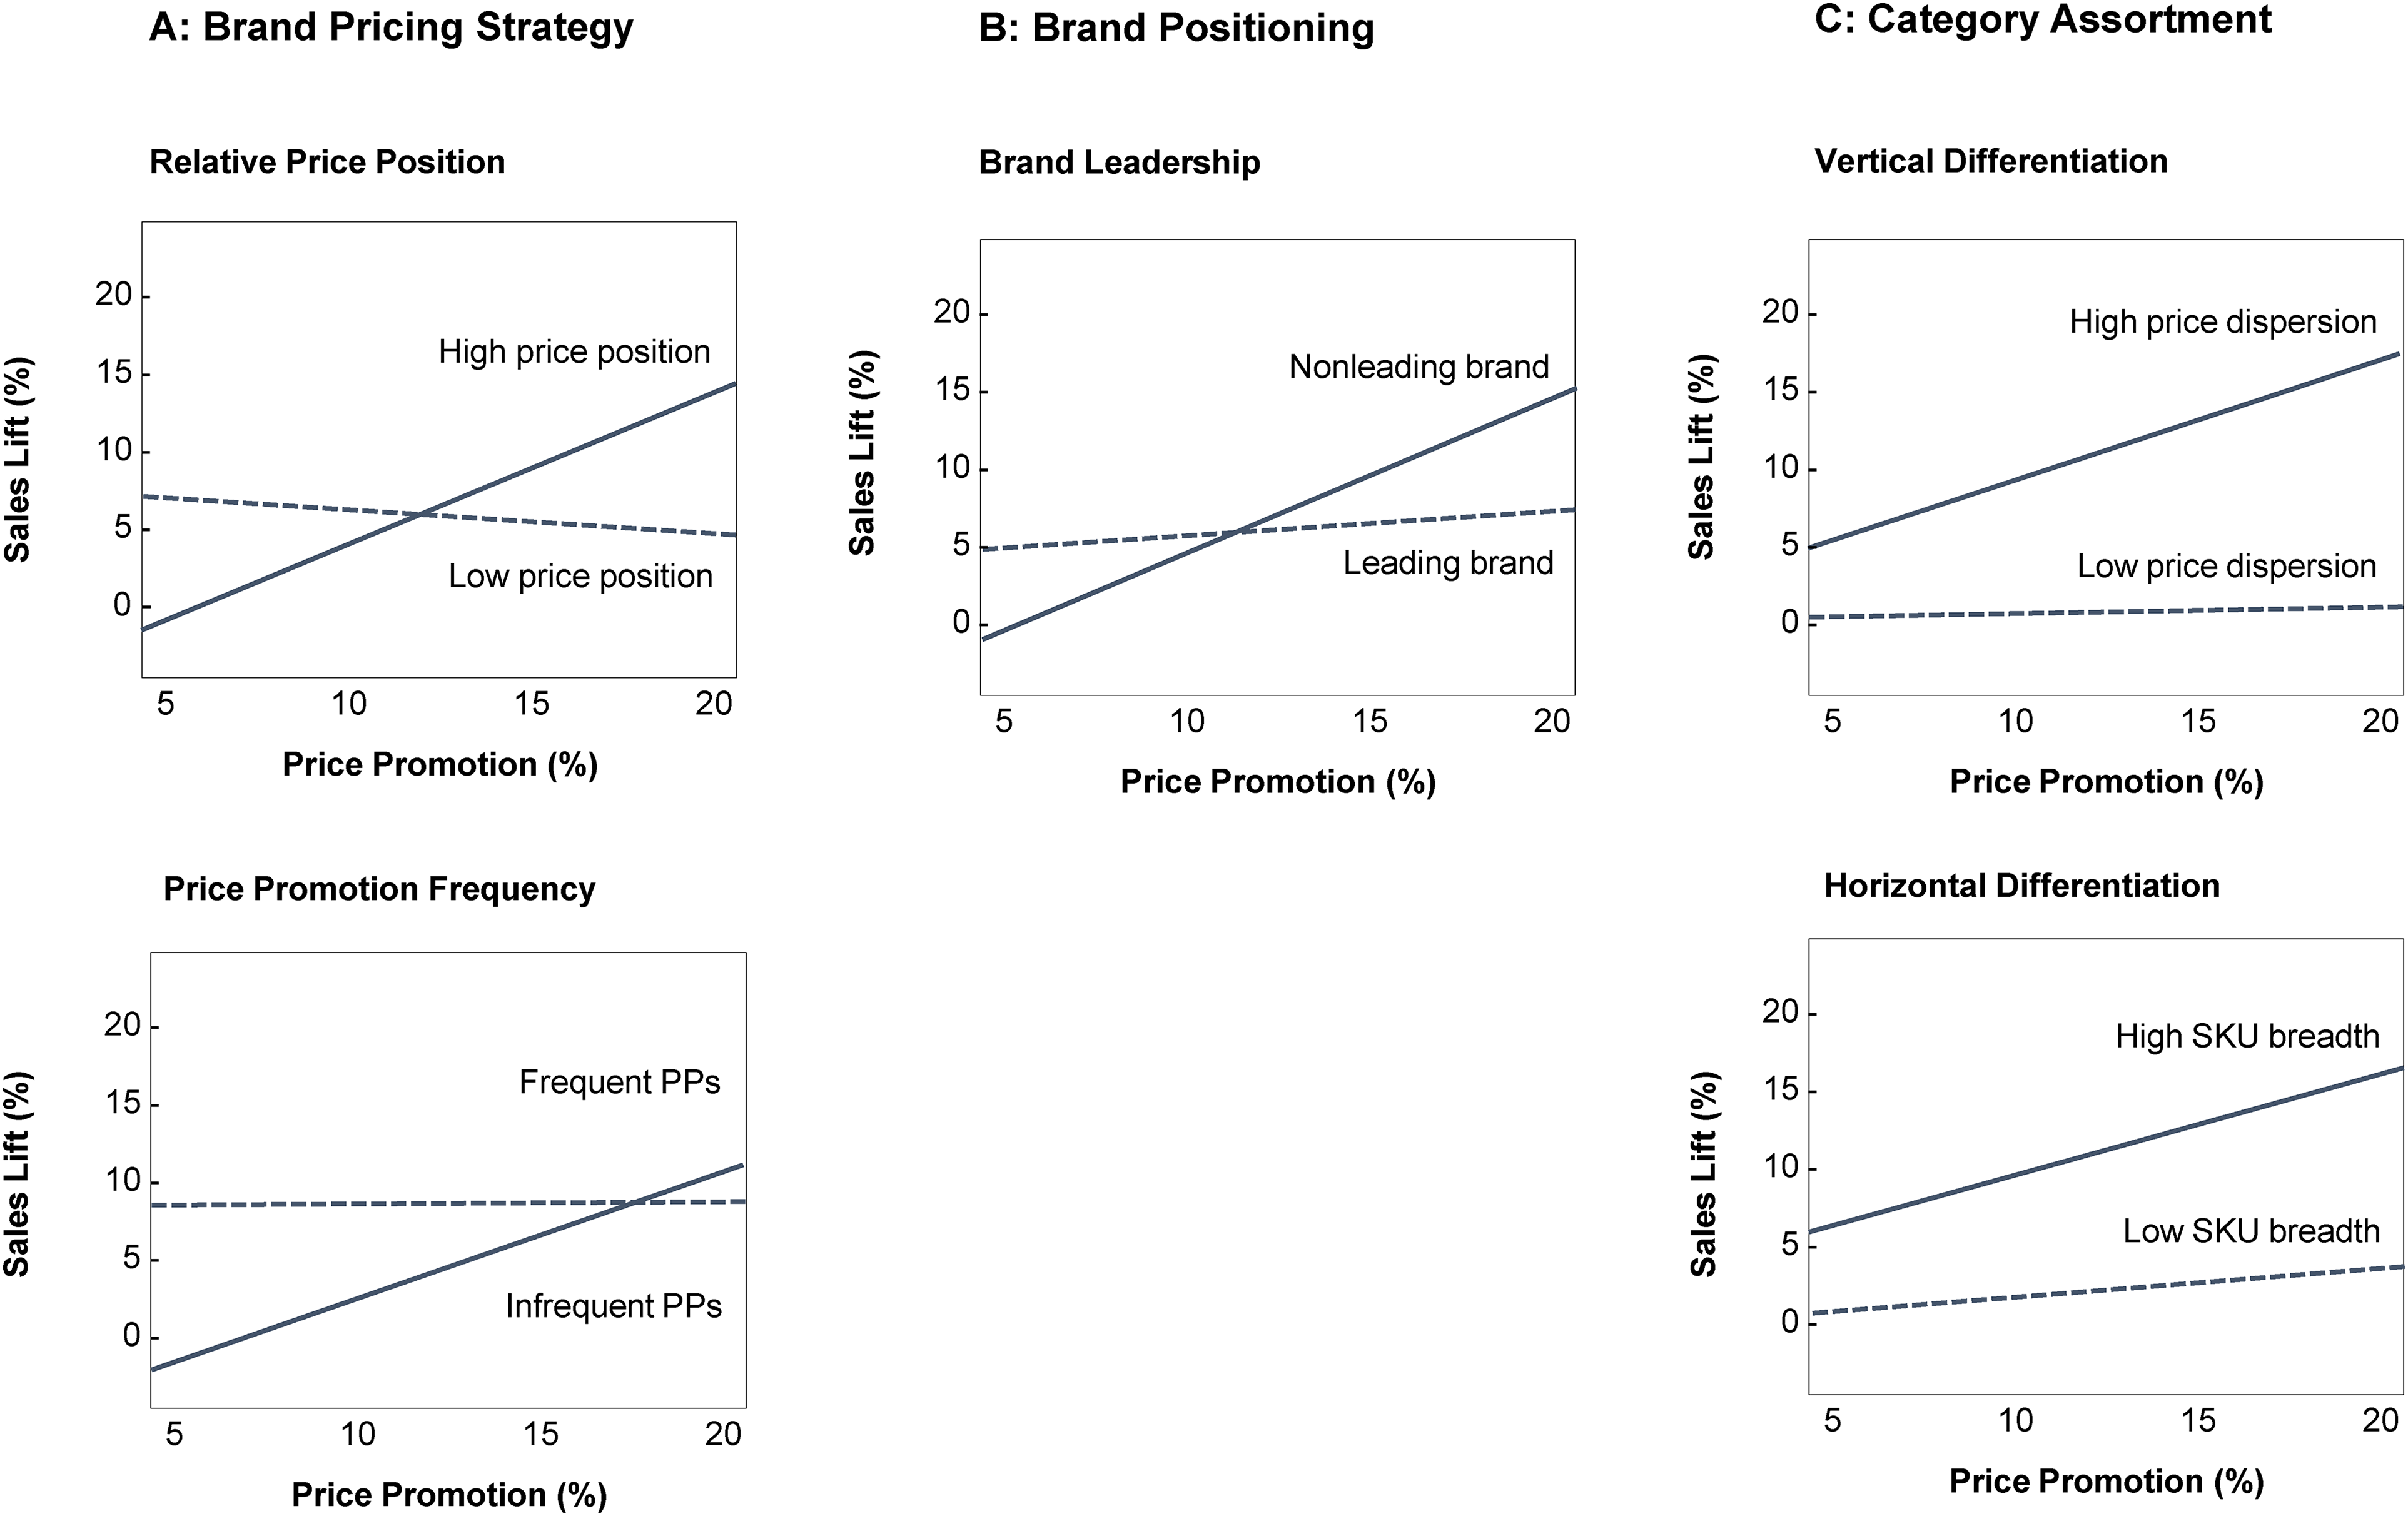
Sales Lift Due to CMP and as a Function of PP and Contextual Moderators.
Figure 4 shows that brands with less attractive pricing strategies (high prices, frequent PPs) fail to ensure that their CMPs will enter the consideration set when the PP level is low, that is, they have a higher need for PPs (so that customers will notice the CMPs). Conversely, low-priced brands can attain a CMP sales lift of 7.8% even with low PPs, and they derive no benefit from discounts. With a sizeable discount of 20%, high-priced brands can attain even higher CMP effects of 13.8% during the weeks of the PP. The results for PP frequency follow a similar pattern, showing no sales lift for brands with frequent PPs when they offer low discount levels during a CMP campaign. When PP frequency is one standard deviation below the mean, an 8% CMP sales lift can be attained even without a PP. Brands that have frequent PPs require an average 17.3% discount to attain the same sales lift.
When combined with PPs of 11.5% or more, the CMPs of nonleading brands can attain a higher sales lift than those of brand leaders with similar discounts, probably because consumers are less certain about nonleading brands. Interestingly, when deep PPs are offered, this finding replicates results from prior lab experiments showing that CMP effects are stronger for unknown brands (Arora and Henderson 2007). Whereas these studies assume consideration as a given, we find that in the actual marketplace, consideration of less established brands has to be bought, and high-value PPs are a means to do so. Without PP support, effects at the point of sale are reversed (i.e., stronger brands have stronger CMP effects; γ3,3 = .175; Table 4).
Results on the Main and Moderating Impact of CMP on Unit Sales.

*p < .10.
**p < .05.
***p < .01.
Figure 4 further illustrates that PPs have a small to negligible effect in simple assortments with limited numbers of SKUs and low price dispersion. Conversely, in complex markets, executing a CMP together with a 20% PP can be highly effective, with predicted CMP sales lifts of 15.6% and 17.2% for markets with horizontal and vertical differentiation, respectively.
Discussion
This research provides field evidence showing how CMP drives sales under actual retail conditions. The sales analysis offers a novel perspective on CMPs' effectiveness, extending previous experimental work. It reveals additional contextual moderators that are relevant in actual retail settings. These nuanced effects moderate the CMP sales lift in both predictable and practically relevant ways. All of these effects are consistent with heuristic screening and the assumption that CMP alone does not ensure consumer consideration. So far, attention has been focused on how to best execute and communicate a CMP in terms of campaign design. Our research adds the important notion as to when CMP is most promising, and which brands and markets can expect the highest sales lifts.
Implications for Economic Benefits of CMPs
CMPs as sales promotions under average conditions
A CMP's average weekly sales lift of 4.9% is lower than that of conventional PPs. At the same time, the average CMP donation of 3.2% of product price is also lower in absolute terms than conventional price discounts. CMPs might therefore have certain advantages over PPs, as they require lower depth of donations than meaningful rebates but also can run over longer durations, and feature no postpromotion dips according to our analysis. In addition, whereas PPs can have negative effects on brand equity (Zenor, Bronnenberg, and McAllister 1998), CMPs might even increase brand perceptions (Schamp et al. 2023). Because CMPs must run longer to attain a cumulative sales effect comparable to that of PPs, PPs are the better option for large sales lifts in the short term, but even average CMPs have relevant sales potential when their full length is considered.
These findings have further implications for the relationships between FMCG manufacturers and retailers. Whereas decisions about PPs are often made by retail channels, CMPs are mostly initiated by manufacturing brands. CMPs therefore offer brands a chance to make additional promotion decisions on their own. Since manufacturers and retailers can both benefit, there is likely common interest. Our results are in line with the view that consideration plays a strong role. Accordingly, making CMPs more visible likely has strong effects on attainable sales lift. Coordinated action and support of CMPs from retailers (e.g., additional displays, or extra shelf space) have much potential in this regard. Joining forces for a charitable cause might also be an especially promising building block in increasing trust between retailers and brands (e.g., Kumar 1996).
Brands and retailers also benefit from aligning their promotion strategies. On average, CMPs are most effective when paired with a concurrent PP. Therefore, by working together as partners, retailers and manufacturers can maximize sales—and donation amounts for the charitable cause—by harmonizing their promotional calendars. For this purpose, brands and retailers need to understand which brands are best positioned to benefit from CMPs and coordinated actions.
When and how to attain above-average CMP effects
In our sample, 24% of the CMPs outperform comparable PPs (accounting for the full promotion period). These particularly successful CMPs were carried out by brands that are average or above average in terms of consideration likelihood, based on all three brand-price dimensions (i.e., market leaders that are low- to average-priced, with low to average PP frequency). Such brands neither require nor benefit from additional PPs. The remaining 76% of the CMPs in our sample do not reach that level. Some (but not all) could have compensated for the less favorable position with additional PPs.
Table 5 summarizes when PPs are likely to be particularly useful. PPs are not needed when brands are likely to be considered due to their brand and price position and operate in a category with relatively low complexity (top left). We found (weak) positive effects of PPs for brands with less attractive brand-price positioning (nonleading brands, high-priced brands, or high PP frequency) in these simple markets (top right), or vice versa have more attractive brand-price positioning, but operate in complex markets (many SKUs or high level of price dispersion; bottom left). Interestingly, brands that may appear at a disadvantage in terms of consideration, that is, brands operating in complex markets with less attractive brand-price positioning, can benefit most from PPs (bottom right). During PPs, these brands can attain even higher sales lifts than better-positioned competitors (see also Figure 4). This might happen because the former have more to gain in terms of market share, and customer preferences are less solidified. This view is in line with arguments that CMP has the largest impact when it tips the scales for otherwise uncertain consumers (Arora and Henderson 2007). We find field evidence in keeping with this conjecture, but it applies only when concurrent PPs ensure that consumers will consider the brand.
Differential Impact of PP on CMPs’ Sales Lift.

Managers who are unaware of these relationships may draw the wrong conclusion when evaluating past CMPs. For example, we find that CMPs can also be ineffective. In such situations, it is tempting to draw the conclusion that customers do not care about ethical campaigns. Our conclusion is more conciliatory: rather than a lack of interest, consumers may simply not have noticed the CMP.
Nonleading brands in our data actually reduced their PP activity by 19% during their CMPs, compared with periods without CMPs. Our empirical model shows that this either-or promotion strategy can lead managers to miss out on opportunities. We do not find this pattern for brand leaders, which continue with similar PP activities during CMPs. However, brand leaders benefit much less from concurrent PPs than nonleading brands do. These findings suggest that managers could employ better mixes of CMPs and PPs to optimize their sales promotion strategies.
Illustrative counterfactual analysis
To illustrate these conclusions, we return to the introductory example of the honey brand and the beer brand. Recall that the two brands donated similar amounts to reforestation projects with the same partner, WWF, and also donated a similar fraction of product price. Based on the empirical results, we estimate the CMP sales lift of both campaigns and simulate the potential of different promotional choices. The honey brand is not a leader in its category and featured an average price, and it did not execute PPs in parallel with its CMP, so the CMP had a low likelihood of being noticed. The category-leading beer brand, in contrast, was priced below its competition and carried out above-average PPs during the CMP, so consumers’ consideration of its CMP was more likely. The econometric model of this research allows us to isolate the sales lift with better control than in the descriptive analysis from the introduction. Whereas the honey brand's CMP sales lift was indeed negligible at .9%, the beer brand's CMP achieved a sizeable weekly sales lift of 15.4%.
The honey brand may conclude that CMPs have little potential; indeed, our data hold no further CMPs of this brand. However, based on the model estimates, we can simulate the CMP sales lift the honey brand could have achieved if it had executed a higher level of PPs. With a concurrent PP of 10% during the CMP, the honey brand could have attained an 11.2% weekly sales lift on top of the PP impact. This means that its CMPs have more sales potential than a simple market observation indicates. However, these conclusions related to concurrent PPs do not apply to the beer brand. The beer brand could have ceased all PPs during the CMP and still achieved a weekly CMP sales lift of 14.3%, which is only slightly below the 15.4% lift the brand obtained with its actual PPs.
Note that these insights are difficult to obtain with common designs of survey-based experiments. Prior academic research either examines attitudinal responses or elicits preferences between a few alternatives. Several studies also involve the use of conjoint analysis to determine CMPs’ effectiveness (e.g., Arora and Henderson 2007). Such research designs are also tempting in applied market research when firms seek to determine whether to pursue CMP activities. However, these studies only generalize when consumers follow compensatory decision rules and evaluate all available products comprehensively. In the actual marketplace, individual brands may not achieve sufficent attention to make CMP as effective as a conjoint analysis might suggest. To achieve greater external validity, the actual market complexity, brand positioning, and pricing strategy should be taken into account.
Limitations and Directions for Further Research
Like all studies, this study has limitations. The brands we observe featured only a small cause logo and/or a brief description of the campaign on their packaging (Figure 1), and the consumers in the GfK panel may not have noticed these small indications. Brands also did not systematically alter their advertising activities during the CMPs. While our observations reflect what brands typically do in FMCG retailing, other strategies are conceivable. Brands could add larger images of the causes they support, change their packaging, or coordinate with retailers to strive for extra shelf space, shelf signs, or extra retail placements during a CMP. Although we cannot investigate the impact of such strategies empirically, the concept of consideration-set formation leads to clear predictions. Since CMPs do not appear to ensure consideration in and of themselves, any activity that drives consideration has strong potential to amplify CMP sales lift, in particular for less established brands with less attractive pricing. It would be useful to validate these conclusions and study the impact of such decisions by brands and retailers empirically.
Although we control for many differences between brands and categories, our empirical findings are limited to FMCG and the categories with data available to us. The formation of a consideration set is likely to play a role in other markets, but additional factors may make such markets less suitable for CMPs, resulting in lower effects than those found in this study. For example, higher switching costs for higher-priced purchases may undermine CMPs’ potential, irrespective of the likelihood that individual brands will enter consideration sets. Empirical evidence on market transactions beyond FMCG would therefore be valuable.
Our research has focused on CMPs’ goal of increasing short-term brand sales. Future research could extend our analysis to other objectives, such as increasing brand equity, customer satisfaction, or brand loyalty. Whereas experimental and qualitative research suggests that CMPs could influence these marketing metrics (e.g., Brown and Dacin 1997; Luo and Bhattacharya 2006), we are not aware of actual field evidence on these long-term consequences. Similarly, household data containing full information on competitive prices and CMPs would allow researchers to study customer heterogeneity and how it relates to CMP response. With such data, researchers could also study customer store and brand switching, and the intriguing question as to whether CMPs attract new customers to a store or to a whole category or lure customers away from competition.
Whereas our data have high levels of external validity and the analysis has clear practical implications for managers, our data set does not enable us to investigate the psychological process of forming a consideration set in more detail. However, five significant moderation effects on CMP × PP and three on the main effect of CMP, all in the expected direction, are consistent with this psychological mechanism (Figure 2). Two additional effects of assortment complexity on CMP are directionally in line, but not significant at conventional alpha levels. Taken together, these findings support the theory that consideration-set formation is a useful and relevant perspective to understand CMP sales potential.
However, we cannot rule out the possibility that alternative mechanisms may have played an additional role in some of our findings. For example, for nonleading brands or those with less attractive pricing, we found synergies between CMP and PP, irrespective of market complexity (Table 5). This could be because consumers appreciate the dual benefits of doing good with the CMP, while doing well for themselves. However, this is unlikely to be the only moderator of CMP effects. On its own, such an account does not explain other moderating effects or why PPs have much smaller effects in simple markets, for brand leaders, or for brands with attractive pricing.
Consideration is a necessary (but not sufficient) condition for transactions to take place. Considering the full pattern of our results, we conclude that the early phases of consumers’ decision making are more important than CMP research on more limited decision-making problems indicates. Once a brand enters the consideration set, factors like affinity with the CMP's cause or brand-cause fit—which have been studied experimentally in many studies—are likely to become relevant (see Schamp et al. [2023] for an overview). Experimental research on more complex problems or process evidence (e.g., eye-tracking) is likely to provide additional insight into the relative roles of these factors and those featured in this research.
While promotion research has produced abundant evidence on PPs’ effectiveness, much less is known about other forms of promotion. The present research suggests that other types of promotions that are less visible, expected, and comparable than PPs may also require means to attract attention similar to those found in this research. Likewise, in terms of heuristic screening, other ethical labels (e.g., fair trade labels) are in a comparable position to CMPs, and we expect similar effects to come into play. Therefore, our results may well extend beyond the domain of CMPs to other ethical attributes and other forms of non-PPs that are also difficult for consumers to process. Studying these at the point of sale has considerable potential. We hope our findings stimulate research in these and related directions.
Supplemental Material
sj-pdf-1-mrj-10.1177_00222437231200807 - Supplemental material for Cause-Related Marketing as Sales Promotion
Supplemental material, sj-pdf-1-mrj-10.1177_00222437231200807 for Cause-Related Marketing as Sales Promotion by Christina Schamp, Mark Heitmann, Yuri Peers and Peter S.H. Leeflang in Journal of Marketing Research
Footnotes
Acknowledgments
The authors thank the Aimark Institute and the management of the specialized newspaper Lebensmittel Zeitung for providing data for this research. The authors also thank Tammo Bijmolt, Marnik Dekimpe, Karen Gedenk, Harald van Heerde, and Dominik Papies for their helpful suggestions.
Coeditor
Sachin Gupta
Associate Editor
Kusum Ailawadi
Declaration of Conflicting Interests
The authors declared no potential conflicts of interest with respect to the research, authorship, and/or publication of this article.
Funding
This work was supported by the Competence Center of Experimental Research WULABS at the Vienna University of Economics and Business and the Fundação para a Ciência e a Tecnologia (grants UID/ECO/00124/2019, UIDB/00124/2020), POR Lisboa and POR Norte, and Social SciencesDataLab of Universidade NOVA de Lisboa (grant PINFRA/22209/2016).
Notes
References
Supplementary Material
Please find the following supplemental material available below.
For Open Access articles published under a Creative Commons License, all supplemental material carries the same license as the article it is associated with.
For non-Open Access articles published, all supplemental material carries a non-exclusive license, and permission requests for re-use of supplemental material or any part of supplemental material shall be sent directly to the copyright owner as specified in the copyright notice associated with the article.