
Abstract
Firms like Uber, Amazon, and TripAdvisor have popularized the rating of people, goods, and services. These entities receive scores (e.g., through online reviews) in a variety of presentation formats: incremental (a raw score per episode; e.g., 5–5–2), cumulative (updated average scores; e.g., 5–5–4), or a combination thereof. This article focuses on prevalent situations in which a score deviates from prior scores and examines how the presentation format of the scores impacts decision makers’ (e.g., consumers, managers) evaluations of the entity scored. Across a wide variety of settings, nine experiments document that when a generally well-performing (poorly performing) entity suddenly receives a negative (positive) score, overall performance will be perceived as less negative (positive) when shown in a cumulative format compared with an incremental or combined format. This effect appears to be stronger when the deviating episode is more representative (e.g., due to higher recency or internal attribution). The authors also find evidence for their proposed explanation: a cumulative format distorts individuals’ perceptions of the underlying raw score of the deviating episode. These findings imply that presenting scores in alternative formats may affect marketing outcomes (e.g., customer churn, product choice, technology adoption, new product success, and user engagement on peer-to-peer platforms).
Keywords
Quantitative performance scores (e.g., on a five-point scale) are ubiquitous in today's marketplace—consumers and workers evaluate each other on peer-to-peer platforms, consumers evaluate TV shows, managers evaluate their employees, and professors evaluate their students (and vice versa). With the advent of digital platforms, it is easier than ever for decision makers (i.e., consumers, managers, and policy makers) to access and integrate quantitative scores in evaluations and decisions pertaining to a wide range of entities: their own performance in a game and the decision to continue playing, another consumer's behavior on a peer-to-peer platform and the willingness to interact with this person, the desire to watch a new season of a TV show, or a frontline employee's entitlement to a bonus payment.
One way to present performance information is to use an incremental format: reporting a raw score (e.g., from 1 to 5) after each episode, as done by BlaBlaCar (i.e., a specific score is connected to each ride) and Rate Your Music (i.e., a band’s rating per album is shown on the band’s page). However, the same information could be specified in a cumulative format: after each episode, an updated average score across all episodes up till that moment appears (Alves and Mata 2019). Scores shown to DoorDash delivery and Lyft drivers, for instance, are displayed as an average score (1 to 5 stars) that updates when new customer scores come in. Other companies present performance information as a combination of both formats: product scores on Walmart.com are displayed cumulatively next to the picture of the product, while (a subset of) incremental scores may be found below its textual description. A similar display can be seen on Apple's App Store and Google's Play Store. In Table 1 we discuss examples of scores’ presentation formats in the marketplace (for screenshots, see Web Appendix A) and in Figure 1 we present definitions and illustrations of the key concepts we employ in this work.

Concepts, Examples, and Research Question.
Examples of Scores’ Presentation Formats in the Marketplace.

Some of the platforms also show a frequency distribution or average score on one's profile page reflecting all individual scores received across one's transactions.
Educators may choose to also show an averaged score next to the individual scores if deemed relevant.
Individual textual comments are available further on the website.
For customers seeking to book a carpool drive, both the incremental scores as well as an overall average score are displayed on a driver's profile.
Notes: See also Web Appendix A. Annual revenue numbers have been rounded up.
Despite the omnipresence of the different presentation formats in everyday life, we know little about their influence on the reactions of decision makers. Our research question therefore is: How does the format in which an entity's scores are presented affect decision makers’ judgments? We tackle this question in the context of so-called deviating raw scores (i.e., raw scores that depart from prior scores). For instance, a customer may receive a 1 out of 5 score on a peer-to-peer platform despite having accumulated many 5 out of 5 scores, a new album of a top-rated music band may be poorly received and score 6 out of 10, and so on. The current article proposes that a deviating episode will be perceived differently depending on the format in which scores are specified. When a well-performing entity suddenly receives a negative score (i.e., a score at the lower end of a scale; e.g., 1/5), decision makers will perceive this deviating episode as less negative in a cumulative format than in an incremental format or a combined format. In such situations using a cumulative format, decision makers’ overall judgments (e.g., perceived overall performance) will be less negative, and they will be less likely to look for alternative options. Conversely, we suggest that when a poorly performing entity receives a positive score (e.g., 5/5), this deviating score will be perceived as less positive in a cumulative format than in an incremental or combined format.
Theoretically, we contribute to the nascent work on cumulative versus incremental presentation formats (e.g., Alves and Mata 2019). This prior work has focused on explicit comparisons of multiple entities, such as the performance of two soccer teams or two different company stocks. Drawing from work on numerical cognition (e.g., Sevilla, Isaac, and Bagchi 2018), review ratings (e.g., He and Bond 2015), and impression formation (e.g., Gershoff, Mukherjee, and Mukhopadhyay 2003), we advance a novel theoretical mechanism that can account for format effects in widely prevalent situations of single-entity scores (e.g., consumer, employee, or product ratings). Perhaps surprisingly, we also find strong evidence that overall judgments of scores in a combined format are more akin to judgments of incremental scores rather than ready-made summary (i.e., cumulative) scores. Moreover, we document that effects of format on overall evaluations are robust to significant delays between the presentation of the scores (i.e., more than 24 hours) and even occur with judgments of only two scores.
Substantively, we identify presentation format (incremental, cumulative, or combined) as an easy-to-change factor to either emphasize or downplay a deviating score to decision makers and impact their subsequent judgments and behaviors. In a survey, managers (N = 63, Mage = 40 years, 65% with >5 years of managerial experience; see Web Appendix B for study details) indicated a strong interest (81% of our sample) in the impact of presentation formats on consumer reactions and supported the relevance for business practice to study such formats (86%). Companies may, for instance, alter the presentation format to deal with customer prioritization as they seek to enhance (or decrease) the likelihood of customers returning (Homburg, Droll, and Totzek 2008). Our findings demonstrate that presenting a negative score in an alternative format may keep consumers loyal to a company, lead to more refined hiring or promotion decisions from managers, or affect people's willingness to leave a peer-to-peer platform.
Initial Illustration of the Phenomenon
As a starting point to understand how scores’ presentation format might impact consumer behavior, especially in the case of deviating raw scores, we set out to explore how rating format could influence consumption behavior in a real-world context. To do so, we scraped data on user ratings and view statistics for series that ran between 2016 and 2022 from two leading TV-tracking platforms: Trakt (https://trakt.tv) and Simkl (https://simkl.com). Both platforms offer apps that integrate with media servers and players (e.g., Kodi, Plex, Netflix), allowing users to search, track, rate, and watch episodes of series in one integrated environment. As a result, the ratings on the platform used by an individual likely are their primary source of information to influence their viewing behavior.
Trakt presents ratings in a combined format such that (potential) viewers can see ratings of each individual season of the series and the overall (average) rating for the whole series. Simkl, in contrast, uses a cumulative format where only the overall score of all seasons of the series is displayed. Web Appendix C provides screenshots of both platforms illustrating this contrast. After preparing the data for analysis (e.g., excluding series with only one season or series with few ratings) as documented in Web Appendix C, the final data set consists of 320 series with 938 seasons. Based on data from Trakt (i.e., Simkl only shows one overall rating), we observe that 225 series (70.3%) feature a negative deviation: a season that has received a lower evaluation than the previous one. We focus on these negative deviations because they are more likely to trigger users to stop watching the series than positive deviations (i.e., when the rating improves over seasons) and may thus potentially act as a driver of consumer churn.
We operationalized viewers’ continuous adoption of the series—a variable that theoretically ranges between 0 to 1 and indicates the fraction of viewers of a series that watched/adopted all seasons (Bhattacherjee 2001) or planned to do so in future (Obal 2017; see Web Appendix C for details). For series with a negative deviation (N = 225), the average continuous adoption of all series was .22 on Trakt and .33 on Simkl, a significant difference (t(211) = 8.79, p < .001, based on N = 212 matching pairs; note that Simkl had some missing values in its adoption data). However, for series that did not have a negative deviation (N = 320 − 225 = 95), continuous adoption did not differ between platforms (Trakt: .37, Simkl: .39; t(86) = 1.03, p = .31, N = 87 matching pairs; interaction: F(1, 297) = 11.74, p = .001). This result hints at the possibility that, in the case of a negative deviation, a platform using a cumulative format may be associated with less customer churn than one using a combined format.
To further explore the impact of deviations, we operationalized a variable called deviation magnitude as the largest deviation in the sequence of season ratings for one series and recorded deviation magnitude when that largest deviation was negative. When the largest deviation was positive, we coded a missing value. Deviation magnitude represents an absolute value on a 0 to 10 scale, so a larger value indicates a larger decrease. We find that deviation magnitude is somewhat more related to the continuous adoption of Trakt users (i.e., r = −.23, p = .02, N = 108; so for 225 − 108 = 117 series, the largest deviation was positive and was thus coded as missing) than of Simkl users (i.e., r = −.08, p = .42, N = 99; Simkl has missing data for 9 series; difference between correlations: p = .09). This pattern of results replicated when we used alternative codings of deviation magnitude. These results might imply that a stronger deviation is more impactful on a platform using a combined format than one using a cumulative format.
Evidently, one of the many implicit assumptions of the analyses above is that audiences are comparable across platforms. A first indicator of comparability is a strong positive correlation between series’ overall ratings on Trakt and Simkl (r = .91, p < .001, N = 320). We then gathered additional data (i.e., ratings of each season) from an independent source (IMDb). Encouragingly, results show that the IMDb series ratings strongly correlate with both Simkl (r = .70, p < .001, N = 320) and Trakt (r = .78, p < .001, N = 320) ratings. Given that both Trakt and IMDb use a combined format, it is perhaps unsurprising that the latter correlation is somewhat stronger than the former. Moreover, deviation magnitude based on the IMDb ratings correlates more strongly with Trakt's continuous adoption than with Simkl's, albeit not significantly (rTrakt = −.21, p = .05, N = 88; rSimkl = −.08, p = .50, N = 78; difference: p = .14; note that there are slightly fewer deviations in the IMDb rating data [N = 88] and that Simkl had missing data on continuous adoption for some of these series).
Despite its clear limitations (e.g., the platforms differ in many ways other than presentation format, including factors like audience characteristics and layout), these data may provide a tentative, real-world illustration of the potential effects of presentation format on consumer behavior. In what follows, we first build up the theoretical backbone and hypotheses of this research. Thereafter, we provide empirical evidence for our hypotheses by means of nine experiments.
Theoretical Background
Quantitative scores can be presented in one (or in a combination) of two formats: an incremental format and a cumulative format (Alves and Mata 2019; for a similar distinction of visual data formats, see Reinholtz, Maglio, and Spiller [2021] and Spiller, Reinholtz, and Maglio [2020]). When decision makers form an overall impression based on a set of scores, an incremental format requires a different strategy than its cumulative counterpart. Specifically, judgments based on a cumulative format should be mainly based on the latest score because it aggregates all previous ones. In contrast, when decision makers face an incremental format, an overall evaluation involves aggregating all scores, which people typically do by averaging (e.g., Anderson 1971) or summation (e.g., Fishbein and Ajzen 1974).
Despite the prevalence of both formats in the marketplace, few studies have explicitly compared individuals’ evaluations when presented with quantitative information in either format. As a notable exception, a recent study (Alves and Mata 2019) finds that information about two entities leads to more favorable impressions about competitors taking an early lead when the entities’ performances are specified in a cumulative format compared with an incremental format. The authors explain this finding by individuals’ tendency to integrate redundant information (i.e., prior scores) in judgments even when a cumulative format is used.
In the current article, we draw attention to perhaps a less obvious, but crucial, feature of the findings reported by Alves and Mata (2019): participants were repeatedly (i.e., for each episode) presented with explicitly juxtaposed scores of two entities (e.g., stocks, algorithms, soccer teams). The simultaneous presentation of options is likely to have facilitated a comparative focus (Kardes 2013; Schley, Lembregts, and Peters 2017), leading participants to consider which entity is ahead after each episode. Given people’s inclination to use frequency of occurrence as a decision input (e.g., Alba et al. 1999), it is reasonable to assume that the number of times that entity A was better than entity B was essential for forming overall impressions about the entities.
When ratings of a single entity are being judged, however, no comparative-ranking cue (e.g., How often did an entity win?) is present, so it is unclear whether, why, and how presentation format affects overall impressions in this context. We advance a novel theoretical mechanism that predicts format effects on performance evaluations of a single entity. A key difference between a cumulative format and an incremental format is that, because a cumulative format is an updated summary of a series of scores, individuals are not directly able to see the underlying raw scores. We propose that if consumers try to form an impression of the underlying raw scores when a cumulative format is used—an assumption that seems to hold for several marketing-relevant contexts (see the pilot study in Web Appendix D)—the perceptions of these underlying raw scores may be distorted.
A large body of work has demonstrated that perceptions of quantitative information change depending on how values are framed (e.g., De Langhe and Puntoni 2016; Lembregts and Pena-Marin 2021). Most relevant to the current investigation is research that consistently finds that decision makers rely on face values, rather than actual values, even if it hurts decision-making quality (Hsee et al. 2009). For example, classic work on the so-called money illusion confirms people's inclination to think of money without taking inflation sufficiently into account (i.e., in nominal terms rather than in real terms; Shafir, Diamond, and Tversky 1997). Research on spending behavior has shown that individuals’ valuation of a product in an unfamiliar foreign currency is biased toward its nominal value—its face value—with inadequate adjustment for the exchange rate (Raghubir and Srivastava 2002). More recently, Sevilla, Isaac, and Bagchi (2018) demonstrate that an overreliance on face values results in different responses to claims stated in a numerical format (e.g., “top 10” out of 50 products) compared with a percentage format (e.g., “top 20%” out of 50 products).
Based on this research stream, we predict that when a cumulative format is used, consumers may also rely on face values to form impressions of underlying raw scores and corresponding performances. Such a format considers all previous observations, thereby mostly leading to less extreme face values (i.e., farther from the scale's endpoints) compared with an incremental format. For instance, on a five-point scale and in an incremental format, five episodes (e.g., trips using a ride-hailing service) may be scored four times a 5 and one time a 1. This can be represented in a cumulative format as four times a 5 and a one time a 4.2, because (5 + 5 + 5 + 5 + 1)/5 yields a face value of 4.2. Note that the incremental “1” is at an endpoint of the scale, while the less extreme cumulative “4.2” is not. Conversely, five episodes may be scored four times a 1 and one time a 5 in an incremental format, which yields a less extreme face value of 1.8 in a cumulative format (i.e., 1.8 is farther from the endpoint of the scale than 5).
We propose that these format-specific differences in face values may render perceptions of the underlying raw scores to be less extreme as well. For example, based on a cumulative score of 4.2/5, a consumer may perceive a deviating raw score of 1 out of 5 to be more at the level of a 3 or 4, when previous episodes have been getting 4s or 5s. Conversely, based on a cumulative score of 1.8/5, a deviating raw score of 5 out of 5 may be perceived akin to an episode that is represented by a 2 or 3. Formally,
When a cumulative format is used, the resulting—distorted—perceptions of a single deviating episode may also impact overall evaluations (i.e., judgments of performance across all the episodes). For example, when an entity that has received several 5/5 scores suddenly receives a 1/5, we predict that the entity's overall performance will be perceived to be more positive in a cumulative format (compared with an incremental format) because individuals perceive the deviating score (i.e., 1/5) as less extreme (i.e., less negative). In addition, one may wonder how consumers respond to scores presented in both formats at the same time, particularly because such a combined format is widely used in practice. We predict that, compared with presenting information in a cumulative format, a deviating score will have a stronger impact on overall evaluations when it is combined with incremental information. Note that the results of our analyses on real-world TV-series data—comparing Trakt (combined format) and Simkl (cumulative format)—are consistent with this prediction. One theoretical reason for this prediction is that when multiple pieces of information are prominently presented, more extreme information (e.g., more extreme face values of incremental format) typically attracts more attention in judgments and decisions (Gershoff, Mukherjee, and Mukhopadhyay 2003; Skowronski and Carlston 1987). Moreover, as supported by Web Appendix D, our theorizing assumes that individuals presented with a cumulative format are interested in incremental information. Hence, when both formats are shown simultaneously, information presented in an incremental format may have a stronger impact on overall judgments of a raw score. To reiterate:
Moving beyond perceptions, we predict that the effects of presentation format extend to other marketing-relevant decisions (e.g., customer churn or product choice), particularly when a generally well-performing entity suddenly receives a negative score. Schoenmueller, Netzer, and Stahl (2020) conclude that on most platforms positive reviews dominate, and negative reviews are fewer. Hence, negative scores will stand out as they are less prevalent, deviate from the general pattern, and thereby impact consumers’ perceptions and behaviors (Rifkin, Kirk, and Corus 2023). This warrants a focus on these situations. Underscoring the importance of such deviations, Uber, for instance, announced that it would pay particular attention to negative scores and potentially remove associated drivers and riders from the platform (Hawkins 2022). Moreover, in a series of 24 exploratory interviews we held with peer-to-peer platform users (see Web Appendix E), one of the respondents (Tim, 24 years old) illustrated the potentially imminent implications of negatively scored episodes in an online marketplace very simply: “Even if someone's average score is 4.5, it just takes 1 poor review to make me skeptical toward the buyer or seller.”
Our exploratory interviews further suggest that consumers seriously consider leaving a platform after a single negative score, especially when future platform usage and benefits are contingent on reputation. For instance, a service like Uber Black allows drivers to charge higher fares compared with its standard service but only if they keep a very positive performance score (a 4.85 or above). In addition, after having received a negative score on two platforms, decision makers may prefer the platform that uses a cumulative format over a competitor's platform using an incremental format. The overall performance looks better in a cumulative format, which makes individuals feel better and may yield future perks. We therefore hypothesize:
Finally, we predict that the proposed effect depends on whether a deviating score is considered representative of an entity's past, current, or future performance. H2 and H3 implicitly assume that decision makers consider the deviating score representative of an entity's performance, such that the score influences their overall evaluations and decisions. A decision maker could indeed attribute a deviating score to the entity (e.g., a negative score represents lower quality or performance), but such a score can also be due to external factors (e.g., a generally negative customer; Chen and Lurie 2013; He and Bond 2015). In the latter case, the negative deviating score is attributed to an idiosyncratic situation rather than the entity itself. Because that particular score is now less likely to represent an entity's (future) performance, it will have less impact on overall evaluations.
A score's recency could serve as another important factor indicating the representativeness of a deviating score for an entity. More recent information is considered to be more diagnostic to form overall evaluations than less recent information (e.g., Montgomery and Unnava 2009; Ziano and Pandelaere 2022). For example, when a negative score is followed by a positive score (i.e., rendering a deviating episode less recent), it is likely that the negative score is considered less representative of the entity. The deviation is thus less likely to inform overall evaluations compared with a situation in which the deviating performance is more recent.
Taken together, we predict that the representativeness of a deviating score affects the strength of the proposed effect.
Overview of Experiments
We test our hypotheses in a series of nine experiments (for all data and materials, see https://osf.io/f4m3u; results without exclusions are reported in Web Appendix F). Experiment 1 provides support for H1: with a cumulative format, decision makers infer less extreme performances from a deviating raw score. Experiment 2a provides support for H2a in a realistic setting using a larger variety of numerical values. Experiment 2b investigates how the simultaneous display of scores in a cumulative and incremental format affects overall evaluations (H2b) and provides process evidence. Experiment 2c demonstrates that the effect is robust to longer delays between the ratings (i.e., at least one day), rendering an interpretation based on cumulative redundancy (Alves and Mata 2019) less likely. Experiments 3a–b document effects on choices (H3). Finally, Experiments 4a–c look at the role of a deviating score's representativeness (H4).
Experiment 1
Experiment 1 has two aims. First, we want to provide support for H1: when specified in a cumulative format, decision makers infer less extreme performances from a deviating raw score. We test two relevant situations: one context in which a well-performing entity receives a negative score (i.e., negative deviation), and one in which a poorly performing entity receives a positive score (i.e., positive deviation). We expect that the inferred performance in an episode with a negative deviation is less negative (i.e., less extreme) in a cumulative format than in an incremental format. Conversely, for a positive deviation, we predict that a less positive performance is inferred in a cumulative format compared with the incremental format. Second, we aim to exclude an alternative explanation of our results: participants may simply misunderstand the meaning of the numerical values in a cumulative format and therefore treat them as incremental scores. In other words, despite our strong intention to provide clear instructions, participants may not be sensitive to the instructional differences. For this experiment, we preregistered all measures, predictions, exclusion criteria, and analyses (https://aspredicted.org/26es8.pdf). Further details can be found in Web Appendix G.
Method
Participants were recruited from the CloudResearch platform. As indicated in our preregistration form, we aimed for 400 participants. We ended up with 405 participants (Mage = 40 years old; 181 women, 219 men, 5 nonbinary) because of the Amazon Mechanical Turk (MTurk) software. We aimed to exclude participants who indicated that they did not understand the instructions (“Do you understand this information?”; Yes/No), but all participants indicated they understood the instructions. The experiment had a four-condition between-subjects design in which format (incremental vs. cumulative) and type of deviation (negative vs. positive) were manipulated. All participants were exposed to a set of three scores, with each score presented on a separate page. All scores were provided on a five-point scale (1 = “very bad,” and 5 = “very good”).
In the incremental conditions, participants were told to imagine that the ratings pertained to the same person or product at different points in time (negative deviation condition: 5.00–5.00–2.00; positive deviation condition: 2.00–2.00–5.00). In the cumulative conditions, we explained that the scores represented an updated average score for a person or product at different points in time (negative deviation: 5.00–5.00–4.00; positive deviation: 2.00–2.00–3.00). After seeing the three scores, all participants judged the last performance by positioning a slider along an unnumbered scale (“What did you think about this last (third) performance?”; 1 = “very bad,” and 100 = “very good”; adapted from Lembregts and Van den Bergh [2019]). Finally, to check an instructional difference account, participants completed a check (“The ratings shown to you …” 1 = “were different ratings for a person or product at different points in time,” 2 = “were an updated average for a person or product at different points in time”).
Results and Discussion
As predicted, a two-way analysis of variance (ANOVA) with format and type of deviation as independent variables and perception of the last performance as dependent variable revealed a significant interaction effect (F(1, 401) = 291.80, p < .001). When a well-performing entity received a negative score, this performance was judged to be less negative in the cumulative format (M = 67.32, SD = 21.67) relative to an incremental format (M = 27.26, SD = 21.07; F(1, 401) = 206.86, p < .001, Cohen's d = 2.03). When a poorly performing entity received a positive score, this performance was judged to be less positive in a cumulative format (M = 62.65, SD = 18.77) relative to an incremental format (M = 89.46, SD = 16.97; F(1, 401) = 95.00, p < .001, Cohen's d = 1.36).
Furthermore, across conditions, an overwhelming majority of the participants (88.4%) correctly identified which format they had been exposed to. Interestingly, in the cumulative conditions this percentage was slightly lower (87.2%). An instructional difference account would predict that the format effect on the evaluation of the deviating score would be attenuated for participants who understood the instructions. In contrast, we did not find a significant three-way interaction between format, type of deviation, and understanding check on perceived overall performance (F(1, 397) = .56, p = .45). Note that these results need to be interpreted with caution given that only a few participants did not understand the instructions. Importantly, our preregistered analyses fully replicated when we looked at only respondents who completely understood the numerical values (all p-values < .001).
This experiment shows that a deviating episode is perceived as less extreme when specified in a cumulative format than when specified in an incremental format. In addition, in contrast to an alternative explanation based on insensitivity to instructions, we found that an overwhelming majority of participants understood what a cumulative format entails, and that (lack of) understanding did not affect the results.
Experiments 2a–c
In Experiments 2a–c, we test whether a deviating score affects decision makers’ overall judgments less when a cumulative format is used relative to an incremental format or a combination of both formats. In this and following experiments, we focus on well-performing entities receiving a negative score, instead of poorly performing entities receiving a positive score. As noted in the “Theoretical Background” section (also see Schoenmueller, Netzer, and Stahl 2020), the former situation is more apparent in the marketplace and thus more relevant for marketing. To be clear, based on our theorizing and the results of Experiment 1, we do not see any theoretical reason why the results found in this and the following experiments would not apply, in reversed form, to positive deviations.
Experiment 2a
Experiment 2a tests H2a in the context of a ride-hailing service. To further enhance realism, we employ a more varied set of scores and clarify that the participant takes the role of a passenger being rated by a driver, rather than leaving it up to the participant to decide on the scored entity (as in Experiment 1). Although previous literature has devoted little attention to the notion of consumers receiving rather than providing a score (Kim, Choi, and Verma 2017), the receiver perspective ties in with many real-life scoring systems, such as those of online peer-to-peer platforms.
Method
We recruited participants from the Prolific crowdsourcing platform. As described in our preregistration form (https://aspredicted.org/zq8pi.pdf), we aimed to collect 200 participants and ended up with 202 participants (Mage = 34 years old; 126 women, 74 men, 1 nonbinary, 1 preferred not to say). To set up a conservative test, we decided to introduce a stringent attention check. At the end of the survey, we asked participants to report the reference score that was embedded in the survey (3.80/5). In total, 167 participants answered correctly and were included in the analysis. The experiment had a two-condition between-subjects design: an incremental and a cumulative condition.
All participants were introduced to a scenario in which they imagined being a passenger in a ride-hailing service called Get-a-Ride. We chose this fictitious brand name to prevent any brand-related effects from participants’ associations with real-life brands. Participants were told that they can use the service's app to contact a driver; we carefully designed the service's brand logo and app screen to appear realistically on a participant's device. After each ride, participants would be rated by the driver on a five-point scale (higher is better). All participants were exposed to a set of five episodes (i.e., rated rides), with each score displayed on a separate page (i.e., app screen) and representing one point in time. To facilitate participants’ understanding of the scores, we offered a reference point of what constitutes a desirable score (3.80/5.00), based on input from 24 interviews with peer-to-peer platform users (see Web Appendices E and H for details). In the cumulative condition, we also included an exploratory measure probing what participants considered to be the raw score of the last episode. All stimuli can be found in Web Appendix H; see Table 2 for conditions and stimuli examples.
Experimental Conditions and Stimuli of Experiment 2a.

In the incremental condition, we explained that the app screen showed participants’ performance score, which was introduced as “The score for your most recent ride is …” Participants were exposed to the following set of scores: 4.00–5.00–4.00–5.00–2.00. In the cumulative condition, we explained that the app screen showed the updated average performance score. The text in the app then read, “Following your most recent ride, your updated score is now …” Participants were exposed to the following sequence of scores: 4.00–4.50–4.33–4.50–4.00. After seeing the five scores, all participants indicated their perceived overall performance with three items on a seven-point scale (“Overall, to what extent are you, as a passenger, performing well?,” “To what extent would you consider that you, as a passenger, have a good overall performance?,” and “All in all, to what extent would you think that you, as a passenger, are performing badly?”; 1 = “not at all,” and 7 = “very much”). For the analyses, we used the average score of these three items (Cronbach's α = .79), with the last item reverse-coded.
Results
As predicted, we find a significant effect of condition on perceived overall performance (t(165) = −4.91, p < .001, Cohen's d = .76): when Get-a-Ride used a cumulative format (M = 6.12, SD = .77), participants inferred that they were performing better than when an incremental format was used (M = 5.59, SD = .62). Unexpectedly, variances were significantly different, but results replicated when equal variances were not assumed (t(155.11) = −4.89, p < .001). We also asked participants in the cumulative condition to infer the raw score of the last episode. Interestingly, an exploratory one-sample t-test revealed their inference to be less negative (M = 3.60, SD = .73) than the true underlying raw value (i.e., 2 out of 5; t(81) = 19.69, p < .001). In addition, we also observed that, in the cumulative condition, there was a marginally significant correlation between the inferred last score and perceived overall performance (r = .20, p = .07, N = 80). Although it is possible (in this scenario) that participants gave themselves a higher score due to a better-than-average effect (Zell et al. 2020), these results are consistent with our assumption that cumulative formats may distort perceptions of underlying raw scores.
Experiment 2b
This experiment has three aims. First, we test H2a in another relevant context: TV show ratings, adopting the ten-point scale that is widely used in online ratings of TV shows and series (e.g., IMDb). Second, we aim to test our hypothesis that a deviating score affects decision makers’ overall judgments less when a cumulative format is used relative to a combination of both formats (H2b). Finally, we aim to provide evidence that the proposed format effect on overall judgments is driven by (distorted) perceptions of the deviating episode.
Method
We recruited participants from the CloudResearch platform. As indicated in our preregistration form (https://aspredicted.org/d25zr.pdf), we aimed for 300 participants. We ended up with 301 participants (Mage = 39 years old; 115 women, 184 men, 1 nonbinary, 1 preferred not to say) because of the MTurk software. Two participants were excluded using the same (preregistered) understanding check of Experiment 1, leaving the final sample at 299 participants. The experiment had a three-condition between-subjects design in which format (incremental vs. cumulative vs. combined) was manipulated. All participants were introduced to a scenario in which they imagined that they were using a streaming platform called “Slamdeck,” and that they sometimes added new series to a “watch list.” This list served as a personal reminder that these series could be interesting to watch in the future. They then imagined that they had just added the (fictitious) series The Research Team to their watch list, and sometimes checked its rating (given by other viewers on a ten-point scale; 1 = “very bad,” and 10 = “very good”).
In the incremental condition, we told participants that Slamdeck offers for each TV series the specific rating for an individual season. In the cumulative condition, participants read that Slamdeck offers for each TV series an overall rating for the series, which is an updated average after each season (analogous to Simkl in our initial illustration). In the combined condition, both formats were shown (similar to Trakt). After viewing the first rating, participants read that their busy life was catching up with them, and they did not have time to watch the series. They imagined that, sometime later, they were browsing their watch list and noticed that a second season of The Research Team was released, and they checked the series’ rating again. Unfortunately, they still did not have time to start watching the series. Finally, they imagined that sometime later their watch list indicated that a third season was released, and they rechecked the series’ rating on Slamdeck. All stimuli can be found in Web Appendix I; see Table 3 for conditions and stimuli examples.
Experimental Conditions and Stimuli of Experiment 2b.

Participants were exposed to the following set of scores: 9/10–9/10–6/10 in the incremental condition, 9/10–9/10–8/10 in the cumulative condition, and both sets of scores in the combined condition. After seeing all scores, participants indicated their perceived overall quality of the series with three items on a seven-point scale (“In general, to what extent do you feel that ‘the research team’ is a high-quality TV series?,” “To what extent do you feel that ‘the research team’ is a well-made TV series?,” and “To what extent do you feel that ‘the research team’ is a low-quality TV series?”; 1 = “not at all,” and 7 = “very much”). For the analyses, we used the average score of these three items (Cronbach's α = .57), with the last item reverse-coded. Finally, similar to Experiment 1, all participants judged the most recent episode by positioning a slider along an unnumbered scale (“What did you think about the quality of the 3rd season? The 3rd season is of …” 1 = “very bad quality,” and 100 = “very good quality”).
Results
A one-way ANOVA with format as independent variable and overall quality perceptions as dependent variable yielded a significant main effect (F(2, 296) = 23.20, p < .001). Replicating Experiment 2a, individuals perceived a better overall quality when scores were reported in a cumulative format (M = 6.07, SD = .79) compared with an incremental format (M = 5.32, SD = .97; t(198) = 5.97, p < .001, Cohen's d = .85). We also found that a cumulative format yielded higher quality perceptions than presenting scores in a combined format (M = 5.40, SD = .77; t(195) = 6.03, p < .001, Cohen's d = .86). An exploratory analysis revealed no significant difference between an incremental and a combined format (t(199) = .65, p = .52, Cohen's d = .09). Results are visually summarized in Figure 2. Next, we ran a mediation analysis using bias-corrected bootstrapping (10,000 samples; Hayes 2017) with format as a (multicategorical) independent variable. We used effect coding (cumulative coded as −1); X1 compares cumulative with incremental (coded as 1), X2 compares cumulative with combined (coded as 1), perceived quality of season 3 served as the mediator, and perceived overall quality was the dependent variable. The analysis revealed indirect effects with a confidence interval excluding zero (X1: a × b = −.09, SE = .03; CI: [−.15, −.03]; X2: a × b = −.08, SE = .03; CI: [−.13, −.03]) suggesting that perceptions of the deviating episode mediate the effect of format on perceived overall quality.

Bar Chart of Cell Means in Experiment 2b.
Experiment 2c
This experiment has three aims. First, we test H2b in the context of so-called review aggregators. These websites, such as OpenCritic (games), MRQE (movies), AlaTest (products), Rotten Tomatoes (movies), Tripexpert (hotels, restaurants, attractions), and Any Decent Music? (music) integrate expert reviews of (new) products and services. Especially for new products, review aggregators can make a difference in their market adoption; when the first expert reviews are negative, customers may decide to postpone or even abandon their purchase. Second, we wanted to check whether the effect generalizes to overall evaluations of just two episodes. Evaluating two episodes provides a conservative test of the proposed effect because one could assume that misestimation is less likely to occur: the face value of the deviating episode in the cumulative format is closer to the underlying raw value, and raw scores are easier to calculate than when larger sets of scores are involved.
Third, we aimed to test whether the format effect on overall evaluations is robust to significant delays between the presentation of the scores (i.e., more than one day). The review aggregator examples discussed previously are especially relevant for this aim, as consumers may recheck ratings across multiple days before making up their mind about buying a newly launched product, going to see a new movie, or downloading a new game. Moreover, in settings like ride hailing (e.g., Uber, BlaBlaCar), food delivery (e.g., DoorDash), secondhand selling (e.g., Leboncoin), freelance services (e.g., Fiverr), and online craft marketplaces (e.g., Etsy), users are likely to follow up on ratings they receive dispersed over time (e.g., an individual selling ten items through Etsy per month will pay attention to the related reviews). Manipulating time in between episodes may also be informative from a theoretical perspective, especially in relation to prior work that advances a mechanism based on cumulative redundancy (Alves and Mata 2019). Such an account predicts that, even though a prior score is redundant in a cumulative format, individuals still integrate this information in their judgments. Installing a delay between episodes would make the memory trace of a previous positively rated episode weaker and, if cumulative redundancy holds, subsequently attenuate the effect.
Method
The experiment (preregistered at https://aspredicted.org/25zi3.pdf) had a 2 (format: combined vs. cumulative) × 2 (delay duration between episodes: short vs. long) between-subjects design and consisted of two waves with one day in between. We recruited 400 participants (Mage = 41 years; 247 women, 151 men, 2 nonbinary) from the Prolific platform. Seven participants were excluded based on the same (preregistered) understanding check of Experiments 1 and 2b. In addition, only participants who filled out both surveys completely were included in the analysis, leaving our final sample at 383 participants. We suspect that the low attrition rate is due to the small bonus we gave in addition to the regular pay when both surveys were completed.
All participants were exposed to two episodes. In the longer-delay conditions, one episode was presented on day t, the other on day t + 1, using a two-wave approach. In the shorter-delay conditions, the episodes were presented in the same wave: both scores were presented either in the first survey or in the second one. We did not observe any significant differences or interactions with respect to overall evaluations between both groups in this counterbalanced design. To keep workload constant across conditions, we asked all participants (i.e., in long- and short-delay conditions) to complete two surveys. In addition, the wave that did not feature episode scores included a short filler task (i.e., preference indication with ten pairs; e.g., “Cats or Dogs?,” “Pizza or Hamburger?”). This task was also completed by the longer-delay participants after they completed their overall evaluation, again to keep workload similar across conditions.
After being introduced to the two-wave setup of the experiment, participants were asked to imagine that they were contemplating the purchase of a new pair of headphones. For some time, they had been looking forward to a new model that just came out: the Centersound HD900 headphones. Next, we told participants that they decided to wait for some first expert reviews to come in. They regularly checked a (fictitious) review aggregator called Soundcritic—an online platform that provides an overview of expert reviews of sound-related technology products. At that point, participants were asked the same check question on participants’ understanding as employed in previous experiments. In the combined conditions, participants were informed that Soundcritic displays both the individual scores given by the experts (9/10 for the first episode, and 5/10 for the second one) as well as an overall averaged rating (i.e., 9/10–7/10) across these experts on a ten-point scale (higher = better). In the cumulative conditions, participants only saw the latter rating type (see Table 4 and Web Appendix J for stimuli).
Experimental Conditions and Stimuli of Experiment 2c.

After seeing both scores, participants indicated their perceived overall quality of the headphones with three items on a seven-point scale (“To what extent do you feel that the Centersound HD900 are high-quality headphones?,” “To what extent do you feel that the Centersound HD900 performs well?,” and “To what extent do you feel that the Centersound HD900 are low-quality headphones?”; 1 = “not at all,” and 7 = “very much”). For the analyses, we used the average score of these three items (Cronbach's α = .86), with the last item being reverse-coded.
Results
As predicted, a two-way ANOVA with format and delay as independent variables and overall quality perceptions as dependent variable yielded the predicted main effect of format (F(1, 379) = 58.34, p < .001). Perceptions of overall quality were less negative when scores were specified in a cumulative format (Mshortdelay = 5.27, SD = .84; Mlongdelay = 5.14, SD = .72) than in a combined format (Mshortdelay = 4.78, SD = .80; Mlongdelay = 4.35, SD = .92), both in the shorter- (F(1, 379) = 17.13, p < .001, Cohen's d = .60) and longer- (F(1,379) = 44.34, p < .001, Cohen's d = .96) delay conditions. If anything, an exploratory analysis suggests that the format effect is somewhat stronger when the time between episodes was longer (Mcumulative = 5.14 vs. Mcombined = 4.35) rather than shorter (Mcumulative = 5.27 vs. Mcombined = 4.78), as was hinted by the marginally significant interaction between format and delay (F(1, 379) = 3.21, p = .07).
Discussion
Taken together, Experiments 2a, 2b, and 2c confirm, in a variety of scenarios, that a deviating score had less impact on overall judgments in a cumulative format than an incremental or a combined format. Furthermore, this set of experiments provides more insight into the process underlying this effect. Experiment 2a provides exploratory evidence that a cumulative format may lead individuals to misestimate the underlying raw value. In Experiment 2b, we find that distorted perceptions of the deviating episode statistically mediate the proposed effect. Experiment 2c shows that the effect replicates when individuals experience a significant time delay between episodes.
Experiments 3a–b
In Experiments 3a–b, we go beyond perceptions and test H3: when a generally well-performing entity receives a negative score, decision makers are less likely to look for alternative options when scores are specified in a cumulative format rather than in an incremental format.
Experiment 3a
In this experiment, we focus on an online service to hire professionals for all kinds of tasks (akin to platforms such as Handy, Thumbtack, or TaskRabbit). We predict that when a professional had a one-time negative score after a string of positive episodes, people are less likely to look for an alternative option (instead of choosing the focal professional) when a cumulative format was used rather than an incremental one. For this experiment, we also preregistered all measures, predictions, exclusion criteria, and analyses (https://aspredicted.org/cw46 m.pdf).
Method
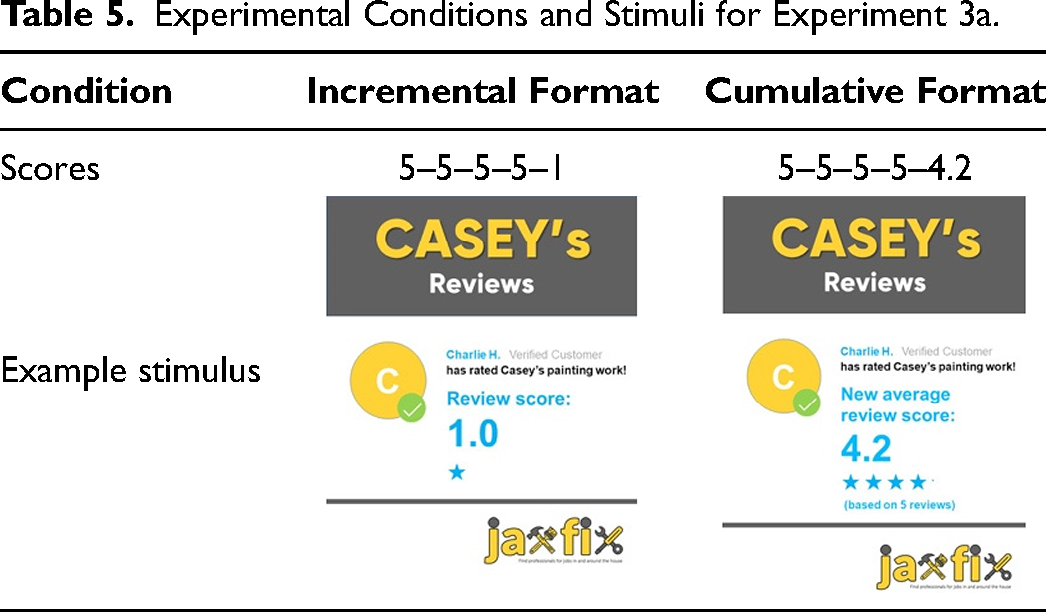
We recruited 300 participants from MTurk (Mage = 38 years; 118 women, 179 men, 2 nonbinary, 1 preferred not to say). As indicated in our preregistration form, we had four attention checks: “Do you understand the scenario?”, “Have you pictured yourself in your role in the scenario?,” “What is your role in this scenario?,” and “What type of job did the scenario focus on?” After excluding all participants who indicated no (first two questions) or did not answer correctly (last two questions), our final sample was 279 participants. The experiment had a two-condition between-subjects design: an incremental and a cumulative condition. All participants were introduced to a scenario in which they imagined to be looking for a reliable person to do a paint job in their house, and then decided to use a (fictitious) online service called JAXfix. We explained to participants that professionals offer their services at JAXfix and receive scores from their previous customers. Furthermore, prices at JAXfix are fixed so this is not a criterion to select a professional. We then told that they provided the app information on the type of job, their address, and the time window in which the job should be done. JAXfix then suggested an available professional: Casey. Participants imagined that they checked Casey's reviews to decide whether they would grant the paint job to Casey or whether they wanted another professional for the job.
Next, five review scores (on a five-point scale, and including visual information, i.e., stars) were presented sequentially on separate pages. The final, negative review score was provided by customer Charlie, a gender-neutral name like Casey. Score format was manipulated at this stage. Participants in the incremental condition (i.e., 5–5–5–5–1) were informed that they would see the score of each customer. Participants in the cumulative condition (i.e., 5–5–5–5–4.2) were informed that after every review, JAXfix updates Casey's review score to reflect the average score over all customers who had submitted a review. (All stimuli can be found in Web Appendix K; see Table 5 for stimuli examples.) After participants saw the reviews, we recorded the dependent variable as follows: “You can invite Casey to do the paint job in your house. You can also continue your search on JAXfix to find another professional. Recall: You are looking for a reliable person to do a paint job in your house. What would you choose?—Invite Casey—or—Look for another professional on JAXfix.”
Experimental Conditions and Stimuli for Experiment 3a.
Results and Discussion
As predicted, we find a significant effect of presentation format on choice (χ²(1) = 5.09, p = .02). We find that people were less likely to look for an alternative option (instead of choosing Casey) when the scoring system had a cumulative format (6.5%) compared with when an incremental format was used (14.9%). This experiment further extends the robustness and relevance of the focal effect by demonstrating downstream effects on choice behavior (H3). When a positively rated professional receives a negative score, we find that consumers were less likely to look for an alternative option when a cumulative format was used.
Experiment 3b
In this experiment, we want to demonstrate another instance of the focal effect on choice behavior (H3). This experiment complements the previous ones in three ways. First, we wanted to demonstrate the effect in a behavioral task. That is, people were asked to perform a task themselves and receive scores for their performance. Evidently, performance scores needed to be kept constant while being credible to participants. Therefore, we opted for a setup in which participants received mock scores on a task for which performance is ambiguous, namely gift-giving. Second, we aimed to check whether the effect also holds in an incentive-compatible setting. Third, in the previous experiments, participants were presented with either an incremental or a cumulative format. In real life, people may interchangeably use platforms operating with one or the other format. In this experiment, we aimed to mimic such a situation and presented participants with two platforms: one in an incremental format, and one in a cumulative format. Participants first tested one platform and then moved on to the next one. Afterward, participants were asked to indicate their preference. In the case of a negative deviation, we predicted that a well-performing participant would prefer a platform using a cumulative format over a competitor operating an incremental format. When the format was switched between platforms, we predicted a shift toward the competitor.
Method
We recruited 201 participants from Prolific (Mage = 33 years; 129 women, 71 men, 1 nonbinary). We had two attention checks: “Do you understand your task in this study?” and “Who will rate your gifts?” After excluding all participants who indicated no (first question) or did not answer correctly (last question), our final sample was 190 participants. At the start of the experiment, participants were told that they would be participating in the trial phase of the launch of two new online platforms called Presento and Giftly. All participants were (sequentially) exposed to a platform that used an incremental format and a platform that used a cumulative format. We manipulated between-subjects (1) which platform happened to use in an incremental or cumulative format and (2) the order in which participants interacted with the two platforms. Taken together, a participant in our experiment was exposed to one of the following combinations: (1) Presento-incremental/Giftly-cumulative, (2) Giftly-cumulative/Presento-incremental, (3) Presento-cumulative/Giftly-incremental, or (4) Giftly-incremental/Presento-cumulative. The order of the answer options to our dependent variable choice question (preference for Presento vs. Giftly) corresponded to the presentation order of the platforms.
On these platforms, people can give small surprise gifts to each other. Participants were instructed to select a gift for three different people, and they completed this task both in the Presento app and in the Giftly app. On separate pages, they viewed images of a personal profile of a Presento or Giftly user, which included a picture, name, age, city of residence, and a nondescriptive personal quote from this user (see Table 6 and Web Appendix L for stimuli). They were then asked, for each user, to pick a gift out of five options: a chocolate bar, a USB stick, a set of coffee cups, a free copy of Time Magazine, or a red rose. We chose these options because they have similar monetary values in real life, though we did not mention this, or the explicit values. After making their choice, participants were shown an animated “processing” screen indicating that the user (i.e., recipient) was rating their gift, and after 4 seconds an app screen was shown indicating how much the recipient appreciated the gift that the participant selected for them. Scores were shown on a five-point scale, where a higher score reflects better performance.
Experimental Conditions and Stimuli for Experiment 3b.

Unknown to the participants, whatever gift they selected for whoever, raw scores were held constant across conditions: 5–5–2 for the incremental format, and 5–5–4 for the cumulative format. We designed the task to feature a sequence of two times three scores to prevent the task from becoming monotonous for participants. We offered the opportunity to enter a raffle for a bonus payment on Prolific. We indicated that the chance to win the raffle would be based on a participant's overall performance in selecting the gifts, so doing better entailed a higher chance to win. We indicated that each platform would select a lucky winner for a £10 bonus among its top five gift-picking participants. We recorded the dependent variable as follows: “You can enter the raffle on one platform only: either on Presento or on Giftly. You thus optimize your chance for winning the bonus by entering the raffle for the platform on which you feel you performed best overall. Would you prefer to enter the raffle on Presento or on Giftly?”
In this experiment, we went to great lengths to ensure realism. We again carefully designed a brand logo and an app screen to be realistic and believable to the participants. Apart from the brand names Presento and Giftly, the brand logo as well as the colors and layout used by both platforms were kept constant to avoid any design-induced choice effects. In addition, we took all possible measures to rule out effects of the gender, age, and ethnicity of the user profiles displayed on Presento and Giftly. First, to circumvent privacy issues, we generated genuine looking pictures of nonexisting people using machine learning algorithms on the website www.thispersondoesnotexist.com. Second, although we presented different profiles on Presento and Giftly, we made sure that the gender, age, and ethnicity of the three users on both platforms were comparable. Third, within each platform, we randomized the order of appearance of the three gift recipients. Evidently, the sequences of scores presented remained stable, such that each gift recipient could give a positive or a negative score in an incremental or a cumulative format, depending on the sequence position of the recipient in each condition.
Results and Discussion
A logistic regression in which preference for the Presento platform was regressed on format (0 = Presento in incremental format) and order and their interaction. First, we did not observe a significant interaction between order and format (β = .69, SE = 1.19; Wald χ2(N = 190) = .34, p = .56). More central to our theorizing, we observed a significant format effect, regardless of whether Presento was presented first (β = −5.26, SE = .86; Wald χ2(N = 190) = 37.16, p < .001) or second (β = −4.58, SE = .81; Wald χ2(N = 190) = 31.77, p < .001). For expository reasons, we primarily focus on the results for Presento and report the results using choice shares. We find strong evidence that people's preferences differ as a function of format: 88.4% preferred the Presento platform when it was specified in a cumulative format, but this dropped to 7.4% when it used an incremental format.
With this experiment, we further confirm H3 and demonstrate the robustness of our focal effect in an incentive-compatible setting. We find that in the case of a sudden negative deviation, well-performing participants preferred the platform which happened to use a cumulative format over a competitor, presumably because they inferred a better performance on that platform.
Experiments 4a–c
Experiments 4a–c test whether the proposed effect changes when the deviating score is perceived to be less or more representative of an entity's actual performance or quality (H4).
Experiment 4a
The primary aim of Experiment 4a is to test whether a less recent deviating score yields weaker format effects relative to a more recent deviating score. We expect that decreasing the representativeness of a score, by manipulating its recency (i.e., making it less recent), has a stronger effect on overall judgments of information in an incremental format than in a cumulative format.
Method
In total, 307 undergraduate students (Mage = 20 years; 133 women, 173 men, 1 preferred not to say) from a large public university were recruited, in exchange for partial course credit, to take part in a series of unrelated lab studies, including the current one. Excluding 11 participants who indicated that they did not understand the scenario (“Do you understand this scenario?” Yes/No) leaves our final sample at 296 participants.
The experiment had a 2 (format: incremental vs. cumulative) × 2 (deviating score: more recent vs. less recent) between-subjects design. All participants were considering applying for a new master's program: “Master in Business Analytics and AI.” This is a particularly relevant scenario, as all participants were undergraduate students in Business Administration. Next, they were introduced to a (fictitious) rating website called “AcademicEvals.com,” which gathers student ratings for academic master's programs across the globe (on a five-point scale; higher is better). In the incremental conditions, participants were informed that AcademicEvals.com posts the yearly rating of master's programs, based on all student scores that have been received in that particular year. In the cumulative conditions, we explained that AcademicEvals.com reports the average ratings, which are updated after every academic year.
We presented participants with the review scores; the presentation format and recency were manipulated in this stage. All participants saw review scores from the past three academic years (starting in 2019). In the more recent conditions, the lowest-scoring episode was the most recent academic year (incremental: 4.80/5 [2019–2020]–4.80/5 [2020–2021]–2.90/5 [2021–2022]; cumulative: 4.80/5–4.80/5–4.17/5). In the less recent conditions, the 2020–2021 academic year received the lowest score (incremental: 4.80/5–2.90/5–4.80/5; cumulative: 4.80/5–3.85/5–4.17/5; see Web Appendix M for full details). After being exposed to all reviews, participants were asked to rate the overall quality of the master’s program with three items on a seven-point scale (“Overall, to what extent do you feel that the ‘Master in Business Analytics and AI’ is a high-quality master's program?,” “To what extent do you feel that the ‘Master in Business Analytics and AI’ performs well?,” and “To what extent do you feel that the ‘Master in Business Analytics and AI’ is a low-quality master's program?”; 1 = “not at all,” and 7 = “very much”). For the analyses, we used the average score of these three items (Cronbach's α = .87), with the last item reverse-coded.
Results
A two-way ANOVA with format and recency as independent variables and overall quality perceptions as dependent variable yielded a significant main effect of both format (F(1, 292) = 28.59, p < .001) and recency (F(1, 292) = 10.31, p = .001). Evidently, when a negative deviation was less recent (M = 4.95, SD = .89), overall evaluations were less negative than when it was more recent (M = 4.56, SD = 1.28). Overall, a cumulative format yielded less negative overall evaluations (M = 5.08, SD = .86) than an incremental format (M = 4.43, SD = 1.25). Most central to our theorizing, we observed a significant interaction (F(1, 292) = 16.38, p < .001). When a deviating score was recent, we find that the focal effect is replicated once again: overall quality of the master program was judged to be more positive when review scores were presented in a cumulative format (M = 5.13, SD = .96) than when they were specified in an incremental format (M = 4.00, SD = 1.31; F(1, 292) = 45.35, p < .001, Cohen's d = 1.04). When a deviating score was less recent, we did not observe a difference between a specification in the cumulative (M = 5.03, SD = .74) and incremental (M = 4.88, SD = 1.01; F(1, 292) = .82, p = .37, Cohen's d = .15) formats.
Experiment 4b
Experiment 4b differs in two important aspects from Experiment 4a. First, the results of Experiment 4a are consistent with our predictions, but do not offer strict evidence of representativeness, as we assumed that representativeness was manipulated by recency. Therefore, Experiment 4b manipulates representativeness more directly. Second, we contrast the cumulative presentation format to a combined format, rather than an incremental format. In line with H4, we expect that if a deviating score is considered less representative (relative to a baseline), the difference in overall evaluations between cumulative and combined formats is attenuated.
Method
We recruited 400 participants (Mage = 42 years; 222 women, 176 men, 2 nonbinary) from CloudResearch. Using our previously employed question to check participants’ understanding, one participant was excluded, leaving our final sample size at 399 participants. The experiment had a four-condition between-subjects design in which format (cumulative vs. combined) and representativeness of the deviating score (baseline vs. less representative) were manipulated.
All participants were asked to imagine they had a daily one-hour train commute between two cities and that, one day, the train company decides to give each commute an “experience score” (more details in Web Appendix N). This score was presented as an indicator of the quality of the train ride based on timeliness and crowdedness and reported on a five-point scale (1 = “very bad experience,” and 5 = “very good experience”). Based on this score, train travelers can—if possible—choose a connection with more positive review scores. All participants saw five scores: four “five out of five” ratings (days 1–4), and, on day 5, a deviating negative rating. In the cumulative conditions, we explained that the score was an overall rating that was updated with a particular day's rating (updated score after deviating episode: 4.20/5.00). In the combined conditions, participants saw the cumulative score (4.20/5.00) and the daily score (score of the deviating episode: 1.00/5.00). We manipulated representativeness by adding an additional sentence before showing the score on day 5: “Interestingly, on day 5, you learn that the local football team had lost an important game against their archrivals. Many of the fans took the train that day after the game.” We reasoned that participants would consider the deviating episode to be less representative, attributing the score to the large, frustrated crowd, which rendered the train ride to be more crowded and less enjoyable on that particular evening. In the baseline condition, this sentence was not shown. A pilot study confirmed the effectiveness of our representativeness manipulation (see Web Appendix O for full details.)
After seeing the five scores, all participants judged their expectations toward their future commute with three items on a seven-point scale (“To what extent do you feel that it will still be a comfortable commute?,” “To what extent do you feel that the train company can still offer you a high-quality commute?,” and “To what extent do you feel that it may become a low-quality train commute?”; 1 = “not at all,” and 7 = “very much”). For the analyses, we used the average score of these three items (Cronbach's α = .86), with the last item reverse-coded.
Results
A two-way ANOVA with overall evaluations of the commute as the dependent variable revealed a significant main effect of format (F(1, 395) = 18.40, p < .001), a nonsignificant effect of representativeness (F(1, 395) = .13, p = .72), and a significant interaction effect between both factors (F(1, 395) = 7.66, p < .01). Overall, a cumulative format (M = 6.15, SD = .99) led to less negative judgments of the commute than a combined format (M = 5.70, SD = 1.10). More central to our theorizing, in the baseline conditions, we replicated the basic effect: a cumulative format (M = 6.28, SD = .80) led to less negative evaluations than a combined format (M = 5.54, SD = .99; F(1, 395) = 25.41, p < .001, Cohen's d = .71). In contrast, when the negative episode was less representative, this effect was attenuated (Mcumulative = 6.03, SD = 1.14 vs. Mcombined = 5.86, SD = 1.19; F(1, 395) = 1.25, p = .26, Cohen's d = .16).
Experiment 4c
Experiments 4a–b examined situations in which the deviating score is manipulated to be considered less representative, thereby attenuating the difference in overall evaluations between cumulative and incremental/combined formats. The primary aim of Experiment 4c is to test whether increasing the representativeness of a deviating score also strengthens the difference between cumulative and incremental/combined formats.
A second aim is to test the effect in a context in which consumers are confronted with a larger set of scores. A central feature of impression formation is that the value of additional information becomes proportionally smaller relative to the evidence already processed (e.g., Hogarth and Einhorn 1992). As such, the impact of a deviating score is likely to be weaker when set size increases, regardless of format. For example, a one-star score after 19 five-star reviews will probably be considered less representative of a restaurant's overall quality than after 4 five-star reviews. Notably, our theorizing would suggest that any cue that increases a deviating score's representativeness could still give rise to a strong format effect, even for larger sets of scores. For instance, if the reason for a one-star review is a recent change of a restaurant's owner, location, or menu, this deviating rating is likely to be considered as more predictive of the restaurant's current and future quality, despite many earlier positive reviews. Another example would be negative review scores that arise following problems with new updates of generally well-rated apps (e.g., an iPhone update draining the battery; Smithers 2022).
Method
We recruited 400 participants (Mage = 40 years; 174 women, 224 men, 2 nonbinary) from CloudResearch. Using our check question on participants’ understanding, we excluded one participant, leaving our final sample size at 399 participants. The experiment had a four-condition between-subjects design in which format (incremental vs. cumulative) and representativeness of the deviating score (baseline vs. more representative) were manipulated. The experiment had an identical setup as Experiment 4b (see Web Appendix P for full details), except that participants now saw 20 scores: 19 five out of five ratings, and, on day 20, a deviating negative rating. In the incremental conditions, the scores displayed represented daily scores (score of the deviating episode: 1.00/5.00). In the cumulative conditions, we explained that the scores represented an overall rating that was updated with that day's rating (updated score after the deviating episode: 4.80/5.00). We manipulated representativeness by adding an additional sentence before showing the (updated) score on day 20: “Interestingly, on day 20, the train company has implemented a whole new train schedule which may have consequences for your own commute.” In the baseline condition, this sentence was not shown. A pilot study confirmed the effectiveness of our representativeness manipulation (see Web Appendix Q for full details).
After seeing the 20 scores, all participants judged their expectations toward their future commute with three items, similar to those employed in Experiment 4b, on a seven-point scale. For the analyses, we used the average score of these three items (Cronbach's α = .93), with the last item reverse-coded.
Results
A two-way ANOVA with evaluations of the commute as the dependent variable revealed a significant main effect of format (F(1, 395) = 65.68, p < .001), representativeness (F(1, 395) = 62.61, p < .001), and a significant interaction effect between format and the deviating score's representativeness (F(1, 395) = 24.39, p < .001). Overall, a cumulative format (M = 6.22, SD = .98) led to more positive judgments of the commute than an incremental format (M = 5.23, SD = 1.64). A more representative deviating score yielded more negative judgments compared with the baseline (Mrepresentative = 5.24, SD = 1.64 vs. Mbase = 6.21, SD = .98). More central to our theorizing, when the deviating score was more representative, a cumulative format led to more positive evaluations than an incremental format (Mcumulative = 6.04, SD = 1.11 vs. Mincremental = 4.44, SD = 1.70; F(1, 395) = 85.28, p < .001, Cohen's d = 1.30). In contrast, in the baseline conditions, this effect was much weaker, yet still significant (Mcumulative = 6.40, SD = .79 vs. Mincremental = 6.02, SD = 1.11; F(1, 395) = 5.00, p = .03, Cohen's d = .28).
Discussion
Experiments 4a–c provide strong evidence for H4. Experiment 4a shows that when a deviating score is less recent, the format effect is attenuated. Experiment 4b reveals that decreasing a score's representativeness in a more direct fashion even eliminates the effect. In Experiment 4c, we find that increasing a deviating score's representativeness strengthens the effect.
General Discussion
Quantitative performance scores are common across many settings. In a series of nine experiments, the current article documents that, across a wide variety of marketing-relevant settings, decision makers’ reactions to performance scores vary as a function of the format in which these scores are specified. Overall, we find that decision makers infer less extreme performances from deviating scores (e.g., a 1/5 review after a series of 5/5s) when a cumulative format is used relative to an incremental format (Experiment 1). As a result, when a generally well-performing entity suddenly receives a negative score, individuals’ overall judgments are less negative when that score is presented in cumulative format relative to an incremental or combined format (Experiments 2a–c), and consumers are less likely to look for alternative options (Experiments 3a–b). Finally, we find that the effect is attenuated (strengthened) when a deviating score is considered less (more) representative for an entity's quality/performance (Experiments 4a–c).
By combining insights from literatures on numerical cognition, ratings, and impression formation, this work adds to emerging literature on cumulative and incremental presentation formats (Alves and Mata 2019). While prior work has proposed a mechanism based on so-called cumulative redundancy (i.e., the tendency to factor in redundant prior cumulative scores in judgments), we advance a new theoretical account for when and why format (cumulative vs. incremental vs. a combination) affects evaluations when scores that pertain to a single entity are presented. At a broader level, this work also contributes to research on outlier perceptions, which has investigated perceptions of social outliers (Dannals and Miller 2017) or emotionally deviant faces (Haberman and Whitney 2010). We add to this literature by identifying how quantitative presentation formats can affect perceptions of a set (of scores) that contains an outlier.
From a managerial point of view, this manuscript identifies how the seemingly innocuous choice of presentation format can have important consequences. These findings are perhaps most relevant to mitigate strong reactions when well-performing entities suddenly receive a negative score (negativity bias; Baumeister et al. 2001). For instance, presentation format could be an instrument that may be used for customer prioritization efforts (Homburg, Droll, and Totzek 2008). For example, peer-to-peer platforms could opt to show negative feedback to top-tier customers in a cumulative format to guard against overly strong reactions and prevent churn. Relatedly, for less desirable customers, an incremental format may be applied to stress a poor performance and increase the likelihood that these customers will improve or, to the extreme, defect. To illustrate, an interviewee (Sebastian, 26 years old) in our set of preliminary interviews (see Web Appendix E) stated, “If Airbnb wants you to behave better as a guest or host, that 1 [in the set of raw scores] has more impact. You see that 1, and you think ****, did I do something wrong?… I do not want to score a 1 again. If you score a 4.2, you think: okay, fine.” Indeed, peer service platforms like Airbnb allow hosts to accept or reject customers based on their past scores (about 50% are rejected; Teubner, Hawlitschek, and Adam 2019), such that the presentation format of this performance becomes of key importance (Eckhardt et al. 2019). We observe our effects in a wide variety of settings, spanning ride-hailing services (Experiment 2a), entertainment (Experiment 2b), the launch of a new product (Experiment 2c), a freelance marketplace (Experiment 3a), a gifting platform (Experiment 3b), education (Experiment 4a), and public transportation (Experiments 4b and 4c).
Furthermore, this manuscript helps managers better understand which contexts yield the strongest format effects. For managers curious about the potential impact of the intervention, we point to the experiments that provide the most ecologically valid tests of the format effect, although more field research is needed to get more accurate effect size estimates. For example, Experiment 3a uses a realistic freelance marketplace setting with stimuli closely resembling actual consumer choices. This experiment finds a shift of 8 percentage points in choice shares, which is in line with the 11 percentage point difference in adoption rates in the real-world data of our introductory illustration. Importantly, the effect also persists when there are significant delays between episodes (Experiment 2c, using a product review aggregator setting). In the latter case, the format in which deviating performance scores are presented may mean the difference between a critical versus a successful reception of a new product.
One intriguing question pertains to whether consumers perceive scores as a sequence or as isolated points in time. Although the majority of our experiments are more likely to have evoked perceptions of sequences, we suspect that the proposed mechanism also holds in more isolated situations (e.g., a one-time visit to an app store). In fact, a posttest reported in Web Appendix R (N = 100) shows that even when consumers engage in a one-time view of a set of scores, their perceptions of underlying raw scores in cumulative formats are distorted. Concretely, we presented participants with a 4.20/5 overall score (based on 5 reviews), told them that 4 of those scores had the maximum score, and asked them to estimate the underlying raw score of the negative deviation (i.e., 1/5). Participants significantly overestimated the deviating score (M = 2.04, SD = 1.20; t(50) = 6.19, p < .001). In line with our theorizing, this result reverses with a positive deviation (1.8/5 as overall score; 5/5 as positive deviation): Participants significantly underestimated the deviating score (M = 3.76, SD = 1.11; t(48) = 7.86, p < .001).
Taken together, the insights provided lead to various future research possibilities. Novel work may investigate whether, in a combined format, salience of the incremental or cumulative part may have an impact (e.g., where both parts are located on a consumer's screen, and their respective size). This question is particularly relevant because platforms vary on this dimension: while Apple's App Store seems to give equal weighting to both formats, a platform like Fiverr appears to give more prominence to the cumulative format (additional clicking/scrolling is needed to see incremental scores). Online learning platform Udacity, in turn, puts more emphasis on the incremental format relative to the cumulative view. Another related avenue for further research is testing the potential moderating impact of whether an entity's performance or quality varies (e.g., over time) or not, as this may also affect a score's perceived representativeness. For example, highly standardized products may be less likely to vary in quality relative to handcrafted products or authentic service experiences. For the latter two cases, a deviating raw score may be considered more representative than in the former case.
The current work has established that, relative to incremental formats, cumulative formats lead to better overall evaluations of well-performing entities with a negative deviation. Yet, future work may investigate instances in which the opposite occurs. One relevant situation may link to consumers striving to receive positive or perfect ratings only, and construe them as (sub)goals (also see Etkin 2016). Applying this to presentation formats, consumers—who have a strong focus on face values—might prefer a solid recovery as presented in an incremental format (e.g., 5–1–5–5–5) over a slow, painful climb in scores in the cumulative format (e.g., 5–3–3.7–4–4.20). Even worse, consumers may focus on maintaining a streak of maximum scores (Silverman and Barasch 2023), or on attaining a perfect score in individual episodes (e.g., round numbers as scale endpoints: 5, 10, or 100; Gunasti and Ozcan 2019). In a cumulative format, a focus on maximum scores is likely to disappoint, sooner or later, because in terms of face values, one nonperfect score suffices to break a streak or eliminate the chance of a maximum score for good. Given that people are strongly averse to losses (Kahneman and Tversky 1984), it may be that cumulative formats, rather than incremental formats, are more likely to prompt consumers to leave a platform. Testing these ideas presents fruitful avenues for further research.
Supplemental Material
sj-pdf-1-mrj-10.1177_00222437231193343 - Supplemental material for Is It as Bad as It Looks? Judgments of Quantitative Scores Depend on Their Presentation Format
Supplemental material, sj-pdf-1-mrj-10.1177_00222437231193343 for Is It as Bad as It Looks? Judgments of Quantitative Scores Depend on Their Presentation Format by Christophe Lembregts, Jeroen Schepers and Arne De Keyser in Journal of Marketing Research
Footnotes
Acknowledgments
The authors gratefully acknowledge the research assistance and input provided by Paul Kievits, Erik Kemperman, Remco Vos, Jeroen Bakens, Dan Schley, and Katrien Verleye, as well as the valuable comments from the review teams that handled (previous versions of) this article. A previous version of this article was presented at KU Leuven and at the 12th AMA SERVSIG conference in Glasgow; the authors thank the participants at these events for their constructive comments. The authors express their gratitude for the financial support given to the first author by the Erasmus Research Institute of Management.
Coeditor
Vikas Mittal
Associate Editor
Stephen Spiller
Declaration of Conflicting Interests
The authors declared no potential conflicts of interest with respect to the research, authorship, and/or publication of this article.
Funding
The authors disclosed receipt of the following financial support for the research, authorship, and/or publication of this article: This work was supported by the Erasmus Research Institute of Management.
References
Supplementary Material
Please find the following supplemental material available below.
For Open Access articles published under a Creative Commons License, all supplemental material carries the same license as the article it is associated with.
For non-Open Access articles published, all supplemental material carries a non-exclusive license, and permission requests for re-use of supplemental material or any part of supplemental material shall be sent directly to the copyright owner as specified in the copyright notice associated with the article.