
Abstract
Digital technologies lead consumers to engage with companies online after they see TV ads, and firms increasingly wish to coordinate TV advertising in real time with online marketing activities. As a result, firms are keen to measure how TV advertising affects consumers’ online behavior, but a key question is over what window of time to measure this effect. The standard industry practice of using short attribution windows around an ad to measure a causal effect may miss the possibility that consumer behavior shifts over time due to, for example, intertemporal substitution. The authors collaborate with an online travel platform and evaluate the results of a field test in which part of the country was exposed to TV ads while another part of the country formed a control group. Using the synthetic difference-in-differences approach, the authors find that TV advertising leads to an instantaneous increase in online browsing and sales. However, they also document evidence for intertemporal substitution: consumers appear to move their online activities forward in time in response to TV advertising, leading to lower browsing and lower sales at times when no ad is airing. The authors further explore the effects of TV advertising on channel choices, device choices, and promotion usage and discuss the implications for advertisers and the ad-measurement industry.
Digital technologies allow consumers to instantaneously respond to TV advertising by engaging online with companies and their products. Among firms, this has spurred interest in coordinating online marketing activities in real time with offline advertising events such as TV advertising, also referred to as moment marketing (Liu and Hill 2021). 1 To optimize such campaigns, firms need to measure in real time how TV advertising affects consumers’ online activities. An important question, however, is what scope of data is most appropriate for evaluating how TV advertising affects consumers’ online activities and how the effectiveness of TV advertising varies with channels, devices, and promotions.
A standard industry practice for measuring how TV advertising affects consumers’ online activities is to rely on narrow attribution windows. For example, Google introduced a TV attribution service to measure advertising effectiveness and return on investment (ROI) at an hour or minute level. 2 Services such as AppsFlyer allow companies to measure whether someone installs an app within a 20-minute window of a TV ad being shown. 3 The benefit of a narrow attribution window is a sharper identification of the effect of a TV ad because it is less likely to pick up spurious correlations. However, a narrow attribution window might lead an advertiser to miss insights into consumer behavior that would shape their evaluation of ad effectiveness. Narrow attribution windows, for example, cannot capture the possibility that consumers may take longer to complete their decision process, potentially resulting in higher future sales. Alternatively, TV advertising may prompt consumers to shift website visits and purchases forward in time, potentially decreasing future sales.
To empirically analyze how measurement practice shapes estimates of TV ad effectiveness, we collaborated with a large online travel platform focused on selling hotel stays. Specifically, we evaluated the results of a field test. In this field test, the company ran TV advertising in some part of the country while shutting off TV advertising for the remainder of the country. Given that this TV advertising treatment represented an exogenous intervention, we are able to use a synthetic difference-in-differences (SDID) approach in our estimation (Arkhangelsky et al. 2021). We then measure the immediate, lagged, and any intertemporal substitution effects. By contrasting our results with the standard industry practice of relying on relatively narrow attribution windows, we investigate what a narrow attribution window misses in terms of consumers’ online behavior.
We find that typical industry models that rely on narrow attribution windows consistently indicate a strong positive immediate online response to TV ads in terms of both consumers’ browsing and purchases. However, our proposed approach that uses field test data points to a caveat hidden in typical industry models. Specifically, we find that after the immediate positive responses, TV ads appear to reduce online browsing and purchase at times when no TV ad is aired in the treated area. We interpret this pattern as intertemporal substitution (i.e., purchase acceleration): in response to TV advertising, consumers appear to shift forward in time online activities that they would otherwise do at later points in time. Typical industry models with observational data cannot identify such intertemporal substitution effects, potentially leading them to overstate the effect of TV ads on online responses.
To optimally coordinate offline TV advertising and online marketing activities, it is essential not only to quantify the immediate and intertemporal substitution effects of TV ads, but also to understand how these effects vary across a set of marketing variables. This includes the channels through which consumers arrive at the company's website, the devices consumers use when browsing the company's website, and the extent to which consumers rely on promotional offerings. Measuring heterogeneity along these variables can provide advertisers with additional parameters to optimize when allocating marketing budgets. However, such insights are lacking in current industry offerings. For example, Google Attribution 360 can only link TV advertising with search queries on Google, Meta can only link TV advertising with social media channels, and no data analytics provider that we are aware of has linked TV advertising with consumers’ online promotion usage. In our study, we use rich information on channels, devices, and promotion usage for each session to explore in depth the heterogeneous effects of TV advertising.
We find that TV advertising increases both the activities originating from owned channels (including sessions coming via direct URL entry, via an app, and from organic search) and the activity from paid channels (including sessions coming from travel aggregators, paid search, affiliate marketing, and display ads) immediately after the ad being aired, but also creates intertemporal substitution: the owned-channel activity and the paid-channel activity both decrease at times when no ad is aired. The immediate increase is stronger for paid channels, whereas the negative intertemporal substitution is stronger for owned channels. This cross-channel variation in both magnitudes and timing in online responses to TV advertising indicates a potential cost structure shift for advertisers and a potential need to reallocate resources across paid and owned channels to optimize the coordination between offline TV advertising and online marketing activities.
For devices, we find that the positive immediate impact of TV ads on consumers’ purchases is significantly positive on both PCs (including laptops and desktops) and mobile devices (including cell phones and tablets). The negative intertemporal substitution effect is stronger on mobile devices relative to PCs. Over the entire campaign, TV advertising significantly increases browsing and purchases from PCs, but has no significant impact on browsing and purchases from mobile devices. This implies that advertisers may benefit from directing particular attention to sessions from PCs when coordinating TV advertising and online marketing activities, because the conversion rate is generally higher on PCs for more complex goods like hotels due to the greater ease and lower search cost (Ghose, Goldfarb, and Han 2013).
We then use information on whether consumers visited the firm’s price-promotion-focused web pages. We find that TV ads have an immediate positive impact on browsing and purchase in sessions where consumers do not seek price promotions but have no significant immediate impact on browsing and purchase in sessions where consumers show interest in price promotions. Over the entire campaign period, purchases during sessions involving price promotions decrease, whereas browsing and purchases during sessions not involving price promotions increase. These findings indicate that advertisers could potentially benefit from using fewer price promotions immediately following a TV ad.
Our findings have three implications. First, for advertisers, although focusing measurement on a narrow attribution window around a TV ad might appear an attractive method for evaluating whether a purchase was causally related to an ad, our results suggest that these narrow windows also have drawbacks because they cannot identify intertemporal substitution. Therefore, firms should be careful using this method when they wish to infer whether advertising significantly increased the total amount of website browsing or sales rather than focusing on a short-term lift. Second, our proposed model suggests an essential role of field tests in teasing apart the positive immediate responses and the negative intertemporal substitution. The extent to which TV advertising leads to immediate responses and intertemporal substitution will likely vary significantly across industries. Fortunately, however, it is to be expected that the current introduction of targeted TV advertising and digitization of TV analytics will make implementing field tests at scale significantly more straightforward in the near future and will thus provide a fruitful field to implement our proposed method. 4 Third, our findings highlight the heterogeneity in TV advertising effectiveness on consumers’ online activities across various variables, such as channels, devices, and promotions. A deep understanding of how response to TV advertising varies across these variables could potentially lead to better coordination between TV advertising and online marketing activities, thus further shifting the effectiveness and ultimately the profitability of TV advertising.
Related Literature
Our study is related to four streams of research. First, we contribute to a small literature on the optimal use of attribution windows in advertising. Despite the practical importance of this issue for advertising analytics, it has been less of a focus for articles published in mainstream marketing journals. This may reflect the fact that the challenge of advertising measurement has been classically conceptualized as a trade-off in marketing between measuring long-run and short-run effects in marketing models (Dekimpe and Hanssens 1995), but has not yet been updated for the digital world, where the choice of attribution window is now an endogenous variable that managers have to determine with little guidance. 5 However, the attribution window question has been addressed as a potential challenge in a variety of computer science publications (Chapelle 2014; Vernade, Cappé, and Perchet 2017). These have focused on proposing new statistical models to incorporate delayed purchases in measuring advertising effectiveness given that the right window over which to measure conversions is unknown. However, these studies do not consider the intertemporal substitution, also referred to as purchase acceleration, issues in the measurement, and their focus is mostly on methodology rather than substantive learning around consumer behavior. Our research contributes to this stream of literature by highlighting the economic relevance of considering intertemporal substitution.
Second, recent research has aimed to measure the effect of TV advertising on online behavior. Lewis and Reiley (2013), Joo et al. (2014), Joo, Wilbur, and Zhu (2016), Du, Xu, and Wilbur (2019), Liu and Hill (2021), and He and Klein (2022) find a positive relationship between TV advertising and consumers’ tendency to search or purchase online. Fossen and Schweidel (2016) and Tirunillai and Tellis (2017) demonstrate that TV advertising positively influences online word of mouth and online chatter. Our research complements these findings by leveraging data from a field test to identify not only the positive immediate online reactions to TV advertising, but also the potential negative intertemporal substitution due to TV advertising. Furthermore, we provide fresh insights on how the effect of TV advertising on online browsing and purchases varies across channels, devices, and promotion usage and the implications of how to use this heterogeneity to better coordinate TV advertising and online marketing activities.
Third, our research relates to a literature that studies TV advertising effectiveness more broadly. Lodish et al. (1995) conducted the first large-scale field study to look at the effect of TV advertising on purchases using split-cable tests and found a wide dispersion of sales effects of TV advertising. More recently, Shapiro, Hitsch, and Tuchman (2021) analyze a large number of products and document that over two-thirds of the estimated long-run elasticity of TV advertising on sales are either not statistically different from zero or negative. Danaher and Dagger (2013) focus on a unique case study of a larger retailer, in which the authors examine rich advertising and sales data covering ten different media and find that TV is among the media with the strongest influence on sales and profits. Like Danaher and Dagger’s work, our article also focuses on a case study in the context of TV advertising. We use the field test data from an online travel platform linking TV advertising and consumers’ online activities and demonstrate how an individual firm can use digital field data to investigate whether its TV ad campaigns generate incremental online activity. We point to the need for the advertiser to consider shifts of consumers’ behavior over time and to be cautious when deciding the length of the attribution window. Importantly, relative to this prior study, our study also sheds light on the effects of TV advertising on the choice of channels, devices, and promotions.
Fourth, our results relate to a literature documenting consumers’ intertemporal substitution more generally. Simester et al. (2009) provide evidence for intertemporal substitution (i.e., purchase acceleration) in the context of direct mail ordering. Blattberg and Neslin (1990) and Hendel and Nevo (2003) show that price reductions can cause intertemporal substitution (i.e., purchase acceleration) in sales due to consumer stockpiling. In the context of digital display advertising, Johnson, Lewis, and Nubbemeyer (2017) document that the median advertiser should expect little or no positive carryover after the campaign, whereas about one-third of the studied campaigns have negative carryover effects (i.e., an immediate positive but a negative future impact). We contribute to this literature by documenting patterns of intertemporal substitution in online consumer activities caused by TV advertising and, thus, linking offline marketing interventions with online responses.
Data and Model-Free Evidence
Data
Our data come from one of the world's top ten online travel agents selling hotel stays. The online travel industry is a large part of the digital economy: in 2015, the year of our data, the size of the online travel market exceeded $390 billion, of which $150 billion was attributed to online travel agents. 6 To evaluate the effectiveness of TV advertising, the company conducted a field test in 2015 in one of the world's top ten economies. The online travel agent advertised on TV through a large TV broadcast network in certain areas of the country and showed no TV ads in the remaining areas. The areas where TV ads were shown were selected to have a similar audience demographic composition as the control areas and, thus, the country overall. The past performance of TV advertising was not part of the selection criteria. To the best of our knowledge, our study is the first in the literature to employ a field test approach to assess the effectiveness of offline TV advertising on online browsing and purchase behavior. Running such a field test is typically difficult due to the resources required, the unwillingness of companies to forgo the potential benefits of advertising in certain areas for a prolonged period of time, and the difficulty in collecting data on both TV advertising and online consumer behavior (Tirunillai and Tellis 2017).
The TV campaign was built such that the advertising weight and length mirrored those of the company's previous national TV campaigns. The scale of this TV ad campaign is comparable to the top 5% of the top 500 consumer packaged goods brands in the United States in terms of TV ad spend per capita (numbers are based on Shapiro, Hitsch, and Tuchman [2021]). The company is one of the country's leading online travel agencies but operates in a highly competitive industry where brand awareness does not guarantee customer loyalty. Additionally, due to the typical infrequency of purchases, the primary goal of the ad campaign is to promote the brand broadly and remind both past and new customers about its offerings. The campaign did not focus on any specific destination or hotel, and it did not communicate any price promotions, special offers, price levels, or relative prices.
The company further ran online marketing activities during the test period. The largest share of this online marketing budget was directed toward affiliate marketing, including both travel aggregators such as TripAdvisor and Trivago and third-party websites such as travel blogs. The second largest share of the budget was spent on paid search, in which the company bid on branded keywords, unbranded keywords, and Google HPA. 7 The company also conducted activities for which we are unable to quantify marketing spend, such as improving its website, search engine optimization, mobile app development, and email marketing. During the period of the field test, display advertising and social media marketing accounted for a tiny fraction of all marketing spend. Note that apart from the field test of TV advertising, no online or offline marketing interventions were targeted at either the treated or the control region during the sample period.
We have access to data covering a period of around six weeks in 2015. 8 In the first four weeks, the company did not show any TV advertising. In the following 15 days, the company ran the TV ad campaign in the treated areas. We obtain two types of data: consumer activities on the company's website and the company's TV advertising.
Consumer online activity data
We collect clickstream data from the company. Each clickstream record includes the time stamp of the page visit, the location of the user, the device used, information on the channel by which a user arrived for the session, and basic information on the page content. The company, following the industry standard, defined a browsing session as a continuous period of user activity on the website, in which successive events are separated by no more than 30 minutes. The firm could not at this time link individual consumers across devices. The locations included in the data allow us to link each record to a specific geographic region that is broadly defined by a town or a city and the area surrounding it. For the purpose of this research, we refer to these geographic regions as “counties.” In total, the data come from 126 such counties. Of these, 11 were treated and 115 were in the control group.
Over the six-week period, the website recorded a total of 4,920,968 sessions in the treated and control groups. 9 It also recorded detailed information on the channels by which users arrived at the company's digital offering and the devices users used to browse the web page. Regarding channels, among all the sessions, 36.3% came from travel aggregator sites, such as TripAdvisor and Trivago, 10 15.8% were initiated through direct visits to the website, 13.2% came from paid search and 8.5% from organic search, 9.8% were visits to the app, 8.9% arrived through clicking on an email, 5.3% were referred by third-party affiliate marketing, such as travel blogs, and the remaining 2.2% arrived through other means, including display advertising and social media advertising. In terms of the devices used, 48.5% of sessions were from PCs, including both desktops and laptops, and the remaining 51.5% were from mobile devices, including 31.7% from cell phones and 19.8% from tablets.
On average, as shown in Table 1, consumers browsed 11.4 pages during a session, and an average session lasted 6.8 minutes. Over the six-week sample period, 305,884 sessions concluded with a transaction, yielding an average conversion rate of 6%. A hotel stay on average lasted 2.2 days and cost $605. The average hotel star rating among transactions was 3.5.
Summary Statistics of Sessions and Transactions.

For our main analysis, we create panel data sets that aggregate the data at the county level for four different time intervals. Table 2 reports summary statistics of the panel data aggregated at the 30-minute level, where an observation records the number of sessions and sales in a county within a 30-minute time interval. We likewise create panels for 2-minute, 10-minute, and 60-minute intervals to assess the robustness of our results to the varying data intervals (Tellis and Franses 2006).
Summary Statistics of Sessions and Sales for the 30-Minute Interval Panel.
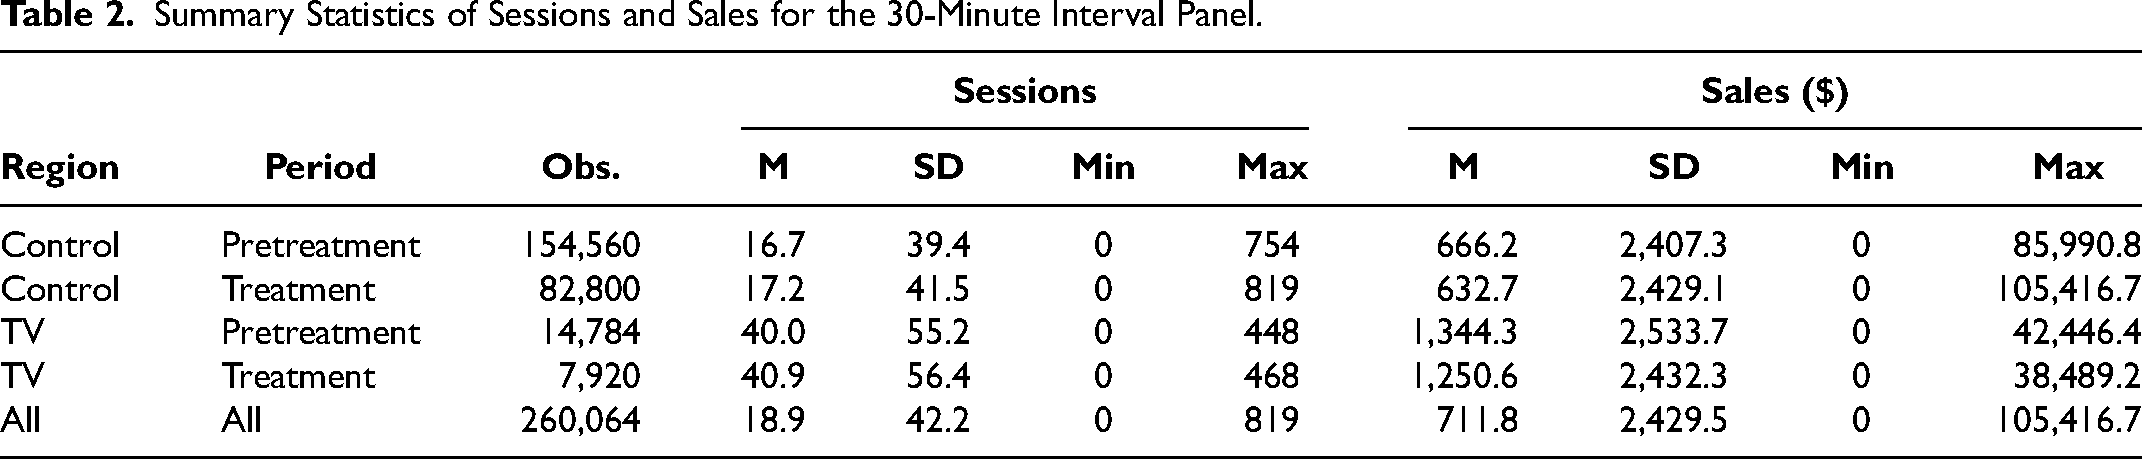
Table 2 demonstrates that, accounting for 24 hours a day over 43 days in the 126 counties, the county panel data at the 30-minute interval gives a total of 1,344 30-minute intervals and 169,344 observations in the pretreatment period and 720 30-minute intervals and 90,720 observations during the treatment period. The summary statistics of the other three panels are reported in Web Appendix Table W1. We see that the numbers of sessions and sales are broadly similar between the pretreatment period and the treatment period, although counties in the treated region on average have about twice the number of sessions and sales than counties in the control region. These panel data sets form the basis of our analyses, and we employ the SDID approach throughout to adjust for the baseline difference between the treated and control counties.
TV advertising data
We further collect data on TV advertising in the treated region during the campaign period. The schedule and the budget of the TV advertising campaign were set months before the start of the ad campaign and thus were not influenced by the ex post realized effectiveness of TV ads. The TV advertising data are provided by the TV broadcast network directly. For each ad, the data report the second-level time stamp, ad length, ad spend, and television ratings. Ads are either 10 or 30 seconds long, and the two versions are cut from a single ad creative. The ad featured a humorous scene in a vacation setting without revealing any specific hotel name. They were shown on three different channels of the TV network across the 11 treated counties simultaneously. All the counties in the country share the same time zone. The TV broadcast network sets the ad spend to be a linear function of the television ratings, so we focus on ad spend and ad length in the following analysis.
Figure 1 shows the patterns of the hour-level ad spend and ad duration. Ad duration is defined as the sum of ad length in a given time interval. Ad spend is plotted in Panels A and C of Figure 1, and ad duration is plotted in Panels B and D. Due to confidentiality concerns, we do not display the scale for ad spend. The top panel shows the TV ad intensity over the 15-day campaign period. The bottom panel shows the TV ad intensity over hours of the day averaged across the 15 days. On an average day, 14 ads, or a total of 284 seconds of ads, were shown across the three TV channels of the TV broadcast network. The ads were mostly shown between 5 p.m. and 12 p.m. The cost per ad is higher between 7 p.m. and 11 p.m.

Ad Spend and Ad Duration Patterns.
The figures demonstrate substantial variation in advertising across days and across times of day. Thus, we include day fixed effects and hour-of-day fixed effects in all analyses. Because the figures suggest some degree of difference between ad spend and ad duration, we use ad spend in the main analysis and as a robustness check replicate the main findings using ad duration.
Model-Free Evidence
To better understand the data, we provide model-free evidence for TV ad effectiveness using tight time windows around the airing of TV ads in the treated counties. Figure 2, Panel A, focuses on online sessions, and Panel B displays online sales. We present results for the 30-minute windows before and after an ad. In each instance, the vertical line denotes the start time of an ad, and each dot represents the average number of sessions in Panel A and average sales in Panel B, at a given point in time relative to when the ad was displayed (e.g., 10 minutes prior to the ad) across all ad incidences in the treated counties. The dashed lines represent the average of all the dots for the 30-minute window before the ad and the 30-minute window after the ad, and the shaded area represents the standard errors of these averages. Across all treated counties, the average number of sessions is 21.5 in the 30-minute window before the ad and 22.1 in the 30-minute window after the ad, a statistically significant 3% lift across all the ads. The average amount of sales is $721 in the 30-minute window before the ad and $773 in the 30-minute window after the ad, a 7% lift across all the ads, although not statistically significant due to the large variation in sales.

Online Responses Around TV Ads.
In addition to the visual documentation of the immediate effect of TV ads on online activities, we further conduct an event study following one of the industry's standard practices. Data analytics companies typically have granular observational data on consumer online response to advertising, but do not have access to the type of field test that we have, including both a control group and a treated group. Because advertisers typically choose advertising times when they expect online activities to be high, the measurement of advertising effectiveness can be plagued by endogeneity. To circumvent the endogeneity problem, data analytics companies rely on tight attribution windows for identification; that is, they focus on a short time period around the event during which they assume any other potentially confounding factors stay constant. We establish a baseline for the type of results our firm would obtain using such tight attribution windows by conducting an analysis from the perspective of a typical advertiser. Because such an advertiser typically would not run a field test, we focus in this event study on data from treated counties during the treatment period only. The event is defined as a TV ad being aired, the sample includes a short time window right before and right after an event, and sessions and sales are measured at the minute level. This short time period is set to be 2 minutes, 10 minutes, 30 minutes, and 60 minutes in the four samples, respectively.
The specification for the event study is as follows: Yit = θAfterit + Dt + Zi + ξit, where Yit is either a measure of the number of sessions, being ln(Sessionsit + 1), or the value of online sales, ln(Salesit + 1), in county i from the traffic originating at time t. Since consumers may not instantaneously complete a purchase, we attribute transactions within the following 24 hours from the same IP address to the initiating session in the event study, similar to Blake, Nosko, and Tadelis (2015a) and Liaukonyte, Teixeira, and Wilbur (2015). Afterit equals 1 if minute t is in the attribution window after a TV ad for county i. 11 Dt captures the date fixed effects and the hour-of-day fixed effects to control for fluctuations over time, Zi captures the county fixed effects to control for time-invariant differences across counties, and ξit is the idiosyncratic error term. Finally, θ is the parameter of interest, measuring the effect of TV advertising on online sessions and online sales.
Table 3 presents the results. We see that TV advertising leads to a significant increase in online sessions across the four attribution windows and a significant increase in online sales for 2-, 10-, and 30-minute attribution windows. This method mirrors the tight attribution windows used by industry, and the results are consistent with case studies reported by commercial firms that report an instantaneous positive online response to TV advertising (see Dughi 2018). The magnitude of the increase changes with the length of the attribution window. The percentage increase in online sessions is biggest when the attribution window is narrow, which suggests that consumers respond to viewing an ad reasonably quickly, but this effect appears to dissipate over time. The pattern for online sales is similar, suggesting that the increase in sessions leads to an increase in sales following a TV ad.
Event Study of the Effect of TV Advertising on Online Activities.

*p < .10. **p < .05. ***p < .01.
Notes: The event study sample includes a short time window right before and right after a TV ad from treated counties during the treatment period. Robust standard errors are reported.
Synthetic Difference-in-Differences Approach
Motivation for Synthetic Difference-in-Differences Approach
Event studies with tight attribution windows provide sharp identification; however, they come with some potential concerns. First, focusing on tight attribution windows may miss activities that happen with some delay; that is, it can be difficult to measure long-lasting effects. Second, tight attribution windows do not capture any potential intertemporal substitution (i.e., consumers moving their activities forward in time due to TV ads). Both of these concerns may lead to an incomplete understanding of TV ad effectiveness and suboptimal coordination between TV advertising and online marketing activities in real time.
These concerns highlight the need to look at the whole treatment period in order to have a comprehensive understanding of TV ad effectiveness. However, such an approach is typically challenging because of endogeneity concerns. Thus, we take advantage of the field test because it provides us with a control group and a treated group with pretreatment and treatment periods, offering a clean difference-in-differences (DID) setting. Because of the differences in levels of sessions and sales between the treated and the control region, we turn to the synthetic difference-in-differences (SDID) approach (Arkhangelsky et al. 2021). The advantage of the SDID approach is that, unlike DID, it uses matching and reweighting to construct a control group that mirrors the trends of sessions and sales of the treated group so that it alleviates any omitted variable concerns caused by the observed gap between the two regions. 12
Synthetic Difference-in-Differences
The SDID estimation is based on the classic DID framework with matching and reweighting at both the unit and time dimensions. In our field test context, the classic DID estimation of the average treatment effect would be
In the SDID approach, we construct the unit weights 
The unit weights 
The time weights 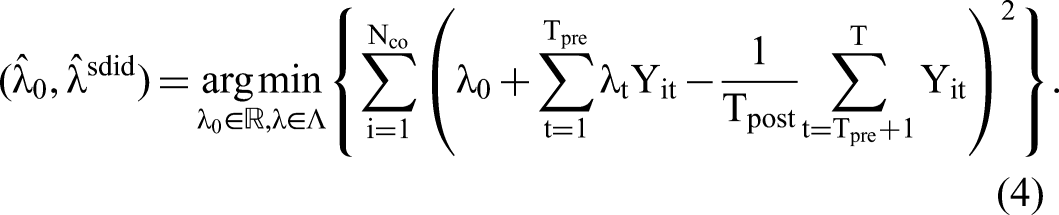

Day-Level Trends of Control and Treated Regions with SDID Weights.
In addition to the visual inspection, we further estimate the average treatment effect
Table 4 presents the average effect of TV advertising over the entire campaign period on online sessions and online sales for panels of 2-, 10-, 30-, and 60-minute intervals. In estimating the average effect, we treat all the time intervals during the campaign period as treated periods and ignore whether in any particular time interval an ad was shown. Contrary to the strong positive impact of TV advertising estimated in the event study, we find that the average impact of TV advertising on the number of sessions and sales over the campaign period is not statistically different from zero. This result is not an outlier, as previous meta-analyses on TV advertising effectiveness have documented that it is not rare that TV ads can yield little or no ROI (Lodish et al. 1995; Sethuraman, Tellis, and Briesch 2011; Shapiro, Hitsch, and Tuchman 2021). However, this result does present a contrast to the strong positive effects of TV advertising that we documented in the event study in Table 3. Although it is possible that the difference in results could be driven by the lack of statistical power, it could also be an outcome of consumers’ online activities shifting across time during the campaign period, which the event study fails to capture. We next propose a specification that can capture an instantaneous effect of TV advertising and possible lagged effects as well as any intertemporal substitution effects.
Average Effect of TV Advertising on Online Activities.

*p < .10. **p < .05. ***p < .01.
Notes: The sample is the panel data set including both control and treated counties from the field test. Standard errors are clustered at the county level.
SDID with Intertemporal Substitution Effects
To estimate the immediate and lagged effects of TV ads and allow for the possibility that consumers may shift their online activities along the time dimension, we propose the following specification: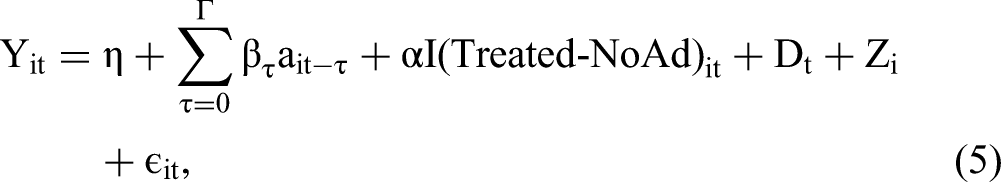
Instead of using a single indicator for the treatment period, we now separately measure three effects. First, we measure the immediate effect of TV advertising on sessions and sales during the time period in which the ad was shown. The term ait = ln(AdSpendit + 1) measures the time-varying advertising expenditure in county i during the time interval t, and β0 captures the immediate effects of TV advertising on sessions, or sales, during the time period the ad was shown.
Second, we use β1, …, βΓ to capture the lagged effects of TV ads on sessions, or sales, in subsequent time intervals where Γ is the number of lagged periods. 13 We include lagged terms covering up to 180 minutes because in our data any positive effects from advertising dissipate after this time period. 14
Third, we allow for TV advertising to affect sessions, or sales, outside of the period covered by lagged effects. Specifically, we suggest that consumers may reduce their online activities at times when no ad is aired and that fall outside of the period of lagged effects because viewing the TV ad might prompt consumers to move activities forward in time. Our specification captures this intertemporal substitution in the term I(Treated-NoAd)it, which indicates a point in time in the treated period and for the treated group when no TV ad was aired and that did not overlap with any of the periods in which we would expect to find a lagged effect; that is, I(Treated-NoAd)it = 1 if Treated Regionit = 1 and Treatment Periodit = 1 and AdSpend = 0 for
There are two reasons why we focus on documenting the intertemporal substitution effect as an average across the 15-day period of the campaign, rather than accounting for the specific amount of time passed since a consumer had been exposed to a TV ad and instead of quantifying how far forward in time individual consumers moved their online activities. First, our data do not record whether an individual consumer was actually exposed to a TV ad. Second, intertemporal substitution may happen over any time horizon, so a model would need to be flexible enough to allow for intertemporal substitution over a sufficiently long time frame. For example, to measure a one-week intertemporal substitution effect in a 30-minute panel, one would need to include at least 336 lagged terms, which leads to identification challenges for any data sets typically available to firms or researchers (see detailed discussions in Johnson, Lewis, and Nubbemeyer [2017] and He and Klein [2022]).
Note that the traditional approach without this term implicitly assumes that at times in the treatment period when no ad is aired and no lagged effects occur, the baseline difference in sessions, and respectively in sales, between the control and the treated group should be identical to the pretreatment period. The identification for α comes from this change in baseline difference and thus can only be measured with field test data that provide both a proper control group and a pretreatment period.
Further, as before, Dt and Zi denote time and county fixed effects, respectively. Next, ɛit denotes the error term, which is clustered at the county level to allow for correlations over time within a county. 15 In the robustness section, we use the Newey–West approach to account for possible serial correlations and heteroskedasticity in the error terms (Newey and West 1987) instead of the clustered standard errors.
With the estimated unit weights and time weights, which we discussed in the previous subsection, the SDID estimators are computed by solving
Figure 4 presents the SDID results of the new model, showing the results for data aggregated at 2-, 10-, 30-, and 60-minute intervals. Panels A, C, E, and G of Figure 4 plot the results for online sessions; Panels B, D, F, and H plot the results for online sales. Within each panel of the figure, the left y-axis shows the scale for the estimated βs (immediate and lagged effects) within a 180-minute period after the ad aired, and the right y-axis shows the scale for the estimated αs (average intertemporal substitution) beyond the 180-minute period.

Effects of TV Advertising from the Four Panels.
We explain Figure 4, Panel A, in detail. Zero on the y-axis represents the baseline from the control group, against which we compare the treated group. The first dot indicates a positive immediate effect of advertising on the number of sessions when data are aggregated at 2-minute intervals. This positive immediate effect mirrors prior results, such as the findings of Du, Xu, and Wilbur (2019), Fossen and Schweidel (2016), Joo et al. (2014), and Liaukonyte, Teixeira, and Wilbur (2015). The remaining dots capture the lagged effects within a 180-minute period. It is obvious that the initial positive effect rapidly declines and is around zero after about 90 minutes. The dashed line after 180 minutes reflects the average intertemporal substitution effect, which we find to be negative. Throughout, the shaded areas around the plots indicate the 95% confidence intervals.
All other panels of the figure follow the same logic. Panels A, C, E, and G of Figure 4 demonstrate an immediate positive effect of TV advertising on sessions, positive lagged effects that decline over time as well as negative intertemporal substitution effects. Similarly, Panels B, D, F, and H of Figure 4 plot the effect on sales. Note that again the immediate effect, indicated by each first dot, is positive throughout. Further, the lagged effects on sales, indicated by the following dots, decline rapidly over time. The immediate and lagged effects become more pronounced as the time intervals used for estimation become longer. We attribute this to multiple factors. First, consumers may need more than a few minutes to make a purchase decision following an ad exposure, which can explain why the instantaneous effect is not significant in Figure 4, Panel B. 16 Second, the inclusion of 90 βs in this specification for 2-minute intervals means that we have to estimate a large number of parameters; thus, these are noisier and less precise. Third, the large variation in sales as an outcome variable means that the noise of any estimate will be bigger for shorter time intervals. Throughout, the average intertemporal substitution effect, indicated by the dashed line, is negative.
In summary, these results suggest that exposure to TV advertising prompts consumers to browse the firm's website and make purchases within roughly the following hour to two hours. However, this appears to come at the cost of lower browsing and purchases at later points in time when ads are not shown, suggesting that, at least in the context we study, TV advertising moves forward in time online activities that consumers would otherwise carry out later. 17
Importance of Intertemporal Substitution
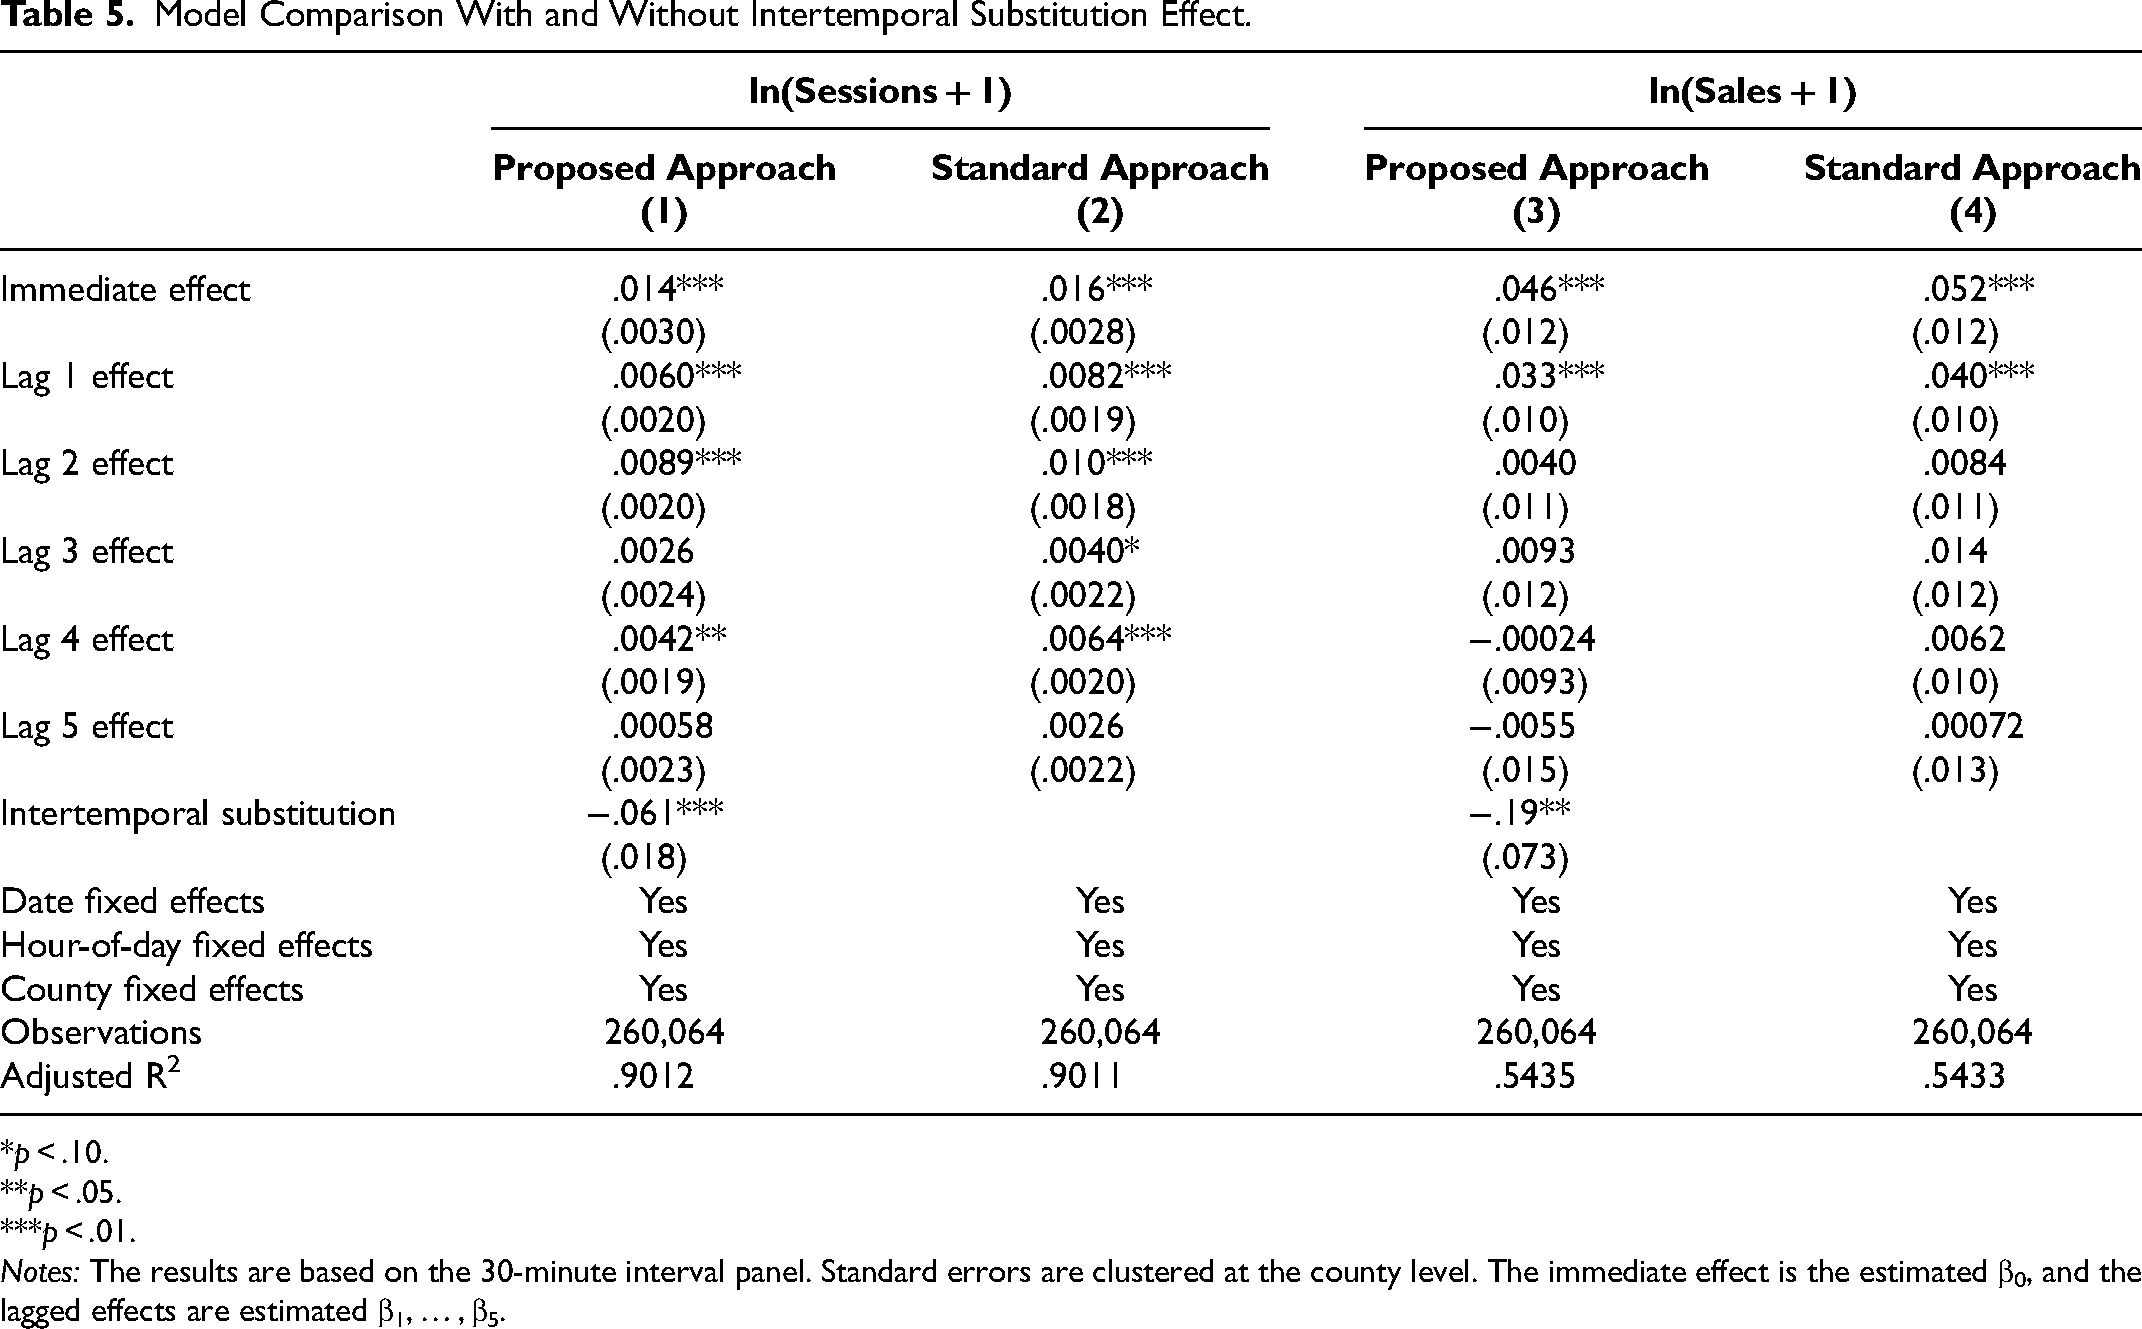
We assess the importance of capturing the intertemporal substitution effect. We compare the implied effectiveness of the TV advertising campaign based on our proposed measurement approach to the more common industry practice by advertisers and measurement companies, that is, the distributed lag model that captures immediate and lagged effects, but ignores intertemporal substitution.
18
Our specification for the standard distributed lag model is
Model Comparison With and Without Intertemporal Substitution Effect.
*p < .10. **p < .05. ***p < .01.
Notes: The results are based on the 30-minute interval panel. Standard errors are clustered at the county level. The immediate effect is the estimated β0, and the lagged effects are estimated β1, … , β5.
Our proposed approach and the standard distributed lag model generate different estimates, with the key difference being the intertemporal substitution effect. In our proposed model, this effect is significantly negative, whereas it is ignored in the standard distributed lag model. This contrast has important implications for a company's ROI from TV advertising. The standard distributed lag model produces positive and significant estimates, suggesting strong positive elasticities of TV advertising on online sessions and online sales. However, our proposed model suggests that the negative intertemporal substitution effect would offset much of the positive significant immediate and lagged effects. Therefore, the elasticities of TV advertising on online sessions and online sales are likely to be much smaller or even insignificant. As a result, for the same TV ad campaign, the standard distributed lag model would find a significant positive ROI for the company, whereas our proposed model would suggest an ROI close to zero. 19 Further, although we estimate a similar magnitude of the immediate effect of advertising across the standard distributed lag model and our model, there is a statistically significant difference between these two estimates (with p-values below .01 for estimates for online sessions and below .05 for estimates for online sales) as confirmed by a cross-model test using the method proposed by Clogg, Petkova, and Haritou (1995). The same applies to the lagged effects across the two models. We note that while our analysis is based on a single category, the concern that measurement of TV advertising effectiveness may miss intertemporal components is likely to apply to other categories as well, albeit to different degrees.
For a firm, this means that the best practice in measuring TV advertising effectiveness involves four components. First, the firm needs to ensure there is an exogenous intervention. Second, the firm likewise needs to ensure the presence of a control group. Third, the firm needs to consider the possible existence of intertemporal substitution in the data analysis. Fourth, since at least in the context of TV advertising in practice it is often difficult to fully randomize and thus have fully matching pretreatment trends across both treatment and control groups, it will often be necessary for the analysis to strengthen the causal identification using an approach such as SDID that we employ in our setting.
In conclusion, the contrasts between the two sets of results suggest that firms should be cautious when interpreting reports generated by market research companies based on the analysis of short time windows (e.g., the event study) or standard regression models that do not account for the possibility of consumers’ intertemporal behavioral change (e.g., the standard distributed lag model), because they may give companies a false belief that TV advertising may be effective when it is not.
Identification and Robustness
In this section, we discuss the identifying assumptions of the SDID approach, and then we present a series of robustness checks.
Identification
The standard DID approach requires three identifying assumptions. First, in the absence of the treatment, the trends of the key outcome variables of the control and the treated regions should be parallel. The SDID approach utilizes the unit and time weights to match the pretreatment trend such that the reliance on parallel trend type assumptions can be weakened. We find that although in the raw data the control regions have a lower level of online activities relative to the treated regions, after reweighting and including an additive unit-level shift, the pretreatment trends across control and treated regions match almost perfectly (Web Appendix Figure W1). This suggests that SDID is effective in constructing a valid “counterfactual” control group that satisfies the parallel trend assumption. In addition to the visual inspection, the test for parallel trends suggested by Angrist and Krueger (1999, p. 1299) fails to reject the null hypothesis of a parallel trend (Web Appendix Table W2).
In two placebo tests, we further confirm that the results are indeed an effect of the treatment and not an artefact of broader patterns in the data. In the first placebo test, we focus on the four-week pretreatment period. We assign the first two weeks to a hypothetical pretreatment period and the second two weeks to a hypothetical treatment period where TV ads were delivered at the same level of advertising that we observe in the first two weeks of the real campaign in the treated regions. We estimate the same model as in Equation 6 and Figure 4. We find statistically insignificant estimates of the intertemporal substitution effects (see Web Appendix Table W3), suggesting that the pattern of intertemporal substitution that we observe in the field data is not driven by differences in the hour-of-day and day-of-week site traffic and transactions between treated and control regions. In the second placebo test, we focus on the control region in the three-week treatment period. We assume that the control region was exposed to the same level of TV advertising as the treated region. We estimate an event study, similar to Table 3. The statistically insignificant estimates suggest that these hypothetical ads would not have any placebo effect on online sessions and sales, implying that the positive instantaneous effects of TV ads that we identified in the treated region were unlikely to be caused by unobserved confounding factors (see Web Appendix Table W4).
Second, we rely on the assumption that the company did not implement any changes to its marketing activities specific to either the TV or the control region during the course of the campaign. The company indeed confirmed that during the period of the field test, there were no changes in the marketing activities. Further, the company was careful not to run any region-specific marketing activities in the country, except for the TV advertising that forms the basis of our study. In addition, the company scheduled the full TV advertising campaign prior to the start of the treatment period and kept both this TV advertising schedule and the budget fixed during the course of the test.
Throughout various channels, display ads, social media ads, and targeted emails differ from the others (e.g., direct website visit, app visit, search, and travel aggregators) as they are not directly accessible by consumers unless the company initiates it. Consequently, there is a concern that TV ads might have spurred web browsing and subsequently shifted exposure to display ads, social media ads, or targeted emails differently between the treated and the control regions. If this were the case, our results would not only measure the direct impact of TV ads on online activities, but also the indirect impact of TV ads on online activities via digital ads. To assess the importance of such an indirect effect and to construct a conservative measure, we reestimate the effect of TV ads on online activities, excluding sessions originating from affiliate marketing, display marketing, social media marketing, and email marketing (about 16.4% of total sessions). The results are almost identical to our main results in Table 4 and Figure 4, as shown in Web Appendix Table W5 and Figure W2, in terms of both magnitude and statistical significance. We also present the individual channel results in Web Appendix Tables W6 and W7. We conclude that the direct impact prevails over any potential indirect impact of TV ads on online activities in the observed pattern.
Third, we assume that competitors did not respond to the TV ad campaign in a way that would be specific to the treated region. The execution of the field test is private information to the company. Without knowing ahead of time when the test would run and which region would be treated, there is no reason to believe that competitors would respond to this test strategically, let alone respond specifically to the TV region. One caveat is, once again, that TV ads might spur online browsing that, in turn, could lead to consumers in the treated and control regions being exposed to competitors’ digital ads with different propensities, a pattern we would be unable to measure directly. Note, however, that since the previous analysis suggested little, if any, indirect effect of TV advertising through increased exposure to the focal firm's own digital ads on the focal firm's sessions and sales, it seems unlikely that the effect of competitors’ advertising on online activities at the focal firm would be any greater. This leads us to believe that our results are not significantly influenced by indirect effects that come through either the firm's own digital marketing activities or those of competitors. We note that if there were such indirect effects, the effects we measure should be interpreted as the aggregate of the direct effect of TV advertising as well as those through other digital media.
Overall, we conclude that the three identifying assumptions are valid in our context using the SDID approach.
Robustness Checks
We report a set of checks to confirm the robustness of the SDID results reported in Figure 4 that provide evidence for an intertemporal substitution effect. We report the robustness check results for the 30-minute panel data on online sessions in Table 6 and on online sales in Table 7. For the sake of brevity, robustness checks for results based on the 2-, 10-, and 60-minute panels are reported in the Web Appendix (Table W8 for online sessions and Table W9 for online sales).
Robustness Checks on Online Sessions for 30-Minute Panel.

*p < .10. **p < .05. ***p < .01.
Notes: Column 1 reports the original results. Column 2 reports the Newey–West standard errors that are robust to serial correlations. Column 3 reports the weighted ad spend accounting for the position of the ad in a time interval. Column 4 reports the alternative treatment measure of ad duration. Column 5 allows the intertemporal substitution effects to differ in the first week and the second week of the TV ad campaign. The immediate effect is the estimated β0, and the lagged effects are estimated β1, … , β5.
Robustness Checks on Online Sales for 30-Minute Panel.

*p < .10. **p < .05. ***p < .01.
Note: Column 1 reports the original results. Column 2 reports the Newey–West standard errors that are robust to serial correlations. Column 3 reports the weighted ad spend accounting for the position of the ad in a time interval. Column 4 reports the alternative treatment measure of ad duration. Column 5 allows the intertemporal substitution effects to differ in the first week and the second week of the TV ad campaign. The immediate effect is the estimated β0, and the lagged effects are estimated β1, … , β5.
Serial correlations
The previous analyses control for date fixed effects, hour-of-day fixed effects, and county fixed effects, but it remains possible that standard errors are biased due to serial correlations. Here, we use the Newey–West approach to account for the possible serial correlations and heteroskedasticity in the error terms (Newey and West 1987). The similarity between the original results, which we display again in Column 1, and this additional set of results displayed in Column 2 in Table 6 and Table 7 suggests that our results are robust to serial correlations.
Position of the ad in a time interval
In creating the panel, we aggregate TV advertising in time intervals, but ignore the exact position of the TV ad within a time interval. This approach may be concerning, especially when aggregating the data to 30- or 60-minute time intervals, because ads may be placed at different segments of the observation interval so that the data would not evenly mirror the effect of an ad. In this robustness check, we control for the position where the ad appeared in a time interval by weighting ad spend such that ads that have more time to influence online behavior are given more weight. For example, a TV ad that aired at 8:15 p.m. can only have influenced 15 minutes during the 8:00–8:30 p.m. interval and thus is given a weight of .5 in the 30-minute analysis. Table 6 and Table 7 present the results in Column 3. Once again, the positive immediate effects and the negative coefficients of the intertemporal substitution indicate the robustness of the results.
Ad duration versus ad spend
In our main specification, we use ad spend as the treatment. An alternative treatment measure is ad duration; that is, the sum of ad length in seconds in a time interval. Table 6 and Table 7 show, in Column 4, that our results are robust to quantifying advertising treatment as the total duration of ads during that time interval.
Time-varying effects
The previous analyses measure the average intertemporal substitution effect. In Column 5, Table 6 and Table 7 estimate the intertemporal substitution effect separately for the first and the second week of the TV ad campaign. Intertemporal Subs × I(1st Week) measures the average intertemporal substitution effect of TV advertising in the first seven days of the ad campaign, whereas Intertemporal Subs × I(2nd Week) measures that in the last eight days. We find statistically significant negative intertemporal substitution effects in the first week for both online sessions and sales and more pronounced effects in the second week, with online sessions exhibiting significance at a p-value of .01 and online sales at a p-value of .1. This result is consistent with a larger number of consumers having been affected by a potentially greater number of ads by the second week than in the first week and, thus, having moved their browsing and purchases forward in time.
Broader Investigation of TV Advertising Effects
Results in the previous section document that TV advertising drives up immediate online sessions and sales, but lowers future browsing and purchasing activities in periods where ads are not aired. These findings add to companies’ understanding that both real-time and future responses matter when measuring the return on TV advertising. They also provide insights for companies that are keen to adopt moment marketing. To use moment marketing, companies can further benefit from learning how TV ad effectiveness, and especially the immediate and intertemporal substitution effects, vary across a set of variables, such as the channels through which consumers arrive at the firm's website, the device consumers use when browsing the firm's site, and the extent to which consumers rely on promotional offerings. In this section, we explore how TV advertising shifts users’ browsing and purchases across channels, devices, and promotion usage. For the sake of brevity, we focus on the panel with 30-minute intervals. To ensure consistency across all different sets of results, we conduct the SDID analyses using the same set of unit and time weights, which is based on the estimation of the full sample. 20
Effects of TV Advertising on Channel Choice
As consumers increasingly use a variety of different channels to arrive at a company's offering, a key question for managers is whether marketing actions shift channel usage. If TV advertising prompts consumers to come to the company's website and make purchases mostly via owned channels (e.g., by directly entering the URL or by using a mobile app), rather than using paid channels (e.g., travel aggregators or paid search), this may reduce costs associated with customer acquisition. If, however, TV advertising leads consumers to focus more on paid channels, this may increase the costs of acquiring consumers. Several unique features of our data, including detailed information on originating channels, information on both browsing and purchase, and the exogenous variation in TV ad treatment from the field test, enable us to shed light on the effects of TV advertising on channel choice.
As discussed in the “Data” section, the focal company records channels by which consumers arrive to view the company's digital offering. These include travel aggregators (e.g., TripAdvisor and Trivago), directly loading the website by typing in the URL, paid search, app visits, organic search, email, affiliate marketing, display ads, and social media, listed in descending order of the proportion of sessions coming from each channel to the company. We classify travel aggregators, paid search, affiliate marketing, and display ads as paid channels, which account for 56.6% of the total traffic and sales at the website. The remaining channels, accounting for 43.4% of the traffic and sales, are classified as owned channels. We aggregate the sessions and sales in a county at 30-minute time intervals to create one panel for paid channels and one panel for owned channels. We then conduct SDID analyses on the immediate, lagged and intertemporal substitution effects (Equation 6) and the average effects (Equation 2) for each of the two panels.
Table 8 shows the results for two sets of regressions on paid channels and owned channels. The top part summarizes the immediate and intertemporal substitution effects, and the bottom part displays the average effect over the entire campaign period. Both sets of regressions include date, hour-of-day, and county fixed effects. The results are presented in a parsimonious way to save space.
Effects of TV Advertising on Channel Choice.

*p < .10. **p < .05. ***p < .01.
Notes: Standard errors are clustered at the county level. Both the top regression and the bottom regression control for date fixed effects, hour-of-day fixed effects, and county fixed effects.
The top part of the table confirms positive immediate effects and negative intertemporal substitution effects on both sessions and sales for paid channels and owned channels. Comparing the results from paid channels to those from owned channels, we find that the immediate positive effects on sessions are more pronounced for paid channels (in both instances, the difference in coefficients is significant with p < .1) and the negative intertemporal substitution effects on both sessions and sales are more pronounced for owned channels (in both instances, the difference in coefficients is significant with p < .1). Together, these patterns suggest that immediately after viewing a TV ad, consumers are relatively more likely to use paid channels than owned channels and that these increases are more likely to substitute for a future owned-channel visit rather than that of a paid channel. This aggregate behavioral change could come from two different sources. First, the effects of TV ads across various channels may be different for a given consumer. Second, there could be a selection effect whereby consumers from different channels react differently to a TV ad.
The bottom part of the table focuses on the average effects of TV advertising on paid and owned channels over the entire campaign period. TV advertising significantly increases sessions and sales from paid channels, but has no significant impact on owned channels. This is consistent with the pattern we see in the top part of the table: part of the sessions and part of the sales that would in the absence of TV advertising happen in owned channels appear to shift to paid channels as a result of TV advertising. For completeness, we report the detailed results across individual channels for sessions in Web Appendix Table W6 and for sales in Web Appendix Table W7.
We suggest two reasons why TV advertising may shift consumers from less expensive owned channels to more expensive paid channels. First, TV advertising may prompt consumers to initiate a search in the category (e.g., “hotel in Madrid”) and explore sites of aggregators, even if their preferences then direct them to the focal firm's web page. Second, paid search advertising may be seen as a simpler navigational tool relative to visiting the website through owned channels (Blake, Nosko, and Tadelis 2015a; Liu and Hill 2021). Both rationales are consistent with findings by Joo et al. (2014), who demonstrate that TV advertising increases both searches in the product category and consumers’ tendency to use branded keywords. This result emphasizes that advertisers may wish to coordinate their marketing activities, and specifically their budgets, across TV and digital advertising channels, such as travel aggregators and paid search. For example, it may be useful to ensure that daily budgets for digital advertising through paid channels vary with the amount of TV advertising across days.
Furthermore, this result demonstrates the benefit of separately identifying the immediate effects, lagged effects, and intertemporal substitution effects. A narrow focus on only the immediate effect would not have revealed the differences between paid channels and owned channels (the estimates on immediate effects are similar across the two), because the analysis of the intertemporal substitution effect is missing. A narrow focus on only the average effects could have led a firm to mistakenly conclude that TV advertising reduced sessions and sales coming from owned channels, despite its significantly positive immediate impact. Thus, our proposed approach, accounting for the immediate, lagged, and intertemporal substitution effects, is useful to provide companies a comprehensive picture of the effectiveness of TV advertising.
Effects of TV Advertising on Device Choice
If TV advertising shifts the time when users access the firm's website or app, then TV advertising may likewise shift the type of device consumers use to access the firm's offering. For a firm, understanding the implications of TV advertising on device usage is important when attempting to coordinate TV advertising with online marketing activities. In online advertising, device is a key parameter; both Meta and Google allow for targeting by device and provide cross-device reports so that firms can allocate their budgets to account for possible shifts through advertising. Further, the variation in accessibility and screen size across device types means that consumers’ browsing and purchasing behaviors may change depending on what device they use (Ghose, Goldfarb, and Han 2013; Xu et al. 2017). We explore the effect of TV advertising across devices in this section.
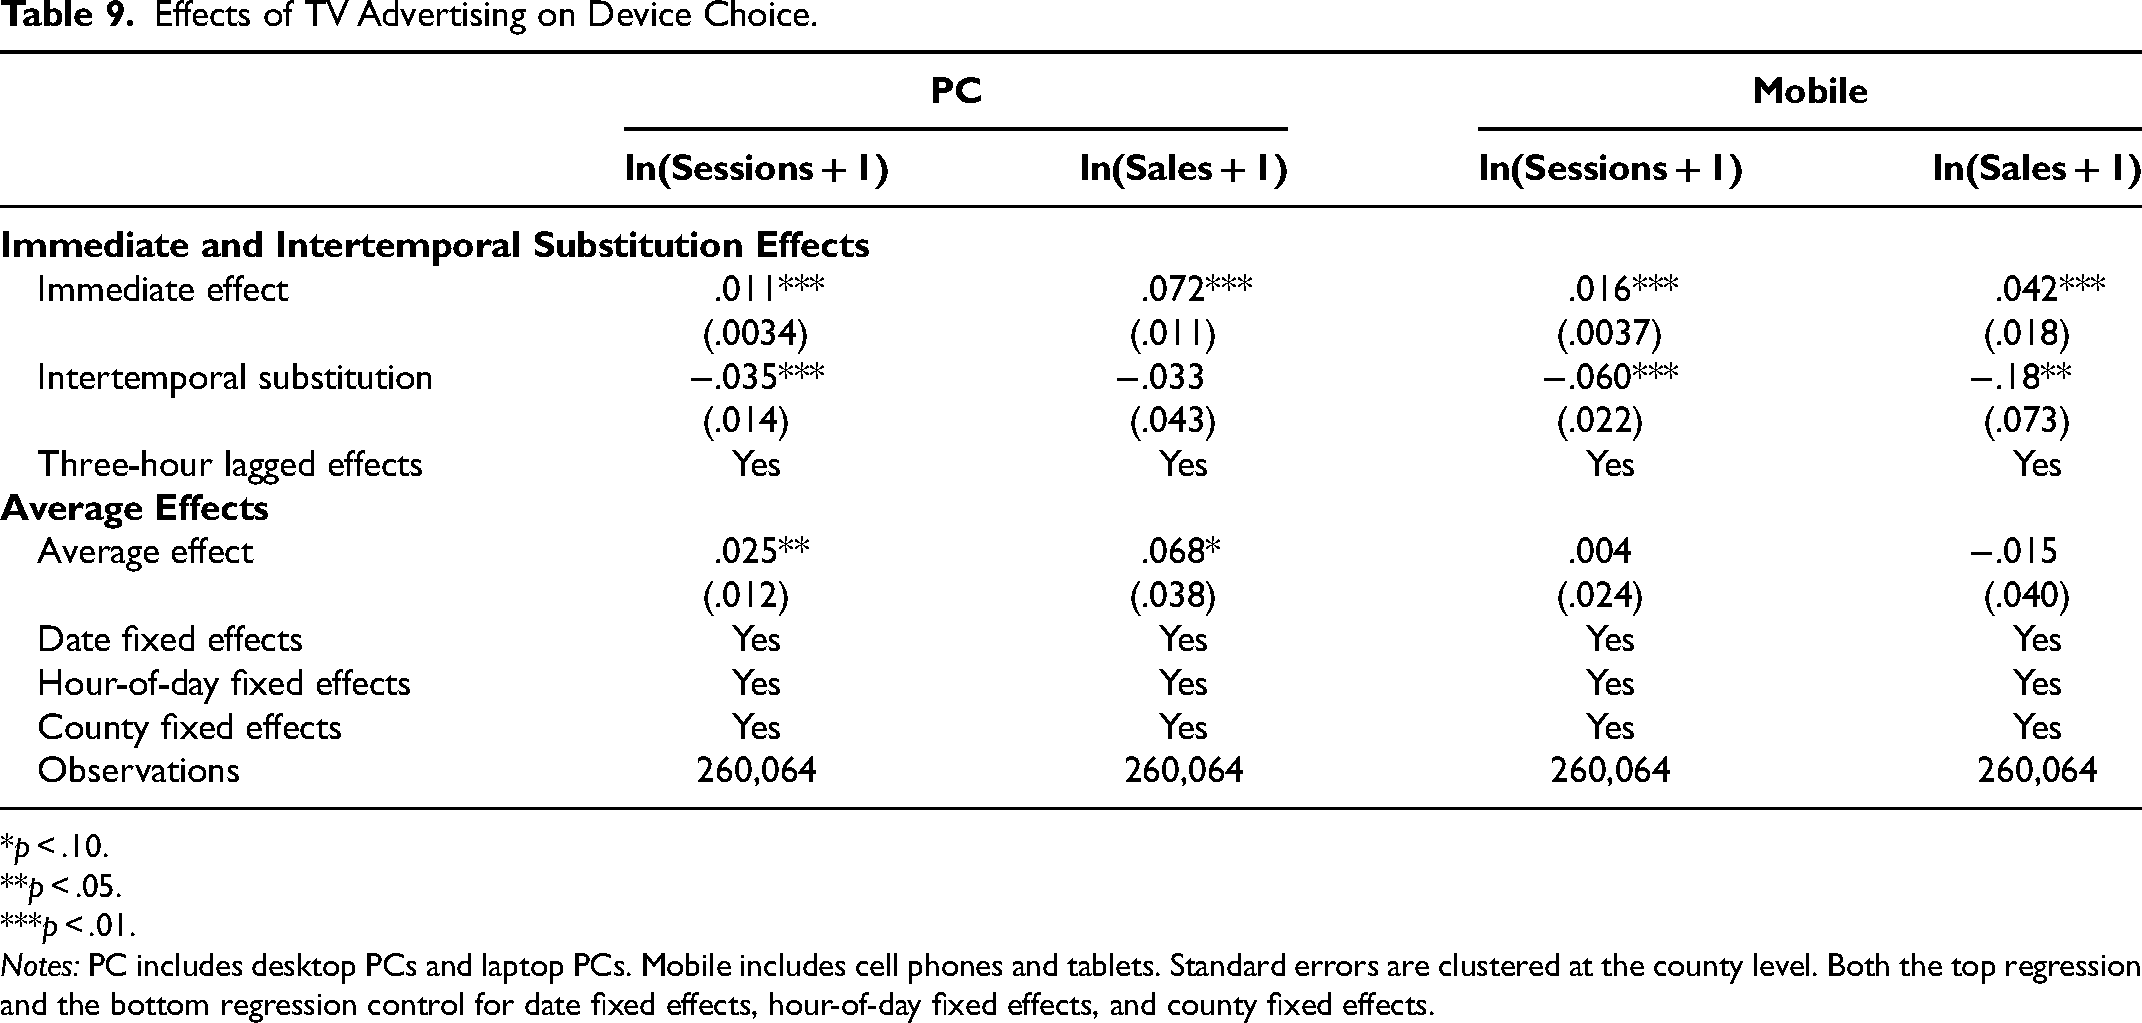
We have two types of devices: PCs (including desktops and laptops), accounting for 48.5% of traffic and 66.4% of sales, and mobile devices (including cell phones and tablets), accounting for the remaining 51.5% of traffic and 33.6% of sales. Mirroring the approach in the analysis of the channel choice, we again create a panel for each device type; use the SDID approach to first estimate the immediate, lagged, and intertemporal substitution effects; and then estimate the average effects of TV advertising over the entire campaign period. Table 9 summarizes the results. From the top panel, we see that following a TV ad, website traffic and sales both increase immediately across PCs and mobile devices. The negative intertemporal substitution effects are much stronger on sessions and sales from mobile devices compared with PCs (p < .1). This suggests that TV advertising is effective in prompting immediate second-screen browsing behavior on both PCs and mobile devices, potentially by moving forward in time online activities that consumers would otherwise carry out later, mostly on mobile devices.
Effects of TV Advertising on Device Choice.
*p < .10. **p < .05. ***p < .01.
Notes: PC includes desktop PCs and laptop PCs. Mobile includes cell phones and tablets. Standard errors are clustered at the county level. Both the top regression and the bottom regression control for date fixed effects, hour-of-day fixed effects, and county fixed effects.
The bottom part of the table demonstrates that over the entire campaign period, TV advertising significantly increases sessions on PCs but not on mobile devices. The increased sessions further lead to an increase in sales from PCs. The positive impact of TV advertising on sales from PCs but not mobile devices is likely driven by the greater ease of navigating on a PC and the resulting lower search cost (Ghose, Goldfarb, and Han 2013) as well as generally higher conversion rates among PC sessions (Web Appendix Figure W3). This analysis on device choice suggests that advertisers may benefit from directing particular attention to sessions from PCs when coordinating TV advertising and online marketing activities, because the conversion rate is higher on PCs, where consumers generally tend to buy more complex goods like hotel stays.
Effects of TV Advertising on Promotion Usage
To fully understand the effect of TV advertising on profitability and to better coordinate TV advertising and digital marketing activities, firms should likewise explore the impact of TV advertising on promotion usage. If TV advertising shifts the degree to which consumers use promotions, this could increase or decrease overall profitability. With knowledge of the effects of TV advertising, firms may wish to consider whether to adjust promotional offerings. One unique feature in our data is that we can identify based on the URL of each web page whether in a session consumers visited a price-promotion-focused web page. In 6.8% of all sessions, we find that consumers visited at least one web page focused on price promotions. The transactions made by consumers in those sessions amounted to a higher percentage—16.8%—of total sales. Recall that, as noted previously, the advertising campaign focused on promoting its brand. It did not communicate prices, relative prices, price levels (e.g., “cheap holidays”), or specific price promotions.
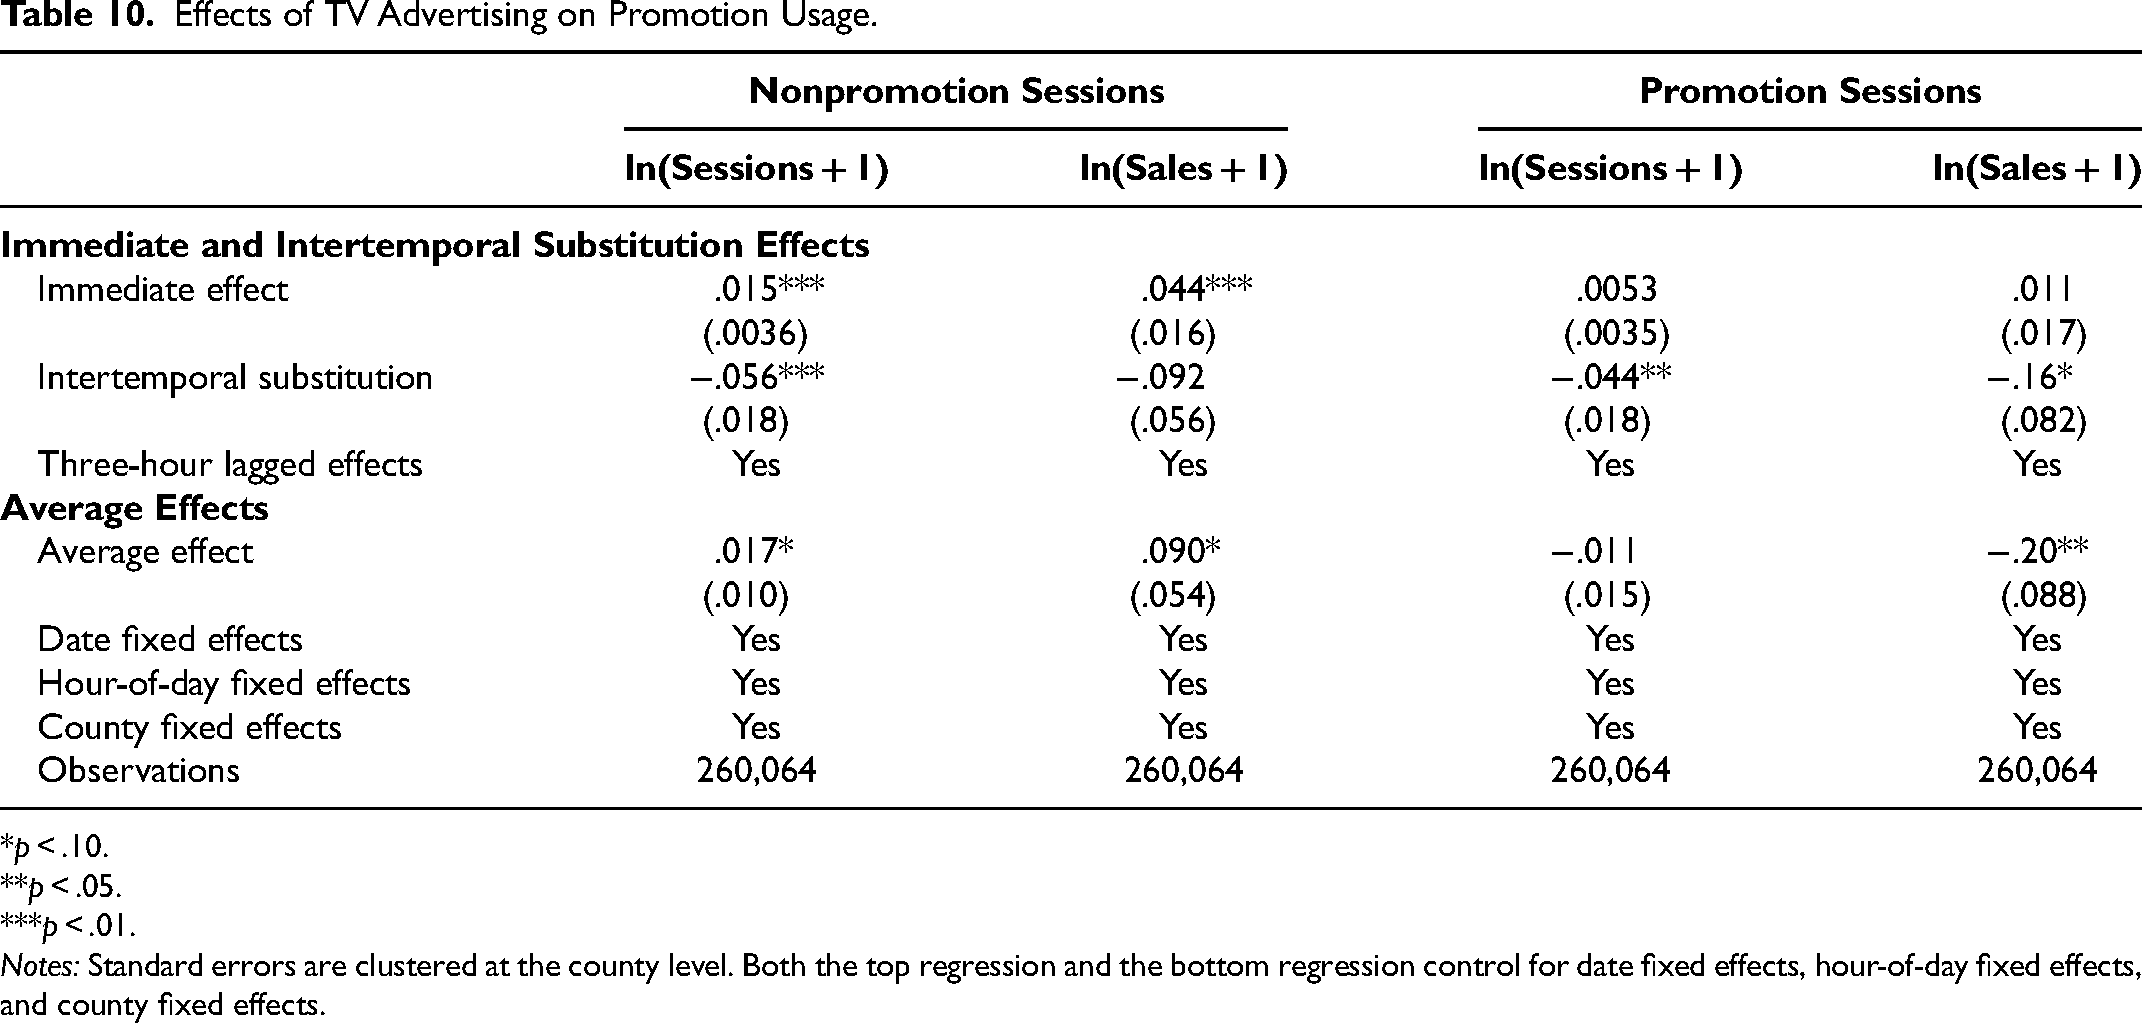
To explore how TV advertising affects consumers’ likelihood to explore promotion-focused web pages, we separate sessions into those during which a consumer visited a price-promotion-focused web page (promotion sessions) and those in which this was not the case (nonpromotion sessions). We create a panel for nonpromotion sessions and a panel for promotion sessions respectively and conduct the SDID estimation accordingly. Table 10 presents the SDID results of the effect of TV advertising on sessions and sales in the nonpromotion panel on the left and the promotion panel on the right, with the top part presenting the immediate and intertemporal substitution effects and the bottom part presenting the average effects over the entire campaign.
Effects of TV Advertising on Promotion Usage.
*p < .10. **p < .05. ***p < .01.
Notes: Standard errors are clustered at the county level. Both the top regression and the bottom regression control for date fixed effects, hour-of-day fixed effects, and county fixed effects.
Focusing on the top part, we find that TV advertising has a much stronger immediate positive impact on sessions and sales from nonpromotion sessions compared with promotion sessions. Two potential mechanisms can lead to this pattern. First, TV advertising may cause a selection effect in that TV ads may have a bigger impact on consumers who are less likely to seek price promotions, moving their browsing and purchases forward in time. Second, TV advertising may change behavior in that when browsing the firm's offering immediately after seeing the TV ad, consumers may be less likely to seek price promotions.
The negative intertemporal substitution effects suggest both mechanisms may be at play. The negative estimate of the intertemporal substitution effect for nonpromotion sessions suggests that some consumers not seeking price promotions shift their browsing and purchases forward in time in response to TV advertising. At the same time, the negative intertemporal substitution effect and the null immediate effect for promotion sessions suggest that some consumers who would otherwise have looked at promotional content may shift their browsing and purchases forward in time in response to TV advertising, but no longer visit promotional content. The latter mechanism is consistent with prior insights that an increase in nonprice advertising can lead to lower price sensitivity among consumers (Kaul and Wittink 1995).
The average effects in the bottom panel demonstrate an increase in sessions and sales when nonpromotion pages are visited and a decrease in sales when promotion pages are visited. This further confirms that TV advertising may shift some consumers away from visiting price-promotion-focused web pages at a later time to instead focus on the broader product offerings immediately. These findings indicate that advertisers could potentially benefit from using fewer price promotions immediately following a TV ad or targeted TV ads.
Effects of TV Advertising on Number and Value of Transactions
The previous analyses suggest that TV advertising has heterogeneous effects across channels, devices, and promotion usage. In this subsection, we explore the extent to which the changes in total sales are a result of a change in the number of transactions and the value per transaction.
In Table 11, we first mirror in Column 1 the original results on sales presented in Column 3 of Table 5. We then decompose the results on sales into the number of transactions in Column 2 and into the average transaction value in Column 3. Similar to before, the top part of the table reports the immediate and intertemporal substitution effects, and the bottom part reports the average effect of the TV advertising campaign. Intuitively, the sum of the elasticities on the number of transactions and the average transaction value equals the elasticity on sales; that is, the sum of the coefficients in Columns 2 and 3 roughly equals that in Column 1 (slight differences are due to the column-specific SDID weights). We find that both the number of transactions and the average value per transaction increase immediately following a TV ad, but both of them are lower in periods when there is no ad in the treated group. The immediate positive response in both the number of transactions and the value per transaction once again highlights the importance of real-time coordination between the company's TV advertising and online marketing activities. We further analyze the effects of TV advertising on the number and value of transactions for nonpromotion sessions and promotion sessions respectively (see Web Appendix Tables W10 and W11). We find that the negative intertemporal substitution of the number of transactions is caused by a decrease from both nonpromotion sessions and promotion sessions. The negative intertemporal substitution of the average transaction value is mainly caused by a decrease from promotion sessions.
Effects of TV Advertising on Number and Value of Transactions.

*p < .10. **p < .05. ***p < .01.
Notes: Standard errors are clustered at the county level. Both the top regression and the bottom regression control for date fixed effects, hour-of-day fixed effects, and county fixed effects.
Conclusion
With the emergence of new technology and moment marketing campaigns, companies increasingly wish to integrate their offline and online marketing activities in real time. This real-time coordination requires the ability to measure the immediate impact of TV advertising on consumers’ online activities, spurring data analytics companies to use narrow attribution windows for sharp identification. However, narrow attribution windows may miss longer-lasting effects or potential intertemporal substitution effects, resulting in a misleading estimate of TV ad effectiveness. Furthermore, the use of tight attribution windows may obfuscate the heterogeneous impact of TV advertising across channels, devices, and promotions.
This study sets out to investigate the importance of the attribution window length in measuring the TV ad effectiveness of online sessions and sales and explore how this effectiveness varies across channels, devices, and promotions. We utilize rare, rich data from a field test in which an online travel platform focused on selling hotel stays ran TV advertising in one area of the country while shutting off TV advertising for the remainder of the country. The exogenous variation in the exposure to TV advertising means that in our analysis, consumer activity in the untreated regions can serve as a control group for browsing behavior on the company's website as well as for its online sales. We propose a model to measure the immediate, lagged, and intertemporal substitution effects and estimate the model with the SDID approach.
We find that both online browsing and sales increase immediately after a TV ad being aired. However, TV ads also appear to reduce online browsing and sales at times when no TV ad is aired in the treated region during the treatment period. We interpret this pattern as intertemporal substitution (i.e., purchase acceleration): in response to TV advertising, consumers appear to shift forward in time online activities that they would otherwise do at later points in time.
We document that these effects of TV advertising are heterogeneous across channels, devices, and promotions. Our analysis demonstrates that TV advertising can have a bigger immediate positive impact and a smaller negative intertemporal substitution effect on paid channels compared with owned channels. This implies that TV advertising may change cost structures for advertisers as consumers become more likely to use higher-cost acquisition channels that firms need to compensate for providing traffic, but less likely to use lower-cost acquisition channels that firms own. Further, we find that over the entire campaign period, TV advertising significantly increases sessions and sales on PCs, but not on mobile devices, suggesting that advertisers may benefit from directing particular attention to sessions from PCs when integrating TV advertising and online marketing activities. Finally, we find TV ads induce more nonpromotion sessions, in which consumers do not visit price-promotion-focused web pages, than promotion sessions. This is likely caused by TV ads leading consumers not seeking price promotions to bring forward their browsing and purchases in time and making consumers less price sensitive right after viewing an ad. These findings highlight the importance of the interaction between TV advertising and users’ online promotion usage.
Our insights matter for managers who wish to measure the effectiveness of their TV advertising on online activities and better coordinate TV advertising and online marketing campaigns in real time. Our results document that while narrow attribution windows can provide sharp identification of immediate effects, such tools may impose costs in terms of ignoring broader shifts in user behavior, such as the type of intertemporal substitution we document. This leads to overestimation of the effectiveness of TV advertising. Thus, our proposed approach may become useful as the increasing popularity of targeted TV advertising and digitalization of TV analytics will enable more companies to conduct field tests linking TV advertising and online activities. Furthermore, our findings suggest that advertisers could benefit from the intertemporal substitution effect of TV advertising on online sessions and sales, as it has the potential to expedite online purchases.
More broadly, our findings across channels, devices, and price promotions suggest that TV advertising shifts consumer behavior beyond merely changing when and whether they purchase; it also affects how they purchase (i.e., through which channel, via what device, and whether they use price promotions). Such subtle heterogeneous effects highlight the potential gain for advertisers from looking beyond a single channel, a single device, or a fixed level of promotion to better coordinate TV advertising and online marketing activities in real time.
There are, of course, limitations to our results. First, our data stem from the travel sector, where online sales play a significant role, but where purchases are relatively large and infrequent, and consumers tend to go through a longer decision process. It is possible that the importance of intertemporal substitution varies across product categories. Further, it is possible that in categories in which products have lower value and consumers are more likely to engage in impulsive purchases, TV advertising may lead to not only intertemporal substitution but also market expansion. Second, our analysis focuses on the effect of an advertising campaign within a 15-day window. This means that our results extend significantly beyond a short time window that focuses on a by-minute or by-hour effect. However, we are unable to derive insights on the extent to which TV advertising might contribute to long-term brand building. Third, we are unable to track individual consumers across multiple channels and devices or monitor their individual-level TV ad exposure. As a result, we quantify the average intertemporal substitution effect but cannot disentangle the extent to which this is a result of consumers moving their individual-level activities forward in time or a heterogeneous response across consumers. Future research could explore in more depth the precise intertemporal substitution path. Notwithstanding these limitations, we believe our research is a useful step toward understanding the interplay between TV advertising and online activities.
Supplemental Material
sj-pdf-1-mrj-10.1177_00222437231180171 - Supplemental material for TV Advertising and Online Sales: A Case Study of Intertemporal Substitution Effects for an Online Travel Platform
Supplemental material, sj-pdf-1-mrj-10.1177_00222437231180171 for TV Advertising and Online Sales: A Case Study of Intertemporal Substitution Effects for an Online Travel Platform by Anja Lambrecht, Catherine Tucker and Xu Zhang in Journal of Marketing Research
Footnotes
Acknowledgments
The authors thank Alex Marthews, Iris Steenkamp, and Lisha Yuan for excellent research assistance. They also thank seminar and conference participants at Columbia University, Duke University, George Tech University, HEC Paris, London Business School, the Ohio State University, the University of Essex, the University of Maryland, the European Quant Marketing Seminar, the Virtual Quantitative Marketing Seminar, the 15th Annual Bass FORMS Conference, the 42nd ISMS Marketing Science Conference, the Interactive Marketing Research Conference, the 13th Workshop on the Economics of Advertising and Marketing, and the 2022 Quantitative Marketing and Economics Conference, as well as an anonymous company, for invaluable help. Any mistakes are the authors’ alone.
Coeditor
Peter Danaher
Associate Editor
Randolph Bucklin
Declaration of Conflicting Interests
The author(s) declared no potential conflicts of interest with respect to the research, authorship, and/or publication of this article.
Funding
The author(s) received no financial support for the research, authorship, and/or publication of this article.
Notes
References
Supplementary Material
Please find the following supplemental material available below.
For Open Access articles published under a Creative Commons License, all supplemental material carries the same license as the article it is associated with.
For non-Open Access articles published, all supplemental material carries a non-exclusive license, and permission requests for re-use of supplemental material or any part of supplemental material shall be sent directly to the copyright owner as specified in the copyright notice associated with the article.