
Abstract
Trajectories of attention capture the accumulation of brand utility during complex decision-making tasks. Thus, attention trajectories, as reflected in eye movements, predict the final brand choice of 85% of consumers before they implement it. Even when observing eye movements in only the first quarter of the decision process, attention already predicts brand choice much better (45%) than chance levels (20%). This superior prediction performance is due to a “double attention lift” for the chosen brand: The chosen brand receives progressively more attention toward the moment of choice, and more of this attention is devoted to integrating information about the brand rather than to comparing it with other options. In contrast, the currently owned brand grabs attention early in the task, and its attention gain persists for brand-loyal consumers and shifts for brand-switching consumers. A new attention and choice model used in tandem with the Bayesian K-fold cross-validation methodology on eye-tracking data from 325 representative consumers uncovered these attention trajectory effects. The findings contribute to closing important knowledge gaps in the attention and choice literature and have implications for marketing research and managerial practice.
Keywords
Consumers often make complex choices in information-rich environments, such as when choosing between different housing options, holiday destinations, household appliances, or smartphones. Even when all information is simultaneously available at a single location, such as a comparison website, consumers’ limited attentional capacity prevents them from carefully devoting full attention to each of the choice options (Lohse and Johnson 1996; Shi, Wedel, and Pieters 2013; Willemsen, Böckenholt, and Johnson 2011). Early on, Simon (1971, pp. 40–41) pointed out that “the wealth of information means a dearth of something else: a scarcity of whatever it is that information consumes. What information consumes is rather obvious: it consumes the attention of its recipients. Hence a wealth of information creates a poverty of attention and a need to allocate that attention efficiently among the overabundance of information sources that might consume it.” Our research builds on this insight by examining attention trajectories during a complex decision-making task and investigating how these capture the accumulation of utility for each of the brands and predict final brand choice.
Faced with the challenge of abundant information but limited attention and working memory capacity, consumers selectively process information that seems useful and suppress or pay less attention to information that seems less worth the effort (Bettman, Luce, and Payne 1998; Gabaix 2019; Russo and Leclerc 1994). This produces the observed positive association between the attention that consumers devote to options in a choice set and the choice likelihood of these options (Atalay, Bodur, and Rasolofoarison 2012; Chandon et al. 2009; Pieters and Warlop 1999). There is also mounting evidence that eye movements reflect key cognitive processes that consumers engage in during decision-making tasks (Al-Moteri et al. 2017; Arieli, Ben-Ami, and Rubinstein 2011; Russo and Dosher 1983; Russo and Leclerc 1994; Russo and Rosen 1975; Wedel, Pieters, and Van der Lans 2022; Willemsen, Böckenholt, and Johnson 2011). Industry increasingly recognizes the potential insights from eye-movement research for consumer processes. As one industry expert 1 stated about eye tracking (ET): “If you don’t care about the process, then you don’t need ET. But if you want to understand the process, then ET is needed. Eye tracking is useful and needed when you are trying to understand the process by which someone arrives at their choice.” Manufacturers’ acquisition of eye-tracking hardware and software, such as SensoMotoric Instruments by Apple, EyeTribe by Facebook, and Eyefluence by Alphabet, and the growing applications of eye tracking in marketing research, illustrate this sentiment (Web Appendix A).
Contribution
Despite fundamental knowledge from prior research starting in the 1970s, as well as recent industry developments, the potential of eye movements as gateways into fundamental utility accumulation and choice processes of consumers has been tapped only partially (Wedel, Pieters, and Van der Lans 2022). That is, it is still largely unknown how eye movements and utility accumulation for brands are aligned, and how well eye movements predict final choice, especially preference-based, complex choice. Our research contributes to closing four important knowledge gaps that concern (1) the distinct effects of attention quantity and types of attention; (2) their trajectories over time for each brand in the choice set; (3) the effect of brand ownership on these attention trajectories and brand choice; and (4) the out-of-sample and ahead-of-period predictive performance of attention trajectories for brand choice. Importantly, we examine these knowledge gaps jointly rather than in isolation to improve on prior work that documents piecemeal effects of some contextual and personal factors on eye-movement patterns and overall processing strategies (Lohse and Johnson 1996; Russo and Rosen 1975; Shi, Wedel, and Pieters 2013; details in Web Appendix B).
We critically review the extant attention and choice literature and report on an eye-tracking experiment with a representative sample of 325 U.S. consumers who chose a smartphone from a set of five brands on a comparison website. We propose a new attention and choice model that describes the relationship between consumers’ eye movements during the choice task, the trajectories of attention to each of the brands over time, the accumulation of utility, and the final brand choice. We implement the Bayesian K-fold cross-validation methodology in a novel way, to make ahead-of-period brand choice predictions for out-of-sample participants, based on their attention trajectories during the task. Our cross-validation methodology may be more broadly valuable in marketing research. We use the predictive performance of eye movements for brand choice to test competing theories (Busemeyer and Wang 2000; Hastie, Tibshirani, and Friedman 2009; Hofman et al. 2021; Yarkoni and Westfall 2017). Our research makes a step toward understanding the fundamental and possibly neurological links between attention trajectories and utility accumulation during complex decision making (Gabaix 2019; Wedel, Pieters, and Van der Lans 2022). It is also a step toward the more realistic, descriptive consumer choice theories that have been called for (Janiszewski and Van Osselaer 2021; Mormann et al. 2020; Willemsen, Böckenholt, and Johnson 2011).
We uncover a surprisingly early and so far undocumented “double attention lift” toward the ultimately chosen brand. That is, both attention quantity (reflected in eye fixations) and integration attention (reflected in within-brand eye saccades) for the ultimately chosen brand rise early and then sharply during the decision-making task. Attention throughout the task predicts brand choice for 85% of consumers, which is more than four times better than chance levels (20%). Furthermore, trajectories of attention in the first three quarters of the decision process (i.e., on average, 29 seconds before consumers click “buy”) already predict brand choice for 52% of consumers. Moreover, for 92% of consumers who choose a device of the brand they currently own (“loyals”), attention after the first quarter of the decision-making task already predicts their choice. These findings are the first to reveal the tight connection among eye movements, attention, and the accumulation of brand utility throughout complex decision making.
We refrain from making causal claims about the close documented link between attention trajectories and brand utility accumulation. Instead, we emphasize the capacity of attention trajectories to predict choice for different consumer segments and its theoretical and managerial implications. As in prior research on choice of complex or high-involvement products (Meißner, Musalem, and Huber 2016; Shi, Wedel, and Pieters 2013; Yang, Toubia, and De Jong 2015), our research zooms in on the final choice stage, without directly observing the information that consumers previously acquired. However, and extending prior research, our model accounts for the accumulated prior experiences of consumers through brand ownership and product and brand knowledge effects on attention and choice.
The next section presents the literature review, the four knowledge gaps that we address, and our predictions. Subsequent sections describe our data, model, and results. The final section offers implications for consumer choice theory and marketing practice.
Literature Review and Knowledge Gaps
Eye Movements During Decision Making
Our context is decision-making tasks in which consumers visually inspect a display with choice options (brands) and attributes, such as on comparison or shopping websites, and in which they express their final choice by clicking on it, by a keystroke, or otherwise. During the task, consumers move their eyes to inspect brands and their attributes. These eye movements comprise fixations and saccades. During a fixation, the eye is relatively still (for about 200–400 ms), and the gaze is directed to a specific location in the display to acquire information from it. Because visual acuity rapidly drops off with increasing distance from the center of the gaze, people need to move their eyes to acquire information from different locations in the display. During such eye saccades, the gaze is rapidly redirected (20–50 ms), while vision is actively suppressed to prevent blurring (Hutton 2008).
Consumers’ eye movements during decision-making tasks are overt, observable measures of their covert, unobservable attention processes during these tasks (Glaholt and Reingold 2011; Orquin and Loose 2013). Therefore, eye movements indicate, with some measurement error (Hutton 2008; Reichle and Drieghe 2015), how much and which type of attention consumers devote to a specific location or larger area of interest in a visual display, such as a brand (Russo and Dosher 1983; Russo and Rosen 1975).
Eye-movement recording in marketing research is commonly done with infrared eye trackers that unobtrusively record the point of regard with a temporal resolution of 50–60 Hz and spatial resolution of at least .5 degrees of visual angle, and that leave participants free to move their heads (Wedel, Pieters, and Van der Lans 2022). Specialized algorithms determine the location and sequence of fixations and saccades from the (x, y) coordinates of the point of regard. Such unobtrusive, detailed recording of eye movements improves over verbal protocol and information display board methodologies, which rely on memory and might evoke strategic responses (Chandon et al. 2009; Lohse and Johnson 1996).
We identified 19 publications with 21 separate studies in which choice or consideration of brands, products, or gambles was the outcome variable, and eye movements were explanatory variables. Table 1 summarizes these attention and choice studies. Web Appendix B has details about the search procedure, inclusion and exclusion criteria, and related work. Web Appendix B also reports on prior studies in marketing that use eye tracking, but not as independent variables to predict brand choice. Our literature analysis identifies four knowledge gaps that inspired the current research. These knowledge gaps concern the contribution of (1) quantity and types of attention, (2) trajectories of attention, and (3) brand ownership to (4) predicting brand choice. The next sections examine these.
Eye Tracking and Attention and Choice Studies.

Notes: Column F shows exposure duration in seconds (if reported). Column H indicates whether brand-specific sequences of eye movements were included in the choice analysis: “No (choice set)” for aggregate sequences at choice set level; “No (gaze likelihood)” for studies that report a gaze likelihood analysis. Column I indicates if brand ownership or past purchase were included in the choice analysis: “No (B)” indicates that options had known brand names, but ownership is not included in the model; “No (U)” indicates that options had unknown brand names; “No (NA)” indicates that brand names are not applicable to the domain; “No (NR)” indicates that the study used options that usually have brand names, but it does not report whether these are known or not. Column J indicates if some form of cross-validation established the model's predictive performance: “Task” when predicting choices for the same participants that the model was calibrated on; “Sample” when predicting some participants from others for the same choices. Details of the literature search are in Web Appendix B.
Gap 1: Quantity and Types of Attention
The first knowledge gap concerns the contribution that eye saccades and attention types make to utility accumulation and brand choice. Note that eye-fixation frequency reflects the quantity of attention (Orquin and Loose 2013; Theeuwes and Belopolsky 2012), which is correlated with brand choice (Atalay, Bodur, and Rasolofoarison 2012; Chandon et al. 2007, 2009; Pieters and Warlop 1999). Importantly, eye saccades contain unique information about the types of attention that consumers deploy during decision making (Lohse and Johnson 1996; Russo and Dosher 1983; Russo and Rosen 1975; Shi, Wedel, and Pieters 2013), over and above the information contained in eye fixations. Surprisingly, the literature to date has rarely addressed the question of whether and how attention types contribute to utility accumulation and choice over and above attention quantity. Of the 21 attention and choice studies (Table 1, Column G, and Web Appendix B), 20 studies examined the association between eye fixations and choice. Yet only four studies reported on fixations and saccades, and only one of these related fixations and one type of saccades with final choice (Brandstätter and Körner 2014).
Figure 1 shows a hypothetical pattern of eye movements of a person across a display with three brands (A to C) and two attributes (1 and 2). It illustrates the distinct information that eye saccades contain about attention and choice. Each of the three brands receives four eye fixations (dots 1 to 12), but with distinct patterns of saccades (arrows between dots). Saccades are labeled, respectively, within-brand, between-brand, and other, to reflect their brand focus. All four saccades that start in Brand A (where the decision to move the eyes is made; Hutton 2008; Yang, Toubia, and De Jong 2015) are between brands (here, A and B; fixations 1 to 2, 3 to 4, 5 to 6, and 7 to 8). In contrast, two of the four saccades that start in Brand B are between brands on the same attribute (fixations 2 to 3 and 6 to 7), and two are between brands on different attributes (“other saccades”; fixations 4 to 5 and 8 to 9). Moreover, all three saccades that start in Brand C are within-brand (fixations 9 to 10, 10 to 11, and 11 to 12; fixation 12 ends the task). So, the same number of eye fixations as indicators of the quantity of attention might come from different types of eye saccades.

Eye Movements During Brand Choice.
Eye fixations are measures of the quantity of attention, whereas eye saccades are measures of specific types of attention. A variety of labels are used in the literature to denote the attention reflected in within-brand and between-brand saccades: holistic and dimensional evaluation (Russo and Dosher 1983); holistic and component processing (Arieli, Ben-Ami, and Rubinstein 2011); product-based and attribute-based processing (Noguchi and Stewart 2014; Shi, Wedel, and Pieters 2013); foraging for value and foraging for information (Manohar and Husain 2013); value construction and value encoding (Willemsen, Böckenholt, and Johnson 2011); and overall evaluation and attribute comparison (Mantel and Kardes 1999). We refer to the two attention states as integration and comparison attention. Integration attention is reflected in within-brand saccades. Such saccades support the integration of different pieces of information about a single brand into an overall or holistic evaluation (Mantel and Kardes 1999; Noguchi and Stewart 2014; Russo and Dosher 1983; Willemsen, Böckenholt, and Johnson 2011). Comparison attention is reflected in between-brand saccades. Such saccades support comparison of attribute information across brands (Mantel and Kardes 1999; Russo and Dosher 1983; Russo and Leclerc 1994; Shi, Wedel, and Pieters 2013).
One study in our literature review examined the contribution of attention quantity and one of the three attention types (comparison) to choice. Brandstätter and Körner (2014) conducted a study with 11 repeated choices between two hypothetical gambles described on two attributes. They found that the difference between choice options in between-gamble saccades did correlate with choice but that the difference in fixations did not. Other studies have correlated eye saccades with choice without accounting for eye fixations, which may produce optimistic estimates of the association between saccades and choice. In one of these, Stewart, Hermens, and Matthews (2016) found that saccades both within and between two gambles were associated with choice. Likewise, Pieters and Warlop (1999) found that both between-brand and within-brand saccades correlated with choice of one out of six brands of shampoo. In contrast, Noguchi and Stewart (2014) found that only saccades between choice options correlated with choice.
Taken together, this literature provides suggestive evidence that types of attention and the associated eye movements during decision making might be associated with final choice. Yet the joint contribution of attention quantity and types to brand choice has not been addressed and remains an open question. Moreover, the relevant studies have highlighted fast repeated choices for comparatively simple products. This raises the question of whether and how eye movements are associated with more-deliberate choices of complex products and more-realistic choice situations (Willemsen, Böckenholt, and Johnson 2011). The present research examines this.
Gap 2: Attention Trajectories
A second knowledge gap concerns the contribution that trajectories of attention make to utility accumulation and brand choice. Attention and choice studies have focused predominantly on time-aggregated data (15 of 21 studies in Table 1, Column H), and no study has examined the association between attention trajectories for each brand and final choice. Studies relying on time-aggregated data assume that earlier and later eye movements carry the same weight in final brand choice. Note that if the aggregate sum of eye fixations contributes most, Brands A, B, and C in Figure 1 will each have the same choice likelihood: each receives four fixations. However, if earlier eye movements carry more weight, Brand A will be chosen, and if later eye movements carry more weight, Brand C will be chosen.
Three attention and choice studies single out the start and end (Atalay, Bodur, and Rasolofoarison 2012; Cohen, Kang, and Leise 2017) or the end point of the eye-movement sequence (Schotter et al. 2010). Consistent with the results of Shimojo et al. (2003), these studies show a correlation between choice of an option and final fixations on it just before choice (Atalay, Bodur, and Rasolofoarison 2012: final 5 seconds; Cohen, Kang, and Leise 2017: final 3 seconds; Schotter et al. 2010: final 1.6 seconds; Shimojo et al. 2003: final 1.67 seconds). 2
Three other studies trace sequences of eye movements during a decision task at the level of the choice set as a whole, but not for each of the brands in the choice set (Table 1, Column H). Those studies examine information-acquisition strategies (Shi, Wedel, and Pieters 2013) or search processes (Stüttgen, Boatwright, and Monroe 2012) at the choice-set level, or one-step-ahead utility maximization during choice (Yang, Toubia, and De Jong 2015).
In their study of choice among laptops on comparison websites, Shi, Wedel, and Pieters (2013) observe that participants switched frequently between attention strategies (on average, more than 40 times in 67 seconds). Importantly, in the final moments before choice, participants also expressed more within-brand saccades, indicative of integration attention, for the choice set as a whole. This prompts two questions: (1) is this attention lift present for all the brands in the set or only for some, and (2) when in the choice process does the attention lift surface? In a recent review, Mormann et al. (2020, p. 387) call for more research on the complete sequences of fixations and saccades during decision-making tasks to develop more-realistic models of choice. Our study follows up on this.
Gap 3: Brand Ownership Effects
A third knowledge gap concerns the influence of brand ownership on attention and choice. Attention and choice studies have employed mostly unbranded options, such as gambles or apartments (Brandstätter and Körner 2014; Cohen, Kang, and Leise 2017); have examined hypothetical or foreign brands (Atalay, Bodur, and Rasolofoarison 2012; Pieters and Warlop 1999); or have employed branded options without accounting for their ownership or purchase history in model estimation (Krajbich, Armel, and Rangel 2010; Reutskaja et al. 2011; Shi, Wedel, and Pieters 2013; Stüttgen, Boatwright, and Monroe 2012; in total, 20 of 21 studies in Table 1, Column I).
This important omission precludes insights into how brand ownership and similar top-down factors impact attention and choice. Consumers do not choose brands in a vacuum, and they may have previously purchased some of the brands in their current choice set. That may influence future brand choice (Dubé et al. 2008) and, potentially, attention trajectories to brands. Industry experts (Web Appendix A, question 3) have pointed out that managerial practice could benefit from insights into attention patterns and choices of current and new customers. As one of the interviewed experts (20 years of experience in client and market research) stated: “Clients would be interested to see the most common trajectories, grouped for example by loyalty status or customer segment.”
Chandon et al. (2009) examine purchase history effects in an eye-tracking study on choices of bar soap and pain relievers, with a sample of 344 consumers from across the United States. They report that consumers who previously bought a brand were more likely to fixate on it in a simulated store shelf and were more likely to consider and choose it, independent of attention. This reflects the common state-dependency effect in repeat purchase of simple packaged goods due to habit persistence or inertia (Dubé et al. 2008).
Our research builds on this by examining the influence of brand ownership on attention trajectories and on brand choice for a complex product. If initial attention were mostly exploratory (Russo and Leclerc 1994) or random (Krajbich, Armel, and Rangel 2010; Krajbich et al. 2012; Reutskaja et al. 2011) and independent of brand ownership, then all the brands in a choice set would receive similar amounts of attention early on. Moreover, if the results of Chandon et al. (2009) were to generalize, brand ownership would have direct effects on final brand choice, irrespective of its attention effects. There are reasons to make different predictions on both issues.
First, the history of experience with the owned brand, as compared with other brands, will create rich, value-laden memory representations. These are likely to be in working memory at the onset of the choice task, activating attention to the owned brand (Theeuwes and Belopolsky 2012), regardless of salience and current goals (Anderson 2016).
Second, the mere act of having previously selected an option may increase its choice likelihood in subsequent tasks, regardless of the option's attributes and perceptual fluency. Tavassoli (2008) proposes and Janiszewski, Kuo, and Tavassoli (2013) provide evidence from five studies that this “mere selection effect” is due to biased competition for attention. Such biased competition should amplify neural activation of the previously selected option and inhibit activation of neglected options. This increases the likelihood of perceptual pop-out of the selected object from a subsequent choice display. Van der Lans, Pieters, and Wedel (2021) find similar biased competition effects of advertising on the speed of completing target search tasks.
Third, the owned brand is the status quo or endowment option, which may increase the attention it receives and its choice likelihood. In line with this, query theory (Johnson, Häubl, and Keinan 2007) proposes that the endowment effect arises because sellers tend to start the task to keep or sell an object with a memory query for aspects that support the status quo. Such queries inhibit subsequent queries for evidence against the status quo. In line with this, Ashby et al. (2016) find that sellers (as compared with buyers) of lottery tickets focused attention preferentially and early on the benefits of the lottery tickets, and that such early attention influenced their later monetary valuations of the tickets.
From this analysis, we predict that (1) early during the decision-making task, consumers allocate more attention to the currently owned brand; and (2) brand ownership effects on final choice depend on attention trajectories rather than being independent of these.
Gap 4: Predicting Brand Choice
A fourth knowledge gap concerns how well attention predicts brand choice. The predictive performance of competing models provides empirical support for their competing theoretical assumptions and is of managerial relevance. As Mormann et al. (2020, p. 381) point out, “Ultimately, these enhanced models of choice should help us to more accurately predict choice,” a sentiment shared more widely (Busemeyer and Wang 2000; Hastie, Tibshirani, and Friedman 2009; Hofman et al. 2021; Janiszewski and Van Osselaer 2021; Yarkoni and Westfall 2017).
Remarkably, attention and choice studies have rarely put attention to the test of actually predicting final brand choice. Instead, they have relied on “in-sample” fit measures such as R-square and hit rates to assess model performance. Such in-sample measures tend to be overoptimistic because the same data are used to estimate (“fit”) a model and validate it (“predictive performance”). Such overoptimistic performance is unlikely to be replicable in other data sets, even if data collection procedures are identical. Cross-validation techniques, such as K-fold cross-validation, protect against overfitting by estimating and validating the model on different data sets (Hastie, Tibshirani, and Friedman 2009) but, so far, rarely have been used in marketing research (see Web Appendix C).
Of the 21 attention and choice studies in the literature overview, only one study reported on a classic two-group validation (Stüttgen, Boatwright, and Monroe 2012). Five studies used subsets of highly repeated tasks to predict choice in other subsets of the same tasks for the same participants (Table 1, Column J, and Web Appendix B, Table W1). This latter approach is still likely to produce overoptimistic predictive performance results (Hastie, Tibshirani, and Friedman 2009; Varoquaux et al. 2017; Vehtari, Gelman, and Gabry 2017). Thus, the question remains open: how well do attention trajectories predict brand choice?
We implement a Bayesian K-fold cross-validation, described in detail subsequently, that uses brand attention trajectories to make out-of-sample and ahead-of-time predictions of brand choice (Web Appendix C). Strong predictive model performance supports the close link between attention trajectories and utility accumulation for brands during complex decision making.
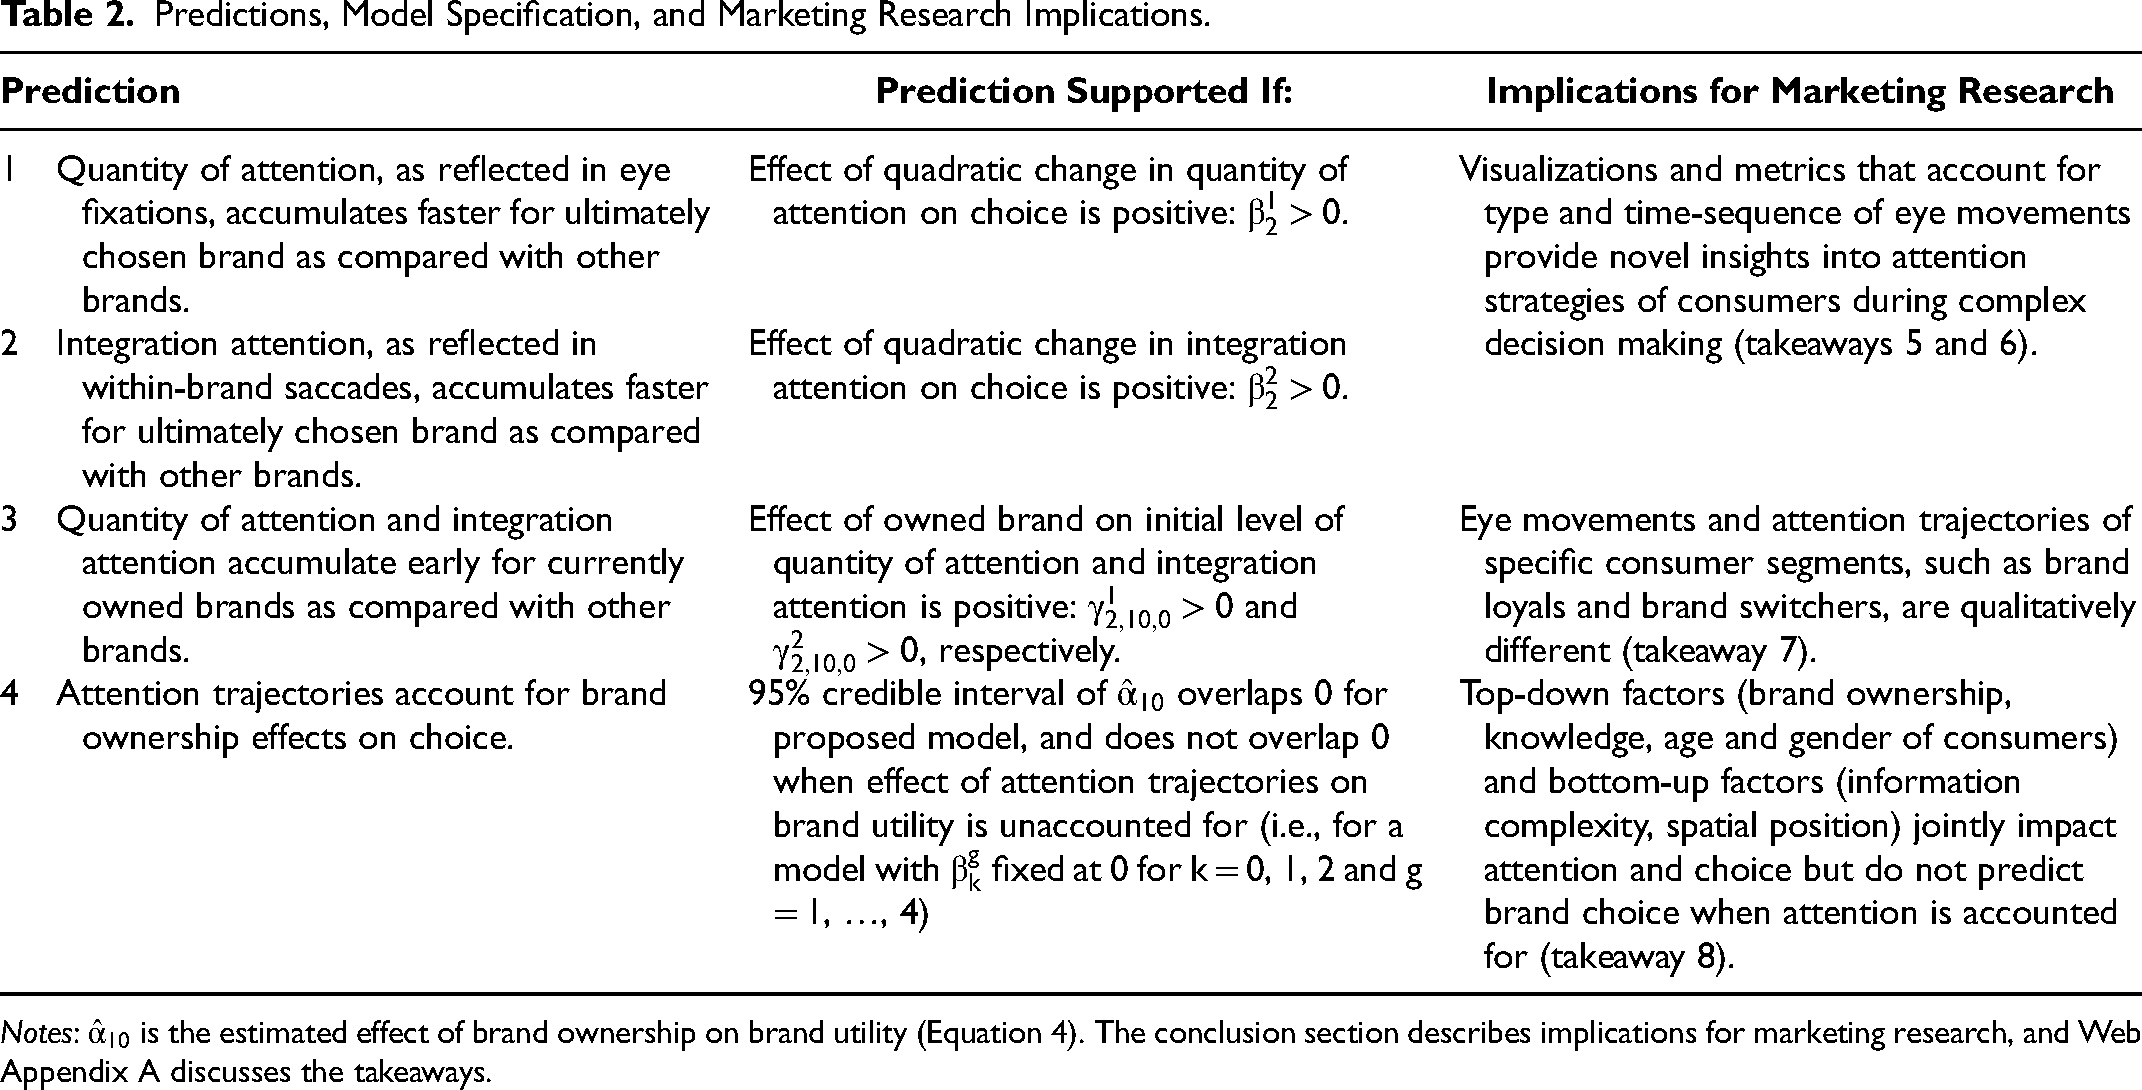
In summary, we predict a double attention lift toward the ultimately chosen brand during the decision-making task. Then, quantity of attention (Prediction 1), as reflected in eye fixations, and integration attention (Prediction 2), as reflected in within-brand saccades, accumulate faster for the ultimately chosen brand than for other brands. Furthermore, we predict that brand ownership influences attention early during the decision-making task. Then, quantity of attention and integration attention accumulate early for the currently owned versus other brands (Prediction 3). Joint support of these predictions would reveal qualitatively distinct attention trajectories for specific consumer segments. For brand-loyal consumers, who choose a new device of the brand they currently own, the owned brand would receive more attention from the start of the decision task and increasingly so over time. Instead, for brand-switching consumers, who choose a device of a different brand than they currently own, attention toward the ultimately chosen brand would initially be low because it is devoted to the currently owned and not the chosen brand, but it would increase closer to the end of the choice process. Thus, attention trajectories would fully account for brand ownership effects on choice (Prediction 4).
Data
We research an online product-comparison situation in which consumers evaluate a set of smartphones and choose one. To increase realism, the sample comprised regular consumers from three locations in the continental United States who made a single brand choice from a set of options that were available on the dominant websites at the time of data collection; these options were described as having multiple features, as is common when consumers make such complex choices. All sampled participants were in the market for a new smartphone and were instructed to review the presented information and choose the device that they would be most likely to purchase. The choice set included the five most common devices in online product reviews and the most recent versions of each brand at the time of data collection: Apple iPhone 5, Samsung Galaxy Note II, Nokia Lumia 920, HTC One, and Motorola Droid Razr Maxx HD. 3 Web Appendix D provides further details and three sensitivity analyses on our sampling and eye-movement measurement.
Recruitment of Participants
To account for differences in product and brand ownership and prior knowledge and experience, the sample included relatively equal groups from each of four consumer segments based on smartphone ownership: Apple iPhone owners, Samsung smartphone owners, owners of other smartphone brands, and non–smartphone owners. To ensure that participants closely matched prospective customers in this product category, participants were invited for the study if they indicated being in the market for a new device. Tobii Insight, a leading eye-tracking research firm, conducted sampling and data collection. It drew a stratified sample of 460 consumers who were in the market for a new smartphone from locally representative participant pools in three locations in the continental United States.
Study and Stimuli Design
Participants were randomly assigned to one of three information conditions, varying in the number of device features (18 in low, 29 in medium, and 39 in high), as one source of information complexity (Payne 1976; Swait and Adamowicz 2001). Column position of the brands in the display was randomly sampled from five different column-order sequences, for each information condition, and statistically controlled for in the model to account for potential spatial location effects of attention and choice (Atalay, Bodur, and Rasolofoarison 2012). Figures W4–W7 in Web Appendix D have sample stimuli. The low-information condition still has more elements than common in attention and choice studies (e.g., four brands and six features: Yang, Toubia, and De Jong [2015]; four brands and 12 features: Shi, Wedel, and Pieters [2013]; Web Appendix B, Table W1) and in fundamental decision-making research (e.g., three options with three features: Payne [1976]; four brands by three features: Swait and Adamowicz [2001]). Random assignment of participants to information conditions ensured heterogeneity in attention patterns due to a stimulus factor and enabled us to explore several ancillary questions. It is reasonable to expect longer self-controlled task durations under higher rather than lower information conditions (Lohse and Johnson 1996), as well as potentially stronger status quo effects (Dean, Kıbrıs, and Masatlioglu 2017; Swait and Adamowicz 2001). The design-based K-fold cross-validation (see the “Model” section and Web Appendix C) assesses the stability of predictive performance of attention trajectories for brand choice across information conditions. Stable performance would support the link between attention trajectories and utility accumulation.
Stimulus Presentation and Data Collection
Eye-movement recording was done for both eyes with Tobii 60XL infrared eye trackers integrated in the 24-inch monitors that displayed the stimuli. Sampling rate was 60 Hz, with a typical accuracy of .5 degrees of visual angle. Participants were free to move their head in a virtual box of 44 cm width × 22 cm height. After the choice task, participants completed questions on brand and product ownership, purchase intention, and demographics.
Processing Eye Movements
We took the following three steps to account for measurement error in eye-movement recording. First, we used the binocular individual threshold algorithm (Van der Lans, Wedel, and Pieters 2011) to process raw eye-movement recordings into fixations. The binocular individual threshold algorithm identifies (x, y) fixation locations from recordings of both eyes (binocular) and accounts for individual and stimulus differences in velocity thresholds. This method improves over earlier monocular approaches and firm-based algorithms. It has been used, for instance, during choice-based conjoint (Yang, Toubia, and De Jong 2015) and target search tasks (Van der Lans, Pieters, and Wedel 2021). Second, we aggregated eye movements into larger areas of interest than their exact (x, y) location, and we refer to these as, respectively, brand fixations, within-brand saccades, and between-brand saccades, as in Manohar and Husain (2013). Further, we divided the sequence of eye fixations until choice into four equal time bins (quarters) for each participant. Third, we decomposed overt eye movements into covert attention and measurement error (Shi, Wedel, and Pieters 2013); see the “Model” section.
Analysis Sample
Participants who completed the study were excluded from the analysis sample if technical complications occurred during tracking (n = 2); if they did not complete or if they provided inconsistent responses in a separate questionnaire (n = 28); if trackability was less than 60% (n = 91); and if they did not intend to purchase a new smartphone (n = 14). The final analysis sample comprised 325 participants. Results are similar when including the 14 participants with zero purchase likelihood (details in Web Appendix D, “Sensitivity Analysis 3” section). The analysis sample contained 26,000 eye-movement data points: 325 participants, five brands, four time periods, and four eye-movement measures.
Among the sample, 72% (233 of 325) owned a device of one of the brands in the choice set: Apple (93), Samsung (77), Nokia (2), HTC (39), and Motorola (22). The remaining 28% (others, n = 92) did not yet own a device in the category or owned a brand not in the choice display. Stratification ensured representation of four user groups in the sample: users of the two leaders in the category (29% Apple and 24% Samsung), owners of other brands (27%), and current non–device users (21%). On average, participants indicated a 74% likelihood of purchasing a new device in the category in the next nine months.
Model
We develop a new attention and choice model to help close the four knowledge gaps and test our predictions. It follows up on calls to “integrate models that simultaneously explain visual attention patterns and choice outcomes” (Van der Lans and Wedel 2017, p. 350). Our model extends quantitative models that fit prior preferences to later attention patterns and/or require repeated binary or trinary choices to fit these, such as sequential sampling models (Forstmann, Ratcliff, and Wagenmakers 2016), including drift-diffusion models (Krajbich et al. 2012). The model uses eye movements during a single, complex decision task to identify (1) trajectories of four types of attention for (2) each brand in a choice set, and (3) the effect of brand ownership on these trajectories, and to (4) predict brand choice. It rests on the predictive relations among eye movements, attention trajectories, and utility accumulation only, not on their causal relations, which are intrinsically bidirectional and emergent (Belopolsky and Theeuwes 2009; Theeuwes and Belopolsky 2012; Towal, Mormann, and Koch 2013). Figure 2 summarizes the model structure.

Attention and Choice Model.
Attention Trajectories
The attention part links observed eye movements to covert attention (upper dotted box in Figure 2). It specifies that G types of eye-movements (
We use a multivariate latent trajectory specification (Meredith and Tisak 1990) to link observed eye movements with unobserved attention: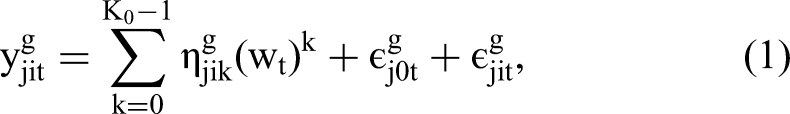
Equation 1 specifies that the tight neurological link between eye movements and attention (Corbetta et al. 1998) is not fully deterministic (Belopolsky and Theeuwes 2009) and contains various sources of measurement error (Van der Lans, Wedel, and Pieters 2011) at the participant (
Determinants of Attention Trajectories
Consumer characteristics (Xj0 is a vector of length L = 9) impact consumer-specific attention trajectory components (top left of Figure 2):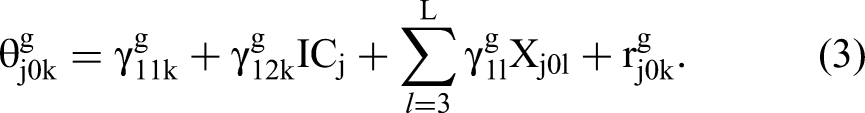
Pretask information specific to consumer j and brand i (Xji is a vector of length H = 10) impacts consumer-and-brand attention trajectory components (middle left in Figure 2):
Heterogeneities in eye movements (ɛ) and attention trajectories (r) are assumed to be normally distributed with mean zero and uncorrelated between brand and consumer levels. Eye movements are allowed to correlate within each quarter, and components of attention trajectories are allowed to correlate at the consumer and consumer-and-brand level. Specifically:
Accumulation of Utility
The utility part of the model (lower dashed box in Figure 2) connects components of attention trajectories (
The second source (αhXjih) of brand utility is independent of attention during the task and accounts for intrinsic market-level brand preferences, position of the brand in the choice display (Atalay, Bodur, and Rasolofoarison 2012), knowledge effects (Chandon et al. 2009), and brand ownership effects. There is evidence that attention trajectories account for brand ownership effects on brand choice (Prediction 4) when (1) the coefficient of brand ownership 
Estimation
We use Markov chain Monte Carlo methodology to estimate the model parameters (α, β, γ, Σ, Ψ) and implement the model in RStan (R Core Team 2022; Stan Development Team 2022). Model parameters are estimated conditional on eye movement and choice data, after observing the full sequence of eye movements during the choice task (t = 1, …, Q). The repeated (t = 1, …, Q) and nested (B brands and G eye movements for each consumer) nature of eye-movement data makes it possible to identify consumer- and brand-specific components for each of the G attention trajectories. Because we observe only a single brand choice, the parameters of the brand choice model component (α and β) are consumer-invariant. We assess model convergence with a rank normalized measure of between- and within-chain variance (R-hat; Vehtari et al. 2021). We report 95% credible intervals for parameter estimates and one-tailed Bayesian p-values (smallest mass of the posterior distribution not including zero). Web Appendix E has estimation details.
K-Fold Cross-Validation
We use K-fold cross-validation to assess the model's predictive performance. This involves splitting observations into K folds (with K commonly equal to 10), and then repeatedly (K times) estimating the model on data from K − 1 folds and predicting observations in the Kth fold (Steckel and Vanhonacker 1993). All observations of a participant are part of the same fold in the cross-validation to satisfy the requirement of independence between estimation and validation samples (Varoquaux et al. 2017; Vehtari, Gelman, and Gabry 2017). Our methodology comprises two separate K-fold cross-validations, each with different rules for generating the K folds. The first, a random-split K-fold cross-validation, randomly splits observations into ten approximately equal-sized groups (Kuhn and Johnson 2013; Marcot and Hanea 2021). The second, a design-based K-fold cross-validation, splits observations into 12 groups based on the three information conditions and four brand ownership segments. The design-based K-fold cross-validation tests the robustness of the attention–choice link to important contextual and consumer variables, thus putting the proposed model to a stronger test than random-split K-fold cross-validation does. We use the K-fold cross-validations to test the empirical support for the theoretical assumptions of our attention and choice model against competing models (Busemeyer and Wang 2000).
vThe methodology predicts which brand is most likely to be chosen for each participant in the validation sample (out of sample) and in each of the four quarters, using information about that participant's eye movements up to that quarter (ahead of period). For each participant (j), the model extracts attention trajectory components (
Results
Descriptive Data
Choice shares in the study were 25% (Apple), 28% (Samsung), 8% (Nokia), 22% (HTC), and 17% (Motorola). Of the 233 participants who currently owned a device of one of the brands in the choice set, 52% chose the device with the same brand (loyals; n = 122). The remaining 48% of participants switched brands (switchers; n = 111). There were no differences in loyalty between brands (χ2(4) = 1.50, p = .83).
On average, participants inspected the information in the display for 116 seconds (SD = 95) before making their choice. As expected, information condition influenced the total time that participants took to make a choice (F(2, 322) = 6.78, p = .001, Cohen's d = 29): respectively, 92 seconds (SD = 61) in the low information condition (n = 107), 115 seconds (SD = 86) in the medium information condition (n = 115), and 140 seconds (SD = 124) in the high information condition (n = 103). Information conditions did not differ in brand loyalty effects (χ2(2) = 2.43, p = .30). User segments differed in the total time they took to make a choice (F(3, 321) = 4.58, p = .004, d = .34): respectively, 115 seconds (SD = 89) in the Apple segment, 97 seconds (SD = 84) in the Samsung segment, 105 seconds (SD = 61) in the other-brand segment; and 151 seconds (SD = 137) in the nonsmartphone segment. The interaction between information condition and user segment on decision time was not statistically significant (F < 1).
Theory Testing
Table 2 summarizes the links between our predictions, model specification, and implications for marketing research. The cross-validated hit rate of the proposed model is an impressive 85%. Table 3 summarizes model estimates.
Predictions, Model Specification, and Marketing Research Implications.
Notes:
Attention Trajectories and Brand Choice.

Notes: Brand fixed effects (FE) are relative to Apple, and column effects are relative to the rightmost column in the brand display. p = one-tailed Bayesian p-value. The “2.50%” and “97.50%” columns show those percentiles of the posterior distributions.
Predictions 1 and 2: Double attention lift for the chosen brand
In support of Prediction 1, we find that a rise toward the end of the task in the quantity of attention (eye fixations) for a brand contributes positively to its utility and choice likelihood (
Prediction 3: Brand ownership drives initial attention
In support of this prediction, we find that the currently owned brand, compared with other brands in the display, attracts significantly more initial attention quantity (
Prediction 4: Attention trajectories account for brand ownership effects on brand choice
In support of this prediction, we find that, indeed, brand ownership predicts brand choice only when attention trajectories are not accounted for. Table 4 summarizes the performance of our model compared with a set of competing models that rest on different theoretical assumptions. A naive model (M0) assumes that information about market-level preferences and brand position in the choice display suffice to predict brand choice. The first competing model (M1) adds brand ownership information to M0, and the second (M2) adds information on consumers’ prior knowledge about each of the brands to M1. The higher brand choice hit rate of M1 (44%) and M2 (45%), compared with that of M0 (27%), shows that brand ownership predicts brand choice over and above market-level preferences and brand position in the choice display (
Attention Trajectories Predict Brand Choice.

Notes: “No. of Pars.” is the number of model parameters. ELPD = expected log predictive density. Hit rate, with 95% prediction interval (PI) in brackets, is the percentage of participants for whom the model correctly predicts brand choice. The hit rate for random brand choice predictions is 20% (1 out of 5).
Importantly, brand ownership effects on brand choice are not statistically significant (
Additional Model-Based Insights and Theory Tests
Double attention lift for the chosen brand
We use the attention part of the proposed model to delve deeper into the double attention lift for the chosen brand. To this aim, we slightly modify Equation 4 by adding a dummy variable indicating whether a brand was ultimately chosen (Web Appendix I has details). The double attention lift has two components: (1) the chosen brand receives progressively more attention (quantity) compared with other brands; and (2) over time, more of the attention received by the chosen brand is devoted to integrating information about the brand rather than comparing it with competing options. The double attention lift for the chosen brand is remarkably strong (Figure 3) and surfaces much earlier than reported before in the attention and choice literature. The share of the total attention quantity allocated to the ultimately chosen brand is already 25% in the first quarter (5 percentage points more than if attention were allotted randomly) and reaches 53% just before choice.

A Double Attention Lift for the Chosen Brand.
To examine the second component of the double attention lift, Panel A of Figure 3 shows the split among integration, comparison, and other attention for the chosen brand. During the first quarter, most attention to the chosen brand is used to integrate information (53%), with the remaining 47% divided almost equally between comparison and other attention. The share of integration attention for the chosen brand increases to 77% just before choice. Panel B of Figure 3 provides the shares of the three types of attention for the nonchosen brands. Interestingly, and different from the trajectory of the chosen brand, the share of integration attention for nonchosen brands remains quite stable over time. As a result, the initial 11-percentage-point gap in shares of integration attention between the chosen (53%) and nonchosen (42%) brands widens over time and reaches 32 percentage points just before choice.
Our results are the first to document this lift in integration attention for the chosen brand and not for all brands in the set. Prior eye-tracking research has documented a shift toward integration attention near the end of complex decision tasks for the choice set as a whole (e.g., Shi, Wedel, and Pieters 2013). If the attention lift for the chosen brand is strong and generalizes to other decision contexts, models that do not account for brand-specific attention might still find an attention lift, on average, for the choice set as a whole and miss that it is unique to the chosen brand.
We compare our model with a competing model (M4) without quadratic change in attention trajectories (Web Appendix H). The difference in the hit rate quantifies the contribution of the final lift to utility accumulation and choice likelihood. The hit rate of M4 is 60%, and the 95% prediction interval is [58, 63]. The double attention lift improves the hit rate by 25 points, to reach 85%. The lift in attention quantity does not occur because the ultimately chosen brand is the sole “attention survivor.” Even in the final quarter before choice, 83% of participants still examined three or more brands, and 68% even examined all four nonchosen brands (Web Appendix I, Table W31).
Brand-loyal and switching consumer segments
Among the participants, 72% currently owned one of the brands in the choice display. We calculate the hit rate for each consumer segment (loyals, switchers, and others) before the start (Quarter 0, based on pretask information only) and after each of the four quarters of the choice task (Table 5 and Figure 4). The patterns of results are notable.

Brand Choice Prediction for Consumer Segments Over Time.
Brand Choice for Consumer Segments over Time.

Notes: Mean percentage hit rate, with 95% prediction interval in square brackets. Duration is given as mean (standard deviation).
First, attention trajectories of brand loyals predict their ultimate brand choice early (92% hit rate after Quarter 1) and consistently over time (89%, 87%, and 92% after Quarters 2–4; overlapping 95% prediction intervals). This reflects early (Prediction 3) and sustained (Predictions 1 and 2) attention to the brand that these consumers own and choose during an average decision time of 89 seconds.
Second, attention trajectories of brand switchers initially predict brand choice significantly worse (5% after Quarter 1 and 9% after Quarter 2) than random (prediction intervals do not overlap 20%) but progressively better toward the moment of choice (78% after Quarter 4). Brand switchers initially allocate a larger share of attention quantity to the owned brand (.21) compared with the other three nonchosen brands in the set (.18, p < .001), with a similar pattern for the share of integration attention (.22 vs .17, p < .001). This suggests that switchers did not come to the task with their mind completely set on choosing a different brand. It is additional evidence for Prediction 3 that brand ownership drives initial attention.
Third, after Quarter 1, attention trajectories already predict the brand choice of “other” consumers (those who do not own a brand on display) better (29%) than if the choice were random. Predictive performance further improves toward the end of the task (83% after Quarter 4). Taken together, the attention trajectories of different consumer segments provide unique “eye prints” of utility accumulation during decision making.
Competing model performance
We estimated four competing models (M5–M8) that rely on different theoretical assumptions and/or use alternative attention measures. M5 assumes that the first fixated brand is more likely to be chosen, a result that has been documented in research on repeated, simple choices (Krajbich, Armel, and Rangel 2010) under time pressure (Reutskaja et al. 2011). M6 assumes that the total number of eye fixations for each brand, rather than their trajectories over time, predicts brand choice, which is in line with sequential sampling models (Krajbich, Armel, and Rangel 2010; Noguchi and Stewart 2014). M7 and M8 are based on findings (Russo and Rosen 1975) that more-preferred choice options receive a larger share of fixations in binary comparison processes.
The proposed model outperforms all competitors in predictive performance. That is, attention trajectories contain more information about brand utility than the first fixation on a brand (M5), the final sum of eye fixations (M6), and the share of fixations in binary comparisons (M7, M8). Also, adding information about the first fixation to our model (Web Appendix H, M13) does not improve predictive performance (85%; 95% prediction interval: [82, 87]; ELPD = −125; Table 6).
Competing Model Performance.

Notes: All models contained the same pretask information, as in Tables 3 and 4. “No. of Pars.” is the number of model parameters; ELPD = expected log predictive density. Hit rate, with 95% prediction interval (PI) in brackets, is the percentage of participants for whom the model correctly predicts brand choice. The hit rate for random brand choice predictions is 20% (1 out of 5).
Comparing M5–M8 against competing model M2, which relies on prechoice information only, informs us about the contribution of different types of information that become available during the task. Knowing which brand is fixated first does not improve brand choice predictions (95% prediction intervals of M5 and M2 overlap) in the current context. However, the share of fixations in binary comparisons provides an additional 11 points in the hit rate (M7 vs. M2). The total number of fixations offers the largest improvement in the hit rate (30 percentage points compared with M2), which is still 10 percentage points below the proposed model's, with nonoverlapping 95% prediction intervals.
Robustness of the Attention–Utility Link
We estimated three follow-up models and report the results of the design-based K-fold cross-validation (M9–M11; details in Web Appendix H) to establish the robustness of the link between attention trajectories and utility accumulation. These follow-up models add interaction variables between attention trajectory components and, respectively, the three information conditions (M9), total number of fixations (M10), and decision time in seconds (M11). If the strength of the attention–utility link were to vary as a function of these factors, the follow-up models would outperform the proposed model. If anything, model performance was slightly worse, with respective hit rates of 84% (M9), 84% (M10), and 83% (M11).
The design-based K-fold cross-validation predicts brand choice for participants in each of the 12 cells of the experimental design (3 information conditions × 4 user segments) from their attention trajectories and from model estimates calibrated on participants in the other cells. If the strength of the attention–utility link were to vary as a function of the amount of information presented on screen or consumers’ prior experiences with the brands, then hit rates would vary greatly among the 12 cells. The results provide a different picture, with hit rates being remarkably similar across the folds. A deviation in this overall pattern occurs for the nonsmartphone segment, whose brand choices are initially predicted worse (26% after Quarter 1) than for other segments (all others 45% or better). All hit rates converge when moving toward choice (average 85%).
Discussion
This research documents a tight and generalizable link between attention trajectories, utility accumulation, and brand choice of consumers during a complex decision-making task. We find a systematic double attention lift for the brand ultimately chosen. That is, during a complex decision-making task, the ultimately chosen brand receives more attention than competing brands close to the moment of choice, and more of this attention is devoted to integrating information about the brand rather than to comparing the brand with its competitors. The attention lift starts much earlier than previously observed, and the documented double attention lift for the chosen brand is new. We also find that consumers attend, first, to the brand they currently own, irrespective of whether they will ultimately choose it (loyals) or not (switchers), and that attention trajectories fully account for ownership effects on brand choice. These findings help close four knowledge gaps in the extant attention and choice literature and provide new insights for marketing theory and managerial practice.
Theoretical and Methodological Insights
First, specific types of attention (reflected in eye saccades) are tightly connected to brand utility accumulation and choice, over and above the quantity of attention (reflected in eye fixations) that consumers devote to specific brands. In particular, integration attention (reflected in within-brand saccades) proved predictive of utility accumulation and choice.
Second, attention trajectories of brands contain information about utility and choice over and above the mere volume of fixations. This reveals that attention to brands carries different weights over time, rather than being constant, as commonly assumed in attention and choice studies. Specifically, quantity of attention and integration attention toward the end of the decision task rose quickly for the ultimately chosen brand and carried more weight in choice. These findings can enrich future work on sequential sampling models, such as attentional drift-diffusion models (e.g., Krajbich et al. 2012), which emphasize the sum of fixations; choice-based conjoint research, which has used fixation frequency as a proxy for learning across repeated choices (Meißner, Musalem, and Huber 2016); and research on saccades, among others, as indicators of search costs (Yang, Toubia, and De Jong 2015). Moreover, our finding that the lift in integration attention was unique to the chosen brand and not to all brands in the set may inform two-stage and multistage decision models (Shi, Wedel, and Pieters 2013), which assume processing-by-brand or attention integration stages toward the end of decision-making tasks, but for the choice set as a whole.
Third, brand ownership had an early effect on quantity of attention and on integration attention for the currently owned brand, which is a new finding. Crucially, the early brand ownership effect on attention and late attention lift toward the chosen brand produced qualitatively different attention and utility accumulation trajectories for brand loyals, brand switchers, and other consumers. Thus, brand loyals allocated more attention to the chosen brand early in the decision task and then increasingly over time. Brand switchers expressed a different attention trajectory, with an early (small) drop and late lift in attention and utility for the ultimately chosen brand. Consumers who did not yet own any of the brands in the choice display expressed a pattern in between these two. An aggregate analysis for the sample as a whole would have left these distinct trajectories for specific consumer segments undetected. These findings extend earlier work that has reported status quo and state-dependence effects of brand ownership in choices of packaged goods, without (Dubé et al. 2008) or with (Chandon et al. 2009) eye tracking. Our attention trajectory model can identify when, and the extent to which, state dependence is less attention-based and more automatic (choice inertia) or more deliberate, in which case attention trajectories could function as in the current research.
Fourth, attention trajectories predicted brand choice remarkably well, out of sample and ahead of period, and much better than competing models that rest on different theoretical assumptions. Prior attention and choice research has documented an association between time-aggregated measures of mostly attention quantity, typically using in-sample fit. Janiszewski and Van Osselaer (2021, p. 636) stress that “an overarching goal of a research paper is to provide predictive insight.” The superior predictive performance of our model, relative to competing models, throughout the course of the decision-making task provides these insights. Our model provides empirical support for the theory that attention trajectories capture the utility accumulation of brands during complex decision making, which is a central research theme (Gabaix 2019, p. 328).
The new attention and choice model and Bayesian K-fold cross-validation methodologies enabled these findings, which contribute to closing the four knowledge gaps. In addition, our research makes three methodological contributions to the attention and choice literature. First, the model uses a conditional logit specification to link attention trajectories for each of the brands to the final brand choice. This specification accommodates any number of brands or options in the choice set and extends earlier work that is limited to binary or trinary choice (Krajbich, Armel, and Rangel 2010; Krajbich et al. 2012). Second, our model has a flexible, polynomial specification of attention trajectories to accommodate various decision tasks and data-collection situations. Higher-order polynomial, piecewise linear, and other components can be readily added to accommodate specific tasks and data and hypotheses under scrutiny. Third, the K-fold cross-validation enables out-of-sample brand choice predictions based on a single, complex brand choice, and affords ahead-of-period predictions by linking attention trajectories to the final brand choice. This extends prior research that relies on repeated, simple choices to fit prior preference measures to later attention, and that uses participants twice for cross-validation (Fisher 2017; Smith and Krajbich 2018).
Managerial Implications
To explore the managerial implications of our results, we interviewed 20 industry experts, attended academia–industry events on eye tracking, and examined how companies use eye tracking in marketing research and managerial practice. Against this backdrop, we summarize current managerial practices and the potential value of our findings for practitioners (details in Web Appendix A).
Practitioners recognize the diagnostic insights that eye movements provide to guide policy making. As one Unilever executive formulated in a white paper, “When we need a specific answer to a question, we use a lot of eye tracking because eyes don’t lie.” Practitioners also acknowledge the predictive performance of eye-movement metrics for downstream consumer actions. Marc Guldimann, CEO of Adelaide, indicated with respect to attention to advertising: “We’ve documented that Attention Units are predictive of outcomes throughout the funnel, all the way down to sales outcomes.”
Current eye-tracking research in business emphasizes information search and speeded choices between simple options, such as fast-moving consumer good brands, as well as attention to advertising. Leading attention measures in practice are aggregate fixation-based metrics, although the usefulness of finer-grained metrics is acknowledged. As a marketing and product executive at a research agency stated, “Clients are somehow familiar with heat maps and time to first fixation, but there is a lot more than these two measures. This study shows that eye tracking is useful beyond just heat maps.” Our findings show that, at least in the current complex decision-making task, common industry metrics, such as time to first fixations and total time on areas of interest, did not differentiate between brands with similar levels of total attention, between fixations that are part of different types of saccades, or between different attention trajectories, and did not predict brand choice well. This limits the applicability of such metrics in complex decision situations.
Attention trajectories, in general and for specific consumer segments, did have strong predictive performance. Identifying attention trajectories during choice may help practitioners develop strategies to retain existing or attract new customers. A white paper by an eye-tracking company indicated, “Research might show that sales drop not because of an issue with your own brand but because a competitor has made a change that drove more conversions—eye tracking could tell you what this change was and why it was effective. So, it's possible to track not just the key drivers and barriers in your own product's path-to-purchase but your competitors’ as well, and this can be done efficiently within the same data collection and analysis session.” Our results support this claim and show how both brand and consumer characteristics impact attention trajectories and choice.
Web Appendix A describes two eye-tracking-based measures and methods that improve on current approaches in practice. The first is a generalized version of the strategy index (Payne 1976), which captures the balance of within-brand and between-brand saccades at brand level during each quarter. This traces the increasing attention share for the ultimately chosen brand over time (Figure W1, Web Appendix A), based on the current findings about double attention lift. The second is a descriptive index tracing how eye movements provide information about attention shares of two important consumer segments: brand loyals and brand switchers (Figure W2, Web Appendix A), based on the current findings about their unique attention trajectories.
Limitations and Future Directions
Our work has limitations, of course. First, to keep the model tractable, we normalized eye-movement data into four quarters for each consumer. This is consistent with prior research that has used up to four time bins (Meißner, Musalem, and Huber 2016; Willemsen, Böckenholt, and Johnson 2011). Yet this limits the detail about attention trajectories and utility accumulation. It also precludes modeling the time that consumers take to make a choice, which is an important caveat. Follow-up research to model brand choice and decision time jointly is called for.
Second, our model is agnostic about causal processes linking attention and preference at each point in time. Thus, we cannot claim that attention trajectories cause utility accumulation or the other way around. This caveat also holds for other attention and choice studies (Table 1), as well as for other attention research claiming such causal links.
Third, participants made only one hypothetical, albeit realistic, choice from a set of five smartphones. Future research that requires participants to make multiple, incentive-aligned choices would be able to examine heterogeneity in choice parameters and establish the generalizability of our findings. Such repeated-choice studies may examine choice contexts in which repeated complex decisions are common, eye movements might be particularly informative, and consumers vary in their involvement and brand loyalty behavior. Examples of such contexts are financial investments (Peng and Xiong 2006), hiring (Bartoš et al. 2016), or medical decisions (Al-Moteri et al. 2017).
Conclusion
To reiterate: this research documents a systematic link between attention trajectories, utility accumulation, and brand choice during complex decision making. It is the first to document a double attention lift toward the ultimately chosen brand throughout the decision-making task, and the first to demonstrate that brand ownership effects exert a strong initial effect on attention, but that attention trajectories fully capture this effect on final choice.
Supplemental Material
sj-pdf-1-mrj-10.1177_00222437221141052 - Supplemental material for Attention Trajectories Capture Utility Accumulation and Predict Brand Choice
Supplemental material, sj-pdf-1-mrj-10.1177_00222437221141052 for Attention Trajectories Capture Utility Accumulation and Predict Brand Choice by Ana Martinovici, Rik Pieters and Tülin Erdem in Journal of Marketing Research
Footnotes
Acknowledgments
The authors acknowledge the terrific assistance provided by the Analysis Group and by Christopher Borek, managing principal at Analysis Group, and Nino Sitchinava (at Analysis Group when the eye-tracking study was conducted, now principal economist at Houzz) during the design and data collection stages of the eye-tracking experiment. Original data collection was part of a major lawsuit. Legal requirements and nondisclosure agreements prevent the authors from providing some details. The first author thanks SURF (https://![]() ) for the support in using the Lisa Compute Cluster.
) for the support in using the Lisa Compute Cluster.
Associate Editor
Hari Sridhar
Declaration of Conflicting Interests
The author(s) declared no potential conflicts of interest with respect to the research, authorship, and/or publication of this article.
Funding
The author(s) received no financial support for the research, authorship, and/or publication of this article.
Notes
References
Supplementary Material
Please find the following supplemental material available below.
For Open Access articles published under a Creative Commons License, all supplemental material carries the same license as the article it is associated with.
For non-Open Access articles published, all supplemental material carries a non-exclusive license, and permission requests for re-use of supplemental material or any part of supplemental material shall be sent directly to the copyright owner as specified in the copyright notice associated with the article.