
Abstract
Market structure maps spatially represent competitive relationships among brands and products. In these maps, each product is typically visualized in a single map location. Such visualization, however, does not adequately accommodate multimarket membership products (MMPs), which are products that compete in multiple submarkets that are each characterized by distinct competitors and consumer preferences. The author proposes a novel framework that accommodates MMPs by visualizing products in the local context of each submarket in which they compete. This framework is then used to study market structure in the digital camera market. Competitive relationships are inferred from consumers’ online searches using bootstrapped neural product embedding. The research shows that 8% of cameras are MMPs and that 50% of all submarkets are affected by MMPs. The map generated with the proposed framework uncovers mismatches between manufacturer positioning and consumer perception of several cameras. An extensive comparison of the proposed framework with alternative mapping methods reveals that (1) commonly used mapping methods misrepresent MMPs’ competitive positions in their maps and (2) ignoring MMPs can lead to distorted visualizations of the underlying market structure. Both problems compromise firms’ abilities to accurately assess products’ competitive positions and evaluate the effectiveness of their positioning strategies.
Keywords
Firms rely on the analysis of market structures so that interrelations among products and brands become apparent (Grover and Dillon 1985). A pivotal approach is the derivation of a spatial configuration or map that depicts the continuum of competitive relationships among the products in a given market (DeSarbo, Manrai, and Manrai 1993). A major advantage of market structure maps is that they reveal relationships that would otherwise not be noticeable or straightforward to interpret (Gabel, Guhl, and Klapper 2019; Ringel and Skiera 2016). Gartner refers to “visual-based data discovery” as a “defining feature” of modern business analytics in its Magic Quadrant report (Gartner 2018, p. 2). Information derived from maps translates into concrete managerial consequences, informing marketing-mix and positioning decisions (Lattin and McAlister 1985; Lilien and Rangaswamy 2004; Smelcer and Carmel 1997).
Mapping methods commonly used in marketing, such as the popular multidimensional scaling (MDS) method, assign each product to a single location on a map. Although this property facilitates the embedding of information in maps, it misses important relationships when products or brands compete in multiple submarkets. Research on market segmentation suggests that markets can consist of multiple submarkets and that products can compete in multiple submarkets simultaneously (Arabie et al. 1981). By positioning each product in a single location on market structure maps, extant mapping methods fail to fully capture the true competitive positions of products that compete in multiple submarkets simultaneously. In this research, I refer to these products as multimarket membership products (MMPs). In what follows, I show that failure to account for these products’ multimarket memberships can lead to distorted visual representations of the market structure. This problem can compromise the accurate assessment of products' competitive positions and may mislead firms about the effectiveness of their positioning strategies.
This research aims to overcome the limited capacity of extant mapping methods to accommodate MMPs. Specifically, in this research I (1) develop a flexible framework that identifies and accurately visualizes MMPs in market structure maps, (2) use this framework to investigate multimarket memberships in the digital single-lens reflex (DSLR) camera market, (3) demonstrate the strengths of this framework by a numerical example and a simulation, and (4) compare this framework with alternative mapping methods.
This new framework is referred to as multimarket membership mapping, abbreviated as M4. The M4 framework addresses the shortcomings of existing mapping approaches by creating a single map that captures all submarkets of a given market without making a priori assumptions as to which products to visualize in one or more submarkets. M4 builds on the idea that market segmentation and market structure analysis are complementary (Green, Wind, and Claycamp 1975; Grover and Srinivasan 1987). At its core, M4 connects overlapping clustering, which can detect multimarket memberships of products, with map projection in a novel way. This novel connection enables M4 to (1) identify submarkets, (2) determine which products compete in more than one submarket, and (3) visualize products in the local context of each submarket they compete in on a common market structure map.
The M4 framework is based on the premise that in markets characterized by high levels of product variety, complexity, and versatility, a single product may meet different consumer preferences that were traditionally met by products of different submarkets (Day, Shocker, and Srivastava 1979; Shocker, Bayus, and Kim 2004; Urban, Johnson, and Hauser 1984). A submarket is defined as the subset of a market's products that consumers perceive, on the basis of their preferences, to be more substitutable for one another than for other products in the market. An MMP is thus a product that consumers perceive to be a viable substitute in more than one submarket.
This research demonstrates the value of accurately accommodating MMPs in market structure maps in an empirical study of the DSLR camera market. Using neural product embedding, I infer competitive relationships among DSLR cameras from online search histories (or clickstreams) of over 57,000 consumers at a major price comparison site. Submarkets emerge when multiple consumer segments exist whose search spaces (i.e., consideration sets) are very similar to another, but different to those of other segments.
The M4 framework reveals that among the 111 DSLR cameras in this study, 8% compete in the context of more than one of ten identified submarkets. Half of all submarkets are affected by the identified MMPs. A deeper analysis of the underlying clickstream data confirms that a large majority of consumers who search for an MMP do so within the context of either one or the other of its submarkets, but not across submarkets. Importantly, the map produced by M4 indicates where manufacturers' intended camera positions (as stated in their product descriptions, for example, “semi-professional camera”) are inconsistent with consumers' perceptions. The comparison of M4's market structure map of the DSLR camera market to maps of alternative methods shows that M4 outperforms them in terms of face validity and the extent to which it accurately represents the underlying competitive relationships in its map. An extensive simulation study supports these findings.
The rest of this article is organized as follows: The next section provides an overview of related literature. Then, I outline the basic idea of the M4 framework, followed by a detailed description and a numerical example. I explain how competitive relationships can be inferred from online search data using neural product embedding and then analyze multimarket memberships in the DSLR camera market. After testing the validity and robustness of the findings, I compare the M4 map with maps of alternative methods empirically and by simulation. Finally, I highlight the contributions of this research and close with a discussion of implications, limitations, and future research directions.
Related Literature on Mapping and Clustering
A market structure map is a two-dimensional plane on which product relationships are visualized. 1 On such maps, often produced using MDS or alternative map projection methods (for a review, see France and Ghose 2018), competitive relationships among products are represented through spatial proximity. Products identified as having strong competitive relationships are located close to one another, whereas those with weak relationships are distant. The use of maps to visualize competitive relationships is deeply ingrained in the marketing literature (e.g., Andrews and Manrai 1999; DeSarbo, Grewal, and Scott 2008; Elrod 1988; Green 1975).
Marketers regularly use MDS and its many extensions to study consumer perceptions and investigate market structure. Since the introduction of MDS, a steady stream of mapping methods evolved to account for more complex data sets and more advanced statistical requirements (France and Ghose 2018). Many examples that leverage map-based data visualization to investigate market structures exist. These include mapping of consumer online search (Kim, Albuquerque, and Bronnenberg 2011), market structure analysis from discussion forums (Netzer et al. 2012), visualization of asymmetric competition in large markets (Ringel and Skiera 2016), and visualization of submarkets from purchase data (France and Ghose 2016). Further examples involve the use of statistical perceptual maps for inference (Iacobucci, Grisaffe, and DeSarbo 2017), visualization of brand relationships from social tags (Nam, Joshi, and Kannan 2017), visualization of large retailer assortments from shopping basket data (Gabel, Guhl, and Klapper 2019), and visualization of market structure on the basis of social media engagement (Yang, Zhang, and Kannan 2021).
Historically, cluster analysis and market structure visualization were largely addressed in separate streams of literature that developed independently of one another. Whereas cluster analysis provides set information (i.e., submarket memberships), market structure maps provide a continuous perspective on products’ relative positions. Thus, maps qualify competitive relationships further than clustering solutions do because they reveal the extent to which products compete with one another (France and Ghose 2016; Shocker, Stewart, and Zahorik 1990).
Several studies highlight the value of combining mapping with clustering. For instance, Netzer et al. (2012) and France and Ghose (2016) use cluster analysis to identify products’ submarket memberships on market structure maps. Likewise, Gabel, Guhl, and Klapper (2019) cluster the products in their assortment map to better visualize store categories from consumers’ perspectives. Although the posterior consideration of submarket memberships in these studies does not inform the actual mapping process, it facilitates the interpretation of the generated maps.
Closer to this work are studies that integrate clustering and mapping into a single method, thereby deriving additional benefits. For instance, the clusterwise bilinear spatial method proposed by DeSarbo, Grewal, and Scott (2008) performs segmentation and positioning simultaneously. Ringel and Skiera (2016) integrated clustering and mapping in a joint method called DRMABS to extend market structure visualization to large markets that comprise dozens of submarkets and hundreds of products. However, neither method identifies MMPs and embeds them accurately in the submarkets that they compete in on their maps.
Whereas extant mapping methods assume that products have a single position in a market, research on market segmentation and cluster analysis shows that this assumption does not always hold. Many products are, in fact, MMPs (Arabie et al. 1981; Chaturvedi et al. 1997; Kannan and Sanchez 1994; Wedel and Steenkamp 1991; Zahorik 1994). Therefore, an approach that acknowledges this aspect of products’ competitive positions is necessary.
Because extant mapping methods can only assign products to single map locations, analysts have had two options for visualizing market structures in the presence of MMPs. The first option involves visualizing MMPs somewhere between their respective submarkets. Yet, such an approach can disguise the local competitive roles of MMPs and may further distort the global representation of the underlying market structure—potentially suggesting competitive relationships among products when no such relationships exist.
The second option is to create an individual map for each submarket. However, the resulting series of independent maps are cumbersome to study and fall short of uncovering markets' global structures, how submarkets relate to each other, and where products compete across submarkets' boundaries (Ringel and Skiera 2016). Further, to generate a series of independent maps, the analyst would need to first define submarkets and then make assumptions as to which submarkets any given MMP belongs to from consumers' perspectives. The prerequisite for such approach is at least some familiarity on the part of the analyst with all competitors in each submarket—a daunting task in larger markets (Gabel, Guhl, and Klapper 2019).
In contrast, the M4 framework explicitly acknowledges the possibility of products competing in the local contexts of more than one submarket. Using the M4 framework, analysts can generate a single market structure map that comprises all submarkets of a given market and visualizes MMPs in the local competitive contexts of each of their submarkets.
In terms of data, this research relates most closely to the work of Ringel and Skiera (2016) and Kim, Albuquerque, and Bronnenberg (2011). Both studies also use consumer search data to infer competitive relationships among products. However, neither study considers MMPs in its market structure maps, nor do these studies engage in a deeper analysis of consumers’ search patterns to investigate products’ map positions. Furthermore, whereas previous studies provide theoretical support for using consumer search data to identify competitive relationships from co-consideration (e.g., Kim, Albuquerque, and Bronnenberg 2011; Moe 2006; Ringel and Skiera 2016), this research is the first to validate the notion externally by surveying consumers (see the “Map Validity” subsection in the “Empirical Study of the DSLR Camera Market” section).
Finally, although I use price comparison site data as Ringel and Skiera (2016) do, I infer competitive relationships from these data differently using neural product embedding. In this regard, this research is more closely related to that of Gabel, Guhl, and Klapper (2019), who implement a variation of word2vec (Mikolov et al. 2013), a shallow neural network for natural language processing, to infer relationships among consumable products of a grocers’ assortment from scanner data. In contrast to the approach of Gabel, Guhl, and Klapper, I use a bootstrapping procedure to ensure solution robustness, and I explicitly consider product sequence in search (which scanner data do not capture). Importantly, while their analysis reveals product categories from consumers’ perspectives, it does not consider the possibility that a consumable can be a substitute (or complement) in more than one category. Table 1 provides an overview of studies that are most closely related to this research and highlights key differences and contributions.
Overview of Related Marketing Research.
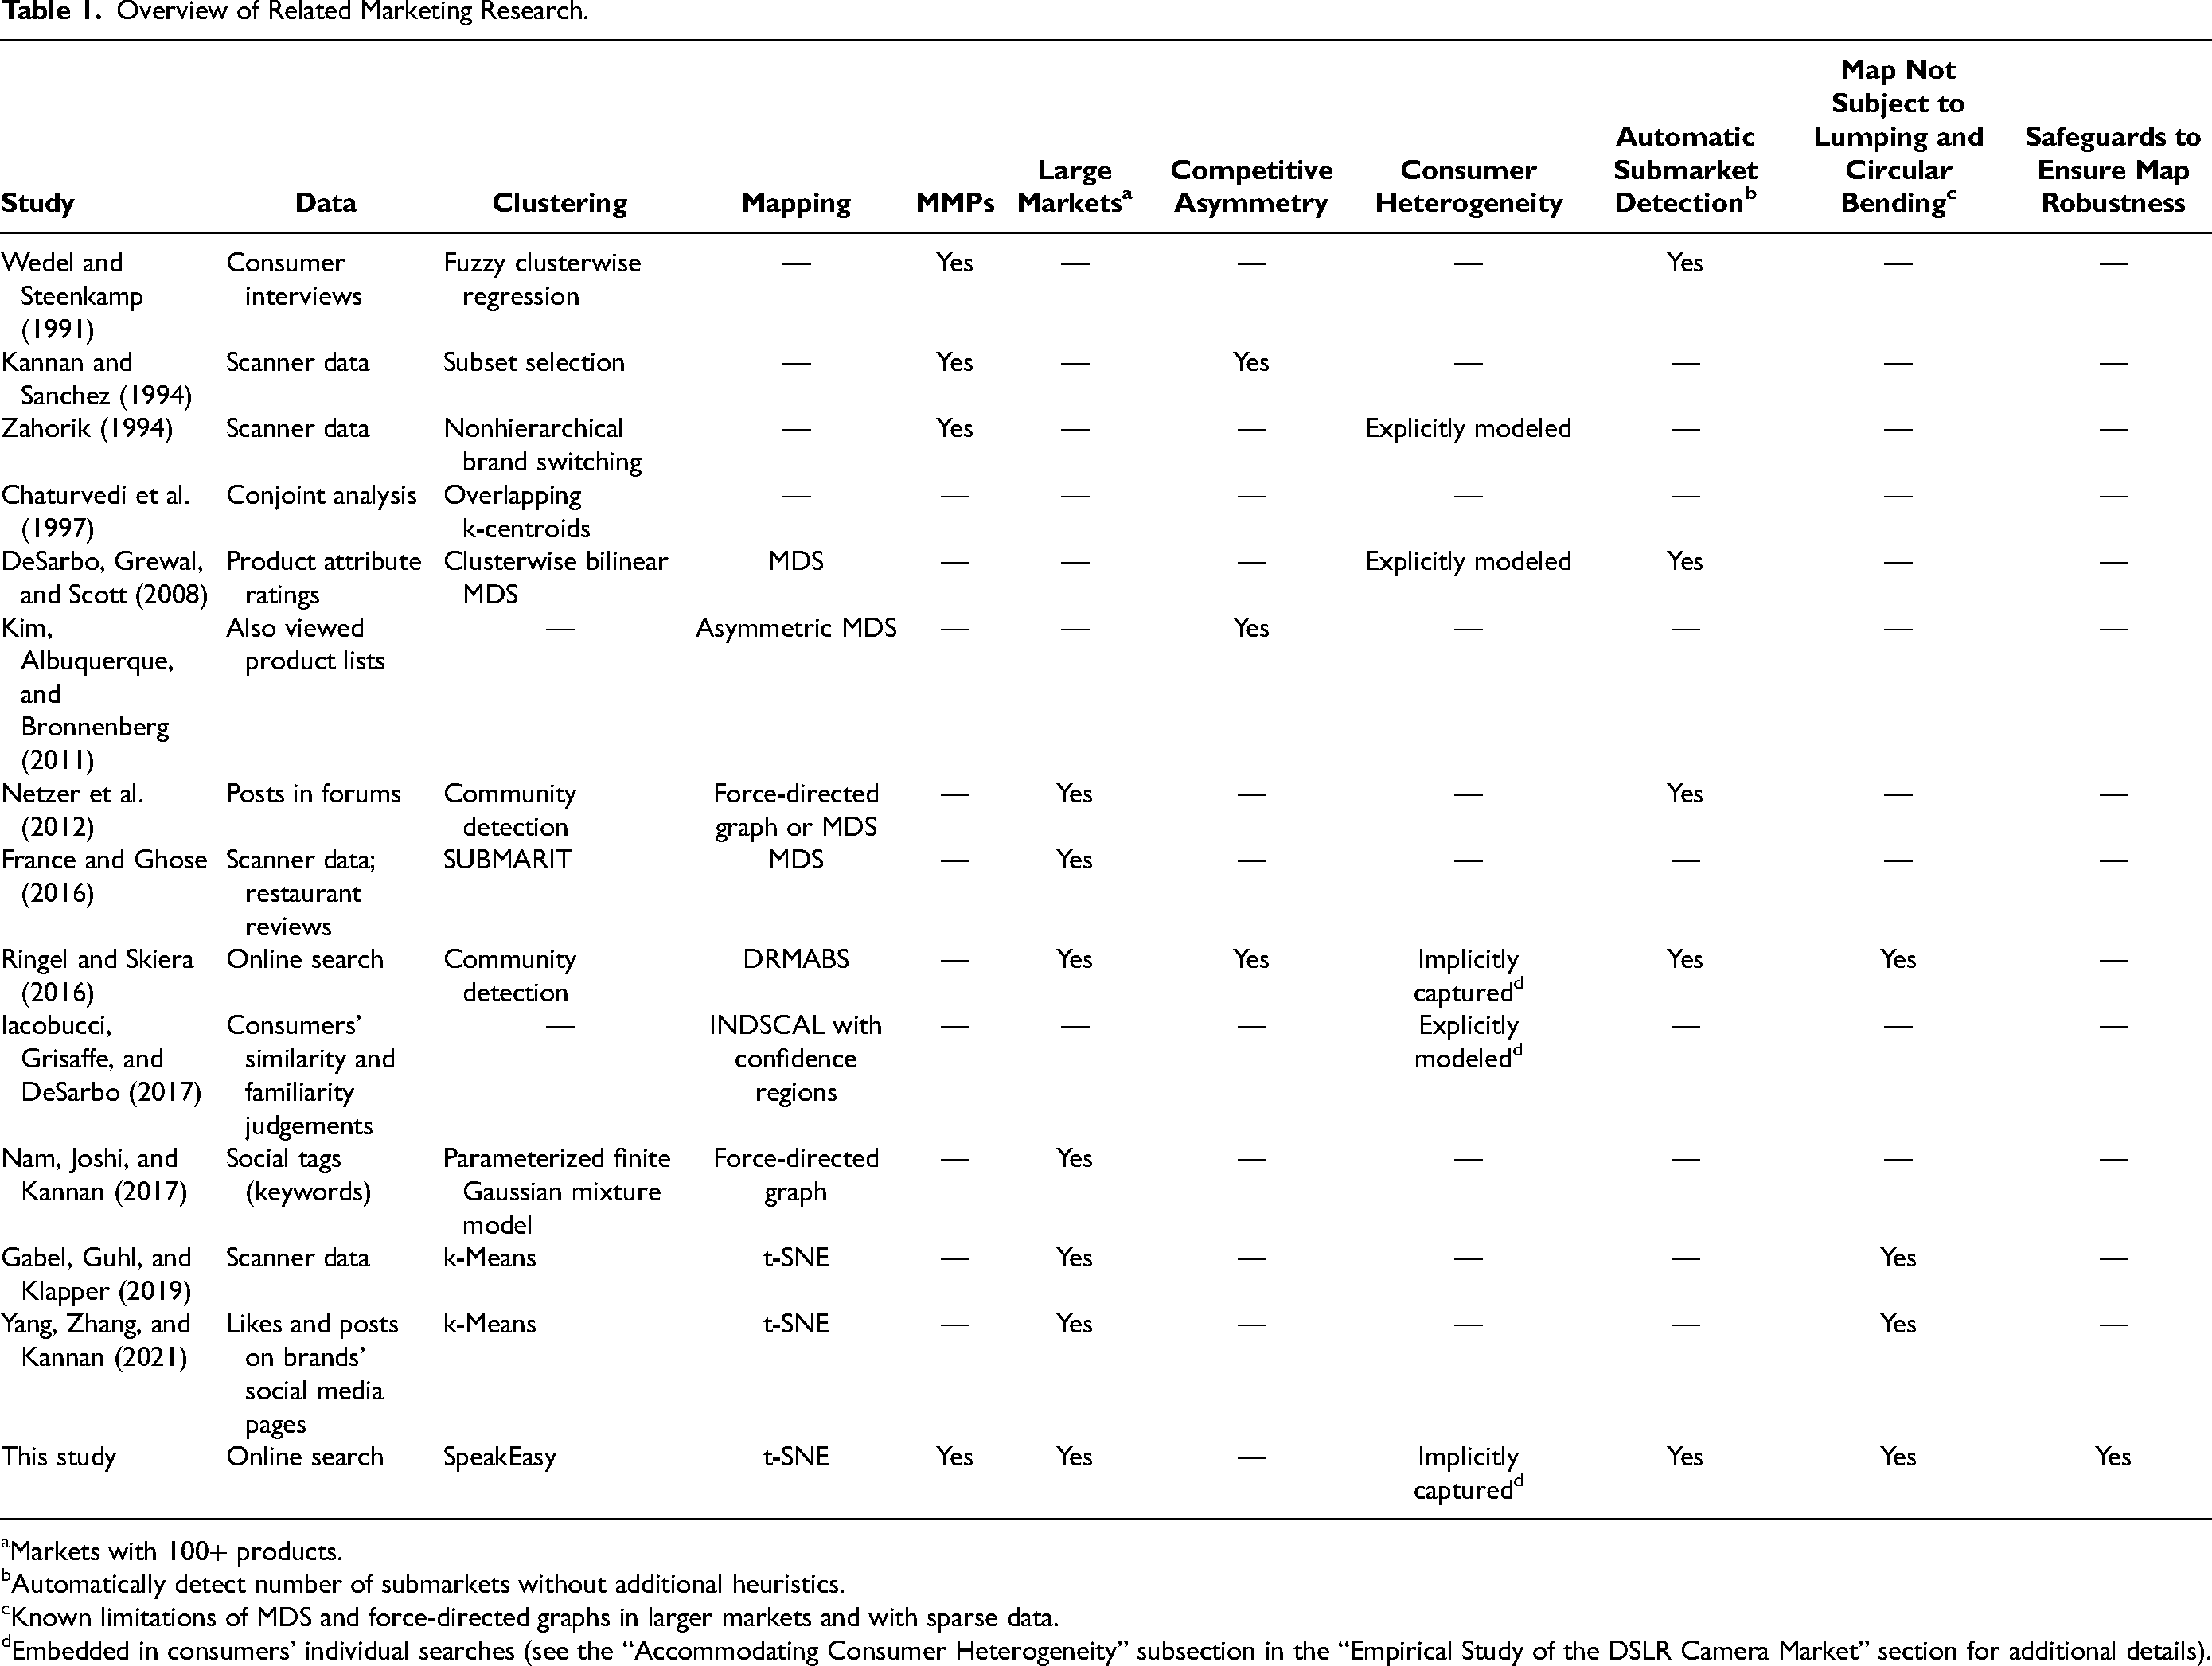
Markets with 100+ products.
Automatically detect number of submarkets without additional heuristics.
Known limitations of MDS and force-directed graphs in larger markets and with sparse data.
Embedded in consumers' individual searches (see the “Accommodating Consumer Heterogeneity” subsection in the “Empirical Study of the DSLR Camera Market” section for additional details).
Basic Idea of the M4 Framework
The M4 framework is the first mapping approach that explicitly accommodates MMPs in market structure maps. Defining the market under analysis is a prerequisite for visualizing competitive market structure. Markets can be characterized by various parameters, such as geography, product category, regulation, politics, social structure, firms, customers, technology, North American Industry Classification System codes, or combinations thereof. For the purpose of this research and without loss of generality, I follow France and Ghose’s (2016) characterization. Their research views market competition at the product category level, where each product is typically a member of a submarket.
The definition of a submarket used in this research—the subset of a market's products that consumers perceive to be more substitutable to one another than to other products in the market on the basis of their preferences—accommodates the idea that markets, even entire economies, can be understood as interlaced networks of relationships (Thorelli 1986). In this sense, a submarket's products compete more strongly with one another than with products of other submarkets (France and Ghose 2016). By accounting for the possibility that products may also maintain competitive relationships to products outside of their submarkets, market structure can be visualized as a continuum of product positions within and across submarkets on a map.
Therein, an MMP is a product that consumers perceive to be a viable substitute in more than one submarket. An example of an MMP is the luxury SUV that Van Heerde, Srinivasan, and Dekimpe (2010) study. Their analysis reveals that the luxury SUV competes in two submarkets: luxury limousines and SUVs. In each submarket, the luxury SUV competes on the specific consumer preferences pertaining to that submarket and faces a different set of competitors. Because common market structure maps assign products to single map locations, they cannot visualize MMPs such as the luxury SUV in the local competitive context of each of their submarkets on the same map.
The basic idea of the M4 framework for accurately accommodating MMPs in market structure maps is to connect overlapping clustering with map projection. These two methods may, however, seem inherently incompatible: overlapping clustering receives unique objects as input and assigns them to multiple clusters, which effectively removes objects’ uniqueness. Map projection methods, in contrast, assume that objects are unique.
To reconcile overlapping clustering with map projection, I propose to represent each MMP as a set of unique instances. Each instance corresponds to one of the submarkets to which the MMP is assigned by the overlapping clustering method. To capture the MMP's competitive position within the specific local contexts of each of the submarkets it competes in, all competitive relationships are removed from each of its instances that do not pertain to the submarket that the instance is associated with. In other words, MMPs’ competitive relationships are distributed to other products in the market across their respective instances such that each instance only captures an MMP's local competitive position. Because each instance of an MMP is now a unique object in the map projection process, the MMP can appear in multiple submarkets, that is, locations on the same map.
Four Phases of the M4 Framework
This basic idea of this research is implemented in the four-phase M4 framework. The four consecutive phases, shown in Figure 1, are (1) input preparation, (2) identification of multimarket memberships, (3) transformation of multimarket memberships, and (4) map projection. The output of each phase serves as direct input to the next phase. I explain each phase of M4 in detail in the following four subsections.
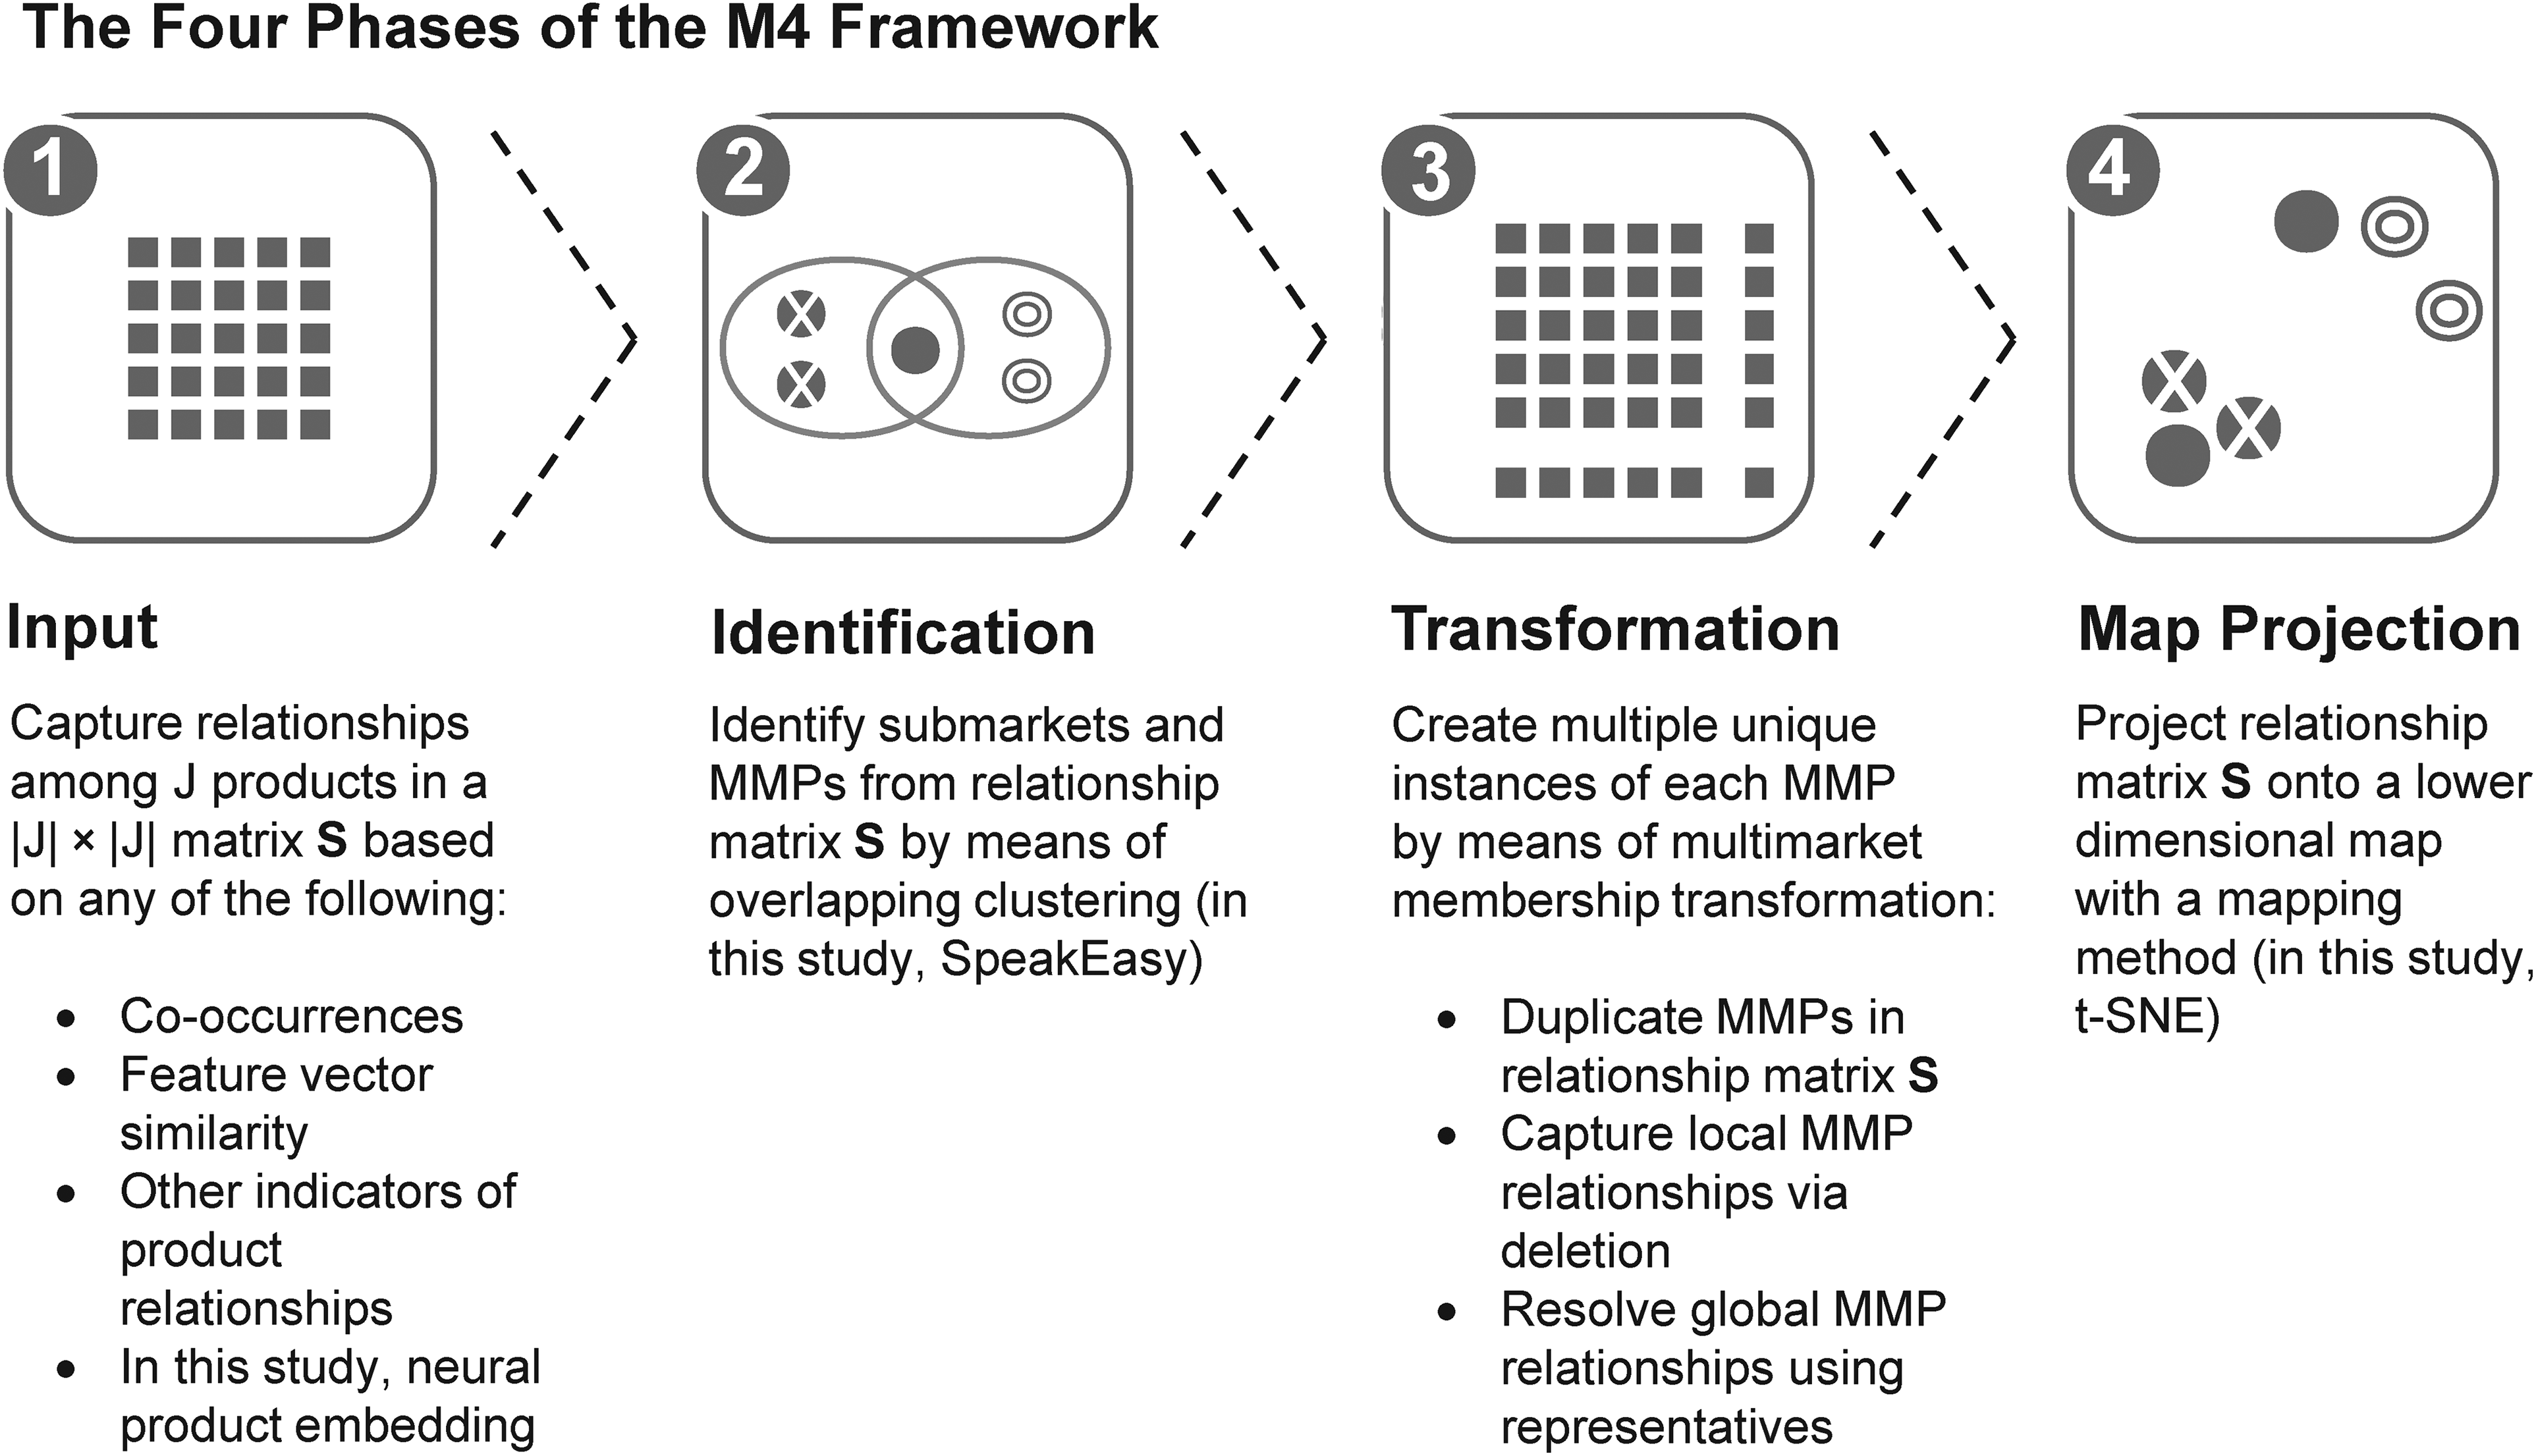
The Four Phases of the M4 Framework.
Phase 1: Input Preparation
The M4 framework operates on a relationship matrix that captures the presence and magnitude of pairwise relationships among products in higher-dimensional space. For market structure analysis, relationship matrix
To construct relationship matrix
Phase 2: Identification of Multimarket Memberships
The objective of the second phase of M4 is to identify products that simultaneously compete in multiple different submarkets, that is, against different sets of local competitors. The second phase involves (1) identifying submarkets of competing products from relationship matrix
I use an overlapping clustering method to identify overlapping submarkets of products, that is, markets where products may be members of more than one submarket. In contrast to standard clustering methods that produce disjoint solutions in which each product can only be assigned to one submarket, overlapping clustering methods can produce nondisjoint solutions; they can identify which products belong to more than one submarket and assign them accordingly. 2
For the purpose of this study, a clustering method called SpeakEasy is integrated into the M4 framework. SpeakEasy outperforms alternative clustering methods (Gaiteri et al. 2015), and it is particularly well suited for the M4 framework because it (1) operates directly on a relationship matrix, (2) identifies the number of clusters automatically, (3) identifies MMPs, (4) produces robust solutions, and (5) is computationally inexpensive.
SpeakEasy is based on the principle of label propagation, where objects join clusters through an exchange of “labels” between related objects. In label propagation, objects are initially randomly assigned to a network, where each object holds a single label; with each iteration of the algorithm, the object's label is updated to match the label carried by the majority of the object's neighbors in the network. Clusters are identified when the algorithm converges.
A novelty of SpeakEasy's label propagation process is that it combines a bottom-up approach to clustering (using information regarding network neighbors) with a top-down approach (using information from the whole set of objects). Specifically, SpeakEasy (1) updates each object's labels on the basis of its neighbors’ labels and (2) subtracts the expected frequency of these labels based on their prevalence in the complete set of objects. Such a dual approach facilitates accurate cluster detection because the top-down information is used to ensure that the bottom-up label propagation process identifies clusters that accurately represent the global structure (De Meo et al. 2014). SpeakEasy's label propagation process thus serves the objective of capturing both the global structure of the market and local submarket structures in the maps.
Label propagation is a greedy algorithm, which makes SpeakEasy extremely fast but also leads to different clustering solutions across runs. To ensure solution robustness, SpeakEasy rapidly executes numerous clustering runs and applies consensus clustering (Lancichinetti and Fortunato 2012) to find the clustering solution that is most representative of all identified solutions. By evaluating the oscillation of objects between clusters across all identified solutions relative to the representative solution, SpeakEasy can identify cluster overlaps. Specifically, SpeakEasy tracks objects’ pairwise cluster assignments across all solutions in a weighted co-occurrence matrix. Using an adaptive threshold
Arguably, solution robustness is desirable for market structure analysis. However, so is solution quality, which SpeakEasy does not explicitly consider. Because label propagation is greedy in nature, it can easily get trapped in local optima. In consequence, poor clustering solutions end up in SpeakEasy's consensus clustering phase, where they affect the choice of the representative clustering solution unfavorably. In other words, the chosen representative solution will share properties with poor solutions. To overcome this problem, I introduce a solution quality criterion called modularity to SpeakEasy's consensus clustering phase. 3 Modularity is the most widely used measure of solution quality in the area of community detection (Sobolevsky et al. 2014). It compares the weighted number of relationships inside a cluster with the expected value for a randomized network of the same size and degree sequence. Clustering solutions with high modularity are considered good because they are different from a random assignment of objects to clusters. Thus, modularity is a quantitative measure of the quality of the division of a network into clusters or, in the case of market analysis, the division of a market into submarkets. In this modification of SpeakEasy, only clustering solutions with higher modularities are considered in the consensus clustering phase. Median modularity is used as a heuristic to divide the better from the worse clustering solutions of all clustering runs. This modified SpeakEasy method identifies the representative clustering solution only from a pool of higher-quality solutions (i.e., with modularities above the median). Thus, although the final clustering solution retains its robustness, its quality is higher because it does not need to represent poorer solutions that arise from the greedy nature of label propagation.
Phase 3: Transformation of Multimarket Memberships
In general, map projection methods receive relationship matrices (such as the original input matrix
To this end, I propose a new process called multimarket membership transformation (MMT). Broadly, this process entails modifying relationship matrix

Numerical Example of MMT.
Step 1: Create multiple instances for each MMP in the matrix
The first step in MMT is to duplicate the row and column of each MMP in the relationship matrix
Step 2: Capture local relationships for each MMP instance
Consider a focal MMP, denoted MMP
This step is carried out for each instance (pertaining to a specific submarket) of MMP
Step 3: Resolve global relationships
This step returns to the instance of MMP
These global competitive relationships are not accounted for by the previous step and are thus still duplicated across MMP
Phase 4: Map Projection
In its final phase, M4 outputs a two-dimensional market structure map based on modified relationship matrix
Numerical Example
This section demonstrates the M4 framework by means of a numerical example (as illustrated in Figure 2). The example is sufficiently small in terms of the number of products to allow for a straightforward comparison between actual relationships (represented in matrix
For the numerical example, the competitive relationships among nine products are simulated as shown in relationship matrix

M4 Map Based on Numerical Example.
Subsequently, four alternative mapping methods are applied to relationship matrix

Alternative Methods' Maps Bbased on Numerical Example.
Classic MDS is used as a baseline in this comparison. The result shows that classic MDS suffers from circular bending and lumping of products, which disguises the role Product 6 plays in its two submarkets. Moreover, local submarket structures are difficult to discern. To better capture local submarket structures, the comparison includes VOS (Van Eck et al. 2010), a special case of weighted MDS that is related to Sammon mapping (Sammon 1969). VOS weighs relationships by themselves in its optimization process so that weak relationships are considered proportionally less than strong relationships in its map projection. Although VOS does not lump the products corresponding to Submarkets 2 and 3 together, it still isolates Product 6 between its two submarkets. The VOS map also suggests that Products 1 and 2 have a much weaker competitive relationship to each other than is the case.
The more recently introduced DRMABS method (Ringel and Skiera 2016) produces a misleading solution that visualizes Product 6 in only one of its submarkets, thereby suggesting that the MMP does not compete with the products of its other submarket. DRMABS does, however, visualize Products 1 and 2 closer together than MDS and VOS do, which more accurately represents their underlying competitive relationship in matrix
Common to all four alternative mapping methods is that they push Submarket 1 with Products 1 and 2 off to the side on their maps. M4, in contrast, visualizes Submarket 1 between the other two submarkets on its map (see Figure 3). Because the products of Submarket 1 have equal competitive relationships with products of the two other submarkets, the location of Submarket 1 between the other two submarkets in M4's map seems intuitively correct. Nonetheless, I test whether the global market structure suggested by M4 naturally exists or is artificially imposed by M4's MMT process. To do so, I eliminate Product 6's multimarket membership by removing its competitive relationships to the products of Submarket 2 in a new relationship matrix

M4 Map for Numerical Example when Product 6 Competes in a Single Submarket.
M4 again identifies three submarkets but no MMP, which is the expected outcome. The previously identified global market structure in which Submarket 1 was located between the other two submarkets persists in Figure 5, confirming that M4's MMT did not impose any artificial structure. Note that with no MMPs present, M4 and t-SNE produce identical maps. In contrast to t-SNE's map in Figure 4, previously misrepresented competitive relationships are now accurately visualized in Figure 5: Products 4 and 8 are far apart, and Products 5 and 1 are closer to each other than Products 3 and 1 are.
The provided numerical example illustrates M4's ability to visualize both local and global market structures more accurately under the presence of an MMP than alternative mapping methods can. More broadly, the numerical example reveals that the visualization of MMPs in unique map locations can misrepresent their competitive situation, and it can lead to distorted representations of local and global relationship structures among other products.
The numerical example is, however, only an abstraction of real-world markets, which would typically comprise many more products, more submarkets, and perhaps more MMPs, and are likely to have additional relatively weak (or noisy) relationships among products. Together, these factors introduce additional complexity to the relationship structures among products, which most likely hinders obvious scenarios such as the one shown in the provided numerical example. To better understand whether the map distortions suggested by the numerical example might exist in natural empirical settings, additional analysis in the context of the DSLR camera market is presented in Web Appendix D. The alternative methods' maps of the DSLR camera market are subject to distortions similar to those in this numerical example.
Finally, the usefulness of the proposed M4 framework is contingent on the existence of submarkets. This raises the question of how strongly separated the relationship structures (in matrix
Empirical Study of the DSLR Camera Market
An investigation of the market structure in the DSLR camera market demonstrates the value of using M4 over alternative mapping methods in an empirical setting. DSLR cameras are the highest-quality cameras available to consumers. They are used by a broad range of photographers, from aspiring amateurs to professionals. In many cases, camera accessories such as interchangeable lenses are compatible across different models, provided that they are of the same camera system, which is brand specific; consequently, when purchasing a new camera, a consumer who owns such items may be locked into a specific brand.
In what follows, I (1) identify competitive relationships among cameras from consumers’ online searches using neural product embedding, (2) use M4 to visualize the underlying market structure, (3) investigate identified multimarket memberships, (4) test the validity of M4's map, (5) test this approach for robustness against variations in the underlying search data, and (6) compare M4's map with maps produced by alternative mapping methods.
Data
This empirical study follows the work of Ringel and Skiera (2016), who show that consumers’ searches on price comparison sites are a strong proxy for market outcome and that competitive relationships among products can be inferred from clickstreams of consumers searching for products online. Clickstream data of 57,144 consumers searching for DSLR cameras at a price comparison website were collected during the first quarter of 2016. These consumers searched for 111 DSLR cameras produced by nine brands. The website's server log was analyzed because it contains the sequence of product views for each unique visitor across multiple sessions. In addition, product attributes were collected from the website's database to explore M4's map and test it for face validity.
Inferring Competitive Relationships
Ringel and Skiera (2016) construct consideration sets from clickstream data and infer competitive relationships from products’ co-occurrences in these sets. Although this approach is straightforward, it ignores that a clickstream represents a consumer's search over time. All temporal information is lost when a clickstream is collapsed to a set. Intuitively, however, products searched together in temporal proximity may be more strongly related than products searched further apart in time. Such possibility arises, for example, when consumers learn about new products or new attributes during their searches such that they update their preferences and change their product search space (Branco, Sun, and Villas-Boas 2012; Bronnenberg, Kim, and Mela 2016; Fershtman and Pavan 2020; Gardete and Hunter 2020; Greminger 2022; Ursu, Wang, and Chintagunta 2020). Thus, a different approach, namely, neural product embedding, is employed in this study.
Neural product embedding
To consider temporal information in the analysis, competitive relationships among products were inferred from clickstream data using word2vec with skip-gram 5 by Mikolov et al. (2013). Originally developed for natural language processing (NLP) tasks, word2vec embeds words from a text corpus into high-dimensional vector space such that vectors of words that commonly share contexts in the corpus are located in proximity to one another. In contrast to autoencoders, which train against the input through reconstruction, word2vec trains input words against neighboring words in the sentences of a text corpus. The skip-gram architecture thereby receives a word as input and predicts its context, that is, neighboring words, as output. The context is a window around a focal word containing the words that appear before and after it. Word sequence is observed as the context window “slides” across sentences during training. The embedding is updated on the basis of the prediction error when a focal word's vector cannot accurately predict its context. As the training process proceeds, the numerical vectors of similar words are nudged closer together in high-dimensional vector space.
Applied to clickstream data, word2vec creates a product embedding that is based on consumers’ latent preferences for products’ attributes, as expressed by their searches. A clickstream can thereby be thought of as a story about a consumer's search, written by the consumer using products instead of words. Because word2vec does not consider entire clickstreams but rather search sequences within clickstreams (i.e., context windows around focal products), this approach accounts for the possibility that products searched in temporal proximity might be more strongly related than those searched further apart in time. Thus, clickstreams were treated as a temporal continuum without imposing any additional structure on the search data, such as breaking clickstreams up into sessions by rules that require additional assumptions on the part of the analyst.
The ability of word2vec to identify substitutive relationships among products was recently shown by Gabel, Guhl, and Klapper (2019), who applied word2vec to consumers’ shopping baskets to infer and visualize the assortment structure of a grocer. The advantage of such an approach is that it is based on latent product attributes derived from consumers’ behaviors, which eliminates the need to make a priori assumptions on which product attributes to select for the analysis, which in turn minimizes the risk of omitting attributes that might be important to consumers or developing biased views of the market structure (Gabel, Guhl, and Klapper 2019). In contrast to the analysis of shopping baskets, where the sequence of product selection is unobserved, this study exploits word2vec's ability to explicitly consider temporal information (i.e., search sequence via its context window) in consumers’ clickstreams to infer competitive relationships among products.
Noise in search data and stochasticity in neural product embedding
Two more challenges were addressed before the analysis was conducted. First, search data can be noisy. Second, neural product embedding is stochastic in nature, such that multiple trainings on the same data may not produce identical results (Antoniak and Mimno 2018). Both can compromise the robustness of the empirical findings. Thus, a bootstrapping procedure was employed to jointly address both challenges and arrive at a robust solution. Specifically, the procedure is to (1) bootstrap the collected clickstreams with replacement, (2) train a neural product embedding on each bootstrap, (3) generate a weighted graph (i.e., weighted pairwise product relationships) from each bootstrap's embedding, and (4) average products' weighted relationships across bootstraps to obtain the relationship matrix
Steps 3 and 4 of this bootstrapping procedure were necessary because a single relationship matrix
To resolve this problem, a weighted graph (i.e., products’ weighted pairwise relationships in high-dimensional space) was first generated from each product embedding using the first phase of a nonlinear manifold approximation and projection technique called UMAP
6
(McInnes and Healy 2018). Because products’ pairwise relationships in high-dimensional space are now unambiguously identified for each bootstrap, they can be averaged across bootstraps to obtain a robust system of product relationships (i.e., relationship matrix
UMAP's first phase (uniform manifold approximation) is rooted in the idea of constructing simplicial complexes, that is, Vietoris–Rips complexes (Hausmann 1995), from topological spaces to generate a weighted graph in high-dimensional space. This weighted graph is essentially a single fuzzy simplicial complex constructed from the union of fuzzy simplicial sets. The relevant members of each fuzzy set (i.e., its objects) are the neighbors of any given object, whereby fuzzy set membership strengths decay rapidly beyond the set perimeter. UMAP was used in the bootstrapping procedure because it automatically adjusts distance scales according to changing densities of a manifold, which enables it to more accurately capture both global (market) and local (submarket) structures. UMAP's second phase (projection) was not used in this study because it was found to produce inferior results relative to t-SNE's map projection for the DSLR camera market (see Web Appendix E for details).
Accommodating Consumer Heterogeneity
SpeakEasy and t-SNE, which are used inside the M4 framework, are not explicitly designed to model consumer heterogeneity. Nonetheless, the approach for inferring competitive relationships in the DSLR camera market implicitly accommodates consumer heterogeneity. In the clickstream data, each consumer searchers only a small subspace of the entire product space on the basis of their preferences. Because of heterogeneity in consumers’ preferences, these subspaces are not identical across consumers. Accordingly, each consumer in the data only contributes information to relationship matrix
The advantage of this approach is that it generates a single, comprehensive market structure map from many different consumers. Individual competitive relationships are identified from only those consumers who actually shop for the products that pertain to these relationships. In this regard, this approach is fundamentally different from approaches that elicit all pairwise product relationships in a market from all respondents of a study. Particularly, there is no need to make two strong assumptions, namely (1) that all consumers are aware of all products in a market and (2) that all consumers know the vertical and horizontal distributions of products’ attributes.
Nevertheless, the implicit accommodation of consumer heterogeneity is not without limitation. First, heterogenous consumer behavior might not be directly accessible in alternative types of data that relationship matrix
Findings
M4 identified ten submarkets and nine MMPs, that is, cameras that compete in the context of more than one of the identified submarkets. Half of all submarkets are affected by MMPs. Figure 6 shows the market structure map of the DSLR camera market obtained with M4 (see Web Appendix F for enlarged maps). Although the map's two dimensions are latent and thus do not have a global meaning, it is possible to discern drivers of product similarity within and across individual submarkets using ensemble coding that overlays product attributes onto the map by varying bubble color, size, and labels (Ringel and Skiera 2016). To this end, an interactive online tool called mapXP allows readers to easily explore all maps of this study (www.mapxp.app/DSLR).
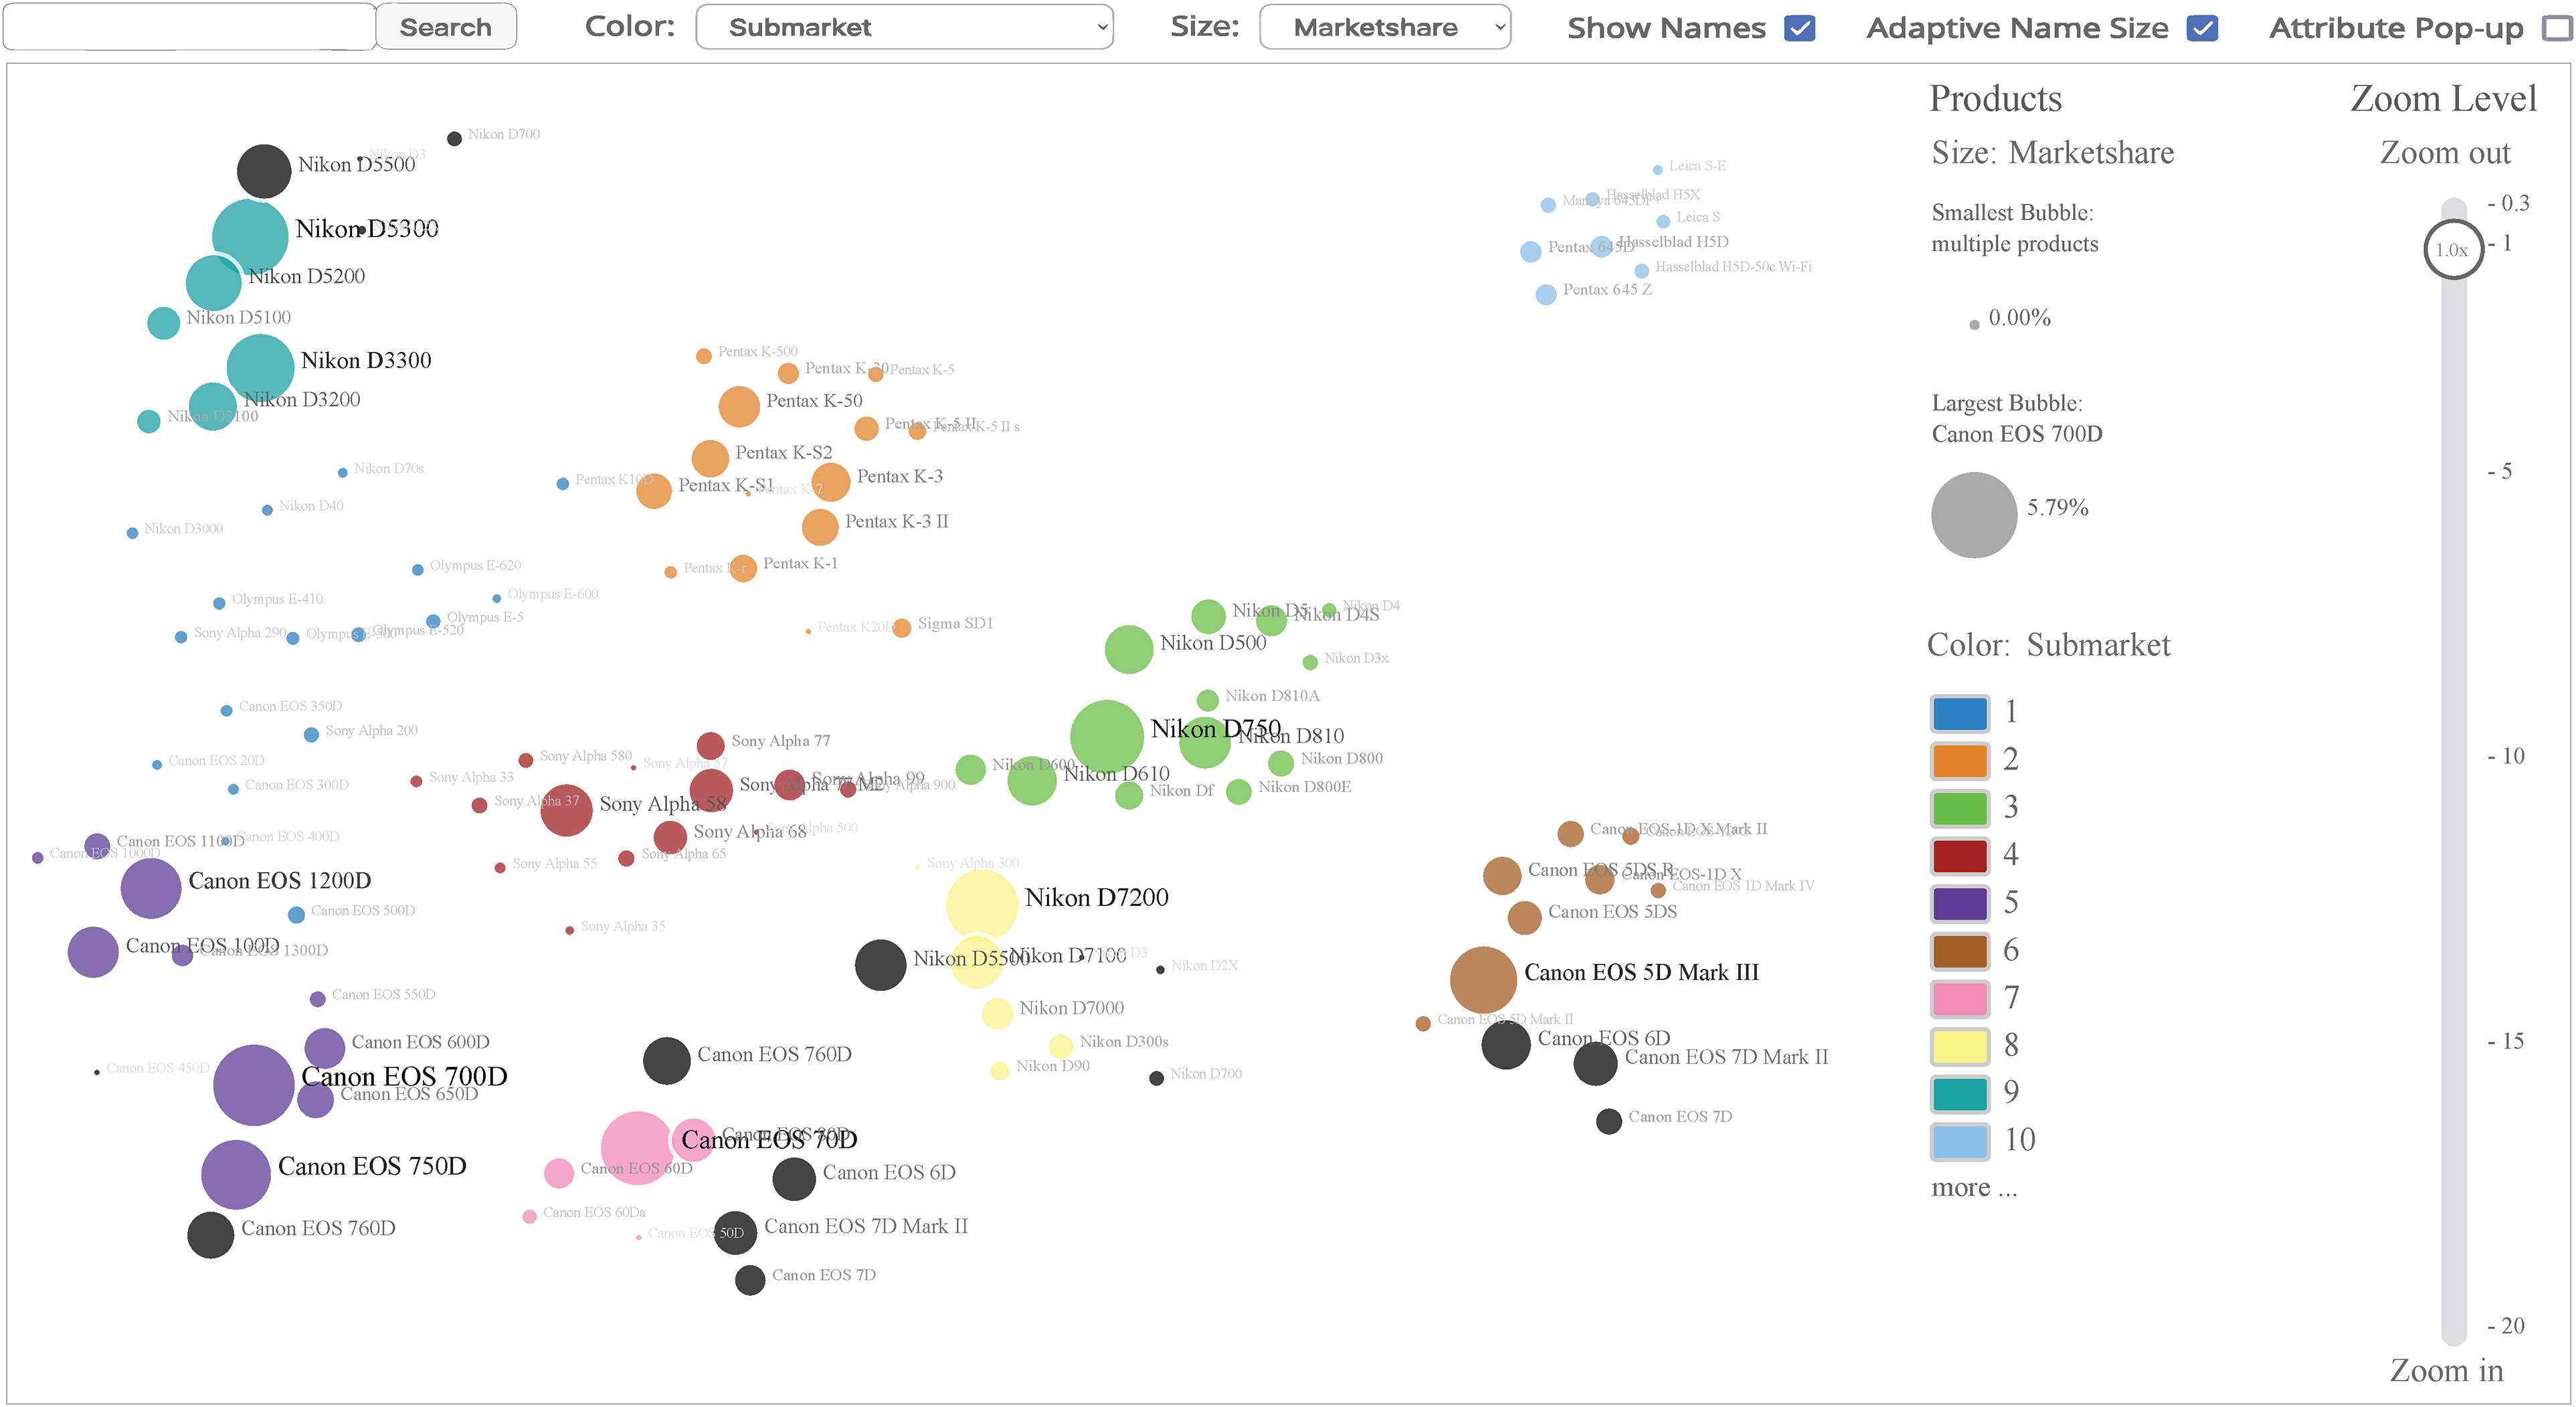
Multimarket Membership Map of the DSLR Camera Market Visualized in mapXP.
Here, mapXP is used to explore M4’s map. As indicated by bubble color in Figure 6, the submarkets that SpeakEasy identifies are well recovered in M4’s map. The most popular DSLR cameras in terms of product views (bubble size in Figure 6) are distributed across the various submarkets where they compete in specific local contexts against other cameras. A closer look at Figure 6 reveals that all identified MMPs (black bubbles) are either Canon or Nikon cameras, which warrants a deeper investigation into how these products are positioned by their manufacturers. Manufacturers of DSLR cameras generally position each camera within one of three product tiers, as indicated in the camera's product description, namely “standard,” “semi-professional,” and “professional” cameras. This split into three product tiers is consistent with the consumer search patterns on which M4's map is based: both Canon and Nikon cameras are largely distributed across three submarkets in M4's map.
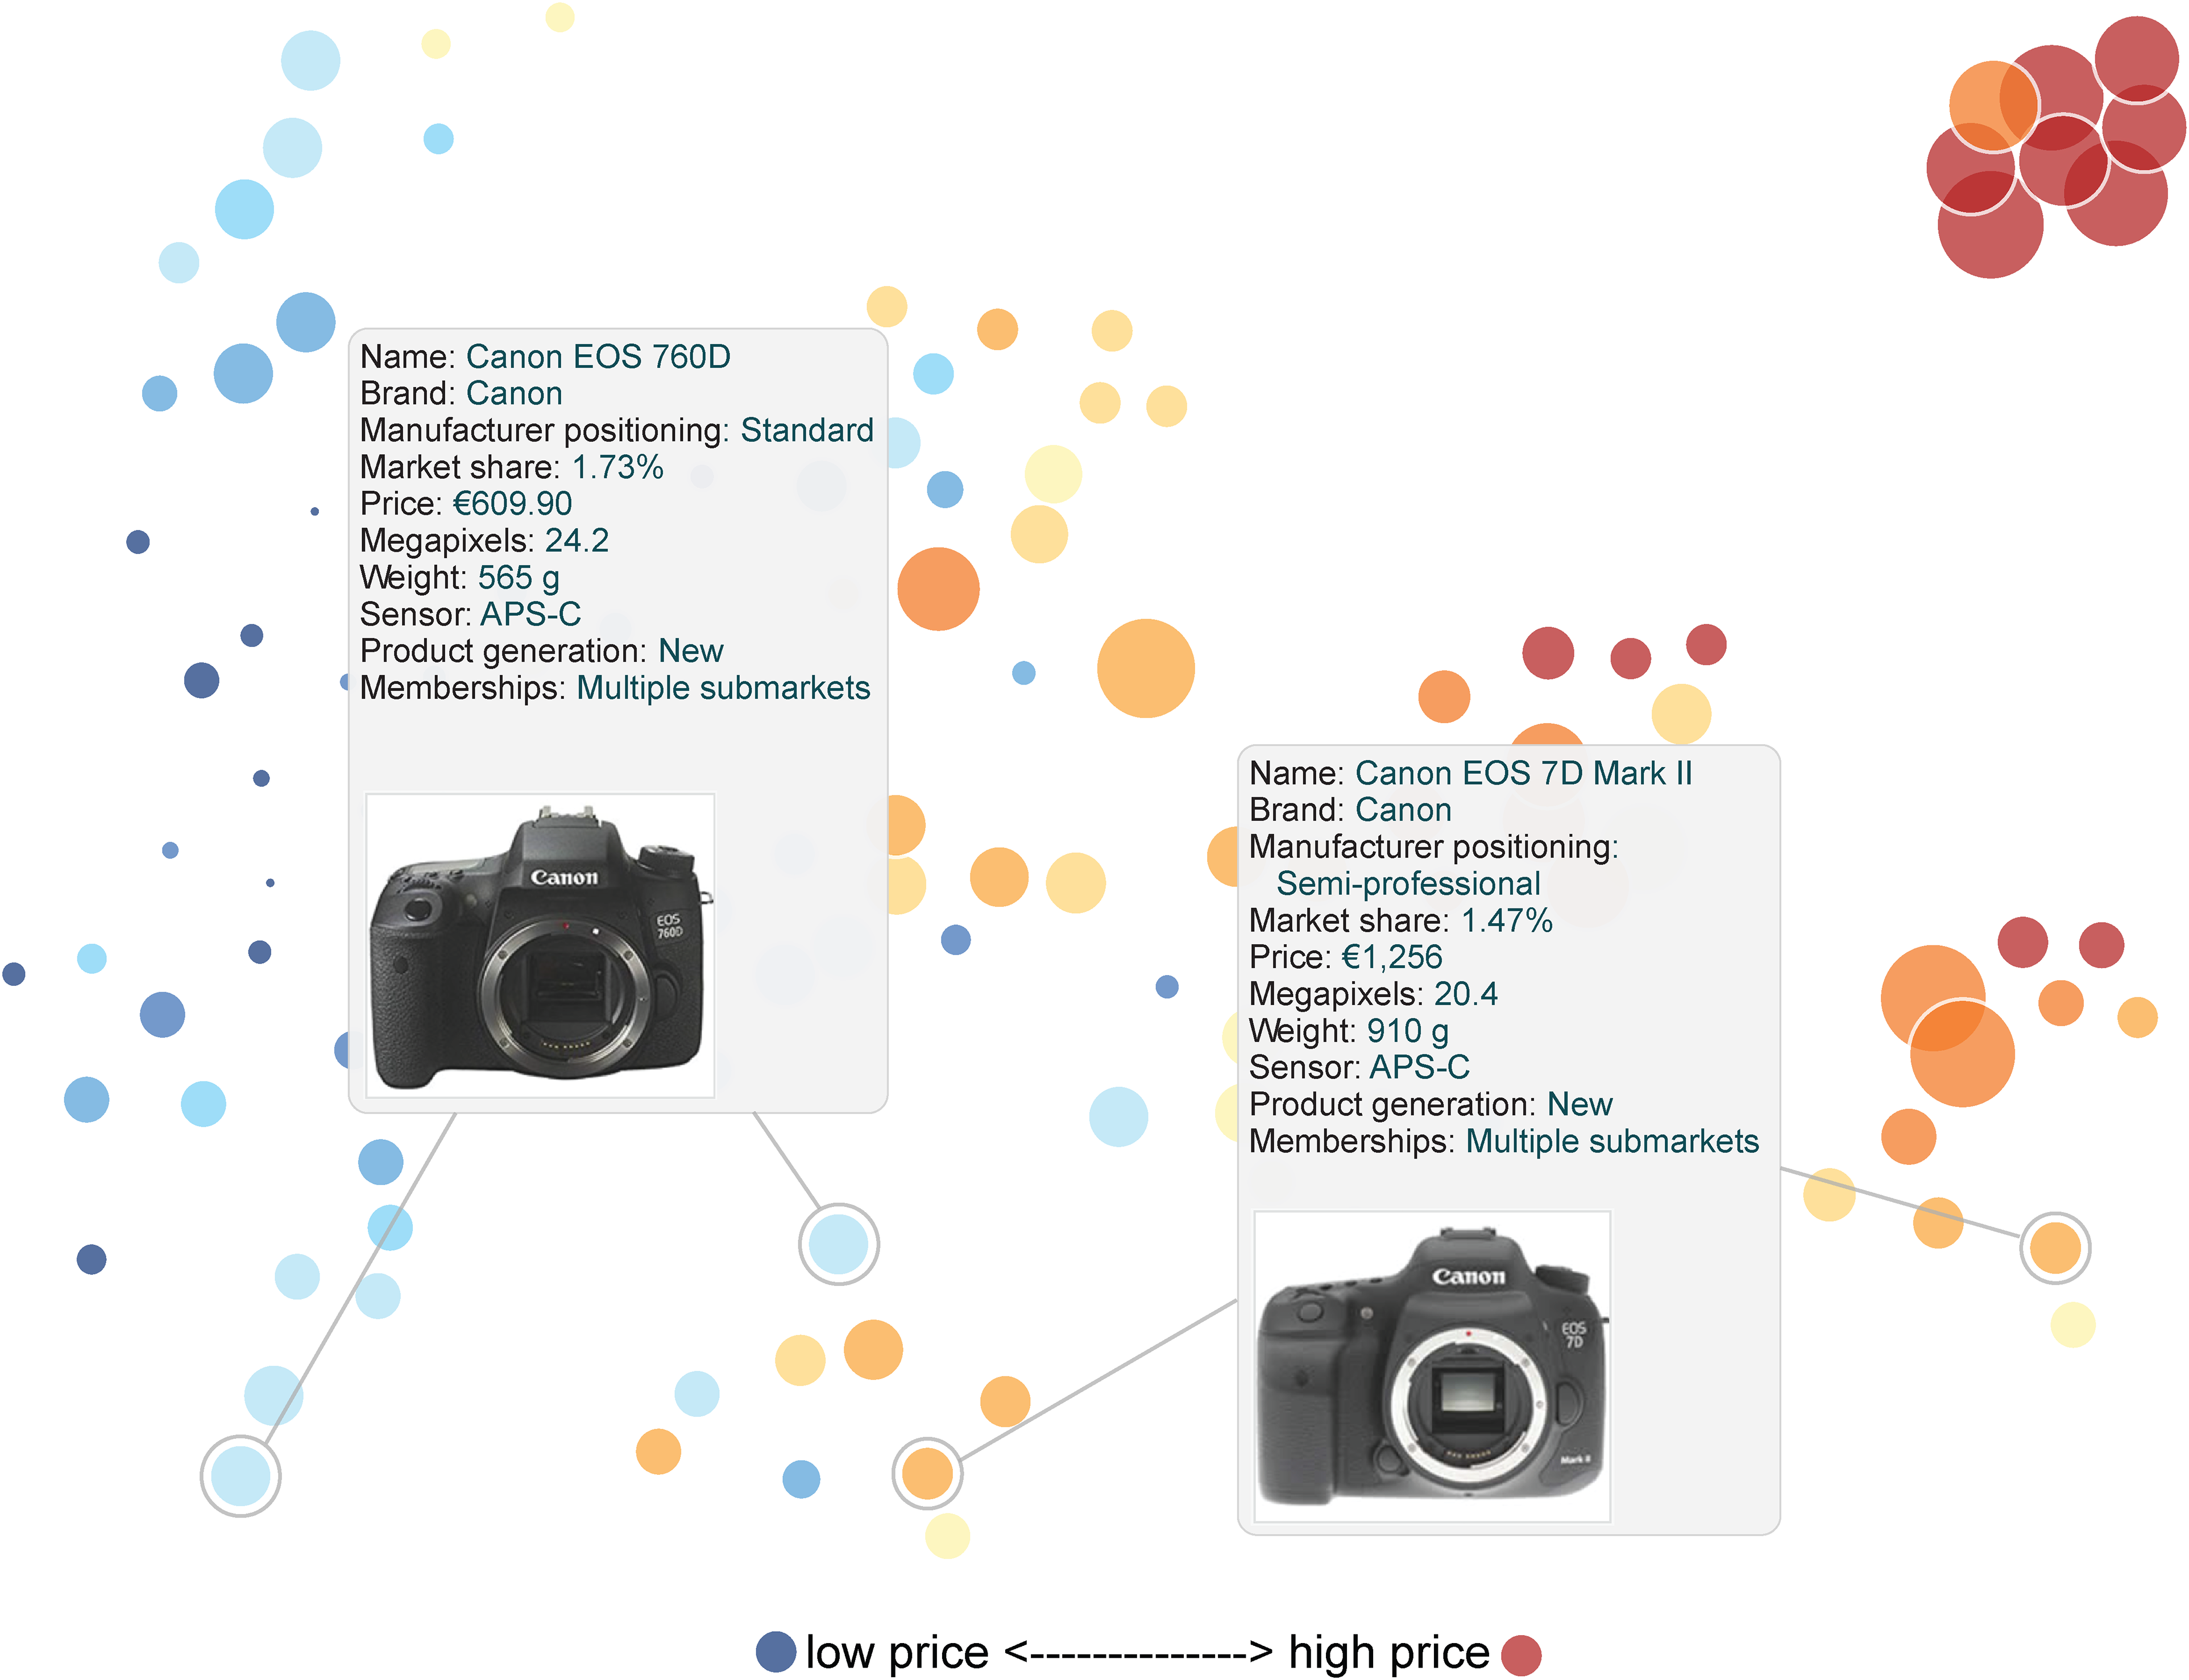
By overlaying manufacturers' positionings over M4's map in Figure 7, one can explore the extent to which manufacturers' positionings are consistent with consumers' perceptions of viable substitute cameras. Overall, cameras of the same product tier are indeed found close to one another on M4's map (as indicated by bubble color in Figure 7). There are, however, exceptions. Most notably, the identified MMPs (labeled with their names in Figure 7) tend to compete across multiple product tiers. For instance, the Canon EOS 760D and EOS 7D Mark II (circled in Figure 7) are positioned by the manufacturer in a lower product tier but are evidently also considered by consumers searching for cameras of a higher product tier.

Manufacturers' Positioning by Product Tier in the DSLR Camera Market.
Assuming higher absolute profits for higher-tier products, this mismatch warrants a deeper investigation into the positioning and pricing of the EOS 760D and EOS 7D Mark II since they may be cannibalizing the sales of Canon's higher-tier cameras. At the same time, these cameras may nudge consumers searching for a lower-tier camera toward considering Canon's higher-tier cameras, which would be favorable to Canon.
To better understand whether such nudging takes place or not, the next step was to examine the raw clickstream data, which capture consumers' actual search patterns, more closely. Specifically, the aim was to investigate whether consumers who view a multimarket membership camera confine their search to only one of the submarkets the camera competes in, or whether consumers continue their search in the respective other submarket after viewing the camera (i.e., transition from one submarket to a different submarket). For Canon's EOS 760D and 7D Mark II cameras, the findings show that consumers largely confine their searches to either one or the other of these cameras' submarkets (see Table 2). Switching between submarkets takes place less frequently with little difference in terms of direction. This pattern is consistent across all identified multimarket membership cameras, with less than 25% of consumers shifting their search from one submarket to another after viewing a multimarket membership camera.
Search Patterns Across Submarkets for Multimarket Membership Cameras.

Notes: To observe submarket switching, the analysis only considers consumers who searched at least three cameras. Submarket numbers are as shown in Figure 6: Submarket 5 (purple); Submarket 6 (brown); Submarket 7 (pink).
Overall, model-free evidence from consumers' underlying search patterns suggests that the MMPs identified by M4 do not serve as transition products that nudge consumers to higher-tier cameras. Instead, the identified MMPs point to potentially harmful inconsistencies in manufacturers' positioning strategies that may need to be revisited. A deeper investigation should also include a financial evaluation of MMPs' net impact on firm profit to determine whether MMPs affect total profit positively despite some (possibly unintended) substitution.
Map Validity
Arguably, market structure maps are only valuable to managers when the competitive relationships visualized therein are valid. Thus, the approach for inferring competitive relationships from search data, and the entailing market structure map, were tested for their validity.
Although the idea to derive competitive relationships from search data on the basis of co-consideration of products has been laid out conceptionally (e.g., Kim, Albuquerque, and Bronnenberg 2011; Moe 2006; Ringel and Skiera 2016), no additional evidence in support of this idea is available. To close this gap, the premise that competitive relationships can be inferred from consumers' searches was tested in a survey of 500 consumers about their use of price comparison sites. The objective was to determine (1) whether consumers actually consider the products for purchase that they search at price comparison sites and (2) when during their decision process consumers use price comparison sites. The survey comprised 15 questions, which are available in Web Appendix G. Respondents were recruited anonymously from a commercial research provider's participant pool. To participate in the study, respondents had to be age 18 years or older and must have shopped online before.
The findings show that over 92% of the price comparison site users in the survey use these sites to view products that they are considering or intend to purchase. Less than 1% view products that they do not consider purchasing, and less than 7% view products that they are only generally interested in. These findings support the idea that consumers' searches at price comparison sites reveal co-consideration and can thus provide insights into competitive relationships. Further, most price comparison site users (56%) visit price comparison sites at different points during their decision process, which supports the approach of considering the temporal proximity of jointly searched products in consumers' clickstreams using neural product embedding.
The next step was to examine how well M4's map recovers consumers' actual search patterns in the underlying raw clickstream data. Specifically, two concentration metrics—the Hirschman–Herfindahl Index (HHI) 7 and entropy 8 —were calculated to test the extent to which consumers' actual searches are concentrated within the submarkets that are visualized in M4's map. The results show a mean HHI of .81 and a mean entropy of .3. Both metrics indicate that consumers' searches are strongly, but not entirely, concentrated in M4's submarkets, which supports the internal validity of M4's map.
The final step was to take a closer look at M4's map to determine whether the visualized market structure can be intuitively explained by camera attributes overlaid onto the map using mapXP. The findings show that M4's map exhibits clear submarket structures that appear to be driven by brand (see the bubble labels in Figure 6). This hierarchy of brand over product is in line with the findings of Voleti, Kopalle, and Ghosh (2015), who modeled brand and product competition using panel data. The pattern may also reflect the high switching costs that consumers who already own a DSLR camera would incur if they moved to a new brand, owing to incompatibility of accessories across brands. The findings further show that manufacturers' positionings (across the three product tiers that were extracted from their product descriptions) are largely recovered in M4's map (Figure 7), with cameras positioned as standard DSLR cameras (fuchsia bubbles) located toward the left, whereas cameras positioned as professional DSLR cameras (gold bubbles) are located toward the right.
The identified market structure also appears to be driven by megapixel and price, as shown in Figure 8, where both consistently increase from left to right and are largely correlated (r = .596). This correlation is to be expected, given that higher picture quality should come at a higher price. There are, however, exceptions, notably among the MMPs. A closer look at Canon's EOS 760D and 7D Mark II cameras reveals that both have attribute levels similar to those of cameras of the subsequent (higher) product tier—for which they were not positioned by their manufacturers (see Figure 8). For instance, the EOS 7D Mark II features a high-resolution sensor (i.e., high megapixels) and a solid camera body (indicated by camera weight) that are both typical for professional cameras. Yet, Canon's EOS 7D Mark II is positioned as a semi-professional camera and priced accordingly at a lower price point than Canon's professional cameras. Thus, the EOS 7D Mark II creates different benefits for consumers shopping for a semi-professional camera (where it is a premium option) than for consumers shopping for a professional camera (where it represents a bargain). The camera's multimarket membership is thus plausible from consumers' perspectives. It is further supported by consumers' actual search patterns, which are largely confined to either of the two submarkets (compare Table 2).
Price and Megapixels in the DSLR Camera Market.
Taken together, these findings support the approach for inferring competitive relationships from online search data and the validity of M4's map: the visualized market structure appears face valid, it can be related back to the underlying clickstreams by model-free evidence, and the identified multimarket memberships can be rationally explained by products' attributes.
Robustness Tests
Several robustness tests were conducted to better understand the extent to which the market structure inferred using M4 is sensitive to variations in the underlying search data. Specifically, the testing involved a tenfold cross-validation in which 10% of the observed consumers were randomly removed from the raw clickstream data of each fold. Three different metrics were then used to systematically test for robustness at the global, local, and individual product levels.
First, the Pearson correlation among all pairs of inferred relationship matrices was calculated to determine how similar the global market structure is across folds, resulting in a mean correlation of .987. Next, to investigate how similar local submarket memberships of cameras are across folds, the Omega index 9 (Collins and Dent 1988) was used. The Omega index builds on both the Rand index and the adjusted Rand index by accounting for disjoint solutions and correcting for chance agreement. It ranges from 0 (no agreement) to 1 (perfect agreement). The mean Omega value of .93 indicates strong agreement. Finally, the extent to which cameras face the same closest competitors across folds was tested. To do so, a metric called k-CC agreement was introduced. This metric measures the mean share of the number of corresponding k closest competitors for each camera between pairs of folds. The mean k-CC agreement of 91% (for k = 5) shows that cameras largely face the same closest competitors across all ten folds. Overall, these results suggest that the inferred market structure is relatively robust to some variation in the underlying search data.
Method Comparison
To better understand the benefits of using M4 in an empirical setting, its market structure map of the DSLR camera market was compared with those of alternative mapping methods (shown in Figure 9). Each market structure map was evaluated in four ways. First, a hit rate (sometimes also referred to as recovery rate) was used to determine how accurately each map represents local competitive relationships among individual products. Second, the accuracy of each map was further qualified with the use of error-weighted classification metrics (i.e., precision, recall, and F1 score). Third, each map was examined to determine how well it visually recovers the global structure of the market (i.e., its submarkets). Fourth, each map was visually inspected for face validity.

Alternative Methods’ Maps for the DSLR Camera Market.
To determine how accurate local competitive relationships are represented in maps, this research uses a metric that is independent of mapping methods’ objective functions but relates directly to the objective of visualizing market structure, namely, to position products on a map in such a way that they are located close to their closest competitors (Faure and Natter 2010). Specifically, this approach follows recent research in market structure visualization that uses a hit rate 10 to measure map accuracy (e.g., Gabel, Guhl, and Klapper 2019; Ringel and Skiera 2016). In this context, a product's hit rate is the share of its top five closest competitors that are among the five products most proximal to it on the map, which is a special case of the rank order agreement by Akkucuk and Carroll (2006). The notion of the utilized hit rate is in line with Waldo Tobler's first law of geography: “Everything is related to everything else, but nearby things are more related than distant things” (Tobler 1970, p. 236). Likewise, according to construal level theory (Trope and Liberman 2010), the more distant an object is from the individual, the more abstractly it will be thought of, whereas closer objects are thought of more concretely. Three different hit rates are used to compare the maps of this study: for all products, for MMPs, and for non-MMPs. The findings show that the M4 framework outperforms all alternative methods on all three hit rates (see Table 3).
Method Comparison in the DSLR Camera Market.

Notes: Error-weighted classification metrics range from 0 (worst) to 1 (best). Omega ranges from 0 (no visual recovery of global structure) to 1 (perfect visual recovery of global structure). Hit rates are robust across the top one, three, and five closest competitors.
To obtain a more nuanced perspective on map accuracy, an approach was borrowed from the performance evaluation of classification models in supervised learning and modified to operate in the context of market structure maps. Specifically, an error-weighted confusion matrix was generated and used to calculate the precision, recall, and F1 score for each map in the comparison. Whereas precision considers the errors related to incorrectly identified competitors, recall considers the errors pertaining to unidentified competitors. The F1 score is the harmonic mean of the two metrics. 11
The prerequisite for a confusion matrix is a classification task for which a method's prediction can be compared with the truth. For the task of accurately projecting products’ competitive relationships onto a map, prediction was defined as the products closest to a focal product on the map, and truth was defined as the competitors closest to the focal product in the underlying data. Then, the products that are closest to a given focal product on a map (in terms of Euclidean distance) are either its closest competitors in the underlying data (true positive [TP]) or are not its closest competitors in the underlying data (false positive [FP]). Further, the products that are not closest to a given focal product on a map are either not its closest competitors in the underlying data (true negative [TN]) or are its closest competitors in the underlying data (false negative [FN]).
In addition, the confusion matrix was weighted by the magnitude of the error between prediction and truth. Specifically, TP, FP, FN, and TN were weighted by the absolute deviations between products’ proximities on the map and their relationship strengths in the underlying relationship matrix such that smaller deviations contribute more to TP and TN (i.e., reward), and larger deviations contribute more to FP and FN (i.e., penalty). The introduced weighting scheme is in line with the objective of classification tasks: TP and TN should be as high as possible, whereas FP and FN should be as low as possible. To obtain absolute deviations between map proximities (
The next analysis in the method comparison was an investigation of how well the generated maps visually recover global market structures (i.e., submarkets). The premise is that the identified submarkets should show up as “groups” or “clusters” of products on the generated maps so that managers can discern them and draw correct conclusions. To determine to what extent this is the case, the Omega index is used to test how strongly the visualized submarket structures resemble the submarkets that were detected in the underlying relationship data (i.e., relationship matrix
Finally, all maps were visually inspected for their face validity. The MDS map in Figure 9 exhibits circular bending and lumping of products, a known weakness of classic MDS, particularly in larger markets. Accordingly, the submarket structures are poorly recovered. Although submarkets are more discernable in the VOS map, they appear to be stretched, with several cameras loosely distributed across the map center. The DRMABS and t-SNE maps exhibit much clearer submarket structures than those of MDS and VOS. However, from a face validity perspective, it is difficult to explain why, in both maps, Submarket 10 (light blue), which consists of top-of-the-line professional cameras, is separated from Nikon's flagship cameras in Submarket 3 (green), although it does appear in the vicinity of Canon's flagship cameras in Submarket 6 (brown). Given that experts generally consider Nikon's flagship cameras as being on par with Canon's flagship cameras, one would expect the top-of-the-line professional cameras of Submarket 10 (light blue) to be in the vicinity of both brands’ flagship cameras. Moreover, Submarket 4 (red), which contains the bulk of Sony's cameras, is pushed off to the top in t-SNE's map near Nikon's cameras, whereas it is located near Canon's cameras in the DRMABS map. Given that Sony has consistently built its presence in the DSLR camera market, where it offers several standard and semi-professional cameras at attractive prices, it seems implausible that Sony's cameras would only immediately compete either with Nikon cameras (as in the t-SNE map) or with Canon cameras (as in the DRMABS map).
The M4 map not only performs best across all metrics in Table 3 but also resolves the structural implausibilities of the other methods’ maps: Submarket 10 (light blue), with its top-of-the-line professional cameras, is close to both Canon's and Nikon's flagship cameras (Figure 6). Sony's cameras in Submarket 4 (red) are located toward the center of the M4 map, where they compete with cameras of multiple brands (Figure 6).
The visualization in Figure 10 reveals more intricate differences between the t-SNE map and the M4 map of the DSLR camera market. The heat map in this figure shows where cameras’ five nearest neighbors differ between maps (i.e., local differences), and circle submarkets that appear in different global map positions. Beyond differences in the global structure (black ellipses) and for MMPs (largely marked in orange, that is, approximately 50% agreement), the figure also reveals more subtle differences for other cameras (largely marked in light blue color, that is, approximately 70% agreement).

Differences Between t-SNE's and M4's Map of the DSLR Camera Market.
Overall, the findings of the method comparison for the DSLR camera market are consistent with those of the numerical example: Beyond identifying MMPs, M4 visualizes both local and global competitive relationship structures more accurately than alternative methods do. Notably, the presence of MMPs also affects how relationships among other products are visually represented on maps, and how accurate these representations are.
Simulation Study
The numerical example and the empirical study of the DSLR camera market both demonstrate the benefits of accounting for MMPs in market structure maps. However, markets may differ in regard to the number of submarkets that constitute them and the number of MMPs that compete across these submarkets. A simulation study was therefore run to compare the maps produced by the M4 framework with those of alternative methods across various market structures.
The LFR graph benchmark by Lancichinetti, Fortunato, and Radicchi (2008) was used to simulate 2,400 unique market structures (i.e., matrices
In total, the simulation study comprises 12,000 market structure maps. The maps of all mapping methods that were used in the numerical example and the empirical study of the DSLR camera market (i.e., MDS, VOS, DRMABS, and t-SNE) were compared with the maps of the M4 framework. Overall, the findings show that the M4 framework consistently produces more accurate maps in terms of hit rate than alternative mapping methods, outperforms them on error-weighted classification metrics, and visually recovers the global structure (i.e., discernable submarkets) best. Consistent with the findings of the empirical study of the DSLR camera market, MDS performs worst on local and global accuracy, followed by VOS, DRMABS, and t-SNE, the next best method after M4. Table 4 presents the percentage gain of M4 over the best alternative mapping method (t-SNE) for all metrics. The findings are statistically significant at the 99.9% level (p < .001 paired sample t-test).
Percentage Increase of M4 over t-SNE in Simulation Study.
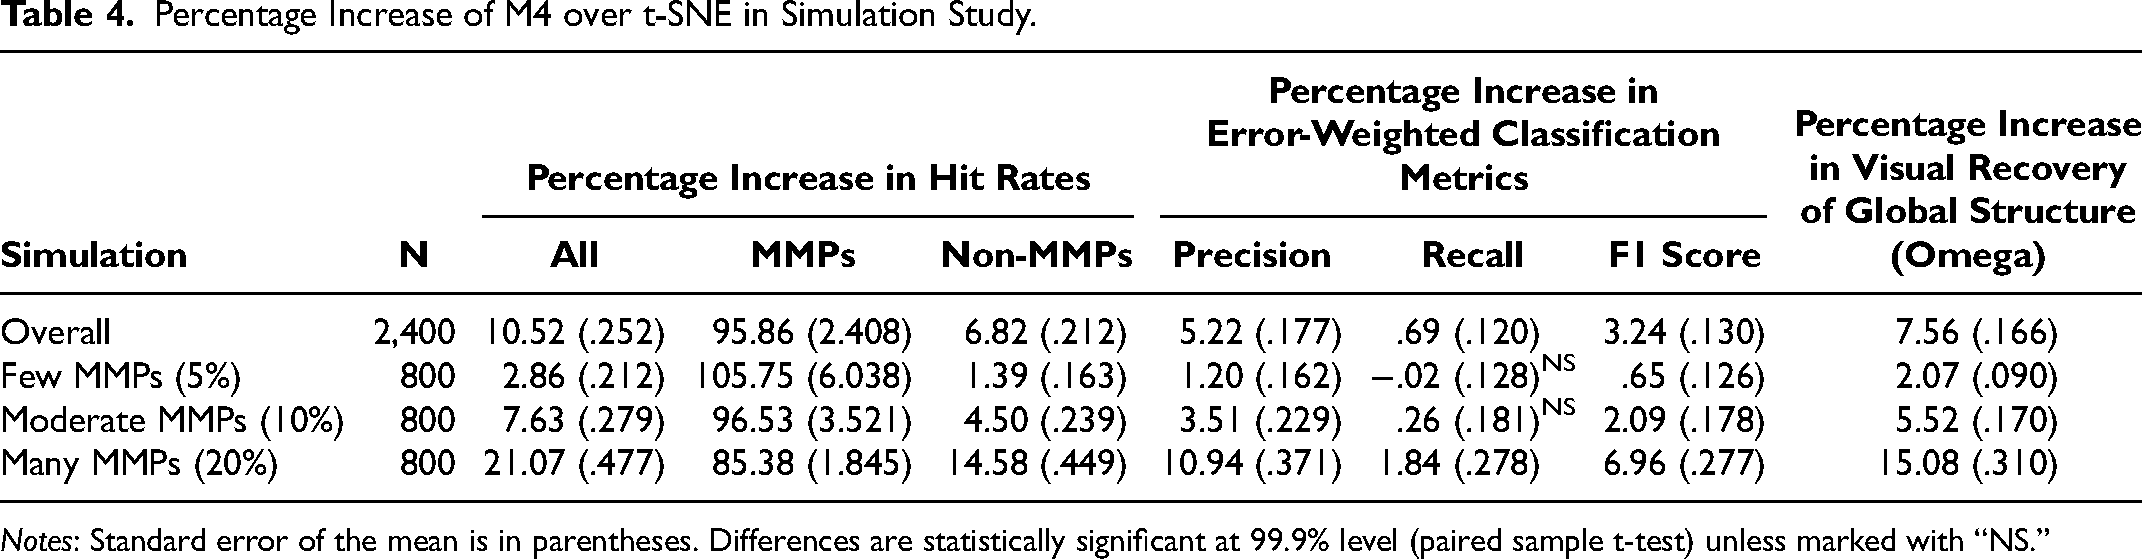
Notes: Standard error of the mean is in parentheses. Differences are statistically significant at 99.9% level (paired sample t-test) unless marked with “NS.”
Notably, both MMPs and non-MMPs profit from M4 in terms of their (local) hit rates. However, the gains in hit rate diminish as the number of MMPs in the market decreases. The same is true for the error-weighted classification metrics and the visual recovery of the global market structure (as captured by the Omega index), which are less impacted in the presence of few MMPs. These findings support the conclusion that (1) the visual representation of MMPs’ competitive positions on market structure maps profits from the M4 framework, and (2) potentially misleading map distortions are less severe when a market has fewer MMPs.
Contributions to Marketing Research
This research offers both methodological and substantive contributions. On the methodological front, it contributes a novel visualization framework called M4 to market structure analysis that is not constrained to visualizing products in single map locations. At its core, the M4 framework connects overlapping clustering with map projection in a novel way—without locking the analyst into a particular clustering or mapping method. This built-in flexibility enables analysts (1) to easily tune the M4 framework to the specificities of other empirical settings and (2) to capitalize on future advances in overlapping clustering and mapping methods.
On the substantive front, this research shows that extant mapping methods are, by their design, not suitable to visualize market structure in markets where multimarket memberships of products cannot be ruled out a priori. In the presence of MMPs, their mapping outputs are subject to distortions that may mislead firms to draw wrong conclusions about the competitors they face, the overall market structure, and the effectiveness of their positioning strategies.
Finally, while the visualization of market structure in larger markets is challenging (Gabel, Guhl, and Klapper 2019; Netzer et al. 2012; Rao and Katz 1971; Ringel and Skiera 2016), so is viewing and exploring the entailing maps. As Heer and Shneiderman (2012) point out, large and complex data sets require tools to sort, select, navigate, annotate, and share data. On that front, this article contributes an interactive map exploration tool called mapXP for use in research and practice. All maps presented in this article can be viewed and interactively explored in a web browser using mapXP (visit www.mapxp.app).
Discussion and Future Research Directions
Visualization of market structures is a valuable means for data discovery and is integral to modern business analytics (Gartner 2018). Representing relationships in graphs supports two critical human capabilities: relational reasoning ( i.e., drawing logical conclusions of how different objects relate to one another) and combinatorial generalization (i.e., constructing new inferences, predictions, and behaviors from known building blocks; Battaglia et al. 2018). The visualization of relationships among objects such as brands, products, or consumers thereby enables managers to solve complex problems that require the synthesis and analysis of diverse and extensive data (Sloman 1996).
The M4 framework proposed in this research is capable of visualizing objects in multiple locations on a single map. This capacity is crucial for obtaining accurate assessments of the structures of markets that contain products that compete in multiple submarkets. In a numerical example, an empirical application, and a simulation, this research shows that ignoring multimarket memberships of products, as alternative mapping methods do, can produce misleading representations of products’ local competitive positions and may even distort the global visualization of the underlying market structure.
In this research, M4 is compared with alternative map projection methods of various research disciplines, including marketing (i.e., classic MDS, DRMABS), scientometrics (i.e., VOS), and computer science (i.e., t-SNE). Although t-SNE is incorporated into the M4 framework in this research, alternative pairings are possible and are investigated in Web Appendix C. The analysis shows that, with the exception of classic MDS, all alternative mapping methods improve in the presence of MMPs when they are incorporated into the M4 framework.
Nevertheless, one should not conclude that MDS is generally inferior to alternative mapping methods solely because it performed poorly in the context of this research. MDS is an established method in marketing whose limitations are known. For instance, MDS solutions tend to deteriorate as the number of stimuli (e.g., products) increases—particularly for low-dimensional maps (Faure and Natter 2010). In addition, large stimuli sets may be sparse such that many relationships are missing or zero (see Ringel and Skiera 2016), which further degrades MDS's solution quality (Malhotra, Jain, and Pinson 1988). Indeed, in the case of the DSLR camera market study, over 30% of all possible relationships among DSLR cameras are never observed in over 57,000 clickstreams. However, in scenarios where all pairwise relationships among products are available, their magnitudes are known, and triangular inequality is satisfied, classic MDS performs well—even in the presence of MMPs if MDS is integrated into the M4 framework (see Web Appendix H for a more elaborate discussion and empirical analysis).
Finally, MDS is a family of methods, of which classic MDS is used as a baseline in this research. Variants of MDS can provide additional benefits, such as modeling competitive asymmetry (e.g., Kim, Albuquerque, and Bronnenberg 2011), performing segmentation and positioning simultaneously (e.g., DeSarbo, Grewal, and Scott 2008), or explicitly considering consumer heterogeneity (e.g., Carroll and Chang 1970). To this end, a potential alternative to M4's MMT process might be INDSCAL (individual difference scaling analysis), which is an extension of classic MDS that considers consumer heterogeneity. To implement INDSCAL in the context of this article, submarkets would need to be conceptualized as layers in the third dimension of the three-way similarity matrix (i.e., submarket × product × product) that INDSCAL operates on. This idea is tested in Web Appendix I under the presence of MMPs. Although INDSCAL shows improvement over classic MDS across all performance metrics, it still falls short of what can be achieved with alternative mapping models.
That said, the M4 framework proposed herein is an addition to the literature on market segmentation and market structure visualization, not a replacement for previous methods. Methodologically, it overcomes a central constraint of alternative mapping methods: their requirement for objects (e.g., products) to appear in single map locations. By connecting overlapping clustering and map projection in a novel way, the M4 framework allows each product to appear in the local competitive context of every submarket it competes in. Compromises such as visualizing products somewhere between the submarkets they compete in are no longer necessary. Note that the idea of the MMT process, which is at the core of the M4 framework, could be operationalized in alternative ways to account for extremely large product assortments, for example (see Web Appendix J for a suggestion).
Substantively, this research shows that firms and researchers should reconsider the use of extant mapping methods in markets where multimarket memberships of products cannot be ruled out a priori. In case of the DSLR camera market, 50% of all submarkets were affected by MMPs. Unlike traditional market structure maps, M4's maps enable managers to identify and investigate products’ multimarket memberships within their local competitive contexts while preserving the market's overall (i.e., global) structure. As the empirical study demonstrates, a deeper investigation of phenomena observed in the M4 map can reveal how submarkets are affected by MMPs and whether the identified multimarket memberships are harmful or represent opportunities for firms. Managers can then use these insights to review and adjust their marketing mix decisions (e.g., adjust prices, communicate different positionings, change feature levels). By repeating the analysis over time, managers can track the impact of such adjustments and fine-tune their marketing mix further (Matthe, Ringel, and Skiera 2022). Researchers, in turn, can use M4 to quickly determine whether and where additional statistical analyses are required, what to look for, and where to look for it in the data. A browser-based tool, mapXP (www.mapxp.app), facilitates the interactive viewing, exploring, and sharing of market structure maps within firms and among researchers.
While this research demonstrates the value of M4, it is also subject to some limitations. First, as outlined at the beginning of this article, visual data discovery should not be understood as a substitute for deeper statistical analysis. Instead, the two are complements, whereby the former serves as a crucial starting point that informs the latter (Anscombe 1973). Second, the M4 framework is not appropriate for applications in which multimarket membership objects serve as transition points between clusters across which information, people, money, or other units flow. It may be more appropriate to visualize objects between clusters in such specific cases. An alternative possibility is to extend M4's map to incorporate arcs with arrowheads that connect objects to multimarket membership objects, thereby making the flows across clusters apparent (this functionality is already built into mapXP for future research applications). Third, M4 is not recommended for use in an empirical setting where submarkets are poorly separated (i.e., modularity < .20). Fourth, the sample of over 57,000 consumers searching for DSLR cameras at the price comparison site may not fully represent the entire population. Although this sample is substantial, a possible self-selection bias cannot be ruled out: some consumers may simply not search online, just as some consumers simply do not participate in surveys. Fifth, the M4 framework should not be perceived as a fully automated process that requires no judgment on the part of the analyst. In particular, it is recommended that analysts use those overlapping clustering and map projection methods within the M4 framework that are most appropriate for the particular empirical setting they are analyzing.
Nonetheless, it cannot be ruled out a priori that products meet consumer preferences of different submarkets and even compete across traditional product-market boundaries—particularly under high levels of product variety, complexity, and versatility (Day, Shocker, and Srivastava 1979; Shocker, Bayus, and Kim 2004; Urban, Johnson, and Hauser 1984; Yang, Zhang, and Kannan 2021). Instead of ignoring the complexity that arises from such relationship structures, the M4 framework embraces it and offers a first avenue toward better harnessing such complex relationship structures in market structure visualization. Because the M4 framework is flexible and can easily be generalized to any system of relationships among objects, it is broadly applicable to various research problems in marketing and beyond.
Future directions for research include visualizing brand positionings and brand associations within and across multiple communities in social networks, investigating the effect of multimarket memberships on firm valuation and performance, identifying cobranding and copromotion opportunities in retail assortments on the basis of multicategory memberships of SKUs, discovering multitopic memberships in citation networks and their relationship to research impact, studying consumer needs and choices (that depend on usage context and situation), and tracing supply chains (where firms are associated at various levels), to name a few. On the methodological front, potential extensions of the M4 framework include explicitly modeling consumer heterogeneity, explicitly modeling brand product hierarchies, capturing competitive asymmetry, and analyzing the formation and evolution of MMPs' positions over time.
Supplemental Material
sj-pdf-1-mrj-10.1177_00222437221110460 - Supplemental material for Multimarket Membership Mapping
Supplemental material, sj-pdf-1-mrj-10.1177_00222437221110460 for Multimarket Membership Mapping by Daniel M. Ringel in Journal of Marketing Research
Footnotes
Appendix
The MMT process can be described formally as follows: Let
Multiple instances of each product
Acknowledgments
This article is based on the author's dissertation. The author thanks an anonymous price-comparison site for supplying search data for this research. The author is particularly grateful for the support and valuable feedback of Bernd Skiera, Jan-Benedict Steenkamp, and Valarie Zeithaml. The author thanks the anonymous JMR review team for their many constructive comments and excellent guidance. This article also profited from the comments and suggestions of André Martin and Maximilian Matthe, as well as from the feedback of the marketing faculties at Dartmouth College, George Washington University, Goethe University Frankfurt, the University of North Carolina at Chapel Hill, and the University of Technology Sydney.
Associate Editor
Eric Bradlow
Declaration of Conflicting Interests
The author(s) declared no potential conflicts of interest with respect to the research, authorship, and/or publication of this article.
Funding
The author(s) disclosed receipt of the following financial support for the research, authorship, and/or publication of this article: This work was supported by the German Research Foundation, Deutsche Forschungsgemeinschaft (grant number SK 66/9-1).
Notes
References
Supplementary Material
Please find the following supplemental material available below.
For Open Access articles published under a Creative Commons License, all supplemental material carries the same license as the article it is associated with.
For non-Open Access articles published, all supplemental material carries a non-exclusive license, and permission requests for re-use of supplemental material or any part of supplemental material shall be sent directly to the copyright owner as specified in the copyright notice associated with the article.