
Abstract
Obesity is increasing worldwide, and in many countries, the problem is particularly serious among lower-income groups. Front-of-pack nutritional warning labels are a prominent regulatory tool to fight obesity and have been implemented or are currently being debated in many countries. Existing studies document that warning labels incentivize consumers to substitute away from unhealthy products. However, not much is known about equilibrium price changes in response to consumers’ utility for warning labels. Using household purchase data in the cereal category, this article studies the adjustments of prices after the mandatory introduction of warning labels in Chile. The authors develop a model showing that warning labels lead to higher prices of labeled cereals, as is also observed in data. In contrast, prices of unlabeled products tend to drop or at least increase less, incentivizing price-sensitive consumers to remain in the category. The authors decompose postlabeling market share adjustments into a pure label effect that fixes prices at initial levels after regulation and a total effect that accounts for price reoptimizations. Their findings point to self-enforcing effects of a warning label regulation as the price adjustments amplify policy makers' goal of reducing unhealthy food intake, especially because market forces incentivize low-income segments to choose healthier alternatives.
Obesity and overweight are widespread: globally, 1.9 billion people are obese or overweight (Di Angelantonio et al. 2016). In many countries, the problem is particularly serious among households with lower socioeconomic status and lower income (Herrera, Lira, and Kain 2017; Loring and Robertson 2014). Moreover, obesity is often inherited by descendants of lower-income households (Appelhans et al. 2014).
Mandatory front-of-pack labels that warn consumers about which food options have high levels of sugar, calories, sodium, or fat constitute a prominent regulatory tool. These labels have been introduced in Chile, Israel, Peru, and Uruguay, but they are being considered in many other countries. To date, studies have mainly focused on how such nutritional warning labels affect consumer purchasing behavior (e.g., Araya et al. 2021; Ares et al. 2018; Machín et al. 2019; Tórtora, Machín, and Ares 2019). However, not much is known about the effect of warning labels on price-setting behavior. The changes in consumer purchasing behavior induced by the warning label regulation may (inadvertently) cause manufacturers and retailers to adjust prices of both labeled and unlabeled alternatives. The directions of price adjustments are not clear up front, however. We contribute to this literature by empirically investigating the impact of the warning label regulation in Chile that came into effect in July 2016 on market prices in the breakfast cereal category. Our analysis helps policy makers understand the long-term effects of warning labels. This is important, as the regulation may backfire if firms decrease the prices of labeled products and increase the prices of unlabeled products in response. We model postlabeling price changes as the decisions of profit-maximizing economic agents, using a Nash–Bertrand equilibrium model with vertical structure (e.g., Villas-Boas 2007). In addition to examining the empirical effects in the Chilean cereal market specifically, we also identify the conditions in our structural analysis under which our findings generalize to other environments.
Using purchase data from Chilean households in the period of two-and-a-half years before and one-and-a-half years after the warning label regulation, we estimate our equilibrium model of demand and supply and find that prices of labeled cereal products rise in response to the warning label introduction. This is a striking pattern, as one might expect that the negative utility for choosing unhealthy cereals revealed by the warning labels would lead to a drop in consumers’ willingness to pay, all else being equal. In this scenario, it seems optimal for labeled products to decrease prices to mitigate the drop in demand (see, e.g., Dubois, Griffith, and O’Connell [2018], who study the impact of an advertisement ban for junk food such as potato chips and find a drop in equilibrium prices). However, in our case, we find that more price-sensitive households update more negatively on labeled products (referred to as a “composition effect” hereinafter). Because of this, labeled cereals face a larger portion of less price-sensitive consumers than before, rationalizing raised prices after regulation.
With respect to adjustments of unlabeled cereal prices, economic intuition might suggest that firms would react by raising prices, exploiting the fact that a significant number of cereals got hit with the warning labels after regulation. However, our counterfactual simulations imply a decrease in prices for the majority of unlabeled cereal products. This decrease, together with the increase in prices of labeled cereals, is a desirable but unintended side effect of the warning label regulation strengthening policy makers' goal of leading consumers to avoid labeled (“bad”) foods and improve their nutritional intake. The reason for the downward pressure in prices is that a larger fraction of price-sensitive consumers started buying unlabeled, healthier cereals after the regulation.
Our findings provide guidance for predicting the likely direction of price adjustments in other markets if policy makers can, for example, anticipate which consumers will be most responsive to the introduction of warning labels—price sensitive (generally lower socioeconomic groups with lower income) versus less price sensitive (higher socioeconomic groups with higher income).
The empirical framework used in this article has flexible specifications of unobserved heterogeneity in model parameters, including response to warning labels, brand preferences, and price sensitivity. This is important because the empirical distribution of heterogeneity determines to a large extent how firms adjust prices in response to the introduction of warning labels. We propose a hierarchical Bayesian approach to handle the computational burden in a feasible and intuitive way, using flexible mixtures of normals as first-stage priors, coupled with economically motivated constraints (e.g., Allenby et al. 2014; Pachali, Kurz, and Otter 2020).
Our work has several implications for policy makers. In our structural analysis, we decompose postlabeling market share adjustments into a pure label effect (fixing prices at initial levels) and a total effect (accounting for both the pure label effect and equilibrium price adjustments). We find that the warning label regulation leads to a price equilibrium that facilitates policy makers' objective, as labeled cereals lose market share while unlabeled products gain market share due to price adjustments. Although the effects of price changes vary in magnitude across product groups, they are substantial for cereals that carry both calorie and sugar warning labels. This is important and desirable from the policy maker's perspective, because we find that consumers have a much weaker response to the presence of this particular warning label combination before price adjustments. Another appealing aspect of the price changes is that they induce the highest positive effect to people in the lowest socioeconomic group due to this group’s higher sensitivity to prices. This group is of particular interest to policy makers in the fight against obesity (Loring and Robertson 2014).
The remainder of the article is organized as follows. We first discuss related literature. Next, we discuss the data and provide details on the setting in Chile. Following this, we discuss the model and estimation. Then, using the estimation results, we isolate the equilibrium price adjustments in response to the warning label legislation and offer an in-depth discussion about the implications for consumers and policy makers. We close with conclusions.
Related Literature
While warning labels are unique in that they stress the negative aspects of products’ nutritional compositions, relatively little is known about their effects on market prices. However, there is a large body of literature on related nutrition labels. Combining evidence from over 60 studies, Shangguan et al. (2019) evaluate the empirical evidence for the effect of food and beverage labeling on consumer behavior. Overall, the authors document large consumer responses to food labeling interventions, including a 6.6% reduction of consumers’ energy intake as well as a 10.6% reduction of total fat intake. Focusing on real-life grocery shopping conditions, Dubois et al. (2021) conclude that nutritional labels show rather modest effects on the nutritional quality of the foods purchased in four categories. In another recent study, Lim et al. (2020) investigate the effect of nutritional “Facts Up Front” labeling on products’ nutritional quality. The authors document a competition effect of the policy that leads to an improvement in the nutritional quality of other products in the category.
Recent academic studies have also focused on the effects of the mandatory front-of-pack warning labels that we consider. In a meta-analysis, Ikonen et al. (2020) show that—among the various regulatory tools of nutritional labeling—warning labels are most effective in guiding consumers to choose healthier food products. In a real-life setting, Araya et al. (2021) leverage differences in the timing of the implementation of warning labels a few months before the regulation to identify the impact of warning labels on consumer behavior in one specific supermarket chain. The authors find strong effects on demand of warning labels in the cereal category but no effects in the chocolates and cookies categories. In summary, research shows significant consumer responses to mandatory food labeling regulations that broadly correspond to our analysis. Our work contributes to this literature by providing additional insights. For example, we investigate the demand effects of multiple warning labels. We find that the negative impact of a label on consumer utility is weaker for cereals that are high in calories and sugar than for alternatives that are solely high in calories. This is consistent with an interpretation that, before labels were introduced, consumers were more aware of the health risks with consuming sugar relative to consuming calories.
The primary focus of our study, however, is on supply-side price responses to the introduction of warning labels. Other research investigates the impact of the Chilean regulation on product reformulations. In a related study, Alé-Chilet and Moshary (2022) provide evidence that the regulation incentivized manufacturers to reformulate their nutritional compositions just below the critical cutoffs specified by policy makers in 2016. Using a discrete-choice model of consumer demand, Alé-Chilet and Moshary show that reformulations contributed to modest reductions in calorie consumption on the order of 4%, but no statistically significant reductions of sugar content of cereal purchases. However, many cereal products did not reformulate in response to the regulation: according to Reyes et al. (2020), 61% of breakfast cereals still had a label in 2017—one year after the regulation came into effect. This outcome is consistent with evidence in Moorman, Ferraro, and Huber (2012), who study how firms responded to standardized nutrition labels on food products required by the Nutrition Labeling and Education Act in the United States. The authors show that firms are more likely to improve brand nutrition if they have lower market share in a category. The reason for this finding is that manufacturers are more hesitant to change the recipe of more popular products. Because many major manufacturers did not reformulate their products in response to the warning label regulation, it therefore remains an important question how manufacturers and retailers should optimally navigate their prices between labeled and unlabeled products. We contribute to this literature by rationalizing the observed price increases of less healthy cereals as the outcome of a consumer “composition effect.” Our finding that products with warning labels become relatively more expensive suggests self-enforcing effects of a warning label regulation that, to the best of our knowledge, have not been documented before. The equilibrium adjustments amplify policy makers' attempts to reduce unhealthy nutritional intake. The main reason for this is that market forces incentivize price-sensitive, low-socioeconomic-status households to consider healthier alternatives.
Regulatory Setting and Data
The Chilean Warning Labels Regulation
Faced with a sharp increase in overweight and obesity, as well as a rise in associated diseases, Chile was the first country to implement nutritional warning labels. Beginning in July of 2016, all products containing an above-threshold amount of calories, sugar, saturated fat, and/or sodium had to display warning labels on their package front (Food and Agriculture Organization of the United Nations [FAO] 2017). The thresholds for each of the nutrients are based on guidelines by the World Health Organization and specified per 100 grams or milliliters. When products reach the limit on more than one nutrient (e.g., calories, sugar), warning labels for all these nutrients must be displayed. Figure 1 provides an overview of all possible warning labels for food products in Chile after the regulation was implemented.

Overview of Labels in Chile, Signaling Excess Sugar, Calories, Saturated Fat, and Salt, Respectively.
The warning labels indicate that the product is “high in” the particular nutrient (e.g., “high in calories”). The bottom of each label states that the source of the warning is the “Ministry of Health.” A government manual outlines the requirements for the size and the position of the labels, ensuring that they appear on a prominent place on products’ package fronts. Because childhood obesity also rose sharply in Chile, additional regulations were introduced concurrently to limit the targeting of labeled, less healthy, products to children. In particular, the advertising of labeled products on TV, websites, or other media aimed at children younger than 14 years was restricted, and manufacturers had to remove iconic cartoon figures from the packages of products with warning labels.
The food industry did not welcome the new regulation. Manufacturers such as Kellogg's and PepsiCo (Quaker cereals) contested the new regulation in court, arguing that it infringed on intellectual property rights (Jacobs 2018). AB Chile, a food industry association, launched a campaign stating that the regulation would be ineffective (FAO 2017). However, these efforts did not succeed at changing the labeling policy. Facing the prospect of large fines, all manufacturers eventually complied with the regulation and displayed the labels on their products at the starting date.
Data Sources, Preparation, and Summary Statistics
For our empirical investigation, we use representative household panel data from Kantar Worldpanel Chile for the period 2014–2017, covering two-and-a-half years before and one-and-a-half years after the implementation of the new regulation. Data were collected through a combination of in-home scanning and interview scanning. Households with an internet connection scanned all their purchases after a trip to a supermarket with an electronic hand scanner. Households that did not have an internet connection kept the packages of all their purchases and were visited weekly by an interviewer from Kantar who scanned them on their behalf. 1 The data include household purchases in the ready-to-eat breakfast cereal category as well purchases in other product categories. We have information on purchases and demographics (household size and socioeconomic status) for 2,660 Chilean households. Furthermore, the data contain the brand, subbrand, and package size of each cereal product and the presence of each type of warning label during the observation period. We verified the presence of the warning labels using retailer and manufacturer websites and through store visits. We also use these sources to identify whether cartoon figures appeared on the labeled products prior to implementation of the new regulation.
A potential concern is that the warning label regulation may have incentivized manufacturers to reformulate their nutritional compositions to levels just below the critical thresholds. Because the focus of our article is on price adjustments of the major cereal products, we investigated whether manufacturers adjusted the nutritional compositions of major products in our sample to the extent that the presence of labels changed. The major cereal products we include as inside goods in our analysis did not reformulate their nutritional compositions during our observation period. This is consistent with evidence in Moorman, Ferraro, and Huber (2012), who show that manufacturers are more hesitant to change the recipe of more popular products. This implies that the presence of warning labels remained stable for the inside goods in our analysis throughout our observation period. 2
We obtain matching advertising expenditure data for the same time period from the Chilean media research company Megatime. To capture the immediate and delayed effects of advertising, we use an adstock specification (see, e.g., Dinner, Van Heerde, and Neslin 2014). Because the data include advertising expenditure at the product level, we are able to control for changes in advertising expenditure of labeled and unlabeled products after labeling started. 3
For each choice occasion, we impute prices for the nonchosen products based on the transactions reported in the panel data. We restrict our analysis to the top six retail chains (about 80% of overall market share in the cereal category), because the inclusion of infrequent shopping trips to smaller chains makes it difficult to impute prices for nonchosen alternatives.
Some manufacturers had already put warning labels on their product packages several weeks before the official deadline (see Araya et al. 2021). To reliably estimate the effects of the warning labels on household utility, we disregard all purchases made from January 2016 to June 2016. We chose six months as an initialization period for the adstock variable, excluding all purchases made from January 2014 to June 2014 in the demand estimation. Moreover, we follow the discrete-choice literature (see, e.g., Dubé, Hitsch, and Rossi 2010; Geyskens, Gielens, and Gijsbrechts 2010) by considering only households that bought cereal at least four times in our data. This leaves us with a total of 1,442 unique households for our estimation sample and a total of 34,297 cereal purchase incidents.
Table 1 summarizes the sample of households used in our demand estimation. Chile is a country with a high level of inequality. In our sample, almost 60% of households have a low socioeconomic status, and the remainder have a lower-middle or upper-middle status. 4 Income is an important criterion for households’ classifications into different socioeconomic groups; in this article, we also refer to households with a low socioeconomic status as “low-income households.”
Description of Household Sample and Characteristics.

Because estimating demand for each individual stockkeeping unit (SKU) is intractable, we aggregate SKUs of the same combination of “brand–subbrand–package size–warning label” into products. Furthermore, not all package sizes can be individually incorporated into our demand model. For instance, we group SKUs of the same product with roughly similar package sizes (e.g., 400 g and 500 g) and aggregate them to two package sizes (medium: 500 g and large: 1,000 g). We also group minor subbrands together as fringe brands to keep the model tractable. The “discrete-choice” assumption seems to be satisfied for breakfast cereal purchases because 91.2% of the cereal purchase trips result in the purchase of a single product. 5
Only two of the four warning labels presented in Figure 1 are applicable to the cereal category during our period of study: (1) high in calories and (2) high in sugar. Moreover, the sugar label only appears in combination with the calories label. This means there are four broad product groups to distinguish: (1) high in calories, (2) high in calories and sugar (hereinafter referred to as products with a calories + sugar label), (3) unlabeled, and (4) outside good. Unlabeled products are products that do not violate the nutrition guidelines. We define “outside good” as households’ shopping trips to one of the six considered grocery retailers where no breakfast cereal item is purchased (similar to, e.g., Bronnenberg, Dubé, and Sanders [2020]). Market share per group is computed based on the number of purchases made by households in our sample. The (unweighted) yearly average prices are computed based on households’ reported transaction prices in the panel and thus include price promotions. We also account for the impact of inflation and express all prices in real terms with regard to the first year of our observation period (2014).
Table 2 summarizes the development of conditional and unconditional market shares over time. For conditional market shares, we consider households’ shopping trips conditional on purchasing in the breakfast cereal category (i.e., without accounting for the outside good). We define conditional market shares as the number of cereal purchases of a given label divided by the total number of cereal purchases. For example, 32.61% of the purchased cereals did not contain a warning label in 2017. For unconditional market shares, we allow for out-of-category substitution and consider all households’ shopping trips to the six largest retailers. We define unconditional market shares as the number of cereal purchases of a given label divided by the total number of shopping trips. For example, in 2017, a cereal without a warning label was purchased in 4.20% of the shopping trips. Comparing conditional market shares before regulation in 2015 and after regulation in 2017, unlabeled cereal products gain market share, whereas the market share of cereal products with a warning label falls. The unconditional market shares show a similar pattern. The shares of labeled cereals drop and the percentage of trips with a cereal purchase decreases after the regulation—as suggested by the increase of market share of the outside good.
Overview on Market Shares Across Years.
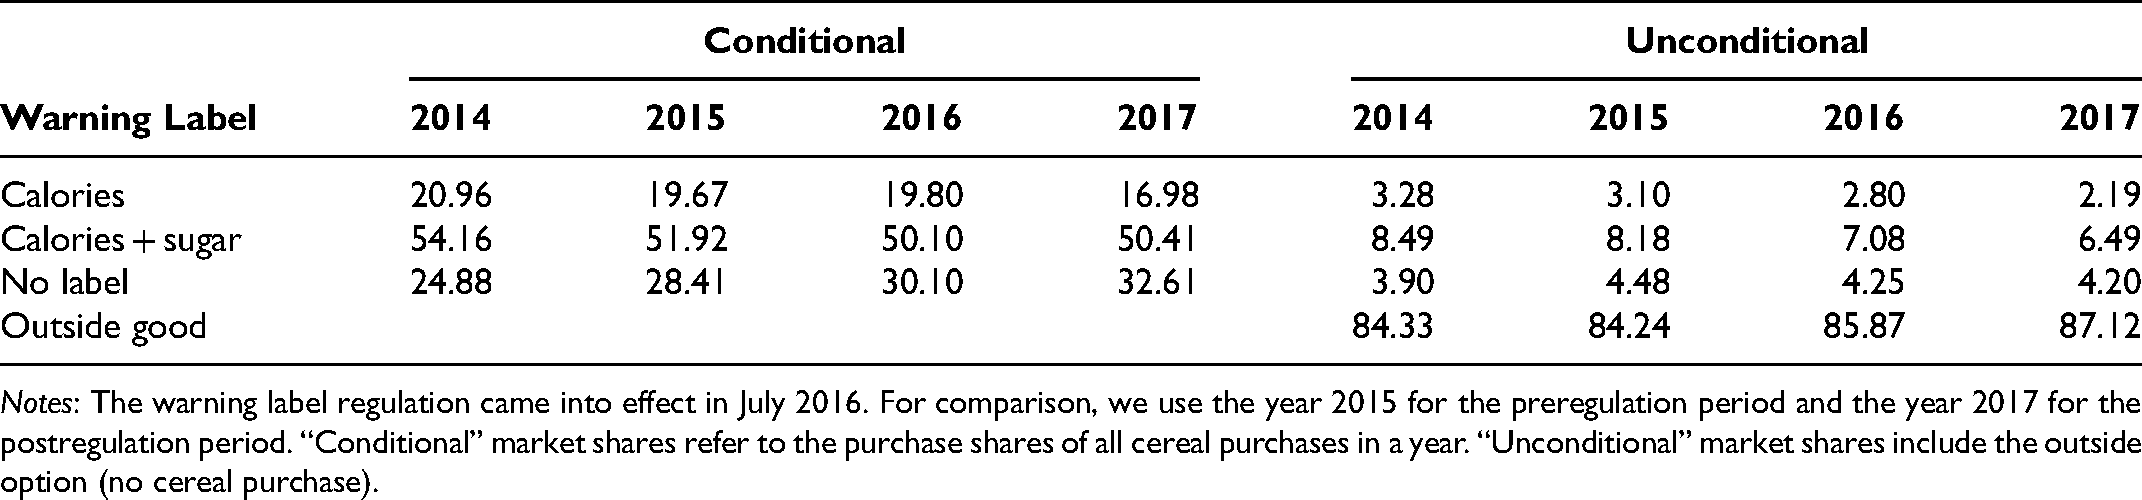
Notes: The warning label regulation came into effect in July 2016. For comparison, we use the year 2015 for the preregulation period and the year 2017 for the postregulation period. “Conditional” market shares refer to the purchase shares of all cereal purchases in a year. “Unconditional” market shares include the outside option (no cereal purchase).
Table 3 shows the prices per equivalent of 500 g for each of the cereal types and years. Comparing prices before the regulation in 2015 and after the regulation in 2017, we find that the prices of labeled cereals rise faster than unlabeled cereals. Typically, we would expect that the negative utility for choosing unhealthy cereals would lead to a drop in willingness to pay for labeled products, all else being equal. In this scenario, it would seem optimal for labeled products to decrease prices to mitigate the drop in demand (see, e.g., Dubois, Griffith, and O’Connell [2018], who study the impact of an advertisement ban in the U.K. market for potato chips and find a drop in equilibrium prices). In contrast, we observe a relative increase in prices for products with warning labels compared with unlabeled products, as prices of labeled cereals rise by about 11% in the period of 2015 to 2017, whereas unlabeled products increase prices by only about 7%—a pricing puzzle that we aim to rationalize. 6 Our structural model enables us to isolate the equilibrium price changes triggered by the warning label regulation and decompose postlabeling market share adjustments into a pure label effect that fixes prices at preregulation levels and a total effect that accounts for price reoptimizations after regulation. This way, we are able to quantify market share adjustments that are due to postlabeling price adjustments, which is a crucial aspect of our research question.
Overview on Prices Across Years.
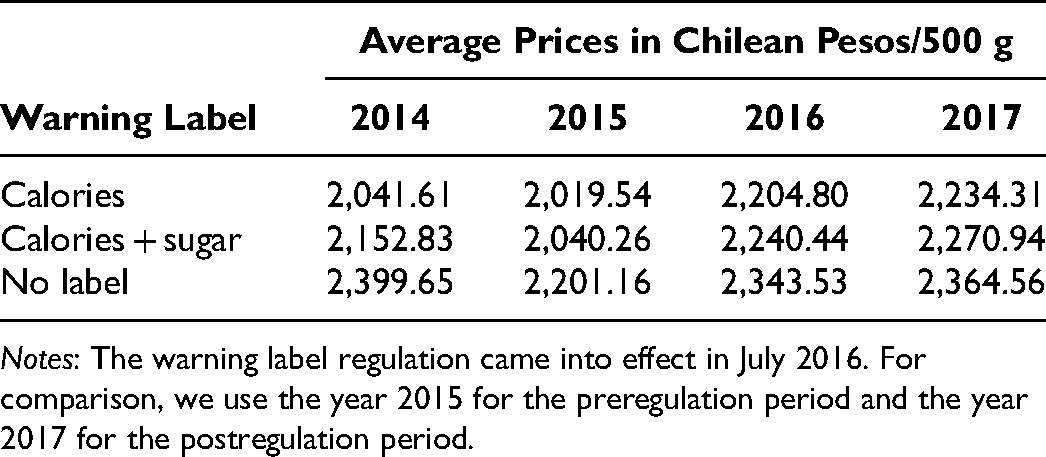
Notes: The warning label regulation came into effect in July 2016. For comparison, we use the year 2015 for the preregulation period and the year 2017 for the postregulation period.
Another interesting aspect is how market share adjustments vary across households with a different socioeconomic status. Table 4 depicts the evolution of market shares within the three socioeconomic groups (as defined in Table 1). We observe the strongest impact of the regulation in the lower-middle socioeconomic group. Comparing market shares before regulation in 2015 and after regulation in 2017, we see that labeled cereals substantially lose market share in this group, while unlabeled cereals consistently gain market share. In the upper-middle socioeconomic group, healthier (unlabeled) cereals gained only little market share between 2015 and 2017. The percentage of trips with purchases of cereals also decreased substantially for this group, such that the unconditional share of unlabeled products even slightly decreased. The market share changes of households with a low socioeconomic status are also not as strong as those of households with a lower-middle socioeconomic status. In the next sections, we estimate a structural equilibrium model to quantify the pricing implications of these substitution patterns induced by the warning label introduction.
Market Shares Across Years by Households with a Different Socioeconomic Status.

Notes: SES = socioeconomic status. The warning label regulation came into effect in July 2016. For comparison, we use the year 2015 for the preregulation period and the year 2017 for the postregulation period. “Conditional” market shares refer to the purchase shares of all cereal purchases in a year. “Unconditional” market shares include the outside option (no cereal purchase).
Empirical Demand Framework
Indirect Utility Specification
In our demand framework, we assume that a household's shopping incidence and choice of retail chain are exogenous. A choice occasion at any point in time t is defined as a household's trip to one of the six largest retail chains, purchasing a product either in the ready-to-eat breakfast cereal category or the outside option j = 0. We further assume that households consider only those products and prices offered by the retail chain in which they shop their groceries at time t (“single-store consideration set”). This assumption is common in the discrete-choice literature (e.g., Dubé, Hitsch, and Rossi 2010) and avoids biased inference of a household's demand parameters due to a full information consideration set model. Similar to Dubois, Griffith, and O’Connell (2018), we distinguish between healthier (unlabeled) and unhealthier (labeled) fringe alternatives. These fringe alternatives comprise aggregate products that are not among the 80% of cereals sold across the six largest chains. Beyond that, we allow households to substitute out of the cereal category, and j = 0 denotes the option of not purchasing a breakfast cereal item at a household's trip to the retailer. This specification of the outside good is very common in the literature (similar to, e.g., Bronnenberg, Dubé and Sanders [2020]). We define household i's indirect utility from the product–retailer combination j at period t as follows:
Identification of Warning Label Coefficients and Cartoon Ban Dummy
The rich specification of the empirical model in Equation 1 enables us to isolate the effect of the nutritional warning labels from other simultaneously occurring policy events such as advertising restrictions for labeled products tailored to children. Equation 1 contains two warning label coefficients
Table 5 illustrates that we observe sufficient variation in the presence of warning labels and the removal of cartoon figures across cereal products after regulation. This variation greatly facilitates the separate identification of the impact of each label and the impact of the cartoon ban on consumer utility. For separate identification, it is crucial that we observe products without a warning label after regulation, products with warning labels but that never contained cartoon figures, and products with warning labels that had to remove cartoon figures from their packaging after regulation. For example, we can separate the effect of a calories label from the effect of cartoon bans in the demand estimation because we observe both products with a calories label that never contained cartoon figures and products with a calories label that did need to ban cartoon figures after regulation (see Table 5).
Percentage of Cereal Products Covering Different Combinations of Labels and Ban of Cartoon Figures After Regulation.

Notes: Products in the “no label” group were not affected by the cartoon ban.
However, a potential concern is that the classifications in Table 5 are not random and that, for example, preferred products systematically contain calories + sugar warning labels more often. We are able to address this issue because our estimation sample covers one-and-a-half years of observations prior to the warning label introduction in July 2016. Observing this preregulation data facilitates separate identification of consumers' preferences for the brand–subbrands and warning label coefficients. Conditional on households’ brand preferences, we are able to isolate the heterogeneous impact of the different warning labels by observing households adjust their purchase behavior of breakfast cereal items after regulation.
Controlling for Price Endogeneity
A common concern in demand estimation is that the time-varying unobservables
Estimation
We rely on a hierarchical Bayesian multinomial logit model with a mixture-of-normals first-stage prior to estimate individual demand parameters (e.g., Allenby et al. 2014; Pachali, Kurz, and Otter 2020; Rossi, Allenby, and McCulloch 2005). This estimation approach is desirable in our application because it allows for flexible specifications of unobserved heterogeneity in all model parameters, including brand preferences, price sensitivity, and warning label coefficients. In addition, it is important to flexibly account for consumer heterogeneity in discrete-choice settings to capture realistic substitution patterns across products leading to more realistic model-based price predictions (e.g., Berry, Levinsohn, and Pakes 1995, 2004; Nevo 2001). In addition to unobserved heterogeneity, our hierarchical Bayesian approach also estimates the relation between demographics and households’ utility parameters, which is a critical aspect of our research question. For example, it is important for policy makers to learn whether high-income households are less price sensitive and whether they show, for example, a significantly weaker reaction to the introduction of warning labels. We further describe the estimation technique and explain how we estimate the empirical relation between demographics and households’ utility coefficients in Web Appendix C. There, we also define the specification of the priors.
Demand Estimation Results
Next, we discuss our demand estimation results. Figure 2 illustrates the marginal posterior distribution of the price coefficient

Inferred Heterogeneity Distributions of Households' Price Coefficient αi (Panel A) and Households' Warning Label Coefficients ωic and ωics (Panel B).
Figure 2, Panel B, shows that warning labels have a negative effect on household utility on average. Yet, the distributions also suggest a profound amount of heterogeneity for the effect of calories labels. The same is true for the effect of the calories + sugar label combination. In addition, posterior distributions indicate that households update their utilities more negatively from the presence of only a calories label than from the presence of the calories + sugar labels. This outcome is somewhat surprising at first but is consistent with consumer learning theory (e.g., Bollinger, Leslie, and Sorensen 2011; Loewenstein, Sunstein, and Golman 2014). In particular, high sugar content is often revealed in the product names of cereals with calories + sugar labels. For example, the products “Azucarados,” “Zucaritas,” and “Zucosos” all contain variations of the Spanish word for sugar (azúcar). In contrast, the names of cereals with solely a calories label often do not have this association (e.g., “Corn Flakes,” “Estrellitas,” “Fitness”). The literature on consumer learning effects implies that a label would be effective and stimulate substitution only if the initial beliefs about the healthfulness of a product are biased, which seems more likely the case for cereals with solely a calories label.
We also investigate the significance of utility estimates of the price coefficients, warning label coefficients, cartoon ban interaction terms, the adstock term, and the control function term. We do so by checking whether Markov chain Monte Carlo draws of the population mean contain zero under different significance levels. Table 6 shows that all effects are significant and statistically different from zero at the 5% level. The table also shows that our demand estimation results do not reveal substantial differences between the inferred price coefficients before and after the new regulation was implemented in July 2016. The two distributions of mean parameters are almost identical. 9 Furthermore, Table 6 also shows that the control function term is positive and significant, consistent with retailers raising prices in response to positive unobserved demand shocks in our data.
Significance Tests of Price, Warning Label, Cartoon Ban, Adstock, and Control Function Coefficients.
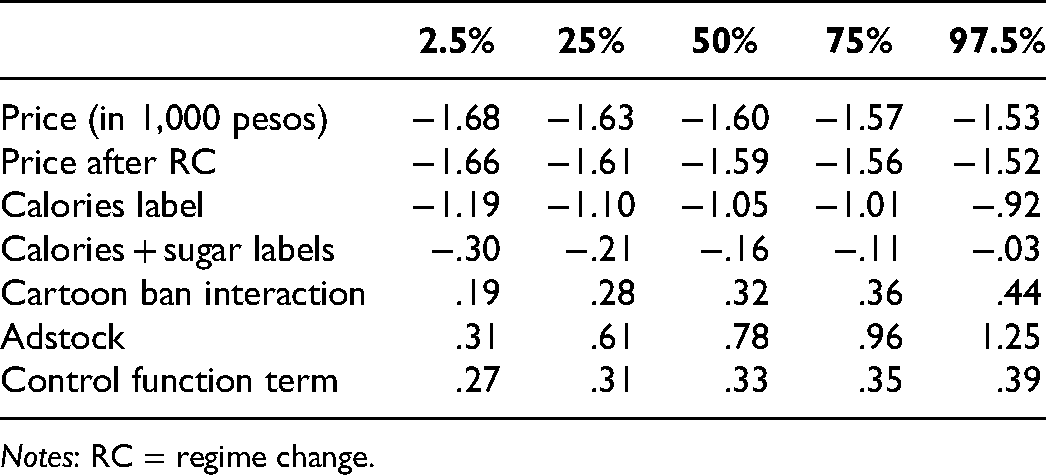
Notes: RC = regime change.
Table 7 summarizes quantiles of the marginal posterior heterogeneity distributions. The results indicate large preference heterogeneity for the major brand–subbrand combinations, and our estimates provide evidence for the dominant position of Nestlé in this market, as the three products “Nestlé-Chocapic,” “Nestlé-Trix,” and “Nestlé-Milo” have the highest intercepts on average (i.e., are valued most highly by the majority of Chilean consumers). 10
Quantiles and First Two Moments of the Marginal Posterior Preference Distributions.

Notes: RC = regime change.
The average effect of cartoon bans is close to zero but mildly positive. This is consistent with the idea that the cartoon ban has two opposing effects, making packaging less attractive to small children, but more appealing to adults, who might otherwise not buy these products with a cartoon package for their own consumption. Overall, the effect is positive because small children likely developed loyalty toward affected brands and continued preferring them even in the absence of cartoons on the package after regulation.
We also report the own- and cross-price elasticities implied by these demand estimates in Web Appendix D. The estimated own price elasticities vary from −4.65 to −2.57 and are comparable to other studies that employ a discrete-choice model to estimate the demand for cereals (e.g., Nevo 2001; Richards and Hamilton 2015).
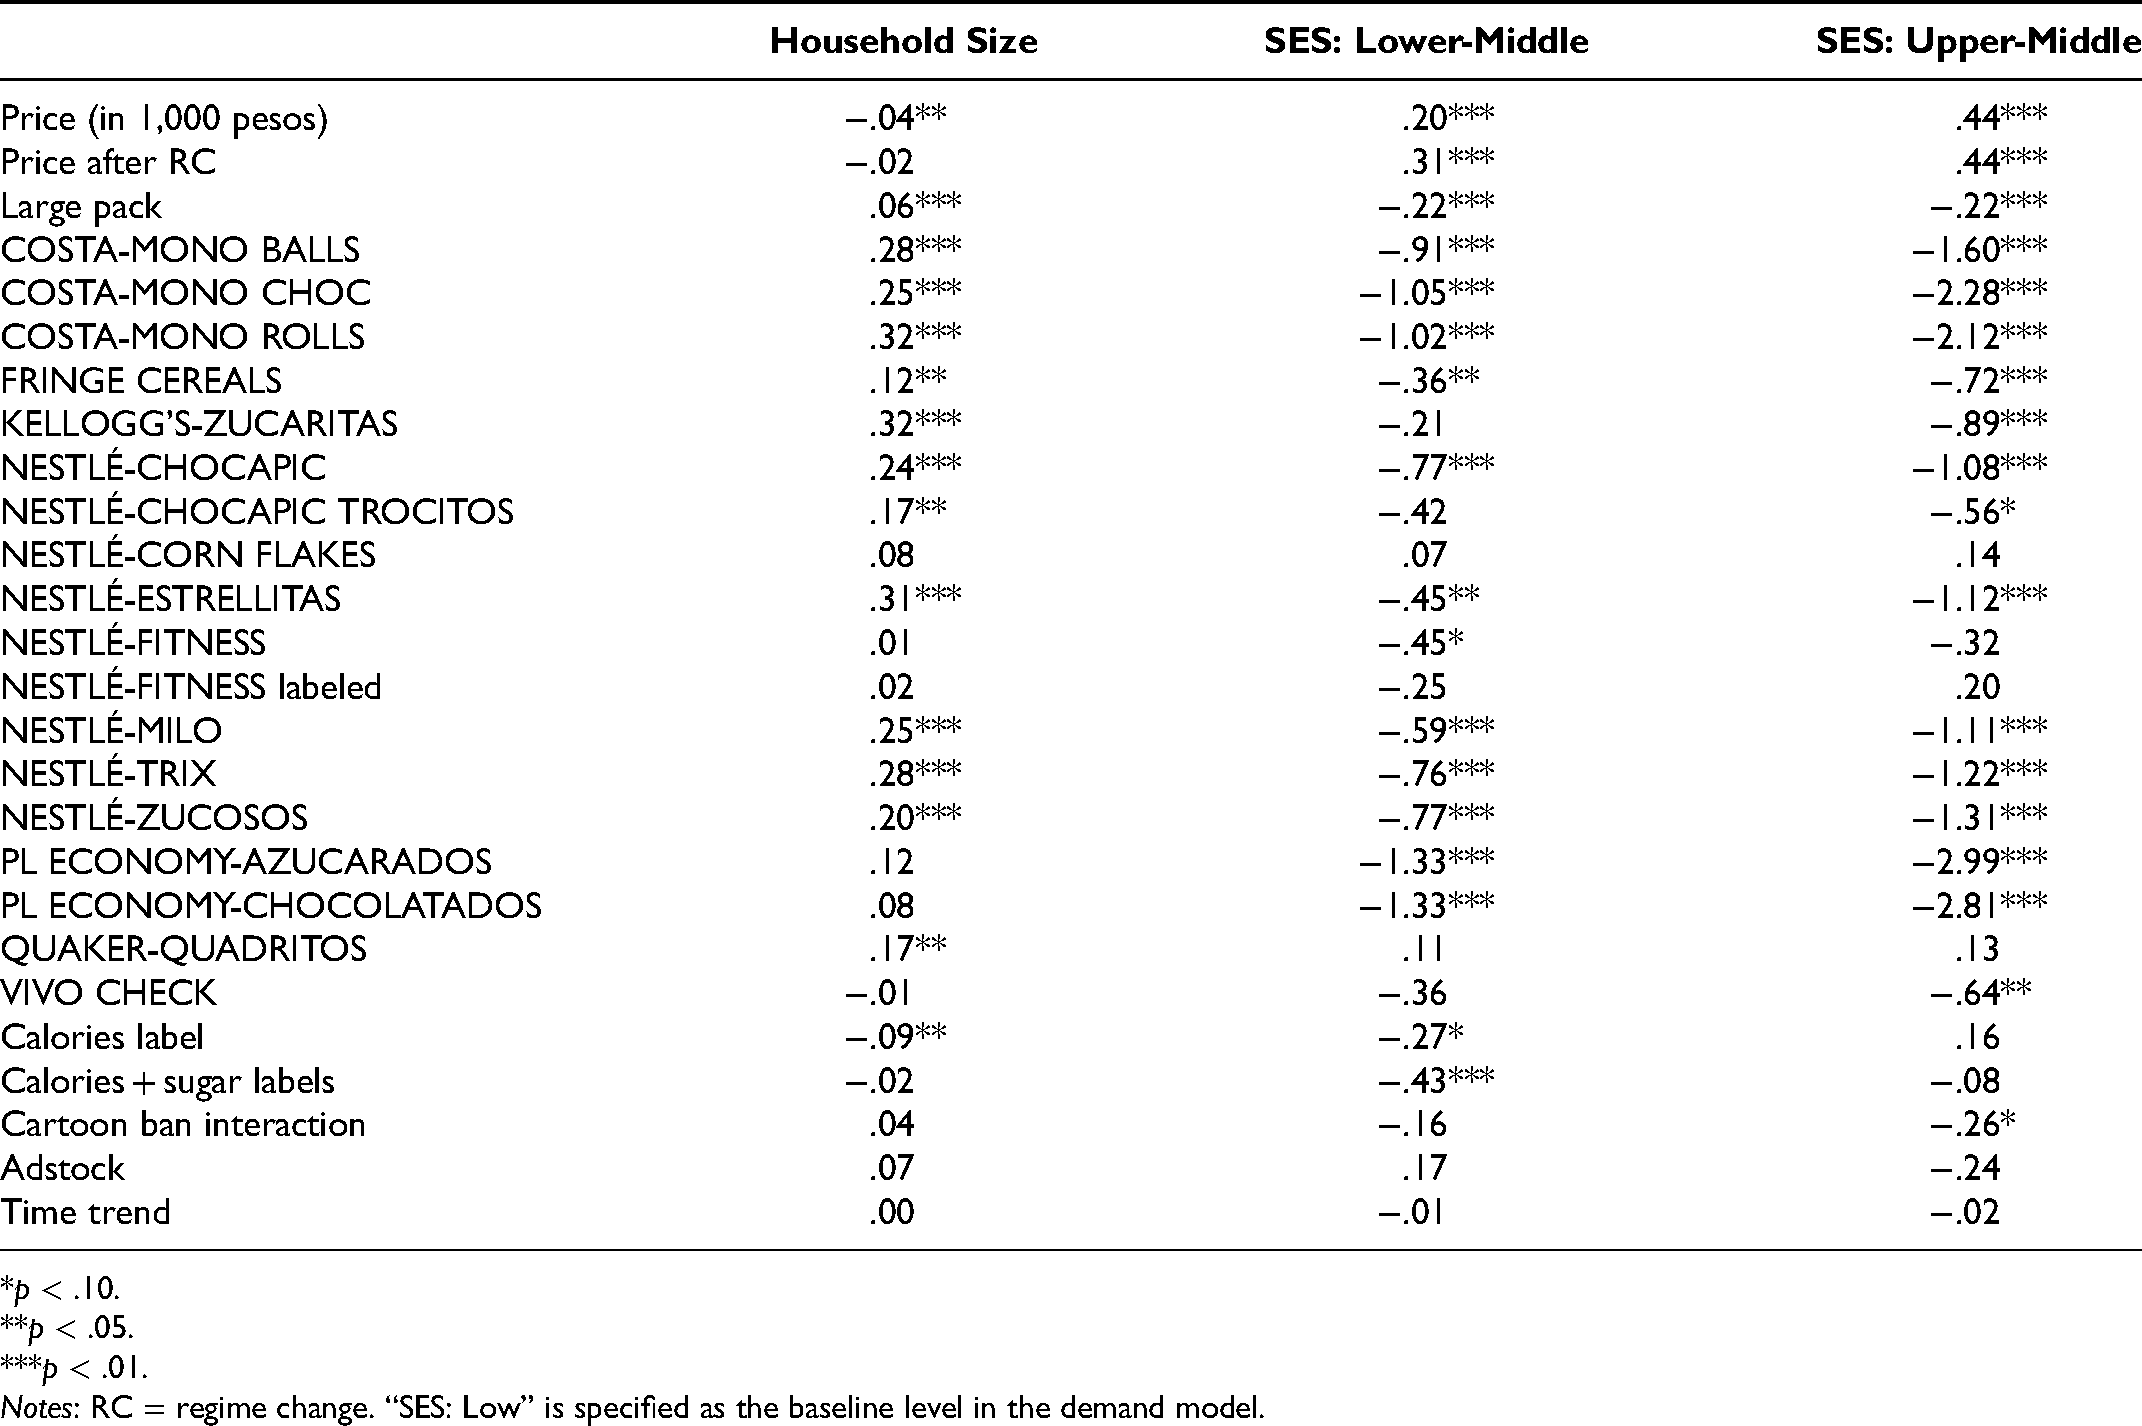
Our hierarchical Bayesian approach also estimates the relation between demographics and households’ utility parameters (for technical details, see Web Appendix C). We report the structural relation of the demand coefficients with observable household characteristics in Table 8. Our empirical estimates confirm that price sensitivity coefficients are ordered according to households’ socioeconomic status and, on average, the price parameter strictly increases (i.e., shifts closer to zero) the higher the household's socioeconomic status. Moreover, we find that households belonging to the lower-middle and upper-middle socioeconomic groups have significantly lower preferences for private label products compared with the baseline group of households from the low socioeconomic group.
Relationship Between Model Coefficients and Demographics.
*p
**p
***p
Notes: RC = regime change. “SES: Low” is specified as the baseline level in the demand model.
Consistent with the model-free evidence in Table 4, we find that households belonging to the lower-middle socioeconomic group show significantly stronger reactions to the presence of calories as well as calories + sugar warning labels compared with households with a low socioeconomic status. Households from the upper-middle socioeconomic group, in contrast, do not show stronger reactions. The reason for this outcome is that these higher-income households already consumed healthier breakfast items at a higher rate prior to the warning label regulation. In addition, households with an upper-middle socioeconomic status tend to have higher education levels. As suggested by existing studies, this means that they were likely already better informed about nutritional facts and a healthy diet before the regulation. 11 The result that households with a low socioeconomic status are, on average, less sensitive to the presence of nutritional warning labels is consistent with the literature on lower nutrition quality of food purchases among low-income populations (French et al. 2019). Finally, Table 8 illustrates that larger households showed a stronger reaction to the presence of only a calories label, but the household size does not significantly affect the reaction to the presence of calories + sugar labels. 12
Overall, these results indicate a significant impact of the warning label regulation on households’ purchase behavior that affects price setting on the supply side. For example, households with a lower-middle socioeconomic status react most strongly to the presence of warning labels (compared with households from the low and upper-middle groups), causing movements in the demand structure and average price sensitivity that labeled and unlabeled products face after regulation. Because the direction of such composition effects on aggregate elasticities cannot be inferred from Table 8, we simulate the effect of the warning label regulation on aggregate own- and cross-price elasticities in Web Appendix E. We find that simulated own-price elasticities significantly weaken (i.e., shift toward zero) for labeled products on average, whereas simulated own-price elasticities significantly strengthen for healthier cereals that do not carry warning labels. We discuss the implications of these results on equilibrium price adjustments in the next section.
Counterfactual Simulations and Equilibrium Adjustments
The previous sections illustrated that the negative-utility impact of warning labels is significantly lower for cereals high in calories + sugar than for products that are solely high in calories. In addition, we discussed how the warning label regulation altered the aggregate simulated price elasticities of labeled and unlabeled products due to the “composition effect.” Our goal in this section is to quantify and identify the isolated effects of the warning labels on equilibrium prices and market shares. For this purpose, we first use our demand estimates and a vertical model of price-setting behavior (e.g., Villas-Boas 2007) to compute total channel marginal costs (sum of manufacturer and retailer marginal costs) in 2015 just before the labels were introduced. Next, we simulate the equilibrium price adjustments following the warning label regulation and perform a market share decomposition of the policy effect.
A Supply Model for Manufacturer Competition and Retail Pricing
Our supply model assumes that cereal manufacturers act as Stackelberg leaders and compete on wholesale prices taking into account retailers’ actions. Retailers next set retail prices taking wholesale prices as given. We rely on a well-established framework where the vertical relationship between manufacturers and retailers is modeled without explicitly observing wholesale prices (e.g., Villas-Boas 2007). Retailers are restrained in their pricing power by households’ no-purchase option, consistent with our “single-store consideration set” assumption in the demand model. This implies that there are no cross-price derivatives across retailers in our setting. In addition, we treat fringe cereals—the aggregate of smaller brands that are not separately included in our demand model—as an additional brand in our supply model. 13
The vertical model is solved by using backward induction and starting at the retailer's problem. We follow the notation in Villas-Boas (2007).
14
There are Nr retailers and Nw Nash–Bertrand multiproduct manufacturers. Each retailer r maximizes its profit function


Each manufacturer sets wholesale prices for different retailers by anticipating that retailers behave according to Equation 4. The profit function of manufacturer w selling its products at retailer r equals


We determine the vector of product shares s(p) by integrating heterogeneous individual-level logit choice probabilities over the inferred heterogeneity distribution. The posterior estimate of expected market share for product j at each retailer is given by (e.g., Pachali, Kurz, and Otter 2020):
Price Responses After the Warning Label Regulation and Market Share Decomposition
We use the market scenario in 2015—the last full year before the regulation—to infer marginal costs and to predict price adjustments. This enables us to compute price responses to the warning label regulation while holding constant other circumstances that affect market prices (e.g., new product introductions, changes in the retail market, increases in the cost of ingredients). Because we are interested in the sole impact of the warning labels, we do not include the cartoon ban in our counterfactual estimation. 17 We approximate the size of every retail market r, Dr, by the number of shopping trips to retail chain r in 2015 observed in the data.
Table 9 displays the average of inferred total channel costs, c (see Equation 8), across markets and the implied total channel margins as a percentage of price, (mw + mr)/p, in 2015 before warning labels were mandatory in Chile.
18
We compute total market share for the inside cereal product j as
Inferred Marginal Costs (Sum of Manufacturer and Retailer Costs) and Implied Percentage Total Channel Margins for Cereal Products in 2015.

Notes: Price (p) and marginal cost (c) are measured in pesos; s = market share in %; CA = calories; CA + S = calories + sugar; CB = whether cartoon figures got banned after regulation; Large = large package size. Margins are expressed as percentage of price.
Validity of Supply-Side Model
The main goals of our study are to identify the isolated price adjustments due to the warning label introduction as well as the market share decomposition of the policy effect. As both depend on the specification of our supply-side model, Web Appendix F empirically validates the accuracy of our pricing rule assumptions. As this appendix shows, the predicted prices correlate strongly and significantly with observed market prices after regulation.
Isolating Equilibrium Price Adjustments of the Policy
Next, we use market-level marginal costs estimates reported in Table 9 to simulate the impact of the warning label regulation on equilibrium prices and equilibrium market share. Table 10 displays simulated percentage changes of prices (
Simulated Price Responses and Redistribution of Market Shares After the Warning Label Regulation.

Notes: Price (p) is measured in pesos; s = market share in %; CA = calories; CA + S = calories + sugar; CB = whether cartoon figures were banned after regulation; Large = large package size. Price changes (Δp) and market share changes (Δs) are expressed in percentages. Standard deviations are in parentheses.
Percentage Price (

Notes: Price (p) is measured in pesos; s = market share in %. Price changes and market share changes are expressed in percentages. Standard deviations are in parentheses.
In contrast to the price increase of labeled cereals, the results in Tables 10 and 11 show that most of the unlabeled cereal products decrease in price in the resulting equilibrium. The reason for the downward pressure in prices for unlabeled cereals is again due to the “composition effect” of the regulation. A larger fraction of price-sensitive households increasingly starts to choose unlabeled and healthier cereals and, in response, unlabeled products face more elastic demand after regulation. This is an interesting—perhaps surprising at first glance—pricing mechanism that helps policy makers reach their goal of incentivizing low-income households to consume healthier cereal products. Next, we perform a market share decomposition of the policy effect to more formally characterize these equilibrium adjustments.
Market Share Decomposition of the Policy Effect
To investigate whether market forces and equilibrium price adjustments support policy makers' intentions and the public interest, we decompose the postregulation demand substitution patterns into a pure label effect (fixing prices at initial levels) and a total effect (accounting for both the pure label effect and equilibrium price adjustments). While the warning label legislation generally aims to improve consumer diets in all segments of the population, policy makers in Chile specifically focus on low-income households that are at highest risk of becoming overweight and often have less access to health care and treatment against the various diseases caused by obesity. As such, we also investigate differences across socioeconomic groups.
Table 12 illustrates postregulation market share adjustments in the different groups of labeled and unlabeled products. The pure label effect that fixes prices at preregulation levels is shown in the “No Price Adjustments” column. 21 The total effect accounts for price reoptimizations after regulation as well and is shown in the “With Price Adjustments” column. The isolated impact of price adjustments is given by the difference of the “With Price Adjustments” and “No Price Adjustments” columns. For example, postlabeling price changes lead to a .44-percentage-point increase (= 3.65% − 3.21%) in market share of unlabeled cereals.
Market Share Decomposition of the Policy Effect.

Notes: The change variable is defined as the difference between respective post- and prelabel market shares (in %). “No price adjustments” refers to cases in which warning labels were added but market prices were fixed. “With price adjustments” refers to cases in which warning labels were introduced and both manufacturers and retailers reoptimize their prices. Standard deviations are in parentheses.
In general, we find that the warning label regulation leads to a price equilibrium that facilitates the policy maker's objective, as rather unhealthy (labeled) cereals lose more market share, whereas healthier (unlabeled) products gain substantially more market share due to the adjustment of prices. 22 Overall, the measured effect sizes of equilibrium price adjustments in Table 12 are of similar magnitudes as in other counterfactual studies (see, e.g., Table 12 in Dubois, Griffith and O’Connell [2018, p. 426]). Two findings are especially relevant from the policy maker's perspective. First, Table 11 implies that the impact of the price changes is fairly strong for products with calories + sugar labels. This outcome is mainly driven by the previous findings that the negative impact of the regulation is much weaker for products with calories + sugar labels, leading to strong price increases. Second, Table 12 also shows that the equilibrium price adjustments lead to substantial demand changes for unlabeled cereals. For instance, the aforementioned .44-percentage-point increase in shares for unlabeled cereals represents 12% of their total market share in the new equilibrium after regulation.
We also investigate how market forces and equilibrium price adjustments affect consumer substitution patterns in different socioeconomic groups (see Table W8 in Web Appendix G). 23 Considering the difference between the total effect and the pure label effect, the results in Web Appendix G imply that the price changes trigger the largest market share adjustments in the segment of households from the lowest socioeconomic group who are found to be most price-sensitive. For example, postlabeling price adjustments lead to a 2.63-percentage-point decrease in market share of products with calories + sugar labels in the group of households with a low socioeconomic status. For the same products, price adjustments lead to a drop in market share of only 1.79 percentage points in the group of households with an upper-middle socioeconomic status (see the difference between the “With Price Adjustments” and “No Price Adjustments” columns in Table W8, Web Appendix G). On balance, market forces incentivize low-income and price-sensitive segments to increasingly buy more healthy alternatives and improve nutritional intake.
Robustness Checks
We conduct the following analyses to demonstrate robustness of our simulated postlabeling price responses under different model assumptions.
First, the results in Tables 10 and 11 were simulated under the premise of setting the impact of the cartoon ban interaction term to zero. We decided to do so because measuring supply changes in response to mandatory bans of cartoons is not the focal interest of our research question and because the cartoon ban is specific to Chile and not considered in other countries in combination with warning labels. Web Appendix H shows the percentage price and market share adjustments in a counterfactual that accounts for the introduction of warning labels as well as the ban of cartoon figures. The price adjustments are qualitatively very similar to the ones reported in the main text.
Second, we investigate the robustness of our results with respect to the supply-side assumptions. Web Appendix I shows robustness of our findings in a model that assumes Nash–Nash vertical competition between retailers and manufacturers (e.g., Besanko, Gupta, and Jain 1998; Sudhir 2001), instead of Nash–Stackelberg as in the main text. We find that the results are robust to these adaptions in model assumptions.
Discussion
Obesity is a global disease, and in many countries the problem is particularly serious among lower-income consumer groups. Mandatory front-of-pack nutritional warning labels have been introduced in several countries as a potentially effective remedy and are currently being debated in many other countries. So far, studies have documented that such warning labels incentivize consumers to avoid unhealthy products; however, these papers do not speak to long-term price adjustments. Using purchase data of households before and after regulation, our research studies the impact of the Chilean warning label regulation on equilibrium market prices in the cereal category using a structural model of competition between cereal manufacturers and retailers in Chile.
Our results provide evidence that the regulation leads to higher prices of cereals with warning labels. This is a striking—and perhaps unexpected—pattern that is driven by heterogeneous demand substitution responses to front-of-pack labels (“composition effect”). Because of these responses, labeled cereals face a larger portion of less price-sensitive consumers than before, rationalizing raised prices after regulation. At the same time, the regulation leads to lower prices for unlabeled products, also driven by a shift in the composition of their clientele.
Our work has several implications for policy makers. In our structural analysis, we decompose the market share adjustments after the warning label introduction into a pure label effect that fixes prices at preregulation levels and a total effect that accounts for price reoptimizations after regulation. We document that the price changes induced by the warning labels improve the effectiveness of the regulation in two important dimensions. First, the price adjustments ensure reductions in demand for products with calories + sugar labels. Second, they increasingly incentivize price-sensitive households with a low socioeconomic status—an explicit target group defined by policy makers—to substitute away from unhealthier cereals as well.
Our results are based on an ex post analysis of consumer substitution patterns. This raises the important question how policy makers can ex ante assess the likely consequences of a potential warning label regulation in a different market environment. First and foremost, policy makers should be aware that changes in demand will also trigger a response by the supply toward a new equilibrium. Studying price responses after such a major policy change seems to be the logical first choice of marketing researchers because price is one of the most flexible marketing-mix variables to adjust. Our analysis of the Chilean case reveals that an important driver for the self-enforcing price adjustments is that price-sensitive consumers respond more strongly to the introduction of warning labels than less price-sensitive consumers. To gain ex ante knowledge whether this might also be the case in a different market, policy makers could set up a choice experiment or conjoint analysis in their target population to investigate the likely price response. If a planned warning label introduction would mainly entice price-sensitive consumers to switch to healthier and unlabeled alternatives, policy makers have reason to expect a price response in a similar direction, as we illustrate for the Chilean case.
Although we carefully investigate the impact of warning labels on manufacturer and retailer pricing, our analysis is not without limitations. First, we do not demonstrate robustness with regard to potential endogeneity of advertising. For example, the restrictions of advertisements of labeled products might have changed advertising effectiveness after regulation, affecting the inference of the adstock coefficient in the utility model. However, the direction of the potential bias is ambiguous. For example, higher differentiation between products may induce more effective communication to the target audiences through clearer advertising messages that focus on this differentiation. As a result, we would tend to overestimate the adstock coefficient. Yet, the regulation could also weaken advertising effectiveness because the target audience has become more specific and potentially harder to reach. In this case, the opposite bias might occur. Second, we do not investigate supply-side responses other than price adjustments. For instance, one potential long-term reaction could be that, having learned about the impact of warning labels, manufacturers reformulate their nutritional compositions to just below the critical cutoffs, avoiding the labels altogether (e.g., Alé-Chilet and Moshary 2022). Even though we did not find evidence that manufacturers adjusted the nutritional compositions of the major products during our period of observation, this might still happen in the future. Third, it is possible that the regulation asymmetrically affected the competitive conduct of labeled and unlabeled cereal products, which we did not investigate in this article. We leave these directions for future research.
Supplemental Material
sj-pdf-1-mrj-10.1177_00222437221105014 - Supplemental material for How Do Nutritional Warning Labels Affect Prices?
Supplemental material, sj-pdf-1-mrj-10.1177_00222437221105014 for How Do Nutritional Warning Labels Affect Prices? by Max J. Pachali, Marco J.W. Kotschedoff, Arjen van Lin, Bart J. Bronnenberg and Erica van Herpen in Journal of Marketing Research
Footnotes
Acknowledgment
The authors gratefully acknowledge AiMark/Kantar for providing the household purchase data. They thank Jonathan Budnik for his excellent research assistance. The authors would like to thank conference participants at QME 2020 and EMAC 2021 for their questions and suggestions. The article has benefited from discussions with Jean-Pierre Dubé, Andres Elberg, Carl Mela, and Stephan Seiler. Any errors are those of the authors.
Associate Editor
S. Sriram
Author Note
The first three authors contributed equally.
Declaration of Conflicting Interests
The author(s) declared no potential conflicts of interest with respect to the research, authorship, and/or publication of this article.
Funding
The author(s) received no financial support for the research, authorship, and/or publication of this article.
Notes
References
Supplementary Material
Please find the following supplemental material available below.
For Open Access articles published under a Creative Commons License, all supplemental material carries the same license as the article it is associated with.
For non-Open Access articles published, all supplemental material carries a non-exclusive license, and permission requests for re-use of supplemental material or any part of supplemental material shall be sent directly to the copyright owner as specified in the copyright notice associated with the article.