
Abstract
Public school districts not only make strategic investments in internet access as a means to attract and retain students but also communicate the value of these investments with parents as part of their marketing programs. While it helps attract more customers, how does school district internet access spending (SDIAS) affect academic performance and disciplinary problems among students? Using a longitudinal data set that combines SDIAS of 1,243 school districts with academic performance and disciplinary records of more than 9,000 Texas public schools between 2000 and 2014, the authors find that a one-standard-deviation increase in SDIAS (an average increase of $.6 million) is associated with an improvement in eight academic performance indicators, with effect sizes ranging from 2% to 5% of a standard deviation, amounting to a $.8 million to $1.8 million increase in cumulative income for the current students of a school district. Furthermore, a one-standard-deviation increase in SDIAS is associated with a 5% increase in Part II offense–related school disciplinary problems, amounting to a yearly cost of $25,800 to $53,440 for a school district. The positive and negative consequences of SDIAS are more pronounced among schools in regions with a higher level of household internet access.
Keywords
Each year, the U.S. government spends more money on Kindergarten through 12th-grade education than the overwhelming majority of developed nations. For example, in 2016, the United States spent $13,600 per student on elementary and secondary education, which was 39% higher than the average of 37 member countries that are part of the Organisation for Economic Co-operation and Development, which stood at $9,800. 1 Yet a 2017 nationwide survey of more than 7,200 parents showed that only 43% of parents with children in traditional public schools are “very satisfied” with their child’s school, compared with 61% of parents with children in private schools (Collaborative for Customer-Based Execution and Strategy 2017). This result echoes the deteriorating confidence that parents have in public schools—whereas 62% of parents indicated a “great deal/quite a lot” of confidence in public schools in 1975, the number was down to 29% in 2019. 2 Parents’ confidence in public schools depends on the school district’s ability to raise academic performance (Black 1999; Chen et al. 2018; Jacob and Lefgren 2007) while keeping students safe from physical and cyberbullying attacks (Butcher 2019; Rabovsky 2011). In this research, we examine how school district internet access spending (SDIAS), 3 a quintessential strategic investment, affects two key aspects of school quality: school academic performance and school disciplinary problems.
To provide value to students, school districts have traditionally made strategic investments in textbooks (Holden 2016), competent teachers (Chetty, Friedman, and Rockoff 2014), appropriate class sizes (Angrist and Lavy 1999), new facilities (Lafortune and Schönholzer 2019), and requisite computer hardware (Fairlie and London 2012). In the last two decades, SDIAS has rapidly evolved as a dominant strategic investment that school districts make and communicate to students and parents regarding how it can improve teaching and learning. Whereas only 14% of the primary and secondary classrooms in United States had internet access in 1996, 98% of school districts meet the Federal Communications Commission’s (FCC’s) 100 kbps per student goal for internet access in 2018 (EducationSuperHighway 2018). From 2015 to 2019, public school districts in the United States invested nearly $5 billion to upgrade their Wi-Fi networks (EducationSuperHighway 2019).
School districts routinely discuss the value of SDIAS with their customers—parents and students—as a strategic priority to maintain and improve school quality. For example, the Arkansas Public School Computer Network pledged an $11 million investment in internet access with the stated goals of “supporting personalized and differentiated instruction for every student” (EducationSuperHighway 2014); the Brewton School District in Alabama inked a strategic collaboration with Mediacom to upgrade their classrooms with high-speed internet (NCTA 2016); and Bellville independent school district in Texas documents that a major strategic goal of the district is “to promote educational excellence by facilitating resource sharing, innovation, and communications by providing internet access to students, teachers and administrators in the district.” 4 As customers, parents vigorously advocate for increased internet access at their child’s school; our pilot study of 3,924 parents shows that parental satisfaction with internet access in their child’s school is positively associated with overall satisfaction with their child’s school (see Web Appendix A).
Despite the purported importance of SDIAS as a key strategic area driving value to students and parents and enabling the differentiation of school districts, there is little agreement on payoffs to SDIAS, as summarized in Table 1. The studies listed in Table 1 show a positive (Dettling, Goodman, and Smith 2018), neutral (Faber, Sanchis-Guarner, and Weinhardt 2016), or negative (Belo, Ferreira, and Telang 2014) effect. Our literature review suggests that this discrepancy in findings stems from three main gaps. First, some studies use household internet access in the geographic area (e.g., broadband coverage) to proxy SDIAS (Dettling, Goodman, and Smith 2018; Vigdor, Ladd, and Martinez 2014). However, household internet access in a geographic area may not accurately reflect a school district’s strategic decision to invest in internet access (see Gap 1 in Table 1). Indeed, our data show that there are 34% (32%) of cases where school districts in regions with above-median (below-median) broadband coverage spend less (more) than the median on SDIAS in a certain year.
Literature on the Impact of Internet Access on Academic Outcomes.

Notes: n.s. = not significant.
Second, extant research examines either household internet access or school internet access, but not both. As such, it does not consider whether and how the effectiveness of SDIAS varies by changes in household internet access. In reality, both matter; the growing use of one-to-one-computing, learning management systems in school curriculum, and digital textbooks in school districts are predicated on students having internet access at their homes. Public schools lament the gap in internet access at school and at home (Bentley 2017) and cite it as a reason for the lack of student progress. School districts partner with local businesses to help and incentivize parents to invest in high-speed internet at home (Pannoni 2017). However, no study has put this argument to an empirical test. Thus, it is not known whether the payoffs to SDIAS are related to household internet access in the neighborhood (see Gap 2 in Table 1). The current study answers this important question.
Third, empirical evidence about the potential downside of SDIAS is lacking, although there is an ongoing debate that increasing SDIAS may be correlated with school disciplinary problems (see Gap 3 in Table 1). On the one hand, following the Children’s Internet Protection Act, schools and policy advocates believe that internet access has stoked bullying, self-esteem issues, and stalking, so schools need to block or filter internet access. On the other hand, there is a serious concern that zealously limiting internet access can undermine learning outcomes (Anderson 2016). For example, the Hutto Independent School District in Texas advocates having open internet access in schools to avoid overprotecting children while monitoring their use of the internet (Brown 2017). Accordingly, school districts feel the burden of monitoring potentially malicious online activity in which their children may engage, with the luxury of SDIAS.
We address these three gaps by providing a comprehensive empirical examination of the payoffs to SDIAS in terms of (1) school academic performance and (2) school disciplinary problems, while estimating the joint effect of household internet access along with SDIAS. We concatenate SDIAS data from Universal Service Administrative Company (USAC), school academic performance data from Texas Education Agency (TEA), school disciplinary records from Public Education Information Management System (PEIMS), and household internet access data from FCC Form 477. Our yearly data cover more than 9,000 public schools over 2000–2014, including 11 academic performance indicators and 47 types of school disciplinary problems, which are classified into serious criminal offenses such as aggravated kidnapping (Part I offenses) and relatively less serious criminal offenses such as possession of an illegal knife (Part II offenses). Our econometric model controls for persistent unobservables (using school fixed effects), common time-varying unobservables (using year fixed effects), individual-specific time-varying unobservables (using a rich set of school-, school district–, and county-level covariates drawn from extant literature), and any remnant endogeneity using an instrumental variable approach that leverages the institutional nature of the E-rate funding reimbursement for internet access spending.
Our findings are as follows. First, an increase in SDIAS is associated with a statistically significant improvement in eight academic performance indicators, including three college readiness indicators pertaining to high schools (e.g., SAT/ACT meet criterion rate) and five commended performance indicators pertaining to grades 3–11 (e.g., math, reading). The effectiveness of SDIAS is substantive: a one-standard-deviation increase in SDIAS (an average increase of .6 million) is associated with an improvement in school academic performance, with effect sizes ranging from 2% to 5% of a standard deviation, amounting to a $.8 million to $1.8 million increase in the cumulative income for current students of a school district.
Second, and very interestingly, the positive effects of SDIAS on school academic performance are higher among schools in regions with a higher level of household internet access. This suggests that higher household internet access, which amplifies students’ off-campus internet usage, likely reinforces the supplementary online learning being added to regular school teaching as a result of SDIAS.
Third, an increase in SDIAS has a significant and robust positive effect on Part II offense–related school disciplinary problems: a one standard deviation increase in SDIAS is associated with a 5% increase in Part II offense–related school disciplinary problems, amounting to a yearly cost of $25,800 to $53,440 for a school district. Interestingly, our evidence suggests that the deleterious effect of SDIAS on school disciplinary problems is higher among schools in regions with a higher level of household internet access.
Together, our findings offer four contributions to theory and practice. First, we clearly document that increasing SDIAS improves school academic performance, which is linked to cumulative income for current students in the school district. To be comprehensive, we examine 11 indicators of academic performance that cover (1) both state-mandated test scores and college readiness indicators to compensate for the opt-in nature of the college readiness indicators and (2) all stages of primary and secondary education to avoid the focus on a single educational stage. Our finding validates the results from the pilot study, which showed that parental satisfaction with school internet access is positively associated with overall satisfaction with their child’s public school, which in turn is positively associated with their reenrollment intentions into the same public school and negatively associated with switching intention to competing private schools (Web Appendix A). For the education sector, we show that SDIAS is a strategic investment that can be used to communicate value, as well as to satisfy and retain customers. Substantively, for the education sector, we show that the effect size of SDIAS is comparable to strategic investments in other school resources such as hardware (Fairlie and London 2012), software (Roschelle et al. 2016), class size (Angrist and Lavy 1999), and facility (Lafortune and Schönholzer 2019). Thus, during strategic planning cycles, school districts should allocate resources to SDIAS alongside other value-enhancing investments, given their relative effectiveness.
Second, by showing that the SDIAS effectiveness is contingent on household internet access, this study provides several insights. Empirically, it resolves conflicting findings because studies have used household internet access and SDIAS as interchangeable measures of the same construct. Our results show they should not be treated interchangeably. Investing in schools through SDIAS may not yield the intended effects unless students’ home internet exposure is taken into account. Thus, any policy designed to reap the benefits of internet usage on learning outcomes needs to incentivize both schools and households (Belo, Ferreira, and Telang 2016; Wei et al. 2011)—an issue that has not been examined or tested in prior research.
Third, we uncover and document the disciplinary risks associated with an increase in SDIAS. By showing that an increase in SDIAS is associated with an increase in the number of Part II offense–related school disciplinary problems, we add to extant literature on the antecedents of school disciplinary actions (see Web Appendix B). This literature has focused on classroom and teacher characteristics, the child’s family situation, and the school racial composition, but not internet access. Our results can shed light on developing effective schooling and parenting strategies that mitigate the deleterious consequences of internet access. By addressing and mitigating disciplinary issues, school district administrators can utilize SDIAS to attract and retain customers in a more effective manner.
Fourth, we add to the burgeoning literature that examines the link between internet access and crime (e.g., Bhuller et al. 2013; Chan, Ghose, and Seamans 2016). Our results show that both institutional access (i.e., through school) and personal access (i.e., through household) can have separate effects on school disciplinary problems. Perniciously, our evidence suggests that internet access at home may compound the deleterious effect of SDIAS on school disciplinary problems. Thus, increased SDIAS needs to be supplemented with corresponding investments in monitoring and/or mitigating its negative repercussions, and these investments may be dependent on the types of households served by the school district.
In the next section, we discuss the data, institutional setting, and identification strategy. Following that, we present our empirical findings and substantive implications and conclude with a discussion on theoretical and practical takeaways and potential limitations.
Data
We construct our data by concatenating information from a variety of sources. We collect SDIAS data from USAC, school academic performance data from Academic Excellence Indicator System (AEIS) and Texas Academic Performance Reports (TAPR), school discipline data from PEIMS, county-level population data from the National Cancer Institute’s Surveillance Epidemiology and End Results (Cancer-SEER) program, county-level unemployment rates from the Bureau of Labor Statistics Local Area Unemployment Statistics (BLS), and county-level median household income from U.S. Census Small Area Income and Poverty Estimates. Figure 1 summarizes these data sources and Web Appendix C describes the concatenation procedure. We next describe the data used in this study.

Summary of data collection and concatenation.
SDIAS Data
The Universal Service Program for Schools and Libraries (commonly known as “E-rate”) was established in 1996 with the goal of providing funding to schools, school districts, and libraries to obtain telecommunications and information services at an affordable rate. The program allows schools, school districts, libraries, and consortia to request funding to subsidize their costs for five service types: telecommunications (e.g., local and long distance wired telephone service), internet access (e.g., basic conduit access to the internet and broadband connectivity), internal connections (e.g., access points, routers, switches, hubs, wiring), managed internal broadband services, 5 and basic maintenance of internal connections (e.g., cable maintenance). The program officially began in 1998 by offering $2.4 billion annually to schools and libraries. The annual funding cap of the program was adjusted to $3.9 billion in December 2014 to further improve broadband connectivity as well as to expand Wi-Fi networks.
The E-rate funding application process involves multiple steps (for a summary, see Web Appendix D). In Step 1, eligible schools, 6 school districts, or libraries complete FCC Form 470, which describes the service requests (e.g., internet access), and USAC posts these requests for service providers’ consideration. Subsequently, service providers offer the prices to compete for these service requests through a bidding process. 7 In Step 2, schools, school districts, or libraries select the service contract after evaluating the bids received. Schools and libraries may consider multiple factors in their evaluation, but the price of eligible products and services must be the most heavily weighted factor under the rules of the E-rate program. In Step 3, schools, school districts, or libraries complete Form 471 to request funding in accordance with the service costs in the contract, and USAC reviews the request and determines the funding commitment based on (1) the percentage of students eligible for the National School Lunch Program in the school district and (2) the urban or rural status of the school district (see Table D1 of Web Appendix D). For example, a school district in a rural area that has 40% of students eligible for the National School Lunch Program is expected to receive 70% (i.e., discount rate) of total funds requested on internet access as the funding commitment. In Step 4, schools, school districts, or libraries file an FCC Form 486 to inform USAC that the delivery of approved services has started, and invoicing process can begin. In Step 5, applicants or service providers receive the reimbursement of the service costs after completing the invoicing process.
We obtain all E-rate requests of applicants in the state of Texas from 2000 to 2014 from USAC data retrieval tool. This contains 145,121 funding requests by 2,865 applicants spanning 2000–2014. Each request includes service type (e.g., internet access), applicant type (i.e., school, school district, library, consortium), total funds requested (i.e., actual spending), funding status (whether the funding request is approved by USAC), discount rate, funding commitment amount (total funds granted by USAC), and the final reimbursement amount (actual amount received).
Table D2 of Web Appendix D shows the breakdown of total spending by service type and over time: internal connections (51%), telecommunications (35%), and internet access (11%) are the three dominant service types where entities request funding. We examine internet access spending (i.e., cost figures listed in the service contract between schools/school districts and their service providers). Figure D1 of Web Appendix D shows that the ratio of internet access spending to total spending across all service types grew from 8% in 2000 to 35% in 2014.
The data show that 91.4% of total funds requested on internet access come from individual schools ($26.2 million) and school districts ($483.7 million) in Texas. The remaining 8.6% come from libraries (1.7%) and consortia (6.9%). Because we focus on SDIAS, we remove all requests by libraries, private schools, and consortia, 8,9 while retaining funding requests only on internet access. In addition, we aggregate all requests to the level of school district for two reasons: first, the overwhelming majority of funds ($483.7 million) are requested by school districts rather than individual schools; and second, we are able to retain funding information about individual schools’ requests. Thus, our data include 15,228 school district–year observations representing 1,243 school districts over 2000–2014.
Texas School Academic Performance Data
We obtain school academic performance data from the AEIS and TAPR maintained by the TEA. The AEIS provides performance indicators for each public school in the state of Texas. These reports also provide extensive school-level profile information about student, staff, finances, and programs. The TEA replaced AEIS with TAPR to report performance information in the school year 2012–2013; thus, we collect the last two years of data from TAPR. To be comprehensive, we examine a wide range of academic performance indicators based on two official performance standards that TEA adopts: (1) Texas state accountability system and (2) Gold performance acknowledgment system. 10 The TEA uses the former to evaluate whether districts and campuses are academically acceptable and the latter to acknowledge high performance on indicators other than those used to determine accountability ratings.
Texas public school students in grades 3–11 are evaluated by a comprehensive assessment program in accordance with the state-mandated curriculum. Texas first administered the Texas Assessment of Academic Skills test to all eligible students in grades 3 through 8 and grade 10 during the 2001–2002 school year. From 2002–2003 to 2011–2012, Texas administered the Texas Assessment of Knowledge and Skills (TAKS) test to all eligible students in grades 3–11. In the spring of 2012, Texas students began taking the State of Texas Assessments of Academic Readiness. The assessments are administered to students in grades 3–8 and high school courses with end-of-course assessments. Among these three state exams, we focus on TAKS test results because the exam period of TAKS (2003–2011) has the largest overlap with our data period (i.e., 2000–2014). We summarize the subjects evaluated at each grade level for TAKS in Table E1 of Web Appendix E. The key indicators of TAKS are commended performance in mathematics, reading/English language arts (ELA), writing, science, social studies, and the overall score. The indicator is reported as the percentage of students who have shown a thorough understanding of the knowledge and skills for the subject across all grade levels at the school. However, TAKS does not require testing of all subjects in all grades. For example, only students in grades 4 and 7 are required to take the writing test, while students in grades 3–11 are required to take the mathematics test. We collect data on all the tests scores available by year, within the purview of the TAKS system.
In addition to the TAKS-mandated exams, students in grades 9–12 can also voluntarily take exams or complete advanced courses to indicate their college readiness (i.e., whether students are able to perform college-level coursework). College readiness indicators include graduation rate, SAT/ACT test results, Advanced Placement/International Baccalaureate (AP/IB) test results, advanced course/dual enrollment completion, and Recommended High School Program/Distinguished Achievement Program (RHSP/DAP) graduates. We also collect data on these indicators.
In total, we collect the data of 11 academic performance indicators, including six TAKS-commended performance indicators (mathematics, reading/ELA, writing, science, and social studies, all subjects combined), graduation rate, SAT/ACT meet criterion rate, AP/IB meet criterion rate, advanced course completion rate, and RHSP/DAP graduates.
These data are collected at the school level. The raw data consist of 115,374 observations representing 9,560 unique Texas schools over 2000–2014, including both instructional campuses and alternative instructional where school- and school district–level attributes are observed. 11 In our main analysis, the sample sizes of academic performance indicators vary due to four institutional factors. First, college readiness indicators are available only for high schools. In contrast, TAKS results are outcomes of state-mandated exams across grades 3 through 11; consequently, they are available for a much larger number of schools. Second, TAKS results are only available between 2003 and 2011. Third, students in grades 3–11 are evaluated on different subjects at each tested grade level, and commended performance is measured across all grade levels at the school level (see Table E1 in Web Appendix E). Fourth, according to Family Educational Rights and Privacy Act requirements, TEA is required to create a set of mask rules to conceal the performance indicators in the case of small samples. We summarize the mask rules in Table E2 in Web Appendix E. Because we do not observe the true values of the masked observations, we exclude masked observations when conducting all analyses. As such, the final sample size for each dependent variable is different.
School Discipline Data
We collect school discipline data from PEIMS. The data contain the number of student classroom removals (i.e., counts of disciplinary problems) by student code of conduct violations (i.e., disciplinary action reason codes) at the school level over 2000–2014. Web Appendix F provides the list of 47 reason codes. They include serious crimes such as aggravated kidnapping (code 19) as well as misdemeanors such as possession of cigarette or tobacco products (code 33). We organize the data in two steps: first, in accordance with Family Educational Rights and Privacy Act requirements, TEA is required to conceal the number of disciplinary problems with the symbol −999 to indicate that there are fewer than five counts of disciplinary problems within a school. Because the data are counts, we replaced these values with 2 instead of 2.5. Second, given a large number of reason codes and sparse observations within some reason codes, we group these reason codes into two categories using the Federal Bureau of Investigation’s Crime Part I and II offense definitions. 12 Part I offense–related disciplinary problems (Part I) are generally most serious, and Part II offense–related disciplinary problems (Part II) are relatively less serious. For instance, aggravated assault (codes 29 and 30) is included in Part I, while assault (codes 27 and 28) is included in Part II. We have 106,238 school-year observations that represent 9,124 schools over 2000–2014, including both instructional campuses and alternative instructional where school- and school district–level attributes are observed.
Socioeconomic Data
We obtain county-level population data from Cancer-SEER, county-level unemployment rates from the BLS, and county-level income data from the U.S. Census Small Area Income and Poverty Estimates. We have 3,810 county-year observations representing 254 counties over 2000–2014.
Final Data
The matched sample for academic performance consists of 9,040 schools belonging to 1,187 school districts, and the matched sample for disciplinary consequences consists of 8,663 schools belonging to 1,157 school districts. 13 Table 2 presents the definitions and summary statistics. The first panel shows that school districts requested $210,238 per year, with a standard deviation of $671,853, and received $117,152 as the reimbursement. The second panel presents indicators of school academic performance, all of which are expressed as rates. For instance, on average, 13.4% of non–special education graduates scored at or above the SAT or ACT criterion score, and 10.3% of nonmobile students achieved commended performance in all subjects combined. The third panel reports two aggregate measures of school disciplinary problems, all of which are expressed in counts. On average, there are 1.1 (11.4) student classroom removals due to Part I (Part II) offense–related disciplinary problems.
Variables, Definitions, and Summary Statistics.

a We scale these metrics by multiplying the percentage of students who took the exams: for example, SAT/ACT Meet Criterion Rate = [Number of examinees who scored at or above criterion divided by number of examinees] × [Number of examinees divided by number of non–special education graduates].
Empirical Analysis
Identification Strategy: School Academic Performance
We start with a model linking the dependent variable Yijkt of a school i of school district j in county k in year t (e.g., SAT/ACT meet criterion rate) to the natural logarithm of SDIASjkt (i.e.,

where the coefficient α1 captures the effect of SDIAS on school academic performance, and the term ∊ijkt is the error term.
The identification of α1 is complicated by several issues endemic to observational data. First, schools may perform differently on the basis of persistent unobserved characteristics that may also be correlated with their school districts’ internet access spending pattern (i.e., unobserved cross-sectional differences). For instance, urban school districts may invest more in internet access, and schools in those districts may also perform better than those in rural school districts because they have better access to high-quality internet infrastructure (e.g., Wi-Fi infrastructure) that may increase internet access spending; they also offer better access to amenities and infrastructure that attract high-performing families. In such a case, the estimates of the impact of SDIAS on school academic performance would be biased. Accordingly, we control for school-specific cross-sectional difference by decomposing the error term as
Second, temporal variation in SDIAS and school academic performance may be driven by common time-varying unobservables. For instance, schools may perform better and be motivated to spend more during periods particularly conducive to growth (e.g., economic boom) or when academic outcomes are more salient than usual in students’ minds (e.g., periods around the statewide launch of the State of Texas Assessments of Academic Readiness assessment program in Texas in 2012). Accordingly, we include year fixed effects to capture such common time-varying shocks and any other state-specific common temporal shocks that may affect all schools. Thus, we have

where
Third, even after employing this unobserved-effects approach, SDIAS could still be correlated with school-, school district–, or region-specific time-varying unobservables that also affect school academic performance. For example, school districts with a growing reputation (or a growth in instructional budget) may have a propensity to invest more financial resources in internet access, and their schools perform better than the average school’s trends. In addition, school districts located in areas where socioeconomic status is higher (e.g., income, population growth) may be more willing to pay for premium broadband internet subscription. These unobserved school-, school district–, or region-specific proxies of increased internet access spending are likely correlated with academic performance (e.g., schools in areas with a higher income level may also achieve a higher level of academic performance). Omitting these factors would induce a bias on the impact of SDIAS on school academic performance given a correlation between school academic performance and socioeconomic characteristics such as income.
To alleviate such concerns, we include a rich set of proxies for omitted variables at the level of school, school district, and county. At the school level, we control for variables identified in the literature, including enrollment, composition of economic disadvantaged students (peer group characteristics; Sacerdote 2001), racial composition (Skiba et al. 2014), teacher experience (teacher training; Angrist and Lavy 2001), and student–teacher ratio (class size; Angrist and Lavy 1999). At the school district level, we control for instructional spending per pupil as a proxy for school district instructional budget. At the county level, we control for three socioeconomic factors: population, unemployment rate, and median household income. Thus, we arrive at

where
Finally, school districts might still strategically determine SDIAS with some expectation of better academic performance that in turn drives SDIAS. This strategic expectation is unobserved to the researcher but likely correlated with both SDIAS and academic performance and could result in endogeneity notwithstanding the controls discussed so far. To alleviate this concern, we supplement the model with an instrumental variable (IV) approach. Our source of exogenous variation in SDIAS comes from the invoicing process of the E-rate program, which generates spatial and temporal variation in reimbursement. For exposition, we use an example of XYZ Independent School District to describe the relationship among SDIAS, commitment, and reimbursement. In 2014, XYZ reported the SDIAS as $133,155 on its funding application. After the internet services have started and USAC approved its application, USAC issues a decision letter with a positive funding commitment of $119,840, which is equal to the SDIAS multiplied by the discount rate for XYZ (i.e., 90%). As we have discussed, the rules of determining the discount level are public knowledge. Finally, USAC processes invoices to reimburse XYZ with $111,730. Specifically, we use the reimbursement amount received by XYZ (i.e., $111,730) as the instrument for SDIAS of XYZ (i.e., $133,155). Note that the reimbursement amount differs from the commitment amount.
A valid instrument must meet the relevance criterion (i.e., the IV should be correlated with the endogenous variable) and the exclusion restriction criterion (i.e., the IV should relate to the dependent variable only through the endogenous variable). Reimbursement meets the relevance criterion because reimbursement is highly correlated with funding commitment, which is proportional to SDIAS by definition. Thus, SDIAS should be positively correlated with reimbursement in the same school district. This is supported by the positive correlation (ρ = .87, p < .01) and strong first-stage results (see Table H1 of Web Appendix H).
The exclusion restriction holds if SDIAS is the only channel through which reimbursement affects school academic performance. First, student behaviors are largely affected by personal factors (e.g., ability, background) and social-contextual factors (e.g., learning environment). Because the reimbursement amount is unobserved and uncontrolled by students, it is very unlikely that reimbursement directly influences student behaviors. Second, USAC can only process the reimbursement after internet services have started. Thus, although reimbursement does not directly influence student behaviors, it should do so through SDIAS, which can affect students’ digital learning environment and academic outcomes. Third, the gap between SDIAS and reimbursement cannot be easily predicted by school districts because the uncertainties involved in the invoicing process are not within school districts’ control. Such uncertainties induce exogenous variation in reimbursement.
To verify, we examined the data where applicants made funding requests over 2000–2014 and found that the reimbursement amount differs from the commitment amount in 65% of the cases. An interview with a manager of E-rate Program at USAC revealed that funds that are committed do not get disbursed due to a variety of reasons such as costs being lower than expected due to prices changes. Furthermore, we reviewed the responses of E-rate applicants from Funds for Learning Survey over 2013–2018. A key area of program rules that applicants would like to understand is how USAC makes decisions on reimbursement. 14
Finally, reimbursement may still affect academic outcomes through other channels. For example, school districts that get a larger amount of reimbursement are more likely to be rural districts, which affect academic outcomes. However, socioeconomic controls and a rich set of fixed effects in the first stage regressions account for these concerns (Chan, Ghose, and Seamans 2016). In summary, we argue that reimbursement is a valid instrument.
The IV model is given by the following two-equation system, where Equation 4a is the first stage and Equation 4b is the second stage:

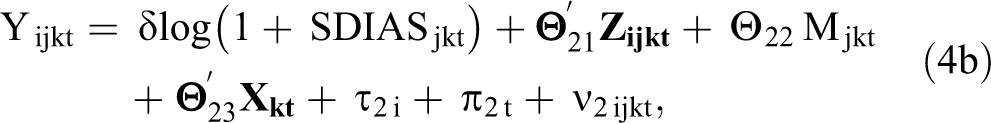
where Reimbursmentjkt refers to the actual funding amount that the school district j in county k received in year t. All other variables are as previously defined. We estimate Equations 4a and 4b using two-stage least squares. Standard errors are clustered at the school level to allow for heteroskedasticity and correlated errors within schools over time (Bertrand, Duflo, and Mullainathan 2004).
Identification Strategy: School Disciplinary Problems
Given the discrete nature of disciplinary problems as the dependent variable, our estimates are based on a conditional fixed-effects Poisson specification with enrollment as the exposure variable and robust standard errors to allow for heteroskedasticity. This model specification has two appealing features: First, like linear models, the Poisson model is not subject to inconsistency caused by the incidental parameters problem associated with fixed effects (Cameron and Trivedi 2005). Second, Poisson regression with conditional fixed effects and robust standard errors is consistent under weak distributional assumptions (Wooldridge 1999). Given the same set of issues concerning identification of the school disciplinary problem equations, we maintain the use of school fixed effects, year fixed effects, and a rich set of school-, school district–, and county-level proxies. The specification is as follows:

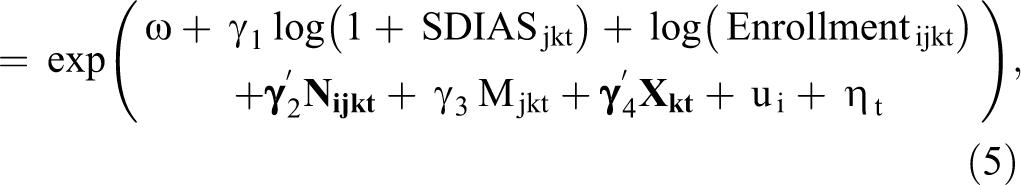
where Yijkt is the number of Part I (Part II) offense–related disciplinary problems in school i in school district j in county k, taking place in year t. Enrollmentijkt is the exposure variable with coefficient constrained to 1. ui and ηt are school fixed effects and year fixed effects, respectively.
To correct for remnant endogeneity of SDIAS in Equation 5, we use the control function approach to include the correction term (residuals) obtained from the first stage that uses reimbursement as the excluded variable. The identification assumptions of using reimbursement as the instrumental variable for school disciplinary problems are identical to those for school academic performance.
Results: School Academic Performance
Results
For school academic performance, we present the results of the fixed-effects and IV models in Table 3, Panels A and B, respectively. We discuss the results reported in Panel B (which are consistent with the results in Panel A).
Impact of SDIAS on School Academic Performance.

*p < .1.
**p < .05.
***p < .01.
Notes: Standard errors in parentheses. CP = commended performance on TAKS. We only report the estimated coefficients of log (1 + SDIASjkt). Estimated coefficients of control variables and intercepts are omitted from the table. In Table H2 of Web Appendix H, we report the summary statistics of control variables of each estimation sample.
As Table 3, Panel B, shows, there are statistically significant and positive effects of SDIAS on eight indicators of academic performance. First, SDIAS is positively associated with three college readiness indicators. Specifically, an increase in SDIAS is associated with an improvement in graduation rate (b = .269, p < .01), SAT/ACT meet criterion rate (b = .104, p < .01), and advanced course completion (b = .141, p < .05). Second, SDIAS is positively associated with five indicators of state-mandated exams. Specifically, an increase in SDIAS is associated with an improvement in commended performance in the following: all subjects combined (b = .049, p < .01), math (b = .090, p < .01), reading (b = .192, p < .01), social studies (b = .142, p < .05), and writing (b = .169, p < .01).
To assess the magnitude of these estimates, we measure the effect size as the percentage of a standard deviation increase in school academic performance with a one-standard-deviation increase in SDIAS from the mean. For example, as SDIAS increases by one standard deviation from the mean, graduation rate increases by 4.7% of a standard deviation of graduation rates. 15 Following this approach, the effect sizes range from .018 to .047 of a standard deviation across eight academic performance indicators. To put this into context with previous findings, Dettling, Goodman, and Smith (2018) find that the positive effect of internet access on SAT scores is .003 of a standard deviation. Vigdor, Ladd, and Martinez (2014) find that internet access decreases math test scores by .027 of a standard deviation in North Carolina.
We further compare the effectiveness of SDIAS with that of other school investments to put the effect sizes into perspective. The effectiveness of SDIAS seems to be smaller but comparable to the effectiveness of other resources employed to improve educational outcomes such as hardware (.14 of a standard deviation; Fairlie and London 2012), software (.18 of a standard deviation; Roschelle et al. 2016), class size (.048–.18 of a standard deviation; Angrist and Lavy 1999), and facility (.05–.10 of a standard deviation; Lafortune and Schönholzer 2019). We conclude that SDIAS is a relatively effective investment for improving customer outcomes when placed alongside other school resources.
Robustness Checks
Stepwise inclusion of control variables
We include fixed effects and control variables in a stepwise manner to ascertain the extent to which the estimates are sensitive to the inclusion of fixed effects and time-varying proxies (Models 1–4, Table 4). We add school and year fixed effects in Model 1, county-level demographic controls in Model 2, school district instructional spending in Model 3, and school-level controls in Model 4. Our results are consistent across these stepwise models.
Summary of Robustness Check: Impact of SDIAS on School Academic Performance.

*p < .1.
**p < .05.
***p < .01.
Notes: We only report the estimated coefficients of log (1 + SDIASjkt). Estimated coefficients of control variables and intercepts are omitted from the table.
School district fixed effects
Given that SDIAS is largely a strategic decision at the school district level, an alternative model specification is to include school district fixed effects rather than school fixed effects. Results using school district fixed effects are consistent with our main specification (Models 6–7, Table 4).
Alternative operationalization of SDIAS
An alternative way to operationalize SDIAS is to express SDIAS on a per pupil basis. Results are consistent, and the magnitude is similar to the main model with this specification (Models 8–9 of Table 4). Furthermore, our conversations with staff at USAC revealed that while SDIAS captures the costs of internet access, spending on internal connections (e.g., Wi-Fi equipment) also contributes to classroom connectivity. Thus, we collect the data on spending on internal connections from USAC and use school district connectivity spending (i.e., SDIAS plus spending on internal connections) as well as school district connectivity spending per pupil as alternative measures. Results are consistent, but the magnitude of the effects decreases (see Models 10–13 of Table 4).
Substantive Implications: Student Income Value of SDIAS
From a school district’s perspective, it is important to convey the effectiveness of SDIAS in a tangible way to demonstrate its value to its customers (i.e., parents and students). To assess the financial impact of SDIAS, we obtain (1) the link between SDIAS and school academic performance, (2) the link between school academic performance and a student’s cumulative income, and (3) average present value of income for full-time, full-year workers. We obtained the first link based on our model estimates. To obtain the second link, we reviewed the empirical work spanning 1999–2014 to collect a comprehensive set of effect sizes of the link between students’ improvement in academic performance and the increase in their cumulative income (for details, see Table 5). We obtained the third link from Hanushek (2011). We combine these three links to convey the financial impact of SDIAS in the form of students’ cumulative income for a school district.
Literature on the Estimates of the Link between Academic Performance and Student Income.

Notes: Effect size refers to the percentage increase in one student’s cumulative income with a one-standard-deviation increase in academic performance. References are listed in Web Appendix I.
According to Table 5 and Hanushek (2011), two substantive conclusions emerge: an increase of one standard deviation (i.e., effect size of 1) in academic performance increases a student’s cumulative income by 9%−20% with a mean of 13%, and the average present value of income for full-time, full-year workers is $1.16 million (Hanushek 2011, p. 471). By implication, moving one standard deviation (i.e., effect size of 1) in academic performance increases a student’s cumulative income by $104,400 ($1.16 million × 9%) in the low range, $150,800 ($1.16 million × 13%) in the medium range, and $232,000 ($1.16 million × 20%) in the high range. As we have discussed, when SDIAS increases by one standard deviation from the mean, graduation rate increases by 4.7% of a standard deviation, resulting in increasing a student’s cumulative income by $4,949 (low), $7,148 (medium), and $10,997 (high). Given that an average school district has 232 high school graduates, increasing SDIAS by one standard deviation ($587,179 based on the standard deviation of SDIAS in the estimation sample) increases the cumulative income for the current students in the school district by $1,148,066–$2,551,258.
Using the same approach, we calculate how a one-standard-deviation increase in SDIAS from the mean increases the cumulative income for high school graduates in the school district through improved performance on each academic indicator. Results are reported in Table 6. A one-standard-deviation increase in SDIAS (an average increase of $610,653 across estimation samples) increases the cumulative income for high school students in the school district by $821,388–$1,825,306 through improving academic performance. Thus, SDIAS generates positive payoffs to school districts. 16 From a marketing perspective, this information can be used to help attract potential customers and retain current customers.
Financial Impact of SDIAS: Value of Student Cumulative Income.
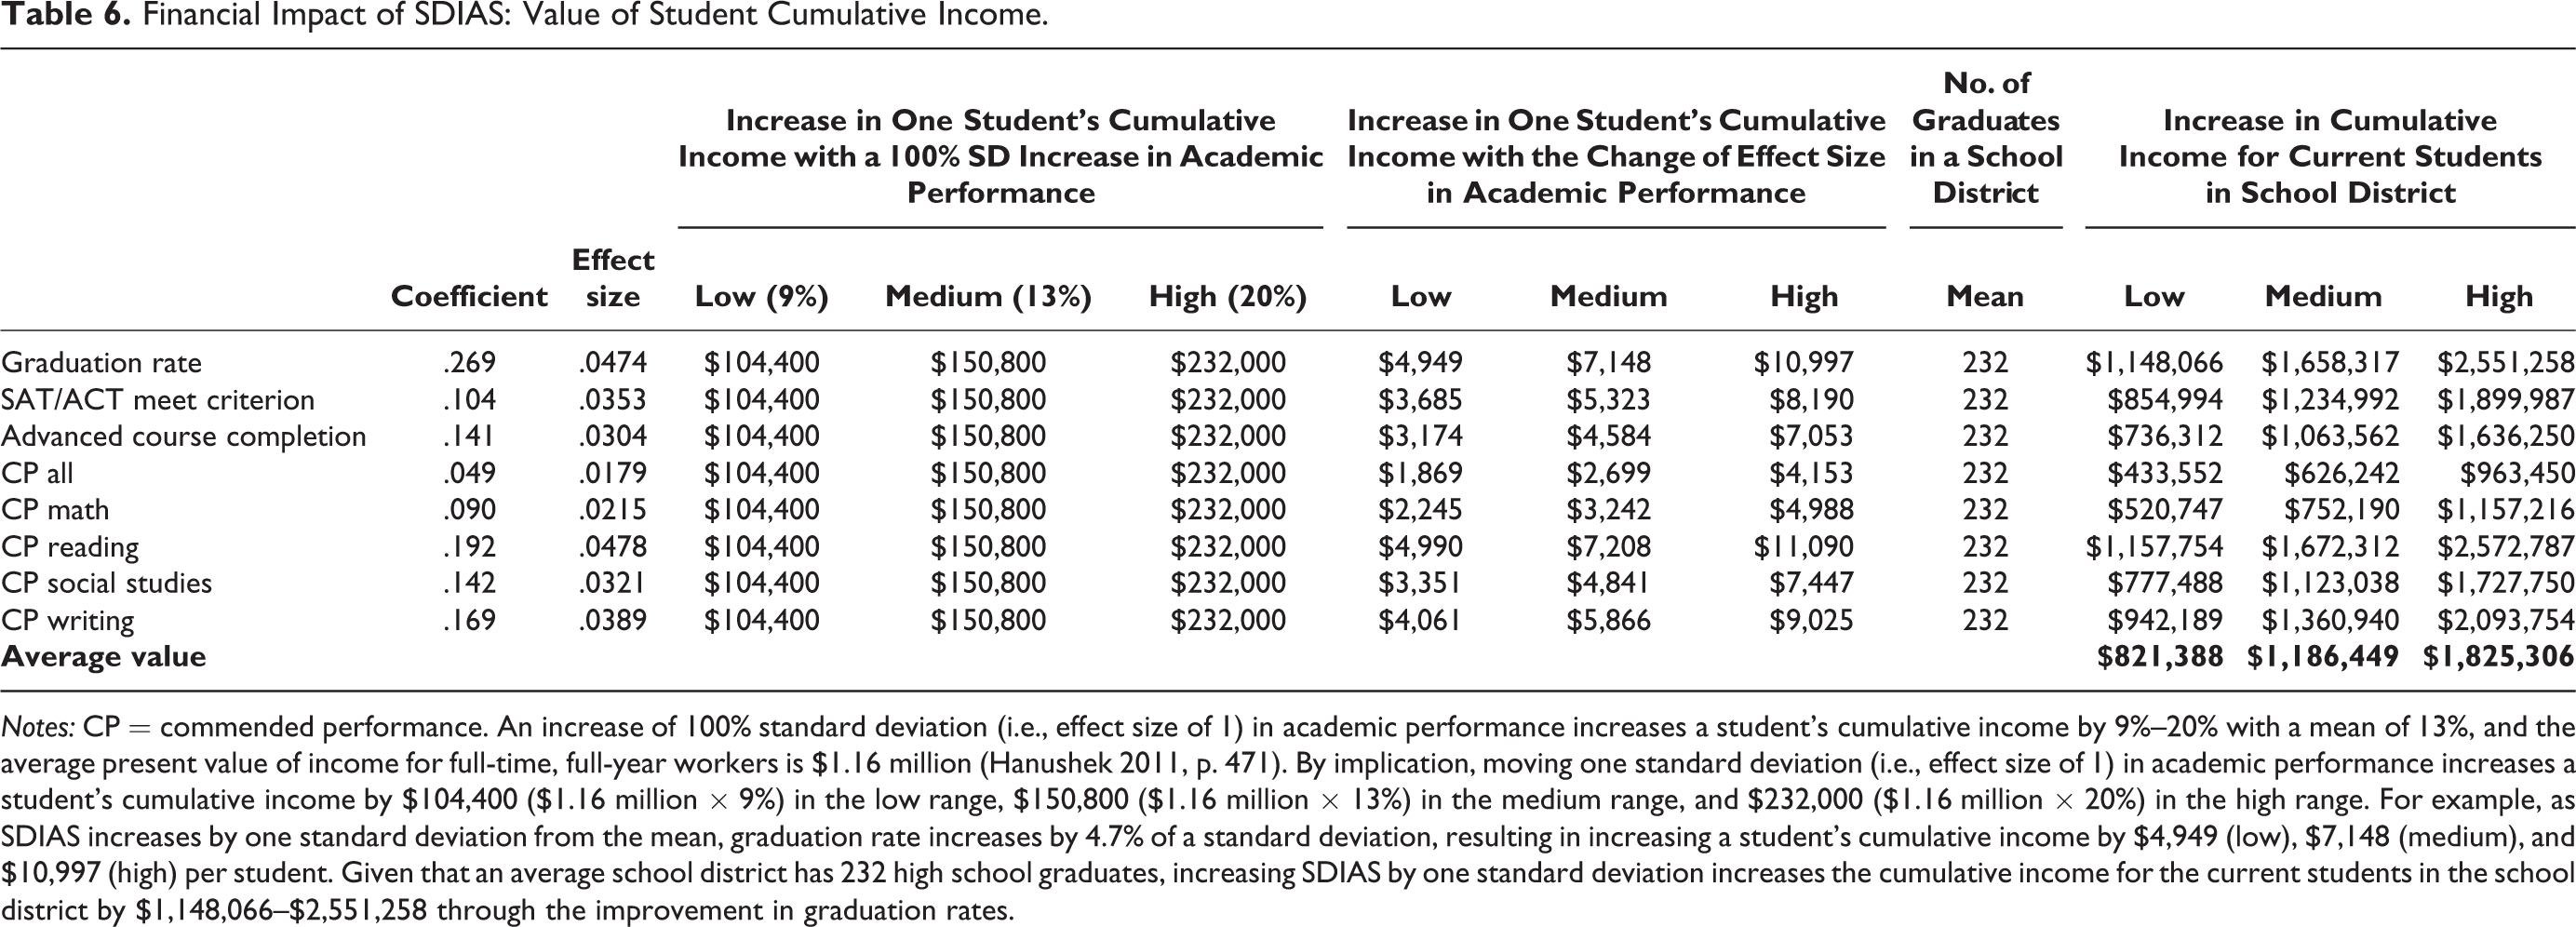
Notes: CP = commended performance. An increase of 100% standard deviation (i.e., effect size of 1) in academic performance increases a student’s cumulative income by 9%–20% with a mean of 13%, and the average present value of income for full-time, full-year workers is $1.16 million (Hanushek 2011, p. 471). By implication, moving one standard deviation (i.e., effect size of 1) in academic performance increases a student’s cumulative income by $104,400 ($1.16 million × 9%) in the low range, $150,800 ($1.16 million × 13%) in the medium range, and $232,000 ($1.16 million × 20%) in the high range. For example, as SDIAS increases by one standard deviation from the mean, graduation rate increases by 4.7% of a standard deviation, resulting in increasing a student’s cumulative income by $4,949 (low), $7,148 (medium), and $10,997 (high) per student. Given that an average school district has 232 high school graduates, increasing SDIAS by one standard deviation increases the cumulative income for the current students in the school district by $1,148,066–$2,551,258 through the improvement in graduation rates.
Contingent Effect of Household Internet Access on SDIAS Effectiveness
We assess how the effects of SDIAS on school academic performance are contingent on technology exposure at home, captured by household internet access, which is strongly related to students’ internet use at home. Household internet access increases “the ability to use the internet technology” not just at home, but also at school (Dewan and Riggins 2005, p. 301; Wei et al. 2011). In other words, home access increases a student’s internet use capability, which can be leveraged at school (Malamud and Pop-Eleches 2011). Thus, school internet access should have a stronger effect among students whose internet use capability is increased due to internet access at home. Internet access within a household also facilitates learning when children are able to reinforce internet-based learning at school and at home on a daily basis. Furthermore, educational institutions serve as a teaching role in the diffusion of the internet (Goldfarb 2006). Thus, the positive effects of school district internet access spending on academic performance are likely to be higher in regions where the level of household internet access is higher.
To test this argument, we use the number of broadband internet service providers in a county to measure the level of household internet access. Kolko (2010) shows that household high-speed internet availability increases monotonically with the number of broadband providers, supporting the use of the number of broadband providers as a proxy for household internet access and usage in other studies in the literature (Dettling, Goodman, and Smith 2018; Vigdor et al. 2014).
Figure 2 shows considerable variation in household internet access across counties and over time. Cross-sectional variation in household internet access, conditional on observables, is often driven by exogenous supply-side factors such as weather, terrain, and preexisting infrastructure (Belo, Ferreira, and Telang 2014; Bhuller et al. 2013; Kolko 2010; Sen and Tucker 2019). School fixed effects should capture much of this variation. Temporal variation in household internet access is arguably exogenous to school districts’ decisions as school districts have little control over whether and when providers enter their zip code and have little impact on aggregate usage (Dettling, Goodman, and Smith 2018). Indeed, Table H5 of Web Appendix H shows that SDIAS is not driven by level of household internet access in the region.

Variation in household internet access.
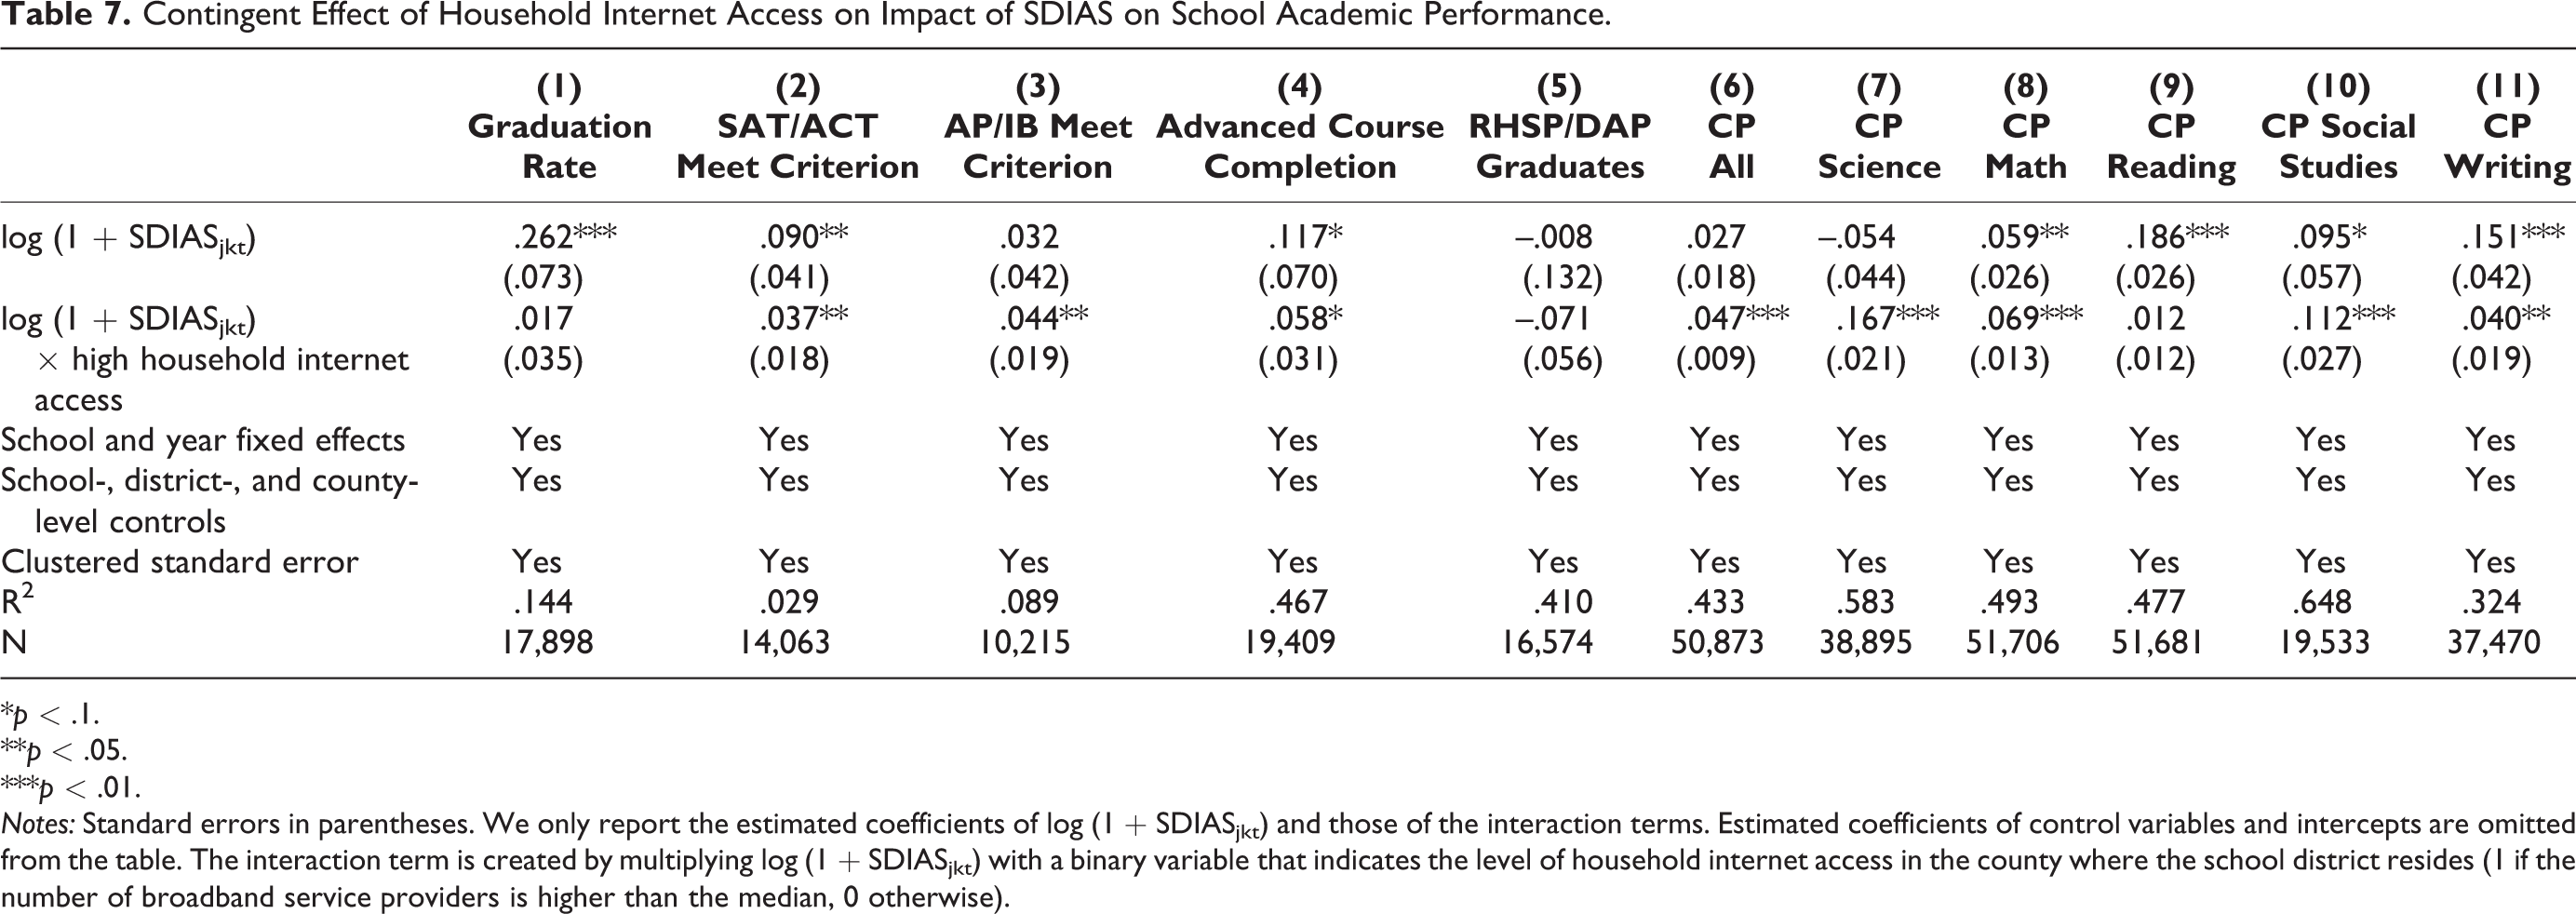
Next, we test whether the effects of SDIAS on school academic performance vary by the level of household internet access by interacting log(1 + SDIASjkt) with a binary variable that indicates the level of household internet access in the county where the school district resides (1 if the number of broadband service providers is higher than the median, 0 otherwise). Results are reported in Table 7. First, similar to the main findings, there is a statistically significant and positive main effect of SDIAS for 7 out of 11 indicators of school academic performance. Second, there are statistically significant and positive interaction effects of household internet access on the link of SDIAS with 8 out of 11 indicators of school academic performance. This pattern of results suggests a synergy between SDIAS and the preexisting level of internet exposure in the regions where school districts are located.
Contingent Effect of Household Internet Access on Impact of SDIAS on School Academic Performance.
*p < .1.
**p < .05.
***p < .01.
Notes: Standard errors in parentheses. We only report the estimated coefficients of log (1 + SDIASjkt) and those of the interaction terms. Estimated coefficients of control variables and intercepts are omitted from the table. The interaction term is created by multiplying log (1 + SDIASjkt) with a binary variable that indicates the level of household internet access in the county where the school district resides (1 if the number of broadband service providers is higher than the median, 0 otherwise).
Results: School Disciplinary Problems
Results
Focusing on school disciplinary problems, Table 8 presents the results of fixed-effects model (columns 1–2) and those with correction terms (columns 3–4). The effect of SDIAS on Part I offense–related disciplinary problems is statistically significant and positive (b = .007, p < .05; b = .009, p < .1). The effect of SDIAS on Part II offense–related school disciplinary problems is statistically significant and positive (b = .010, p < .01; b = .016, p < .01).
Impact of SDIAS on School Disciplinary Problems.

*p < .1.
**p < .05.
***p < .01.
Notes: Standard errors in parentheses. We only report the estimated coefficients of log (1 + SDIASjkt) and those of the interaction terms. Estimated coefficients of control variables and intercepts are omitted from the table. The interaction term is created by multiplying log (1 + SDIASjkt) with a binary variable that indicates the level of household internet access in the county where the school district resides (1 if the number of broadband service providers is higher than the median, 0 otherwise).
Robustness Checks
Stepwise inclusion of control variables
Similar to the robustness checks discussed previously, we include control variables in a stepwise manner and verify that the substantive effects of SDIAS on school disciplinary problems are consistent across models (Models 1–4, Table 9).
Summary of Robustness Check: Impact of SDIAS on School Disciplinary Problems.

*p < .1.
**p < .05.
***p < .01.
Notes: Standard errors in parentheses. We only report the estimated coefficients of log (1 + SDIASjkt) in the table. Estimated coefficients of control variables and intercepts are omitted from the table.
Alternative operationalization of SDIAS
Similar to the robustness checks discussed previously, we operationalize SDIAS using SDIAS per pupil (Models 11–12 of Table 9), school district connectivity spending (Models 13–14 of Table 9), and school district connectivity spending per pupil (Models 15–16 of Table 9). Results are consistent.
Alternative model specification
Using Poisson regression in our context may suffer from overdispersion (i.e., the conditional variance is larger than the conditional mean), creating very small standard errors. We estimate the model using a (1) population-averaged negative binomial specification (Model 6 of Table 9) and (2) unconditional estimation of a fixed effects negative binomial model by including dummy variables for all school districts (Model 7 of Table 9). Another concern is that excessive zeros in our data may come from separate data-generating processes. To account for this, we estimate the model using a zero-inflated Poisson regression (Model 8 of Table 9). Finally, the results may be sensitive to the functional form, so we estimate the model using SDIAS instead of log (1 + SDIASjkt) (Models 9–10 of Table 9). Whereas the effect of SDIAS on Part II school disciplinary problems is robust to alternative model specifications, that of SDIAS on Part I school disciplinary problems is sensitive to these specifications. Therefore, we focus on presenting the implications based on the effects of SDIAS on Part II school disciplinary problems for the remainder of the article.
Substantive Implications: Disciplinary Costs of SDIAS
From a school district’s perspective, it is important to recognize the cost of SDIAS, so the school district can refine its strategic communication to its customers (i.e., parents and students). Because Part II offense–related school disciplinary problems represent violent or negative behaviors (e.g., under the influence of drugs or alcohol, possessing weapons, engaging in assaults), students who engaged in such behaviors receive expulsions and then are placed in alternative educational programs such as Disciplinary Alternative Education Programs (DAEPs). Expulsions incur both administrative costs and average daily attendance (ADA) losses—that is, because a school district’s ADA is used to calculate the amount of state aid received, the school district stands to lose money when students miss school days due to expulsions. Moreover, DAEPs incur operation costs to maintain the student’s education. We use the link between SDIAS and school disciplinary problems as well as information on ADA loss, administrative cost of expulsions, and operation costs of DAEPs to calculate the disciplinary costs of SDIAS.
Table 10, Panel A, shows the calculation of costs associated with expulsions; according to Phillips (2010), the average cost of expulsions is $170. As with ADA loss, assuming the midpoint of the school year as the average expulsion date, each student loses 90 school days, amounting to $3,780 ADA loss per student (90 × $42 ADA daily loss). Combining the $170 administrative cost with the $3,780 ADA loss leads to an average negative cost of $3,950 per student. In addition, as SDIAS increases by one standard deviation from the mean, Part II offense–related disciplinary problems increases by 5%. 17 Given that the average number of Part II offense–related disciplinary problems is 12.4 in the estimation sample, and there were seven schools in a school district, an increase of 5% is equal to approximately four more students in a school district having Part II offense–related disciplinary problems per year, amounting to the loss of $15,800.
Disciplinary Costs of SDIAS.

a Information obtained from Phillips (2010).
b ADA rate is calculated as
c Information obtained from Texas Appleseed (2012).
Notes: WADA = weighted average daily attendance. In our data, the average number of schools in the district is 7.
As with operation costs of DAEPs, the average cost per seat for Dallas Independent School District is $9,410 (Texas Appleseed 2012), while that for Clear Creek Independent School District is $2,500 (Phillips 2010). We use these two numbers as the upper and lower bounds of the operation cost per seat. Substantively, our estimates indicate that a one-standard-deviation increase in SDIAS is associated with approximately four more students having Part II offense–related disciplinary problems per year for the school district. Given that cost per student per year in a disciplinary alternative education program ranges from $2,500 to $9,410, the operation costs of four more students having Part II offense–related disciplinary problems per year range from $10,000 (i.e., $2,500 × 4)–$37,640 (i.e., $9,410 × 4).
In summary, increased SDIAS generates a total yearly cost of $25,800 to $53,440 for a school district through an increased number of school disciplinary problems. Note that this is a highly conservative estimate, as we did not consider any costs associated with Part I criminal offenses and any indirect costs associated with Part II criminal offenses (e.g., enrollment loss) as well as other downstream consequences (e.g., costs due to lawsuits). Indeed, McCollister, French, and Fang (2010) estimate that depending on the severity of crime, the unit crime cost ranges from $3,532 (larceny/theft) to $1,278,424 (murder).
Contingent Effect of Household Internet Access on the Impact of SDIAS on School Disciplinary Problems
Increased household internet access has been shown to increase neighborhood crime by facilitating anonymous social interactions and reinforcing negative behaviors (Glaser, Dixit, and Green 2002), accelerating exposure to media violence (Anderson and Bushman 2001), and criminal activities (Bhuller et al. 2013; Chan, Ghose, and Seamans 2016).
We test whether the effects of SDIAS on school disciplinary problems vary by the level of household internet access by interacting log (1 + SDIASjkt) with a dummy that indicates the level of household internet access in the county where the school district resides (1 if the number of broadband service providers is higher than the median, 0 otherwise). Columns 5 and 6 of Table 8 show that we do not find evidence to support the notion that the effect of SDIAS on Part I offense–related disciplinary problems is significantly associated with the level of household internet access in the regions (b = −.002, n.s.). However, the effect of SDIAS on Part II offense–related disciplinary problems is stronger in regions with a high level of household internet access (b = .004, p < .05). By implication, providing SDIAS in school districts located in regions with high household internet access needs to be supplemented by investments in monitoring and mitigating any potential negative repercussions.
Conclusion
Although many school district administrators and parents advocate investing in internet access to improve academic outcomes, the contribution of SDIAS to school performance is ex ante ambiguous (see Table 1). We quantify the effects of SDIAS on school academic performance and school disciplinary problems in Texas. Increased SDIAS improves 8 out of 11 academic performance indicators and is associated with a 5% increase in the number of school disciplinary problems related to Part II offenses. Our results also suggest that these effects are exacerbated in regions where households have better internet access. We establish these effects by a combination of different identification strategies and a series of robustness checks to rule out unobservable factors that might potentially drive our results.
By implication, we provide a roadmap for school districts to evaluate the payoffs of SDIAS. First, we uncover both a positive return in the form of an increase in cumulative income for current students in school district and a negative consequence in the form of revenue loss to school due to disciplinary consequences. Specifically, an increase of $.6 million in SDIAS generates a positive cumulative income for students in the school district of $.8–$1.8 million, while creating a $25,800–$53,440 yearly cost for a school district. School district administrators can use this finding to effectively communicate the tangible value of SDIAS to their current customers (parents within the school district) as well as prospective customers (parents choosing which school district to reside in based on academic outcomes).
Second, the positive synergy between SDIAS and household internet access suggests that school districts’ efforts to incentivize and help parents to obtain household internet access can be a good way to help their customers improve academic performance. Indeed, in March 2020, Verizon and the Los Angeles Unified School District announced a partnership to provide internet access to all of the district’s students who do not have internet at home. Third, we provide evidence that suggests that a higher level of household internet access could compound the deleterious effect of SDIAS on school disciplinary problems. By implication, SDIAS should be supplemented with investments in initiatives such as internet safety training, reimagining the boundaries of open school internet access, and/or designing strategies for mitigating any negative repercussions.
The limitations of our research offer directions for future research. First, scholars can investigate the degree to which resource reallocation to safety technology (e.g., in Indiana, Social Net Watcher detects dangerous words posted on social media and alerts the school administrators) or school policies and initiatives (e.g., digital citizenship training) reduce disciplinary problems. Second, while we present suggestive evidence on the effect heterogeneity due to household internet access, future research can provide more direct evidence on the school-level heterogeneity by using information on internet search behavior or internet traffic. Third, our article only examines SDIAS as an aggregate metric; further research could assess the impact of SDIAS at a more disaggregated level by gathering information on functional areas where the spending is allocated (e.g., Wi-Fi) to guide the optimal allocation of SDIAS. Finally, researchers could use our identification strategy to generate empirical generalizations for states beyond Texas.
Supplemental Material
Supplemental Material, Web_Appendix_FINAL_(Chen_Mittal_Sridhar) - Investigating the Academic Performance and Disciplinary Consequences of School District Internet Access Spending
Supplemental Material, Web_Appendix_FINAL_(Chen_Mittal_Sridhar) for Investigating the Academic Performance and Disciplinary Consequences of School District Internet Access Spending by Yixing Chen, Vikas Mittal and Shrihari (Hari) Sridhar in Journal of Marketing Research
Footnotes
Acknowledgments
The authors thank the JMR editorial team; participants at the AMA Winter Academic Conference, University of Houston Marketing Doctoral Symposium, and AMA-Sheth Foundation Doctoral Consortium; and seminar participants at the University of Notre Dame for their helpful comments and suggestions. The authors are also grateful to Qiangming Yan and the staff of Texas Education Agency, Universal Service Administrative Company, and Federal Communications Commission for their help in data collection.
Guest Editor
Robert Meyer
Associate Editor
Fred Feinberg
Declaration of Conflicting Interests
The author(s) declared no potential conflicts of interest with respect to the research, authorship, and/or publication of this article.
Funding
The author(s) received no financial support for the research, authorship, and/or publication of this article.
Notes
References
Supplementary Material
Please find the following supplemental material available below.
For Open Access articles published under a Creative Commons License, all supplemental material carries the same license as the article it is associated with.
For non-Open Access articles published, all supplemental material carries a non-exclusive license, and permission requests for re-use of supplemental material or any part of supplemental material shall be sent directly to the copyright owner as specified in the copyright notice associated with the article.