
Abstract
Using one field and two online lab experiments, this article shows that congruency between shelf layout and a consumer’s internal product categorization increases the perceived variety of the assortment and reduces the perceived complexity of the shelf layout. These assortment perceptions, in turn, heighten purchase intention and satisfaction toward the chosen item. Results are robust across internal categorization measurements (planogram design vs. sorting tasks), congruency measures (distance- vs. matching-based), and products (biscuits vs. yogurt snacks). In the field study, familiarity—operationalized as either consumption frequency or subjective product knowledge—increased the overall effect of categorization congruency and strengthened its pathway through perceived variety (vs. the one through complexity). The authors show how their research can be exploited to improve shelf layouts by optimizing the external categorization. They demonstrate the value of a unifying Bayesian framework for research on behavioral decision making that uses the same set of posterior parameter draws for parameter inference, moderated mediation analysis, and optimization under uncertainty.
Keywords
An important objective of category management is turning shoppers into buyers. Shelf layout—the arrangement of all products for sale in a category—is as critical as the size and composition of the assortment in driving conversion (Nielsen 2015). However, the optimal shelf layout of a category from the retailer’s perspective—the focus of this article—has received little scrutiny. Here, we consider categories such as consumer packaged goods and consumer electronics in offline settings in which products of the same category are presented together across multiple shelves. A key shelf layout decision in these settings is how to “co-locate” (group) items on the shelf (i.e., the external categorization [Lamberton and Diehl 2013]). In this article, we investigate how to best optimize the external categorization.
Consumers have their own internal categorizations of products (Alba and Hutchinson 1987; Rosch et al. 1976). Morales et al. (2005) found that when consumers’ internal categorization is congruent with the external categorization implied by a shelf layout, they think there is more variety and are more satisfied with their choice. Following this insight, our proposed solution for shelf layout design requires (1) a valid measurement of consumers’ internal categorizations, (2) a correct inference regarding how such internal organizations interact with external categorizations to affect purchase behavior, and (3) a methodology to optimize the external categorizations using (1) and (2) as input.
To provide the first component, we explored how to best measure individual-level internal categorization and its congruency with the external categorization of the shelf layout (categorization congruency). Morales et al. (2005) measured internal categorizations on the basis of attribute importance, assuming a hierarchy of attributes. However, observed attributes may not explain internal categorizations well (Blanchard 2011). To address this, we used a planogram and sorting task to measure internal categorizations, which revealed both heterogeneous and nonhierarchical internal categorizations. Another drawback of the categorization measure used by Morales et al. is that its use is limited to product lists. By contrast, our congruency measures (distance vs. matching-based) use richer measurements of internal categorizations and are designed for two-dimensional planograms in which their continuous nature helps identify their relationships with purchase behavior.
We used shopping tasks in which we manipulated the external categorization to identify the relationship between congruency and purchase intention, the second component of our approach. Results provide consistent evidence of a positive effect of categorization congruency on purchase intention (and choice satisfaction, a measure used in prior work on co-location) in both the lab and field across different measures of internal categorization and its congruency. We also explored the underlying process, investigating the extent to which the effect of congruency is channeled through both the perceived assortment variety and the perceived complexity of the shelf layout. Previous work on co-location has focused on perceived variety, equating too much variety with complexity. Distinguishing between these two constructs offers more insight into the underlying mechanisms. We also investigated heterogeneity in the effect of categorization congruency on purchase intention. 1 Specifically, we examined the role of product familiarity, a key construct in the information processing literature (Alba and Hutchinson 1987), which affects how well-developed internal schemas (categorizations) are.
The final component of our approach was to solve a constrained optimization problem that optimizes the aggregate external categorization while accounting for heterogeneity as to both internal categorizations and the effect of categorization congruency on purchase intention. One popular approach to shelf layout design in practice, consistent with consumer decision trees’ (CDTs’) hierarchical model of attributes (e.g., consumers first choose brand, then flavor, etc.), is to assess average attribute salience and then construct an external categorization best matching it. Disregarding the heterogeneity in consumers’ internal categorizations, CDTs end up optimizing fit, not conversion. We show how our approach leads to higher expected conversion.
Our blend of experimental designs (between- vs. within-subjects), correlated (binary) dependent variables (DVs) and correlated mediators, plus our intent to derive normative insights, posed methodological challenges. We addressed these using a unifying Bayesian framework: Bayesian inference to estimate models, Bayesian (moderated) mediation analysis to identify the underlying process, and Bayesian decision theory to optimize external categorization under uncertainty.
Conceptual Framework
Considerable research in marketing and psychology has studied how different assortment dimensions affect consumer behavior. Figure 1 organizes the different assortment studies by focal dimension. Rather than investigate size or composition, we focus on shelf layout. Within this assortment dimension, we explore product placement beyond shelf orientation, focusing on co-location, not stand-alone position.

Taxonomy of assortment dimensions and positioning of our study.
Assortment Size
Meta-analyses of experimental findings on the relationship between assortment size and purchase incidence and satisfaction with the chosen item (Chernev et al. 2015; Scheibehenne et al. 2010) have shown considerable variation in the results. Similar variation in the effect of assortment size can be observed in studies using actual purchases (Boatwright and Nunes 2001; Borle et al. 2005; Sloot et al. 2006; Zhang and Krishna 2007).
Assortment Composition
Considerable attention has also been paid to the effect of assortment composition on purchase intention (Broniarczyk 2008). Hoch et al. (1999) focused on perceived variety as a mediator between assortment composition and satisfaction with it. Their work and that of Van Herpen and Pieters (2002) showed how assortment composition shapes variety perceptions through its effect on product and attribute similarity, controlling for assortment size.
Shelf Layout
Prior research has studied the effect of shelf layout dimensions such as total space (Broniarczyk et al. 1998) and the distribution of facings (Drèze et al. 1994) on conversion to purchase. We focus on a third layout dimension, placement, which refers to the way items are shelved. The first and most studied dimension of placement, location, involves the shelf position that individual products occupy. The position of products on the shelf can reframe brand attention and evaluation (Chandon et al. 2009). Consumers believe that popular products occupy central positions (Valenzuela and Raghubir 2015; Valenzuela et al. 2013). The focus of our study is on the second placement dimension, which specifies how items are co-located (i.e., which items are shelved closer [or grouped] together). Some research has focused on the effect of external categorization—the grouping of items on the shelf—on assortment perceptions and attitudes such as satisfaction (Morales et al. 2005). Mogilner et al. (2008) noted that the presence of categories increases satisfaction, especially for decision makers unfamiliar with the choice domain. This “mere categorization” effect increases when the number of categories grows because such growth signals more perceived variety. Morales et al. (2005) showed that when a consumer is familiar with the category, congruency between the external and internal categorizations leads to greater perceived variety and more satisfaction with the chosen item when using product lists as assortment displays. A third placement dimension is orientation. Deng et al. (2016) found that horizontal displays ease processing to yield higher perceptions of variety and induce choice satisfaction. Besides display orientation, one can also vary the orientation of product grouping (the external categorization), something we will do in one of our lab studies.
Our Contributions
Table 1 summarizes insights obtained by prior work on the placement dimension and our substantive, conceptual, and methodological contributions (see bottom) to this literature stream.
Review of Studies on the Placement Dimension of Shelf Layout.

While Morales et al. (2005) established the relevance of categorization congruency, several issues remain. First, Morales et al. operationalized internal categorizations on the basis of attribute importance order, which reflects a hierarchical model of attributes such as a consumer decision tree (e.g., consumers first choose brand, then flavor, etc.). Although CDTs are widely used in practice for planogram design, they yield limited predictive ability (Decision Insight 2014). In reality, observable product attributes may not well explain internal categorizations (Blanchard 2011). We introduce alternative flexible measures of internal categorizations without assuming attribute-based categorization. Second, in their only experiment focusing on categorization congruency, 2 Morales et al. featured assortments as product lists, arranged in either ascending (congruent) or descending (incongruent) order of attribute importance. Here, we instead use realistic two-dimensional planograms and operationalize categorization congruency as a continuous measure.
In terms of dependent variable, we chose purchase intention to allow the derivation of normative insights for the retailer. We contrast our results to those for choice satisfaction, the typical DV in related research. 3 Much research studying the effect of assortment dimensions on purchase behavior has focused on perceived variety as a mediator (Kahn 2017), often equating excess variety with complexity. Though correlated, perceived variety and complexity are quite distinct. We thus investigate the role of both variety and complexity as separate mediators of impact on categorization congruency toward the outcome variables, as well as the extent that the underlying process is moderated by product familiarity. 4
Few studies (e.g., Broniarczyk et al. 1998; Drèze et al. 1994) have investigated the managerial implications of assortment effects. We fill this void by optimizing external categorization and comparing its expected performance to alternative methods, such as CDT-based layout optimization. Approaches seeking the shelf layout that best matches an average of internal categorizations have two drawbacks. First, they fail to capture the heterogeneity in the underlying individual internal categorizations (Blanchard et al. 2017). 5 Second, their goal is matching layout with internal categorization rather than stimulating ultimate behavior.
By contrast, our approach first (1) determines the match (congruency) of internal categorization with shelf layout at the individual level, (2) determines how much it matters (link with behavior), and (3) assesses the extent to which this varies across respondents (individual-level responsiveness). Next, we optimize a single shelf layout across shoppers in terms of the average expected conversion, predicting behavior at the individual level. Finally, we introduce a unifying Bayesian framework for all of our analyses—a flexible, adaptable approach useful in many similar settings.
Conceptual Model
We define categorization congruency (the independent variable) as the overlap (similarity) between the internal and external categorizations. We posit that this congruency heightens purchase intention and choice satisfaction (the DVs) and that this effect is simultaneously mediated through two assortment perceptions: variety and complexity. Perceived variety of the assortment is defined as “the degree to which a consumer recognizes the flexibility that the assortment offers to satisfy different tastes and needs.” Perceived complexity of the shelf layout is defined as “the extent that the shelf layout confuses consumers viewing it (fails to guide them).” Familiarity with the product category (moderator) is hypothesized to drive perceived variety and complexity effects. Figure 2 presents our conceptual framework.
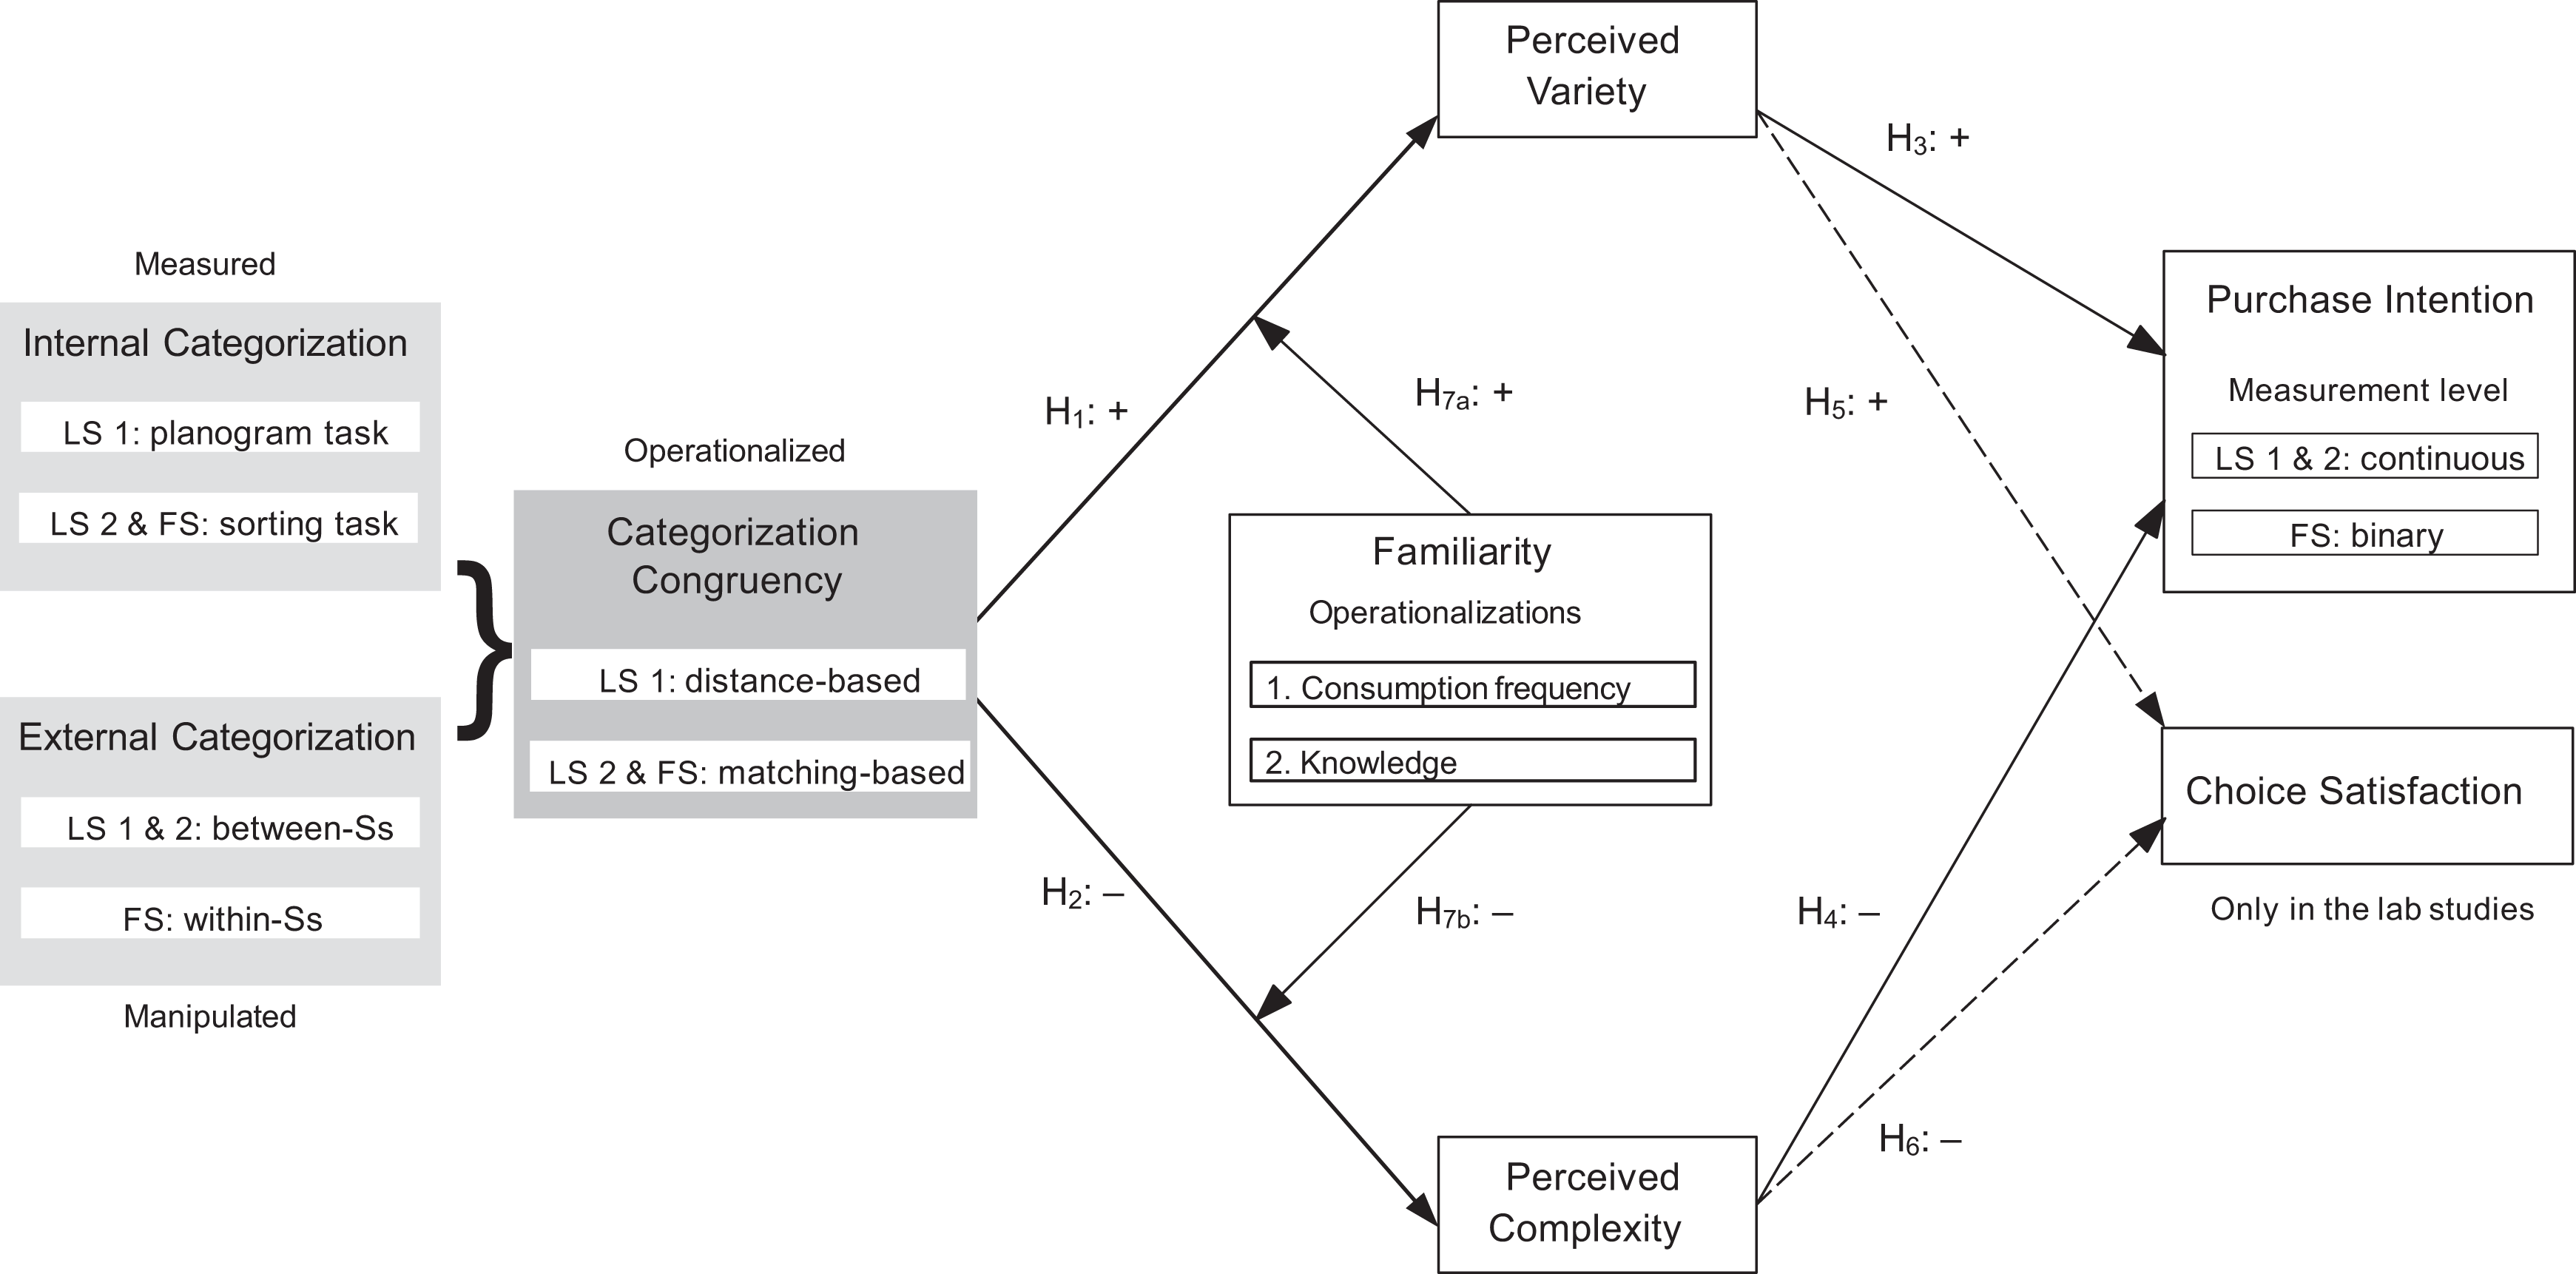
Conceptual framework.
Hypotheses
Effect of categorization congruency on perceptions of assortment variety and complexity
An external categorization that is more congruent with the consumer’s internal categorization simplifies processing of the assortment (Morales et al. 2005; Stayman et al. 1992). This increased processing fluency helps the consumer weigh a wider range of products in the same amount of time and, consequently, see more variety
6
(Morales et al. 2005). Thus,
The increased processing fluency that results from higher congruency enables consumers to focus on products matching their goals and preferences using relevant information (Bettman and Park 1980; Urbany et al. 1989). The ability to selectively attend to only those alternatives that are acceptable lowers the perceived complexity of the shelf layout (Huffman and Kahn 1998).
7
Thus,
Effect of assortment variety and complexity perceptions on purchase intention
In general, consumers prefer more variety (Broniarczyk 2008) because it helps them find their ideal choices (Baumol and Ide 1956) and provides more opportunities for variety seeking (Kahn 1995). The perceived freedom of choice and sense of increased opportunity to achieve preference fit should increase the likelihood of a consumer making a purchase.
8
Therefore,
A complex shelf layout produces information overload that causes consumers to feel overwhelmed. This increases the difficulty of the selection decision. When consumers do not feel they can accurately determine which option best meets their goals or preferences, this results in choice deferral (Anderson 2003). Thus,
Effect of assortment perceptions on choice satisfaction
We define choice satisfaction as the satisfaction with the selected product. More varied assortments raise a consumer’s probability of finding a product closer to their ideal point (Baumol and Ide 1956). The increased proximity to the ideal point should enhance a consumer’s satisfaction with the chosen item. In other words:
A shelf layout perceived to be more complex requires greater cognitive effort from the consumer to make a choice. Decision makers have limited cognitive resources (Simon 1956). To reduce cognitive load, consumers resort to simplifying heuristics (Payne 1976) and lowering choice quality (Lurie 2004), thus decreasing choice satisfaction (Broniarczyk 2008):
Influence of product familiarity
Per information processing theory (Bettman 1979), product category familiarity (Park and Lessig 1981), operationalized either as product-class experience or knowledge (Bettman and Park 1980), affects the types of information and processing people use (Brucks 1985). Shoppers with greater product familiarity have better developed internal schemas (Alba and Hutchinson 1987; Johnson and Russo 1984; Sujan and Bettman 1989) that enhance the effect of categorization congruency on assortment perceptions (Morales et al. 2005) such that
Overview of Our Studies and Modelling Framework
Studies
We conducted one field and two online lab studies to test our model and hypotheses. Figure 2 depicts how the studies vary in (1) setting (lab vs. field), (2) measurement of internal categorization (planogram vs. sorting task), (3) manipulation of external categorization (between- vs. within-subjects), (4) operationalization of categorization congruency (distance- vs. matching-based), and (e) shopping task (forced vs. free choice). Variations across studies serve to assess the robustness of the effects with respect to the measurement of the internal categorizations and the operationalization of categorization congruency. They also allow us to generalize our findings across a spectrum of stimuli and samples. The field study introduces a shelf layout optimization exercise to illustrate the practical relevance of our method.
Modelling Framework
Our hypotheses entail moderated mediation by two correlated mediators: perceived variety and complexity. We used seemingly unrelated regression (SUR) (Zellner 1962) to model assortment perceptions to account for correlated perceptions (1) within experimental conditions in all studies and (2) across conditions in the field study because of its within-subjects design. In the field experiment, we also allowed for unobserved heterogeneity (random slopes) in the effect of congruency on assortment perceptions. In the lab studies, the correlated continuous outcome variables (DVs purchase intention and choice satisfaction) were also modeled through SUR. The field study used a multivariate probit (Chib and Greenberg 1998) to model the correlated (across conditions) binary choice variables.
With standard techniques ill-equipped to perform (moderated) mediation analysis on our models, we used Bayesian mediation analysis. First, our Bayesian inference for model estimation used Gibbs sampling (Rossi and Allenby 2003) to obtain posterior parameter distributions. Next, we computed the posterior distribution of indirect effects by (1) deriving an expression for each indirect effect as a (nonlinear) function of the model parameters and then (2) evaluating this expression for each posterior draw. 9 This efficiently quantified the uncertainty in the indirect effects and allowed us to conduct significance tests in a most direct manner (Zhang et al. 2009). Bayesian mediation analysis also proves efficient (has small standard errors), even in small samples. In the context of moderated mediation analysis, Wang and Preacher (2015) demonstrated that it outperforms bootstrapping. Moreover, it is flexible, accommodating multiple error correlations and unobserved heterogeneity. Finally, using Bayesian analysis can exploit the same posterior distributions for parameter inference, mediation analysis, and optimization under parameter uncertainty (as illustrated in the field study).
The field study involves the most complete model, with lab studies using simpler versions of submodels in the field study. Thus, we present for the field study only the Gibbs sampler and details of the Bayesian mediation analysis.
Lab Study 1: Online Planogram and Shopping Task
Method
Experimental setup
Lab Study 1 employed a controlled online setting. First, we measured participants’ internal categorizations through a planogram design task. Next, they engaged in an online shopping task requiring them to choose an item from an experimental shelf layout on the basis of a manipulated external categorization. Finally, respondents were asked to answer a brief questionnaire measuring the outcome variables, assortment perceptions (mediators), and category familiarity (the moderator). We measured congruency by comparing the internal planogram categorization with the corresponding manipulated external categorization. As stimuli, we used yogurt snacks, a well-known distinct subcategory of the general yogurt category, to limit variability in purchase goals (“a snack between meals”).
Manipulation of external categorizations
In several local supermarkets, the predominant attributes featured for organizing yogurt snacks on the shelf were brand, type, and flavor. Consequently, we used a 3 (external categorization: by brand, by type, by flavor) between-subjects design. We presented each external categorization in a horizontal orientation (groups arranged by shelves), as was typical in all the supermarkets we visited.
Product set and experimental shelf layouts
We used 36 products displayed on six shelves with six products each. We selected a balanced set of products reflecting every attribute level in equal frequency. To permit clear horizontal blocking in a 6 × 6 planogram, we used 6, 3, or 2 levels per attribute. An industry expert explained that there are three types of yogurt snacks: yogurt, yogurt drinks, and cottage cheese. There are several brands and flavors. To meet our design goals, we first manually coded more than 150 SKUs sold in multiple national supermarket chains in terms of brand, type and flavor. Next, a custom-designed algorithm found a subset of 36 SKUs that balance levels and maximize D-efficiency (Huber and Zwerina 1996). 10 The resulting set comprised six brands, three types, and six flavors.
In the layout by brand, we assigned each of the six brands to their own shelf. Within every brand, products of the same type were placed together. Vertical blocking by type and flavor was minimized in the shelf layout by brand. This resulted in an assortment that was clearly organized by brand in the horizontal dimension but randomly in the vertical dimension. For the remaining two attributes, type and flavor, we used similar procedures: clustering by brand within type and within flavor while varying the order of brands to avoid vertical blocking. Web Appendix 1 depicts the resulting shelf layouts.
Planogram task
We developed an online planogram task that asked participants to organize products on the shelf in a way they deemed most intuitive for shoppers like themselves. Distances between products on the planogram served as measure of product dissimilarity, and products placed farther apart reflected greater dissimilarity. 11 This task was inspired by Valenzuela and Raghubir (2015, Study 1a), who asked participants to arrange 25 drinks in a 5 × 5 planogram for a campus bar. In our case, participants first saw an empty shelf layout. Next to it were pack shots (i.e., an image of the product including its packaging) plus descriptions of the 36 yogurt snacks. We then asked participants to construct a planogram that made sense to them (not necessarily to others) and was easy to navigate: Products deemed more similar were to be grouped closer by dragging them nearer to each other within the on-screen shelves. Once a product was placed on a shelf, its description reduced to a simple price tag to add realism. The top part of Figure 3 provides screenshots of the planogram task.

Planogram and shopping task used in Lab Study 1.
Shopping task
To create a realistic shopping environment, we collaborated with GfK NORM, a specialized shopper research agency. Products were professionally photographed and montaged on a set of shelves within GfK NORM’s virtual shopper environment, Simstore. Each SKU had double facings to add realism while controlling for number of facings. Fully stocked shelves ruled out scarcity effects (Van Herpen et al. 2009). Shelf tags included product description, volume, price, and unit pricing, as in local supermarkets. The shopping task is depicted in the bottom part of Figure 3. 12
Compensation and incentive alignment
Beyond a base payment of $4, we also provided participants with a virtual shopping budget of $4, following Poynor and Diehl (2007). Before they chose a product, we disclosed that one out of every 10 participants would also randomly receive an e-coupon for their chosen product, plus any unused money from their budget. 13
Measurement
Congruency between planogram and experimental shelf layout was higher when products placed closer together (farther apart) in the planogram also appeared closer together (farther apart) in the shelf layout. We defined congruency (CONG) between participant h’s planogram design and shelf layout A as the correlation between the distances in the planogram and in the layout:

where ρ is the Pearson correlation coefficient between the pairwise distance of products i and j in the internal categorization of participant h (planogram) and that in shelf layout A (external categorization) as perceived by the same participant. This correlation was computed within-participant across product pairs.
To measure distance, we used individual-level weighted Euclidean distance
14
: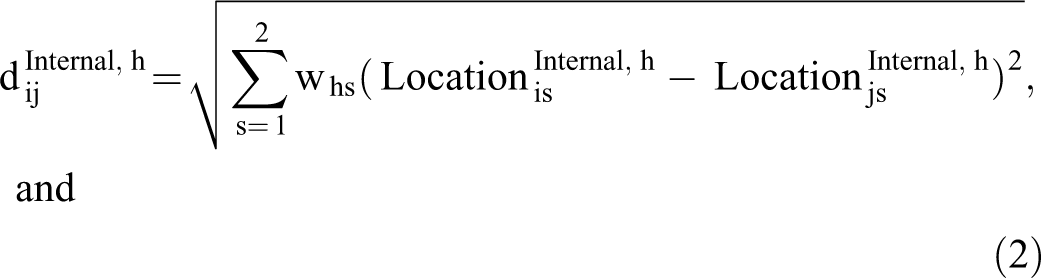

Web Appendix 2 describes how we measured the individual-level distance weights and consequent individual-level distances in the planogram and shelf layout. In short, we had every participant provide distances between five pairs of product locations using an anonymized 6 × 6 shelf layout on a 0–10 scale. From these data, we estimated the individual-level distance weights using hierarchical Bayes. The average (across participants) normalized posterior mean (across posterior draws) vertical weight was .67 (SD = .17), meaning that, on average, differences in the vertical dimension (between shelves) were weighted twice as much as the differences in the horizontal dimension (within a shelf). This 2:1 weighting aligns with studies finding the perceptual span to be twice as large in the horizontal versus vertical direction (Deng et al. 2016; Ojanpää et al. 2002). 15
Following Kahn and Wansink (2004), we measured perceived variety of the assortment (α = .86) using three items: “The assortment of yogurt snacks gives me a lot of variety for me to enjoy” (1 = “strongly disagree,” and 7 = “strongly agree”), “The assortment of yogurt snacks gives me at least one product I like” (1 = “strongly disagree,” and 7 = “strongly agree”), and “How much variety do you think there is in this assortment?” (1 = “very little variety,” and 7 = “very much variety”). 16 We measured perceived complexity of the shelf layout (α = .89) with four items: “The organization of this assortment is (1) messy, (2) cumbersome, (3) confusing, and (4) irritating” (1 = “not at all applies,” and 7 = “very much applies”). This scale was based on items used in Chen and Wells (1999) gauging how well a website presents itself and guides its users (e.g., Bruner et al. 2005, p. 115).
We rated consumption frequency by asking “How frequently do you consume yogurt as a snack?” (1 = “several times per week,” 2 = “once a week,” 3 = “2–3 times per month,” 4 = “once a month,” 5 = “every second or third month,” 6 = “once every four to six months,” 7 = “once every year,” 8 = “more rarely,” and 9 = “never”). We reverse-coded these scores so that larger numbers reflected higher consumption frequency. 17 We measured subjective product knowledge by a single item, as done in Beatty and Smith (1987): “Compared to the average person, how much knowledge do you think you have about the yogurt snack assortment when it comes to knowing which features are important in the choice for a specific brand or type of yogurt snack?” (1 = “no knowledge at all,” and 7 = “very extensive knowledge”).
We measured purchase intention using a single item: “If this were a real purchase situation, how likely would you be to actually buy the chosen item?” (1 = “highly unlikely,” and 7 = “highly likely”). Following Deng et al. (2016), we measured satisfaction with the chosen item (α = .95) using three items (1 = “not at all,” and 7 = “extremely”): “How much do you like the yogurt snack you have chosen for yourself?,” “How satisfied do you think you would be if you eat the yogurt snack you chose?,” and “How confident are you that the yogurt snack will satisfy you?” We also measured attribute importance for five attributes: the three used to create the shelf layouts (brand, type, flavor) plus volume and price. This allowed us to compare each stated attribute importance with the customers’ internal categorizations.
Sample
We used a commercial, nationally representative panel. Participants aged 18–75 years were screened on the basis of whether they had purchased or consumed yogurt at least once in the past three months. We aimed for 100 participants per condition, enlisting 334 participants with none dropped due to incomplete data. Participants were 51.2% female, with variation across age groups (18–30 years: 11.7%, 31–40 years: 14.1%, 41–50 years: 21.0%, 51–65 years: 34.1%, and 66–75 years: 19.2%).
Results
Internal categorizations
The constructed planograms revealed substantial heterogeneity in internal categorizations across participants. For most participants, the categorizations could not be well explained using the underlying product attributes, including the ones they deemed important. Web Appendix 3 provides the details.
Descriptive statistics
The descriptive statistics can be found in the top part of Table 2. 18 There is a moderate negative correlation between the two mediators, confirming the benefit of modelling them under SUR. Congruency is positively (negatively) and significantly associated with the perceived variety of the assortment (perceived complexity of the shelf layout), providing initial evidence for H1 and H2. Moreover, both mediators are significantly related to purchase intention (choice satisfaction) in the posited way, providing evidence for H3 and H4 (H5 and H6). The two operationalizations of familiarity—consumption frequency and subjective knowledge—had a modest positive correlation (ρ = .15, p = .000).
Descriptive Statistics for Lab Studies 1 and 2.

Notes: Number of participants is, respectively, 334 and 665 in Lab Studies 1 and 2. Five participants from Lab Study 2 were excluded due to incomplete data; the statistics in the table pertain to the reduced sample used in the analyses (N = 660). Each cell depicts two numbers: the top one relates to Lab Study 1, the bottom one to Lab Study 2. Because horizontal orientation was only varied in Lab Study 2, the corresponding entries for Lab Study 1 indicate n/a (= not applicable). “Congruency” is short for categorization congruency. It is operationalized as the correlation between the distances in Lab Study 1 and as the Rand index in Lab Study 2. PAV and PAC stand for perceived variety of the assortment and perceived complexity of the shelf layout, respectively. Horizontal orientation = 1 if the orientation is horizontal, 0 if vertical. All p-values correspond to two-tailed tests of significance, where *p < .10, **p < .05, ***p < .01. For multi-item measures, the corresponding Cronbach’s alpha is reported on the diagonal between brackets.
Estimation results
We Gibbs-sampled 100,000 draws, retaining each 10th of the last 50,000 to obtain 5,000 draws for posterior parameter inference. Table 3 reports the posterior means and standard deviations for the response coefficients, alongside the Bayesian p-values. Following Carlin and Louis (1998, p. 53) we define the Bayesian p-value as the fraction of posterior draws that are inconsistent with the hypothesized sign, meaning they attain the opposite sign or are equal to zero. Unlike their classical counterpart, Bayesian p-values can be interpreted as the strength of evidence for the null hypothesis (Marsman and Wagenmakers 2017) and conversely for the alternative hypothesis (Wedel and Dong 2020).
Posterior Parameter Estimates for Lab Study 1.

Notes. This table contains the posterior means and standard deviations of the parameters, as well as the corresponding one-sided Bayesian p-values. In cases where a hypothesis regarding the sign of the corresponding parameter was formulated, the Bayesian p-value denotes the fraction of posterior draws that have the opposite sign than expected or that are equal to zero (Carlin and Louis 1998, p. 53; Wedel and Dong 2020). In other words, the Bayesian p-value represents the proportion of posterior draws that are inconsistent with the formulated hypothesis. In our setting (symmetric priors around 0), and unlike the equivalent used in classical statistics, a Bayesian p-value can be interpreted as the strength of evidence for the statistical null hypothesis (Marsman and Wagenmakers 2017) or, conversely, our hypothesis, which is the alternative hypothesis (Wedel and Dong 2020). Bayesian p-values below .05 can be seen as strong evidence for our hypothesis, below .01 as very strong evidence, and below .001 as decisive evidence (Wedel and Dong 2020, p. 9). When there is no hypothesis, we report the fraction of draws that have a negative sign or are equal to zero. Boldface indicates that the 95% posterior credible interval excludes zero. “Congruency” is short for categorization congruency and is operationalized here as the correlation between the distance on the planogram (internal categorization) and the experimental external categorization. Familiarity is operationalized as subjective knowledge. All variables are standardized. Across all models, the VIF statistics never exceed 1.2, revealing no sign of multicollinearity. Web Appendix 5 replicates this table for the case in which familiarity is operationalized as consumption frequency.
Because results are similar in both operationalizations of familiarity for all studies, we only present the results for subjective knowledge in the main text. 19 We report results of two submodels: assortment perceptions and outcome variables for two model specifications. Version 2 includes all sub-model congruency–familiarity interactions. Because posterior credible intervals for most interactions include zero, we provide the estimation results for Version 1 that excludes the interaction terms, thus favoring a more efficient analysis.
Next, we discuss the evidence per hypothesis, referring to the effect size b, which is the posterior mean of the regression coefficient, and p, the Bayesian p-value. We use a cutoff for the Bayesian p-values of .05. Values lower than that can be interpreted as strong evidence for the elicited hypothesis (Wedel and Dong 2020). We find insufficient evidence of moderation of the congruency effect on assortment perception in Model 2 (b = −.011, p = .587 for variety, H7a and b = −.077, p = .068 for complexity, H7b; both 95% posterior credible intervals [= PIs] include zero). Consequently, we will discuss the remainder of the estimation results and the mediation results for Model 1. Congruency increases variety (b = .147, p = .004) and decreases complexity perceptions (b = −.187, p = .001) in the expected direction (H1 and H2). Variety increases (b = .543, p = .000; b = .602, p = .000, consistent with H3 and H5) and complexity decreases (b = −.039, p = .205; b = −.128, p = .002, consistent with H4 and H6) intention and satisfaction, although the 95% PI for the perceived complexity effect on purchase intention includes 0. The effect of complexity on intention is modest and smaller than the effect of variety.
Mediation analyses
Figure 4 (top) displays the outcomes of the Bayesian mediation analysis. Each graph shows the posterior decomposition of the total congruency effect on the DVs. The effect of congruency on both DVs is mediated by the two assortment perceptions, and at least 68.8% of the total effect is indirect across all outcome variables. For both DVs, the credible interval of the total indirect effect excludes 0 while the partial direct effect proved insignificant. The total effect of congruency on both purchase intention and choice satisfaction is positive but rather small. Moreover, the largest part of the indirect effect (> 77% across outcome variables) traverses the variety perception versus complexity perception pathway.

Decomposition of the standardized effect of congruency on purchase intention and choice satisfaction for the lab studies.
Discussion
In Lab Study 1, we used a planogram task to capture consumers’ internal product categorizations. A continuous congruency measure positively affected consumers’ intention to purchase and choice satisfaction. Bayesian analyses revealed that the underlying process of mediation occurs primarily through perceptions of assortment variety and, to a lesser extent, complexity.
Lab Study 2: Online Card Sorting and Shopping Task
Method
Experimental setup
This study adopted the setup of Lab Study 1 using the same shopping task (including incentive alignment), products, shelf layouts, and measures, except for internal categorization and congruency. This time, we used a card sorting task to measure consumers’ internal categorizations. The card sorting measure of internal categorization did not confound grouping or distance, which is a potential criticism of the measure used in the planogram task. Moreover, card sorting allowed us to assess the robustness of our results to the measurement of internal categorizations. For external categorizations, we also varied the orientation of the product groupings to see whether our results generalize across orientations of categorization. This produced a 3 (external categorization: by brand, type, and flavor) × 2 (orientation of categorization: horizontal vs. vertical) between-subjects design.
Shelf layouts
We used the same horizontal shelf layouts as in Lab Study 1. The vertical shelf layouts simply transposed their horizontal equivalents whereby shelves became columns (see Web Appendix 1 for more details).
Card sorting task
Participants engaged in an online card sorting task featuring product images corresponding to 36 products on the shelf layouts. They were asked to place products into as many groups as desired on the basis of product similarity (see Figure 5). This proved easier than the planogram task and yielded cleaner measurements of the internal categorizations.

Online sorting task used in Lab Study 2.
Measurement
We operationalized congruency (CONG) between the internal categorization of participant h and the external categorization implied by shelf layout A as a fraction of dyads that classified either paired (in the same group) or separate (in distinct groups) for both categorizations:

where I(·) is 1 when its argument is true, 0 otherwise;
Sample
We sampled different consumers from the same commercial panel used in Lab Study 1. Of the total 665 respondents participating (five excluded due to incomplete data), 52.9% were female, and sample age varied (for 18–30 years: 9.1%, 31–40 years: 13.5%, 41–50 years: 19.1%, 51–65 years: 39.2%, 66–75 years: 19.1%).
Results
Internal categorizations
The sorting task again showed considerable heterogeneity across participants’ internal categorizations. Categorizations again defied explanation on the basis of observed attributes, including those deemed important by participants. See Web Appendix 7 for details.
Descriptive statistics
Table 2 (bottom) provides the descriptive statistics 20 with no significant differences between the two lab studies regarding assortment perceptions and outcome variables. The two mediators were again moderately negatively correlated. Congruency was positively (negatively) and significantly correlated with the perceived variety (perceived complexity) of the assortment, confirming H1 and H2. Moreover, both variety and complexity significantly related to purchase intention (choice satisfaction) in the expected direction, further validating H3 and H4 (H5 and H6). Given the survey data input, the correlation of purchase intention with choice satisfaction was high for both lab studies (.64 and .67), as expected.
Estimation results
Table 4 lists results for subjective knowledge from the same models in Lab Study 1, with the added control variable for orientation (horizontal vs. vertical).
Posterior Parameter Estimates for Lab Study 2.
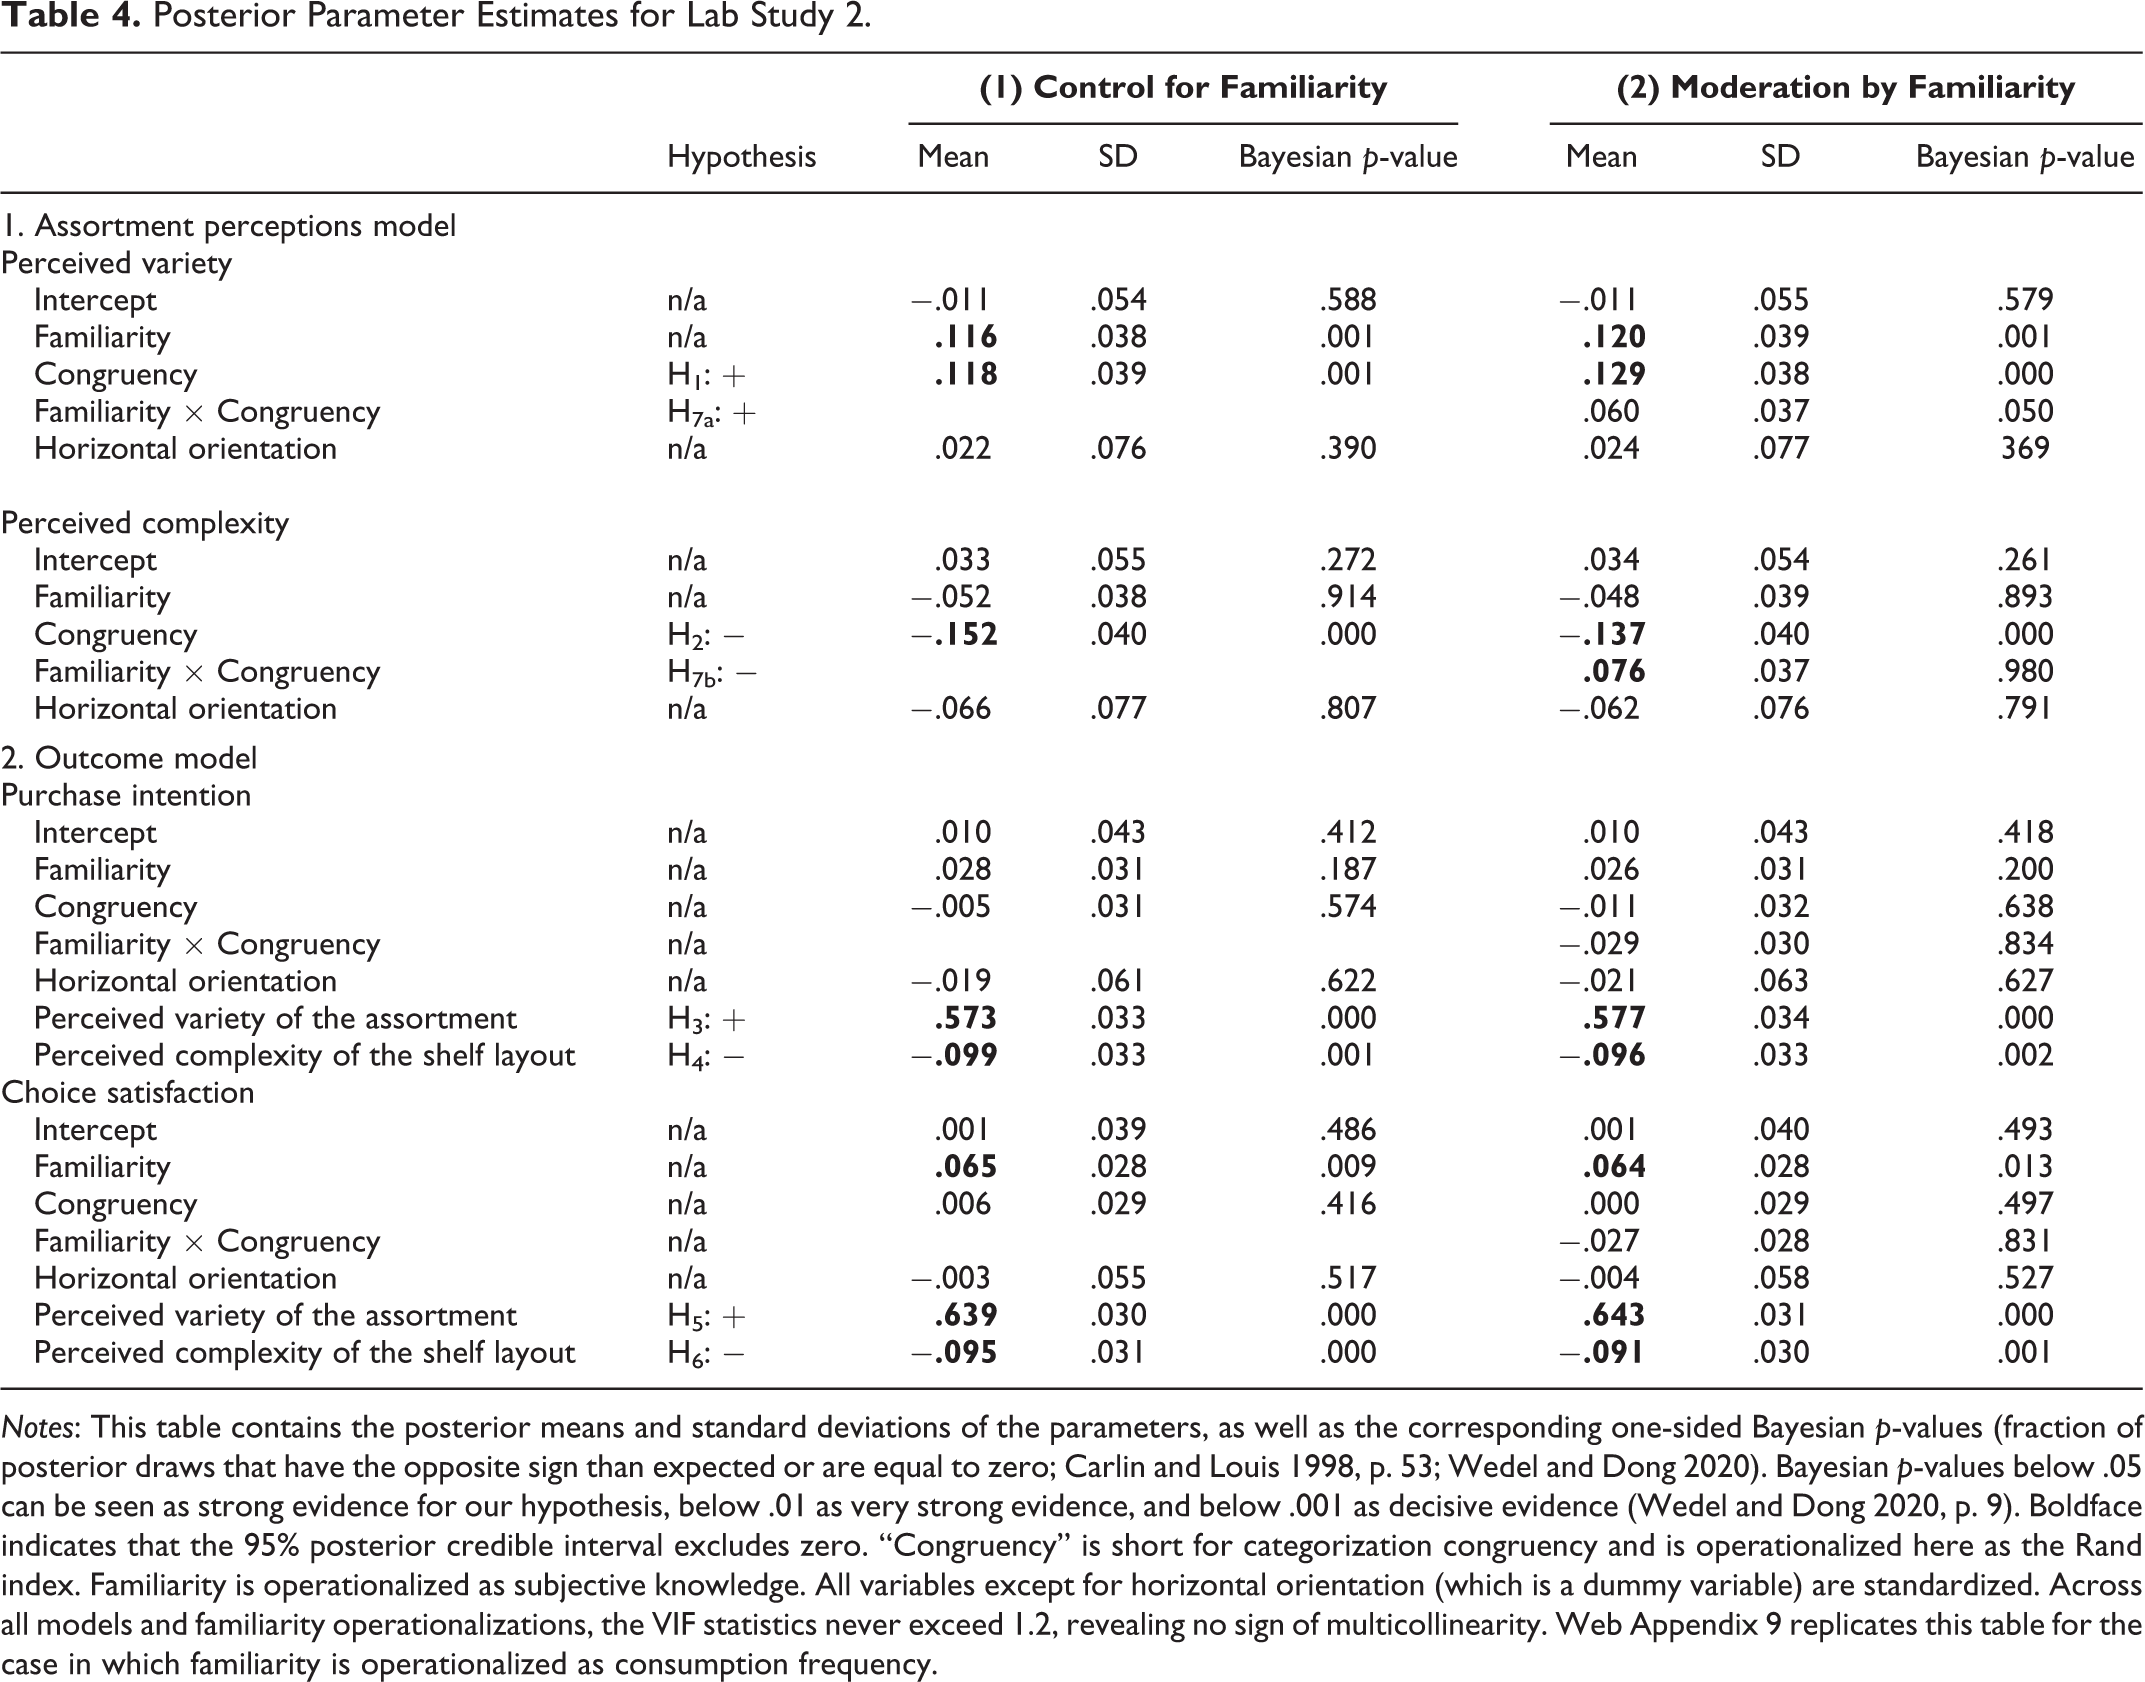
Notes: This table contains the posterior means and standard deviations of the parameters, as well as the corresponding one-sided Bayesian p-values (fraction of posterior draws that have the opposite sign than expected or are equal to zero; Carlin and Louis 1998, p. 53; Wedel and Dong 2020). Bayesian p-values below .05 can be seen as strong evidence for our hypothesis, below .01 as very strong evidence, and below .001 as decisive evidence (Wedel and Dong 2020, p. 9). Boldface indicates that the 95% posterior credible interval excludes zero. “Congruency” is short for categorization congruency and is operationalized here as the Rand index. Familiarity is operationalized as subjective knowledge. All variables except for horizontal orientation (which is a dummy variable) are standardized. Across all models and familiarity operationalizations, the VIF statistics never exceed 1.2, revealing no sign of multicollinearity. Web Appendix 9 replicates this table for the case in which familiarity is operationalized as consumption frequency.
We again find insufficient evidence of moderation of the congruency effect on variety (b = .060, p = .050, H7a; 95% PI includes 0) in Model Version 2. For complexity, we do find moderation, albeit in the opposite direction from what we expected (b = .076, p = .980, H7b). Due to these mixed results we again base our discussion of the remaining parameter estimates and the mediation analyses on Model Version 1 without the interaction effects. The effects of a horizontal orientation on the assortment perceptions model are in the expected direction (increasing perceived variety and lowering perceived complexity), though insignificant. In line with the boundary condition in Study 5 of Deng et al. (2016) in which the effect of horizontal orientation disappears, the task in our study was to choose a single item. Thus, our results seem consistent. Congruency has a strong positive (negative) effect on perceived assortment variety (complexity), confirming support for H1 (b = .118, p = .001) and H2 (b = −.152, p = .000) from Lab Study 1. The results for the outcome model again display a positive effect of perceived variety on purchase intention (b = .573, p = .000) and choice satisfaction (b = .639, p = .000, consistent with H3 and H5) and a negative effect of perceived complexity on the respective outcome variables (b = −.099, p =.001; b = −.095, p =.000, consistent with H4 and H6). This time, in contrast with Lab Study 1, perceived complexity significantly decreased purchase intention. However, its impact still underperformed the positive variety effect.
Mediation analyses
The bottom of Figure 4 depicts the Bayesian mediation analyses results. Given the lack of moderation by familiarity, we again performed mediation analysis but excluded familiarity from the model (Version 1 in Table 4). Once again, the effect of congruency was mediated by the two assortment perceptions. Across both outcome variables, at least 77.7% of the total effect was indirect, with the credible interval of the total indirect effect excluding 0 while the partial direct effect proved insignificant. The total effect of congruency on both purchase intention and choice satisfaction again proved significant though remained small. Most of the indirect effect (> 80%) again operated through variety rather than through complexity.
Value of our congruency measure
We used attribute importance to construct an attribute-based binary measure of congruency in line with Morales et al. (2005). This measure equals 1 when the external categorization reflects the attribute deemed most important by the participant (brand, type, or flavor) and 0 otherwise. Web Appendix 10 presents the estimation results corresponding to Table 4. The effect of this congruency measure is not significantly different from zero in any of the models, underscoring the value of our continuous congruency measure.
Summary
Controlling for grouping orientation, Lab Study 2 replicated the main findings of Lab Study 1: congruency positively affects both purchase intention and choice satisfaction, mediated by variety and complexity perceptions. Most of the indirect effect operates through variety perceptions. Results proved very similar across different operationalizations of familiarity.
Field Study Inside a Supermarket
Method
Experimental setup
We engaged with shoppers entering a suburban grocery store of a national chain and told them they would receive three packages of biscuits to compensate them for participating. A total of 120 shoppers participated (90.8% female,
21
Mage = 42.2 years, SD = 10.6),
22
and each participant was led to a special section of the store to perform a card sorting task similar to that of Lab Study 2. We arranged a table with visual representations (picture with price) of 36 SKUs regularly sold in the biscuit category. We asked participants to group these products into as many groups as desired on the basis of product similarity (see Figure 6, Panel A).
23
The grouping that represented a shopper

Visual impression of the field experiment.
Next, we led participants to three posters in sequence, each representing a different shelf layout (by brand, price, or type) of the same 36 SKUs (Panel C). 24 The posters mimicked the size of products and shelf heights that shoppers encounter in that store. Before viewing any displays, we told participants they would see a biscuit assortment and asked them to behave regularly by shopping and choosing one (or none) of the products (the choice task). A research assistant recorded the decisions, and the order of the three shelf layouts was counterbalanced across participants.
After each choice task, the participant filled out a short questionnaire that included items assessing assortment perceptions (Panel D). After the final choice task, we asked consumers to rate their consumption frequencies and subjective product knowledge. Only the horizontal orientation was used, which was in line with the retailer’s practice for this category. In summary, we used a within-subjects design 25 in which six possible shelf layout orders were varied between subjects, with every participant engaging in three choice tasks.
Measurement
Congruency was again operationalized as the Rand index. Purchase intention was equal to 1 if the participant chose any of the items and 0 if not. All remaining constructs were captured as before, except consumption frequency, which we measured by asking the open-ended question, “How often do you consume biscuits per week?” Because of the invariance in prior results across the two DVs, and because free choice was allowed here, we did not score choice satisfaction.
Modelling framework
The field study used two submodels: (1) a SUR with random slopes for the mediators (perceptions) and (2) a multivariate probit model for the purchase intentions. See Web Appendix 12 for the model formulation; the corresponding Gibbs sampler can be found in Web Appendix 13.
The mediation analysis was complicated by nonlinearity in the purchase intention model. To overcome this, we used the increasingly popular counterfactual framework (Imai et al. 2010; Pearl 2001; Robins 2003; Robins and Greenland 1992) over the regression-based approach (also dubbed the product-based or Baron and Kenny (1986) approach). In the linear world, where lab studies or analyses for latent utilities (unlike purchase intention) in the field study reside, our counterfactual framework yields the same formulae derived under the regression-based approach (see Web Appendix 14). To summarize, we used Bayesian counterfactual mediation analysis in all studies. In the lab studies, and in the field study when focusing on utilities (rather than purchase intention probabilities), the regression-based method produced the same results.
Results
Internal categorizations
Web Appendix 15 summarizes the outcomes of the sorting task. Consistent with the lab studies, there was considerable heterogeneity in internal categorizations, which again were quite different from the attribute-based experimental external categorizations.
Descriptive statistics
Table 5 provides descriptive statistics for all the variables across the three experimental shelf layouts. 26 The correlation between perceived variety and complexity (−.49) is substantial and larger than in the lab studies. (Web Appendix 17 provides evidence of discriminant validity between the two constructs). Congruency is positively (negatively) and significantly associated with the perceived variety (perceived complexity) of the shelf layout, providing field study evidence for H1 and H2. Both mediators significantly related to purchase intention in the expected direction, providing support for H3 and H4. 27 Whereas the lab study correlation between perceived variety and purchase intention doubled that from perceived complexity, the opposite was true in the field study.
Descriptive Statistics for Field Study 1.
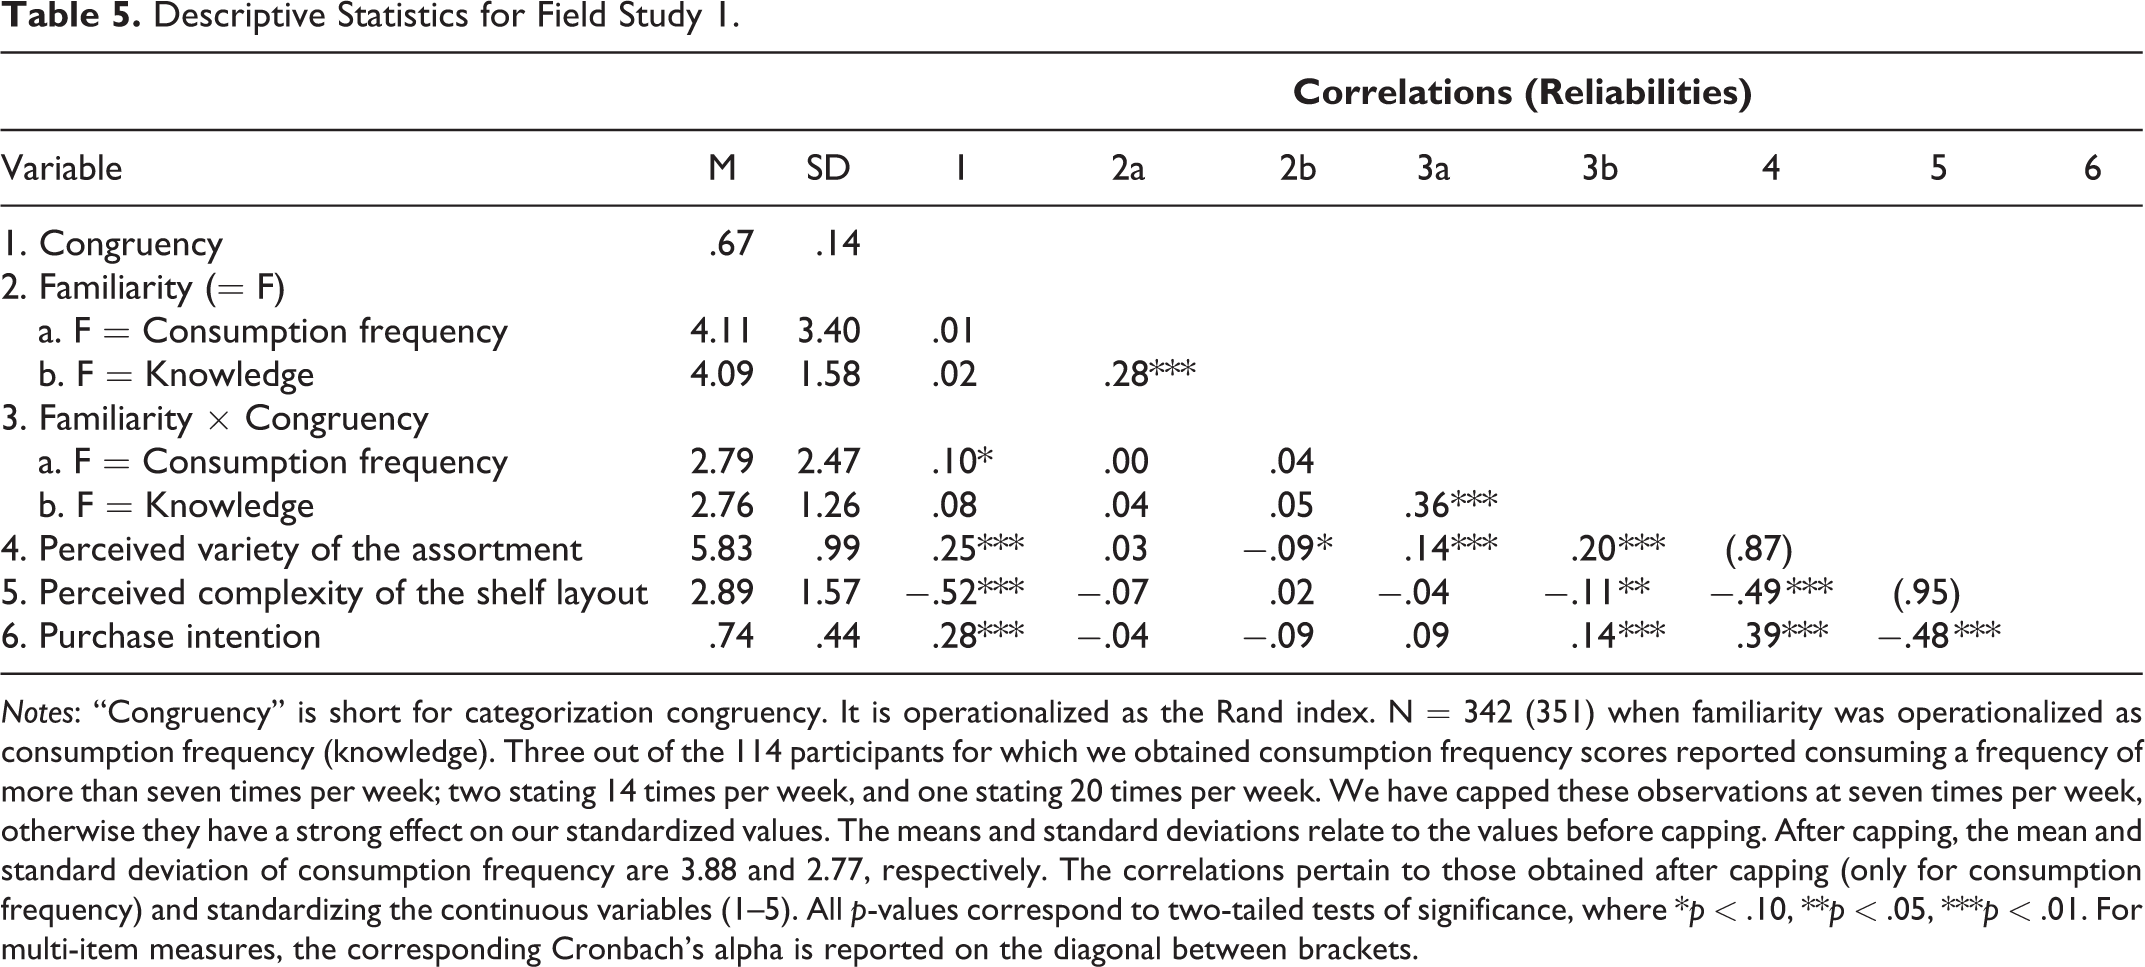
Notes: “Congruency” is short for categorization congruency. It is operationalized as the Rand index. N = 342 (351) when familiarity was operationalized as consumption frequency (knowledge). Three out of the 114 participants for which we obtained consumption frequency scores reported consuming a frequency of more than seven times per week; two stating 14 times per week, and one stating 20 times per week. We have capped these observations at seven times per week, otherwise they have a strong effect on our standardized values. The means and standard deviations relate to the values before capping. After capping, the mean and standard deviation of consumption frequency are 3.88 and 2.77, respectively. The correlations pertain to those obtained after capping (only for consumption frequency) and standardizing the continuous variables (1–5). All p-values correspond to two-tailed tests of significance, where *p < .10, **p < .05, ***p < .01. For multi-item measures, the corresponding Cronbach’s alpha is reported on the diagonal between brackets.
Estimation results
We ran the Gibbs sampler for 100,000 draws and retained each 10th draw of the last 50,000 to secure 5,000 draws for posterior parameter inference. Table 6 summarizes the posterior distributions of the response coefficients for the assortment perceptions and purchase intention submodels regarding subjective knowledge.
Posterior Parameter Estimates for the Field Study.

Notes: This table contains the posterior means and standard deviations of the parameters, as well as the corresponding one-sided Bayesian p-values (fraction of posterior draws that have the opposite sign than expected or are equal to zero; Carlin and Louis 1998, p. 53; Wedel and Dong 2020). Bayesian p-values below .05 can be seen as strong evidence for our hypothesis, below .01 as very strong evidence, and below .001 as decisive evidence (Wedel and Dong 2020, p. 9). Boldface indicates that the 95% posterior credible interval excludes zero. “Congruency” is short for categorization congruency and is operationalized here as the Rand index. Familiarity is operationalized as subjective knowledge. All variables except for purchase intention are standardized. Across all models, the VIF statistics never exceed 1.7, revealing no sign of multicollinearity. Web Appendix 18 replicates this table for the case in which familiarity is operationalized as consumption frequency. Another robustness check, in which we used a composite index of familiarity (sum of z-scores of product knowledge and consumption frequency) yielded highly similar results. Details available on request.
There is a positive effect of congruency on the perceived variety of the assortment (b = .234, p = .000) and a negative effect on the perceived complexity of the shelf layout (b = −.497, p = .000), which is consistent with H1 and H2. Contrary to the lab studies, there is evidence of a positive interaction between congruency and familiarity on the perceived variety of the assortment (H7a; b = .163, p = .000), but the hypothesized impact of familiarity on the effect of congruency toward lower perceived complexity hypothesized in H7b again failed to be significant (b = −.069, p = .064). 28 There was a positive effect from perceived variety of the assortment (b = .403, p = .000) and a negative effect from perceived complexity of the shelf layout (b = −.544, p = .000) on purchase intention, confirming H3 and H4. In contrast with the lab studies, the field study effect of complexity dominated that of variety. The main effect of congruency and its interaction with familiarity was positive and significant (b = .174, p = .009), also indicating moderation of the partial direct effect.
Mediation analyses
Results show the effect of congruency on purchase intention depended on the level of familiarity. Following Spiller et al. (2013), we performed mediation analyses for each level of familiarity (1–7 for subjective knowledge) in a (Bayesian) floodlight analysis. Figure 7 depicts the posterior decomposition of the total effect of congruency (for a +1 SD increase from the mean) on purchase intention and its components for each level of knowledge.

Decomposition of the effect of increasing congruency by 1 standard deviation from the mean on purchase intention for the field study.
Panel A reveals the total effect of congruency as positive and significant for all levels of knowledge > 2 (on a 1–7 scale). This effect increases with levels of familiarity. To illustrate, from a knowledge level of 4 (about average), the expected rise in purchase intention of .11 (95% PI = [.07, .14]) then doubles to .22 (95% PI = [.14, .31]) at the highest knowledge level (=7). The mediated proportion of the total effect proved substantial (see panel B). Across all levels of knowledge, at least 45% of the total effect was indirect. Panel C shows that while the majority of the indirect effect runs through complexity (vs. variety) perceptions, the route through perceived variety did strengthen at higher levels of familiarity.
Robustness Checks
1. Carryover effects
Within-subject designs have potential carryover effects (Lynch 2015). We tried to minimize these effects through counterbalancing by both ordinal position and order. The resulting design also allowed us to test for carryover effects. Web Appendix 20.1 presents the results of these tests, which rule out carryover effects as major influences on our findings.
2. Alternative congruency measures
In Web Appendix 20.2, we show a positive effect of congruency for each of two alternative matching-based coefficients—the Jaccard measure (Jaccard 1901, 1912) and the adjusted Rand index (Hubert and Arabie 1985)—in part mediated by the two assortment perceptions. Each was moderated by familiarity.
3. Second-stage moderation
Web Appendix 20.3 presents an extended purchase model with interactions between the mediators (perceptions) and familiarity. Both interaction terms capturing second-stage moderation were insignificant, whereas the main effects of both perceptions remain significant with expected signs. Thus, evidence supports first- over second-stage moderation.
Maximizing Expected Conversion
To illustrate the potential of our method in practice, we first used the estimated models to find the optimal external categorization that maximizes average expected conversion across participants. We next contrasted the optimal categorization with the experimental categorizations and a CDT-based categorization. What complicates a focus on average expected purchase intention is its highly nonlinear objective function of the binary decision variables with stochastic parameters. Therefore, we sought the external categorization that maximized average expected utility, which is far more feasible, using Bayesian Decision Theory (Rossi and Allenby 2003). 29 Web Appendix 21 provides the formal definition as a mathematical program of the so-called utility maximization problem. This serves as a near equivalent to the congruency maximization problem in which the goal is maximum average congruency, the sole difference being the coefficients in the objective function.
These two optimization problems were reformulated into linear binary programs that were implemented in AIMMS 3.9 software and solved with the CPLEX 12.6.2 solver. The CDT-based categorization was derived through hierarchical cluster analysis on the aggregated internal categorizations. First, we aggregated the individual-level sorting data into a co-occurrence (similarity) matrix. Then, we converted the co-occurrences to distances to form the input for the cluster analysis. Web Appendix 22 contains the details.
The external categorization that maximizes average congruency also maximizes average expected utility, 30 demonstrating the usefulness of the congruency metric. Figure 8 compares the optimal external categorization to the CDT-based reference and those yielded by the three experimental shelf layouts in terms of average expected purchase probability and average congruency. The optimal external categorization, described in Web Appendix 21, is a hybrid of the type- (84% overlap) and brand-based (80% overlap) categorizations. The CDT-based categorization (see Web Appendix 23) also blends the type- (92% overlap) and brand-based categorizations (75% overlap). A comparison between the optimal and CDT-based categorizations having an overlap of 85% can also be found in Web Appendix 23.

Performance of the optimized external categorization.
To ensure the reasonableness of our solution, we asked an experienced manager (20+ years in CPG retail) to group items on the basis of the joint occurrence data and product attributes. The manager generated eight groups whose performance was statistically and significantly different from, but close to, our optimal solution (average congruency = .780 vs. .788, average expected purchase intention = .812 vs. .818). The manager’s solution featured more groups than the CDT version (8 vs. 4) but less than the optimal one (10). Its overlap with the CDT and optimal solutions scored .86 and .92, respectively (Rand index).
The optimal categorization increased average congruency by 5.7 percentage points versus the best performing experimental categorization (type-based). It improved average congruency by 3.6 percentage points versus the CDT-based categorization. This translates to increased average expected purchase intention of 2.8 and 2.4 percentage points (95% PIs exclude 0) versus the type-based and CDT-based external categorizations, respectively.
Even though we did not optimize expected conversion directly, the congruency- and utility-maximizing shelf layouts led to expected improvements in purchase conversion. This suggests for a narrow-margin industry (∼1% of net sales; Bolton et al. 2010) that layout optimization represents a viable means for raising category sales and profitability. Because our exercise considers only expected rather than actual behavior, these results should be viewed only as an indication of its full potential.
Discussion
The field study confirmed the usefulness of a sorting task for capturing the heterogeneity and nonhierarchical nature of consumers’ internal product categorizations. The continuous congruency measure was a strong determinant of consumer intention to purchase from a field study assortment. The effect sizes were larger than in the lab studies, especially for the route through perceived complexity. While stylized assortments used in lab studies seem easier to process, typical larger and less balanced assortments (as in the field study) are more complex. An external categorization optimized using our approach increased the expected average purchase probability more than the CDT-based version that is common to industry practice.
General Discussion
Findings
Two online lab experiments and a field test demonstrated a positive effect of the congruency between a consumer’s internal categorization of a product category and the external categorization implied by the shelf layout toward purchase intention and choice satisfaction. Mediation analyses revealed that higher categorization congruency simultaneously increases variety and decreases complexity perceptions, in turn driving more favorable purchase behavior.
There were differences in results between the field study, which involved the biscuit category, and the lab studies, which focused on yogurt snacks. In the more controlled lab settings, the effect of congruency was substantially less. Moreover, although the route through complexity was smaller than the variety path in the lab studies, complexity dominated the field test. Finally, only in the field study did we detect evidence of moderation by familiarity operationalized either as consumption frequency or self-rated knowledge: As familiarity rose, the effect of categorization congruency strengthened while complexity’s mediating role declined in favor of variety.
Variation in results across studies may stem from differences in design, stimuli, and sample. In terms of design, the lab studies used a balanced set of products. Field study findings of larger effect sizes could indicate that effects are stronger when the assortment is less balanced. The lab studies forced a selection, which contrasts with the free choice task in the field study. Forced choice tasks tend to steer shopper focus more toward options tied to less decision conflict and regret (Dhar and Simonson 2003). In the lab settings, forced choice may have prompted less variation in purchase intention and choice satisfaction. Also, the biscuit category (field) seemed more complex than yogurt snacks (lab). In line with this, participants reported (insignificantly) greater knowledge of the yogurt snacks. Lower category complexity in the lab studies could have reduced the need for categorization congruency.
Finally, the field study engaged onsite shoppers that were 90% female, whereas lab studies used an online panel in which gender was relatively balanced. Participants in the online sample were also experienced testers in marketing research. Their proficiency in carrying out such tasks may also explain the reduced need for categorization congruency. Future research should define the contexts that affect the (relative) importance of categorization congruency.
Contributions
Our study makes methodological, substantive, and conceptual contributions. As for methodology, we show internal categorization to be less attribute-based than has been assumed in related research, using sorting and planogram creation tasks to capture this. We introduced new continuous congruency measures (matching vs. distance-based) to exploit these richer internal categorizations, which are well-suited for two-dimensional planograms. Finally, we show the value of a unifying Bayesian framework for research on behavioral decision making, with a single set of posterior parameters being utilized for (1) parameter inference (hypothesis testing); (2) moderated, counterfactual-based, mediation analysis in the case of a nonlinear choice model; and (3) shelf layout optimization under parameter uncertainty.
Substantively and conceptually, our work advances several research streams by first extending studies on the intersection of product categorization and shelf layout (e.g., Mogilner et al. 2008). We replicate the positive effect of categorization congruency on choice satisfaction (Morales et al. 2005) for different congruency measures, in the lab, in the field, and across different stimuli and shelf orientations (horizontal vs. vertical). We demonstrate similar effects for purchase intention.
We further show that complexity perceptions also matter, whereas most research on the effect of different assortment dimensions (size, composition, and shelf layout) on consumer behavior has focused solely on perceptions of variety as the mediating force. Today’s retailers engage in a balancing act: offering more variety without increasing complexity. Our study pioneers the consideration of (perceived) variety and complexity as separate constructs. We find that categorization congruency can provide a win-win: simultaneously increasing perceptions of variety while softening perceptions of complexity, leading to more favorable shopper behavior.
Finally, we contribute to the literature on category management by illustrating in a field study that an external categorization that optimizes average congruency yields higher expected conversion than one based on a consumer decision tree.
Managerial Implications and Future Research
Recently, assortments have attracted the same level of attention paid to price and promotion as category profit drivers. Most research has focused on optimizing the composition of the assortment (e.g., Rooderkerk et al. 2013). Our study shows the potential of optimal shelf layout of the assortment and the value of categorization congruency as a metric. Retailers can measure their customers’ internal categorizations. Because these vary locally, layouts may be best customized at the store level. Online environments represent even more fertile areas to apply our insights at the individual level, as consumers may derive internal categorizations from previous visits to the focal or similar categories. Online layouts can then present a customized best-fit layout for each returning visitor’s internal schemas. All told, optimal shelf layout not only increases consumer welfare—it boosts retailer profitability.
Future research could investigate the role of shopping modes (e.g., browsing vs. choosing). It would be interesting to see whether the effect of congruency on assortment perceptions diminishes when consumers are in browsing mode. Moreover, although we tried to minimize carryover from measuring the internal categorization on subsequent behavior in the shopping task with questions in between, future research could explore longer times between the two tasks, or study how internal categorizations are formed over repeated shopping trips. It would also be interesting to study new products for which no (clear) internal categorization exists. Future studies could also look at whether shelf signage (using visual cues such as colors and labels to identify groups on the shelf) affects the role of categorization congruency. Interactions between the other two assortment dimensions—size and composition—and layout form another fertile ground for research. For instance, does the size of the assortment (number of SKUs) or the composition (e.g., highly similar vs. more dissimilar items) moderate the effect of congruency? We hope future research will explore these avenues.
Supplemental Material
Supplemental Material, Appendices.R4 - Incorporating Consumer Product Categorizations into Shelf Layout Design
Supplemental Material, Appendices.R4 for Incorporating Consumer Product Categorizations into Shelf Layout Design by Robert P. Rooderkerk and Donald R. Lehmann in Journal of Marketing Research
Footnotes
Acknowledgments
The authors thank Simon Blanchard, Joel Huber, Kinshuk Jerath, Carl Mela, and Rik Pieters for valuable input. They also thank seminar participants at the Fuqua School of Business at Duke University, Mannheim Business School, Naveen Jindal School of Management at UT Dallas, and Tilburg University. They thank GfK NORM (Marije van der Hoeven, Simone Pieters, Francesca Smedberg, Melissa Ozkul, Paulien Rauwenhoff, Wernard Schmit, Manne Sterner, and Amanda van Haaster) for the implementation of the online lab studies and the use of their Simstore virtual shopping environment. They also thank Constant Berkhout for input on the shelf layout optimization task. Thanks are also due to Kevin de Kok of Kevelop for developing the planogram app. They are grateful for the excellent research assistance of Marianne van Gorp and Thomas van Meerkerk.
Associate Editor
Dhruv Grewal
Declaration of Conflicting Interests
The author(s) declared no potential conflicts of interest with respect to the research, authorship, and/or publication of this article.
Funding
The author(s) received no financial support for the research, authorship, and/or publication of this article.
Notes
References
Supplementary Material
Please find the following supplemental material available below.
For Open Access articles published under a Creative Commons License, all supplemental material carries the same license as the article it is associated with.
For non-Open Access articles published, all supplemental material carries a non-exclusive license, and permission requests for re-use of supplemental material or any part of supplemental material shall be sent directly to the copyright owner as specified in the copyright notice associated with the article.