
Abstract
Although previous studies have established a direct link between customer-based metrics and stock returns, research is unclear on the mediated nature of their association. The authors examine the association of customer satisfaction and abnormal stock returns, as mediated by the trading behavior of short sellers. Using quarterly data from 273 firms over 2007–2017, the authors find that short interest—a measure of short seller activity—mediates the impact of customer satisfaction and dissatisfaction on abnormal stock returns. Customer dissatisfaction has a more pronounced effect on short selling compared with customer satisfaction. In addition, customer satisfaction and dissatisfaction are more relevant for firms with low capital intensity and firms that face lower competitive intensity. The results show that a one-unit increase in customer satisfaction is associated with a .56 percentage point increase in abnormal returns, while a one-unit increase in customer dissatisfaction is associated with a 1.34 percentage point decrease in abnormal returns.
Keywords
Assessing the impact of customer satisfaction on various firm financial metrics is a central focus of marketing scholarship. Extant research has demonstrated that customer satisfaction positively affects financial metrics such as Tobin’s q, cash flows, revenue, market share, and profitability (Anderson, Fornell, and Rust 1997; Ittner, Larcker, and Taylor 2009). Several studies have also examined the association between customer satisfaction and abnormal stock returns. This research is presented in Figures W1–W3 of the Web Appendix. Multiple studies (Aksoy et al. 2008; Fornell et al. 2006; Fornell, Morgeson, and Hult 2016; Luo, Homburg, and Wieseke 2010; Raithel et al. 2012) report a significant and positive impact of customer satisfaction on abnormal returns. In contrast, other studies (Bell, Ledoit, and Wolf 2014; Ittner, Larcker, and Taylor 2009; Jacobson and Mizik 2009; O’Sullivan, Hutchinson, and O’Connell 2009; Sorescu and Sorescu 2016) fail to consistently find a significant effect of customer satisfaction on abnormal returns, reporting a null association. We carefully review the effects from these studies and summarize them in the Web Appendix. The conclusion that emerges from a careful review of studies is that the association between customer satisfaction and abnormal returns is not as well established as some may believe and that more research is needed to understand it.
Four critical aspects of our study shed further light on this relationship. First, most previous studies explore only the direct link between customer satisfaction and abnormal returns. Luo, Homburg, and Wieseke (2010) is one exception, and they show that the dispersion in financial analysts’ recommendations partially mediates the association of customer satisfaction and firm financial outcomes. We build on their study by arguing that short selling activity—a previously unexplored investor behavior—mediates the association of customer satisfaction and abnormal stock returns. This mediation via the investor route is distinct from the customer route commonly used to explicate the association between customer satisfaction and long-term financial metrics (e.g., Tobin’s q) through product market outcomes (e.g., higher profits, market share) (e.g., Anderson, Fornell, and Rust 1997) or via customer behaviors such as repurchase, recommendations, and positive word of mouth (Mittal and Frennea 2010). In contrast, this research fits with recent studies that investigate the mediating role of investor behavior in the relationship between marketing assets and stock returns (Cillo, Griffith, and Rubera 2018; Luo et al. 2014). Potentially, our results provide a more persuasive argument to board members of public companies aiming to maintain and increase investments in customer satisfaction. In this way, our work also links the customer satisfaction literature to the extensive research in finance, showing that short sellers are a crucial class of investors who affect the behavior of the stock market.
Second, except for one study by Raithel et al. (2012), all of the previous studies in Panel A of Table 1 use the American Customer Satisfaction Index (ACSI) to measure customer satisfaction. Raithel et al. (2012) use J.D. Power’s customer satisfaction measure. In contrast to these studies, the current study uses YouGov’s measure of customer satisfaction (cf. Colicev et al. 2018; Du, Joo, and Wilbur 2018). YouGov’s customer satisfaction measure is based on daily customer surveys and is only available to paying clients. The high frequency and reduced accessibility (through a paid subscription) of YouGov’s customer satisfaction should provide professional investors, such as short sellers, with an information advantage. Thus, YouGov’s customer satisfaction measure fits well with our study’s objectives and for future studies that aim to link customer satisfaction to investor behavior and abnormal returns.
Research in Marketing on the Association Between Customer Satisfaction and Financial Performance.

Notes: CS = consumer satisfaction; CD = consumer dissatisfaction. The full reference list is provided in the Web Appendix.
Third, prior studies have assumed a symmetric association between customer satisfaction and abnormal stock returns. Expanding the scope of studies in Panel A of Table 1, we investigate the well-known behavioral logic that dissatisfaction is asymmetrically more consequential than satisfaction for customer outcomes (Anderson and Sullivan 1993; Mittal, Ross, and Baldasare 1998). Whether this is true for abnormal returns is an open issue and has not been investigated. Our results show that a one-unit increase in customer satisfaction (dissatisfaction) is associated with a .56 percentage point increase (1.34 percentage point decrease) in abnormal returns. Investors should not treat customer satisfaction and dissatisfaction as interchangeable constructs.
Fourth, the value of a company’s customer satisfaction may depend on the extent to which it is substitutable, imitable, and exploitable by the company (Srivastava, Shervani, and Fahey 1998). Studies in Panel A of Table 1 predominantly used portfolio analysis, which precluded them from taking a contingent approach investigating factors moderating the value relevance of customer satisfaction. This research shows that a firm’s capital intensity and the industry’s competitive intensity can strengthen or attenuate the effect of customer satisfaction and dissatisfaction on short selling. To the best of our knowledge, even behavioral studies (Anderson and Sullivan 1993; Mittal, Ross, and Baldasare 1998) have not explored factors that can moderate the asymmetric impact of customer satisfaction and dissatisfaction on downstream outcomes. By showing that the moderating effects of a firm’s capital intensity and industry’s competitive intensity are more pronounced for the customer dissatisfaction–short selling link, our research provides more nuanced guidance to investors and executives. For example, executives in firms with lower capital intensity and operating in industries with lower competitive intensity are more vulnerable to short selling in response to changes in customer satisfaction and dissatisfaction.
Theoretically, we build on the motivation, ability, and opportunity (MAO) framework (Heider 1958; Wang, Gupta, and Grewal 2017) to argue that short sellers (1) are motivated to exploit any informational advantage in the stock market (Diamond and Verrecchia 1987), (2) possess superior ability in detecting investment opportunities (e.g., Engelberg, Reed, and Ringgenberg 2012), and (3) use the opportunity to gain an informational advantage relative to average investors (e.g., Denev and Amen 2020). This approach is consistent with academic and business literature that documents a link between short selling and firm’s operations, strategy, and abnormal stock returns (Jia, Gao, and Julian 2020; Melloy and Rooney 2019; Shi, Connelly, and Cirik 2018) (see Table W2 of the Web Appendix). Our core argument is that an increase in customer satisfaction (dissatisfaction) lowers (elevates) short selling intensity in a firm’s stock, which affects abnormal stock returns. Stated differently, this research examines the extent to which short selling mediates the association between customer satisfaction (and dissatisfaction) and abnormal returns.
Empirically, we use a multiple-source data set of 273 firms spanning 2007 to 2017, yielding 7,383 firm-quarter observations. Our modeling framework consists of a multi-equation system with short interest and abnormal returns as dependent variables. To address identification issues, we use unexpected changes in all the variables, model the two main equations conditional on the selection equation to correct for selection bias, and utilize control functions with peer-of-peers’ instruments to alleviate omitted variable bias. We estimate our model with the conditional mixed process (CMP; Roodman 2011), which is an estimation framework based on the maximum likelihood class of estimators. It allows a flexible error structure with cross-correlations, a mix of discrete and continuous dependent variables, conditioning on the selection equation, and multilevel effects. Results show that an unexpected increase in customer satisfaction (customer dissatisfaction) reduces (increases) short selling activity, which mediates the relationship between customer satisfaction/dissatisfaction and abnormal returns. An industry’s competitive intensity and the firm’s capital intensity moderate this mediation. Robustness checks show that these results are impervious to a broad set of alternative measures and model specifications.
Conceptual Framework
Short Sellers as Sophisticated Investors
According to Investopedia, an investor education website, “Short selling is an investment or trading strategy that speculates on the decline in a stock or other securities price. It is an advanced strategy that should only be undertaken by experienced traders and investors” (Chen 2020). Short selling is the opposite of long investing or buy-and-hold investing strategy. Whereas long investors seek positive stock returns by buying a stock at a low price and selling it at a higher price, short sellers bet on stock price declines. A short seller opens a short position by borrowing shares from investors who own them and then sells those shares at the prevailing market price (Securities and Exchange Commission [SEC] 2014). The short position can be closed at a later time by buying the shares at the prevailing market price and returning them to the lending investor. A short seller profits if the stock price at the time of closing the short position is lower than the stock price at the time of opening the short position. Although any investor may participate in short selling, institutional investors and hedge funds conduct over 95% of the short sales on the New York Stock Exchange (Boehmer et al., 2020).
Short selling activity is empirically measured by short interest, calculated as the ratio of the number of firm’s shares shorted to the firm’s total number of shares outstanding. As an example, for a firm with 100 million shares outstanding and 5 million of these shares shorted, the short interest is 5% (5 million/100 million). The range of short interest in our sample is between .1% and 25%. Next, we present our conceptual framework, as illustrated in Figure 1.

A conceptual framework for customer (dis)satisfaction, short interest, and abnormal returns.
Short Selling and the MAO Framework
The MAO framework builds on Heider (1958) and Wright (1973) and has been recently used to examine managers’ processing of information associated with research and development (R&D) spending and social capital utilization (Wang, Gupta, and Grewal 2017). The MAO framework states that a person’s motivation, ability, and opportunity explain information processing during decision making. We use the MAO framework to argue that short sellers are more motivated and have higher ability and opportunity than ordinary investors to utilize customer satisfaction (or dissatisfaction) information.
Motivation to gather and process information
In the words of the billionaire investor Mark Cuban, “If you don’t fully understand what you are doing, you can lose more on the short side since a stock can only fall to zero, but it can go up to any price. To me, that just gives me reason to do more homework, not to shy away” (Cuban 2005, emphasis added). Consistent with this quote, the higher exposure to downside risk should motivate short sellers more than ordinary investors to gather and process customer satisfaction information.
To illustrate short sellers’ risk exposure (based on Hull [2009], p. 179), consider that Ot1 is the opening stock price of the short position, Ct2 is the closing stock price of the short position, and TC(t2 − t1) is the total transactions cost over a t2 − t1 period associated with short selling. By definition, Ct2 is bounded between [0, ∞) as the value of the stock at the closing can be at minimum 0, while at maximum infinite. The short seller profit is given by (Ot1 − Ct2) − TC(t2 − t1) on the investment of TC(t2 − t1). Thus, the range of profits to a short seller, Πshort, is given by
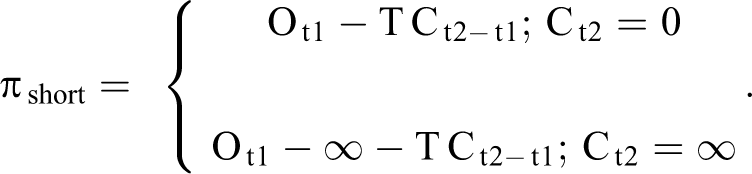
For finite Ot1 and TC(t2 − t1), Πshort ∈(−∞, Ot1 − TC(t2-t1)]. In contrast, a long investor (i.e., the investor who bought the stock for Ot1) does not incur TC(t2 − t1) associated with short selling. Upon selling the stock for Ct2, the range of profits to long investors, Πlong, is given by

For finite Ot1, Πlong ∈[−Ot1, ∞). Compared with the long investor, the short seller faces potentially infinite losses or downside risk. In addition to risks associated directly with the price of the stock, short sellers face additional risks as they must borrow shares, post collateral on borrowed shares, and pay a daily loan fee until they close the short position. In addition to the downside risks such as margin calls, short sellers also risk loan recalls and changing loan fees. 1 This is consistent with previous research showing that decision makers faced with the potential of incurring downside risk are more motivated to invest time and effort in their decisions (Mittal, Ross, and Tsiros 2002). In a similar vein, short sellers are more likely to use nonfinancial metrics such as customer satisfaction in their investment research to mitigate downside risk.
Ability to gather and process information
Institutional short sellers, such as hedge funds, expend considerable resources to cultivate and support their ability to obtain information about firms’ financial fundamentals such as market capitalization (Dechow et al. 2001) and accounting statements (Drake, Rees, and Swanson 2011). This enables short sellers to take short positions ahead of negative events, such as adverse news in earnings announcements and restatements (Desai, Krishnamurthy, and Venkataraman 2006) and short-term overreaction in stock prices (Diether, Lee, and Werner 2009). Short sellers are also posited as being more informed about upcoming earnings news than stock analysts’ recommendation changes (Boehmer et al. 2020). In support of this notion, Drake, Rees, and Swanson (2011) show that short interest is used by investors in trading against analysts’ recommendations.
Short sellers’ ability to gather and process information is supported by a thriving marketplace providing alternative, more nontraditional information to them. In 2020, the estimated size of this market is $7 billion (Denev and Amen 2020). A Deloitte survey of 110 funds managers showed 71% had used or considered using alternative data (e.g., customer data) in their investment decisions (Deloitte 2020). YouGov is one such database of customer satisfaction pertinent to short sellers. In an interview with us, Alexander Denev, the Head of AI – Financial Services for Deloitte, stated, The existence of the signal in YouGov means that this information and signal is not overcrowded. One of the reasons could be that YouGov started only recently to sell their data. YouGov is not that obvious, is not widespread, which makes it a very select data set. And although hedge funds do not disclose their trading strategies, from my conversations, they use alternative data such as customer sentiment and survey data for short selling in particular (as opposed to long-only investors). The market for alternative data is fragmented, with big hedge funds still overly relying on overcrowded signals (e.g., Bloomberg, Compustat). YouGov is used by hedge funds for a specific set of investment decisions. The existence of the signal in YouGov stems from the fact that YouGov is only becoming popular but its signal is not yet overcrowded in the marketplace. Another advantage of YouGov is that it can provide a highly frequent (i.e., daily) glimpse into the customer base almost in real time.
Opportunity to gather, process, and use information
Relative to ordinary investors, short sellers are also more likely to have opportunities to collect, process, and use customer satisfaction information that facilitates short selling. YouGov BrandIndex is one such database and is described in the Web Appendix.
YouGov is a costly subscription-based private database that is frequently updated in real time. Thus, short sellers who subscribe to YouGov may potentially gain an informational advantage relative to other publicly available databases (e.g., the ACSI). YouGov has comprehensive coverage of brands with customer satisfaction information available for more than 1,800 U.S. brands.
Customer satisfaction measured using YouGov or a company’s internal customer survey provides unique information not as easily incorporated into the stock price. This occurs for several reasons. First, many firms that regularly collect customer satisfaction do not consistently report forward-looking customer satisfaction information (Bayer, Tuli, and Skiera 2017). As evidence, company reports (e.g., financial statements, 10-K reports) do not systematically provide customer satisfaction information (Aksoy et al. 2008). One reason may be that most companies treat their customer satisfaction measurement as confidential and strategic and do not wish to publicize it (Morgan, Anderson, and Mittal 2005). To test this thesis, we gathered information on publicly listed firms, as reported in Figure W9 in the Web Appendix. Among them, on average, 543 firms (5.8% of 9,371 firms from 2007 to 2017) disclosed that they tie executive compensation to customer satisfaction. Among these 543 firms, only 8%–13% have ACSI scores available and 9%–10% have YouGov customer satisfaction scores available. Importantly, many of the firms covered by the ACSI and YouGov do not overlap. Thus, while the stock market should, in theory, incorporate the publicly available information on firms covered by the ACSI, it likely does not incorporate the information on firms covered by YouGov.
Second, many syndicated firms such as J.D. Power & Associates that collect customer satisfaction information establish an embargo period (e.g., two quarters to one year) during which customer satisfaction ratings are not available to the public. Therefore, ordinary investors are unlikely to have the opportunity or ability to use these sources of customer satisfaction information. Moreover, the level of statistical sophistication needed to analyze customer satisfaction information and its financial ramifications may not be widespread among ordinary investors. In contrast, during this embargo period, investors such as hedge funds can gain information advantage from YouGov’s customer satisfaction measure. A YouGov executive stated in a private discussion, We actively sell YouGov BrandIndex data to investments companies at an ever-increasing rate. The majority of clients in this industry are large hedge funds (quants, fundamentals, and quantimentals), but we’ve also been approached by some of the biggest asset managers in the world, private equity funds, financial data providers and investment banks…. This is due in part to the cost of the YouGov data (above six figures) but also the understandable lack of resources among retail investors.
Customer Satisfaction and Dissatisfaction: Hypothesis Development
Research shows that negatively valenced information is weighted disproportionately more than positively valenced information during decision making (Baumeister et al. 2001; Ito et al. 1998; Rozin and Royzman 2001; Vaish, Grossmann, and Woodward 2008). Rozin and Royzman (2001, p. 306) assert that the “combination of negative and positive entities yield evaluations that are more negative than the algebraic sum of individual subjective valences would predict.” Specific to customer satisfaction, studies show that one unit of negative attribute performance has a more substantial impact on overall satisfaction than an equivalent one unit of positive performance (Anderson and Sullivan 1993; Mittal, Ross, and Baldasare 1998). Customer dissatisfaction is also more consequential than customer satisfaction in people’s likelihood to engage in word of mouth (Anderson 1998) and willingness to pay (Homburg, Koschate, and Hoyer 2005). Why? Negative information such as service failure and product performance below expectations is processed more systematically than positive information and weighted more heavily in satisfaction judgments (Mittal, Ross, and Baldasare 1998). We separately examine the association of customer satisfaction and dissatisfaction with short selling.
Unexpected changes in variables
The efficient market hypothesis (Fama 1965) contends that the price of a stock incorporates all publicly available information. By implication, stock prices should change only in response to unexpected changes in any value-relevant information. To the extent that short sellers have the motivation, opportunity, and ability to utilize customer satisfaction information differently than ordinary investors, we hypothesize an association between unexpected changes in customer satisfaction and short selling. This theoretical approach also guides our empirical testing described subsequently. Thus,
Moderators of Customer Satisfaction–Short Interest Link
Drawing on resource-based theory (Barney 1991; Wernerfelt 1984), we argue that customer satisfaction is a resource that is valuable, rare, and imperfectly imitable by competitors (Morgan 2012). Consequently, competitive intensity and capital intensity moderate the effect of customer satisfaction on short selling because these factors affect the value and imitability of customer satisfaction and, thus, the informational value of customer satisfaction for short sellers. 2 The value of customer satisfaction as a resource depends on the degree of its inimitability by its competitors. Customer satisfaction as a resource has a lower value if it is more imitable by competitors and substitutable for consumers (e.g., a firm’s high customer satisfaction may be substituted by very low prices by competitors with low customer satisfaction). Similarly, if a firm has high capital intensity, it would be slower to respond to changes in its environment and less likely to capitalize on its customers’ satisfaction potential to the fullest. In this case, the value of customer satisfaction is likely to be lower. Next, we outline our argument for hypothesizing the moderating effects.
The Moderating Role of Competitive Intensity
Competitive intensity is defined as the degree of competition faced by a focal firm (Grewal and Tansuhaj 2001). When competitive intensity is high, rivals can more easily satisfy customers of a focal firm because their offerings are relatively more similar and interchangeable (Anderson 1996; Anderson, Fornell, and Mazvancheryl 2004; Seiders et al. 2005). Thus, even if customers of a focal firm are highly satisfied, its resource advantage is more imitable and less valuable because rivals can also satisfy those customers by copying the focal firm’s actions leading to customer satisfaction. As such, changes in customer satisfaction should be less informative for short sellers’ decisions and less likely to affect abnormal returns.
In contrast, when competitive intensity is low, customer satisfaction is more valuable and less imitable as firms focus more on differentiating their offerings. Furthermore, even highly satisfied customers are challenging to retain in industries with high competitive intensity. In competitive industries, it is easier for customers to switch to a competitor’s offering with lower prices or superior quality, effectively making higher customer satisfaction a less valuable and more substitutable resource. Thus, customer satisfaction is more (less) imitable and more (less) substitutable in industries with high (low) competitive intensity. Consequently, unexpected changes in customer satisfaction should be more informative to short sellers and have a stronger effect on abnormal returns when competitive intensity is low.
These arguments are consistent with prior research showing that customer satisfaction has a weaker association with downstream metrics when competitive intensity is high (Anderson, Fornell, and Mazvancheryl 2004). In summary, customer satisfaction has lower (higher) informational value for short sellers when firms operate in markets with high (low) competitive intensity. Thus,
The Moderating role of Capital Intensity
Capital intensity is the extent to which a firm makes investments in fixed assets (Erramilli and Rao 1993). The degree of capital intensity determines the extent to which a firm allocates resources to more fixed versus flexible assets and thus affects the firm’s dynamic capabilities. Firms with high capital intensity have more routinized operations that impede them from customizing their product offerings for customers (Anderson, Fornell, and Rust 1997; Hendricks and Singhal 2001). In contrast, low capital intensive firms may have the flexibility to use more creative and different ways to satisfy customer needs (Edeling and Fischer 2016). They are more able to deploy resources for customer satisfaction. Thus, high capital intensity implies a lower dynamic capability to leverage and benefit from customer satisfaction in the future.
Malshe and Agarwal (2015) argue that a part of the value of customer satisfaction depends on the firm’s ability to exploit growth options embedded in customer satisfaction. Capital intensive firms are likely to have limited flexibility in their ability to leverage satisfied customers in a dynamic environment. If the firm is capital intensive, it might find it difficult to respond quickly and satisfy customer needs based on sudden changes in the external environment. In contrast, low capital intensity firms have the flexibility to satisfy customers in response to shifts in customer needs (Anderson, Fornell, and Rust, 1997). Consistent with this logic, short sellers are less likely to expect that unanticipated changes in customer satisfaction will affect stock returns for firms with high capital intensity and vice versa. This is because customer satisfaction information is less informative for short sellers for firms with high capital intensity than in the case of firms with low capital intensity. Thus,
Mediating Role of Short Interest in Customer Satisfaction–Abnormal Returns Link
A high level of observed short interest in a company’s stock may inform ordinary stock market participants that short sellers expect the stock to underperform the market in the future (Figlewski and Webb 1993). This may lead to more intense scrutiny of the company by regulators such as the SEC and other investors. Fang, Huang, and Karpoff (2016) study an SEC-ordered pilot program between 2005 and 2007, where 1,000 stocks were randomly assigned to have lower constraints on short selling, leading to higher short selling in these stocks compared with the control period. They report that increased short selling curbed earnings management and helped detect fraud among firms in the pilot program. Massa, Zhang, and Zhang (2015) document a negative relationship between short selling and earnings management across 33 countries, suggesting that short sellers can play an “information intermediary” role (Pownall and Simko 2005). Specifically, stock returns were more negative in the presence of increased short selling when the stocks had lower analyst following. The mediating role of short selling is also supported by studies showing that firms with higher short interest experience more negative future stock returns (e.g., Dechow et al. 2001). Consistent with this logic, we argue that short sellers may act as information intermediaries in promulgating customer satisfaction information to ordinary investors and, thus, in the company’s stock price. Thus,
Empirical Model and Estimation Strategy
Empirical Model
According to the arbitrage pricing theory in finance, a firm’s stock returns above the returns of a risk-free asset (risk-free rate) are a function of multiple systematic risks (Roll and Ross 1980). A commonly used model in empirical asset pricing in finance, as well as in marketing, is Carhart’s (1997) four-factor model, which controls for the following four risks: market-wide risk, size risk, value risk, and momentum risk. For a firm i in month m, expected stock returns above the risk-free rate are given by the following equation:


where
To estimate a firm’s expected monthly stock returns, the risk measures (all four βs) in Equation 1a should be available. These are typically estimated using the prior 36 months’ stock returns. The difference between the firm’s observed monthly return Rim and the firm’s monthly stock return
Abnormal returns equation
The time unit is a quarter because most of the control variables are available only at a quarterly frequency. Therefore, we calculate abnormal returns (AR) for firm i in quarter t by using the compounding formula: ARit = [π(1 + ARi, j)] − 1, where ARi, j is the abnormal return of firm i in month j of quarter t and j ∈ [1, 2, 3]. Following the marketing–finance literature, we model abnormal returns as a function of a firm’s short interest (SI), customer satisfaction (CS), customer dissatisfaction (CD), and several control variables. To ensure that the interaction effects hypothesized in H2 and H3 are indeed on the CS(CD) → SI path and not on SI → abnormal returns path, we also include the moderators.

where, for each firm i and quarter t, SIit is short interest, CSit is customer satisfaction, CDit is customer dissatisfaction, COMPit is competitive intensity in the firm’s industry, and CIit is the firm’s capital intensity. ARit is the quarterly abnormal returns for firm i in quarter t, respectively. CTRL1it represents all the control variables (see the Web Appendix). CF1it, CF2it, and CF3it are control function corrections to account for endogeneity due to omitted variables, which we describe in the following section. YDUMMY is a set of ten year-dummy variables that capture time variation in AR. Finally, Selectionit is explained in the following section and is an indicator variable that controls for selection such that

Short interest equation
Short interest is a function of customer satisfaction, customer dissatisfaction, their interactions with competitive intensity and capital intensity, and control variables.
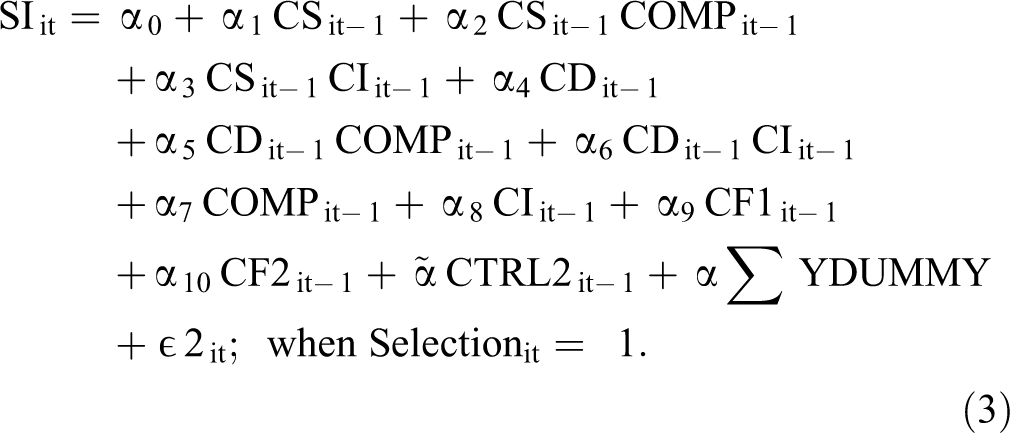
Equation 3 also includes all the controls included in Equation 2. We include the stock turnover ratio in Equation 3, which captures the level of trading activity in a given stock over a quarter. H1a–b test the main effects of customer satisfaction and dissatisfaction such that we expect negative and significant
H4a–b propose that short interest mediates the association of customer satisfaction and abnormal shareholder return and customer dissatisfaction and abnormal shareholder return. Because we hypothesize that the effects of customer satisfaction and dissatisfaction on short interest are moderated by the competitive intensity and capital intensity, we test for moderated mediation. As such, H4a implies
Addressing Selection Bias
Customer satisfaction and dissatisfaction data are from YouGov. Most likely, the firms covered by YouGov are systematically different from the firms that are not covered by YouGov. To address this selection bias, we include Equation 4 to account for the differences between the two sets of firms. We create a dummy variable “Selection” that equals 1 for the firms with YouGov coverage and 0 for the firms without YouGov coverage. Next, we model “Selection” as a function of the control variables in Equations 2 and 3. We include the natural logarithm of revenue as the excluded variable from Equations 2 and 3 for several reasons. First, private communication with YouGov executives revealed that they include firms with higher sales to gain more visibility. Second, revenue, measured in levels, is unlikely to be theoretically and empirically correlated to the unexpected changes in short interest because we already control for firm size effects when computing the unexpected changes in these variables. This is confirmed by the very low and statistically nonsignificant correlation between the natural logarithm of sales and unexpected changes in short interest (−.0007, p > .1). Accordingly, we specify the following selection equation:

where, for each firm i and quarter t, Salesit is the quarterly revenues.
Unexpected Changes in Model Variables
For each firm i, we decompose each variablei into its expected and unexpected components through a first-order autoregressive (AR[1]) model:

Greene (2003) states that the errors in an AR(1) model can be interpreted as “innovations” as they contain only the information from time t such that
Addressing Potential Endogeneity
Though our model includes several control variables, there is still potential for identification concerns because of endogeneity due to omitted variables correlated with short interest and customer satisfaction/dissatisfaction. We use the control function approach to address endogeneity (Petrin and Train 2010). We introduce three new variables, each corresponding to three potentially endogenous variables (customer satisfaction, customer dissatisfaction, and short interest) in our equations, and label each of these variables as the control function correction. Conditional on the control function corrections, the potentially endogenous independent variables should be uncorrelated with the error terms. We use a two-step procedure for the control function corrected estimates (Sridhar et al. 2016).
In the first step, we regress potentially endogenous customer satisfaction, customer dissatisfaction, and short interest on a set of predetermined variables and instruments. Instruments must be theoretically linked to endogenous independent variables. This is known as the relevancy criterion. In addition, instruments should not have any impact on the dependent variable conditional on the endogenous independent variables. This is known as the exclusion restriction. Bramoullé, Djebbari, and Fortin (2009) and De Giorgi, Pellizzari, and Redaelli (2007) introduced peers-of-peers measures as relevant and valid instruments. Thus, we use “peers-of-peers” firms measures as instruments following Serpa and Krishnan (2018) and Shi, Grewal, and Sridhar (2019). Peers-of-peers firms are defined as the peers of the focal firm’s peers that are not in the focal firm’s own peer group (Shi, Grewal, and Sridhar 2019). A focal firm and its peers-of-peers firms are connected only through the common peer firms. Thus, peers-of-peers firms affect focal firms only indirectly via their effect on the common peer firms. This ensures peers-of-peers firm measures meet the exclusion criterion. Specifically, we estimate the following three auxiliary regressions:


where, for every focal firm i and quarter t, PP_CSit is the average customer satisfaction of peers-of-peers firms of the focal firm, PP_CDit is the average customer dissatisfaction of peers-of-peers firms of the focal firm, and PP_SIit is the average short interest of peers-of-peers firms of the focal firm. We use the estimated error terms,
Model Estimation
The empirical model has three equations: abnormal returns, short interest, and selection. Our estimation technique accommodates the unique characteristics of our model, as detailed in the previous sections. First, the two main equations should be modeled conditionally on the selection equation to correct for selection bias. While this can be achieved with a two-step estimation method (Heckman 1979), a simultaneous estimator has a higher efficiency (Breen 1996). Second, the dependent variable in the selection equation is dichotomous, while the other two dependent variables—short interest and abnormal returns—are continuous. We use a mixed process estimator to account for the unique distributional properties of the different dependent variables. Third, our model parameters arguably have a hierarchical structure (brands clustered within industries). Our estimation framework accommodates this by adding random intercepts and random coefficients to our general model (Verbeke and Lesaffre 1996).
We use the conditional mixed process routine (command CMP 3 ) in Stata (Roodman 2011), which is a modeling framework based on the maximum likelihood class of estimators. The CMP allows for a flexible error structure with cross-correlations among equations and the use of different dependent variables with unique distribution properties and enables conditioning on the selection equation and incorporates multilevel effects.
Data
We merge five data sets that have observations collected with different time frequencies. Customer satisfaction (dissatisfaction) measures from YouGov are available daily. The stock market data from the Center for Research in Security Prices (CRSP) are also available at a daily frequency. Short sales data are available at a fortnightly frequency from S&P Compustat. Data on firms’ financial statements (S&P Compustat) and institutional ownership (Thomson Reuters) are available quarterly. Table 2 describes these variables, their source, and previous research using these variables.
Variables and Data Sets Used.

We aggregate customer satisfaction, stock returns, and short sales data at quarterly frequencies before merging the data. Abnormal returns are also computed quarterly. For our estimation, we need a gap of one quarter between the dependent and independent variables. After merging various data sets, for every firm in quarter t, abnormal returns are from the same quarter t; short interest is from quarter t − 1; and customer satisfaction, customer dissatisfaction, and all the control variables are from quarter t − 2. The final, merged data set covers a period from Q2 2007 to Q4 2017, yielding 7,383 firm-quarter observations representing 273 firms.
Measures
Short interest
We use the number of shares shorted in a quarter scaled by the number of shares outstanding in that quarter as a measure of a firm’s short interest. For example, in the fourth quarter of 2017, Best Buy had 296 million shares outstanding, out of which 27.635 million shares were shorted, leading to an short interest of 9.34% (27.635 million/296 million). The average short interest for our sample is 5.2%, similar to the 4.9% average in Rapach, Ringgenberg, and Zhou (2016).
Customer satisfaction and dissatisfaction
YouGov separately measures (1) the number of satisfied customers and (2) the number of dissatisfied customers for a brand each day (Colicev et al. 2018). Customer (dis)satisfaction measures the number of customers who have answered yes to the question “Of which of the following brands would you say that you are a ‘(DIS)SATISFIED CUSTOMER’?” Because customers are allowed to be indifferent, customer satisfaction and dissatisfaction measures are not merely the mathematical inverse of each other.
Comparing YouGov and the ACSI scores
The ACSI is used in most of the studies examining abnormal returns. Therefore, we use both the YouGov and ACSI to establish convergent validity in these two satisfaction measures. We randomly chose 45 brands from our data set. We asked 200 individuals (from Amazon’s Mechanical Turk) to rate these brands on the ACSI’s measurement scale, YouGov’s measurement scale, and a single-item satisfaction measure used by Mittal and Kamakura (2001). These measures are shown in Table 3. As Tables 4 and 5 show, all three measures are highly correlated and load on the same principal component. This suggests that they tap into the same underlying construct. We also ran several confirmatory factor analyses (see the Web Appendix) and find that the model that considers all these different indicators as a single factor outperforms the rival models that consider them separately. In conclusion, the YouGov measure and taps into the same underlying construct of customer satisfaction as the ACSI, establishing convergent validity among these measures.
YouGov Customer Satisfaction and Dissatisfaction Measure Validation.

Correlations Among the Four Scales.

Notes: CS = customer satisfaction; CD = customer dissatisfaction.
PCA of the Four Scales.

Notes: CS = customer satisfaction; CD = customer dissatisfaction.
Abnormal returns
We use Carhart’s (1997) four-factor model to calculate abnormal returns for firm i in quarter t by using the compounding formula: ARit = [π(1 + ARi, j)] − 1, where ARi, j is the abnormal return of firm i in month j of quarter t and j ∈ [1, 2, 3].
Competitive intensity (COMP)
Following Malshe and Agarwal (2015), we use the Herfindahl–Hirschman index (HHI) to calculate industry concentration. We calculate HHI in each quarter by summing the squares of the market share of each firm in one-digit Standard Industrial Classification codes. Our measure of competitive intensity (COMP) is computed by taking the reciprocal of the HHI. The average competitive intensity is 15.38 and higher scores indicate higher competitive intensity.
Capital intensity
Capital intensity is the sum of property, plant, and equipment divided by total assets. The average capital intensity for the sample is 28.5% and higher scores indicate higher capital intensity. We use several alternative measures of this construct to establish robustness.
Control Variables
Short interest may be influenced by three factors identified in the finance literature (Desai, Krishnamurthy, and Venkataraman 2006). First, short interest depends on the firm’s performance, such that poorly performing firms have a higher short interest. Second, short interest depends on the ease and costs of shorting stocks. For example, it is easier to borrow shares for more liquid stocks. Finally, short interest depends on the characteristics of the industry in which the firm operates. For example, firms in poorly performing industries will have higher short interest. In line with this, we include several control variables in our analysis, which are detailed in the Web Appendix. Table 6 shows the descriptive statistics and correlations for the focal variables in the model.
Descriptive Statistics and Correlations.

*p < .1.
**p < .05.
***p < .01.
a In USD billion.
Results
Table 7 reports the comparison of the nested models. In the baseline model (Model 1), we only include customer satisfaction and dissatisfaction and their control functions. Model 2 adds the interaction terms to Model 1. Finally, Model 3 adds the control variables (full model). All results hold across Models 1–3, and importantly, the log-likelihood improves as we move from Model 1 to Model 3.
Model Comparison.

*p < .10.
**p < .05.
***p < .01.
Notes: All models are estimated with a selection equation. Standard errors are in parentheses. The model is estimated using multiple equation CMP in Stata. The standard errors are heteroskedasticity corrected.
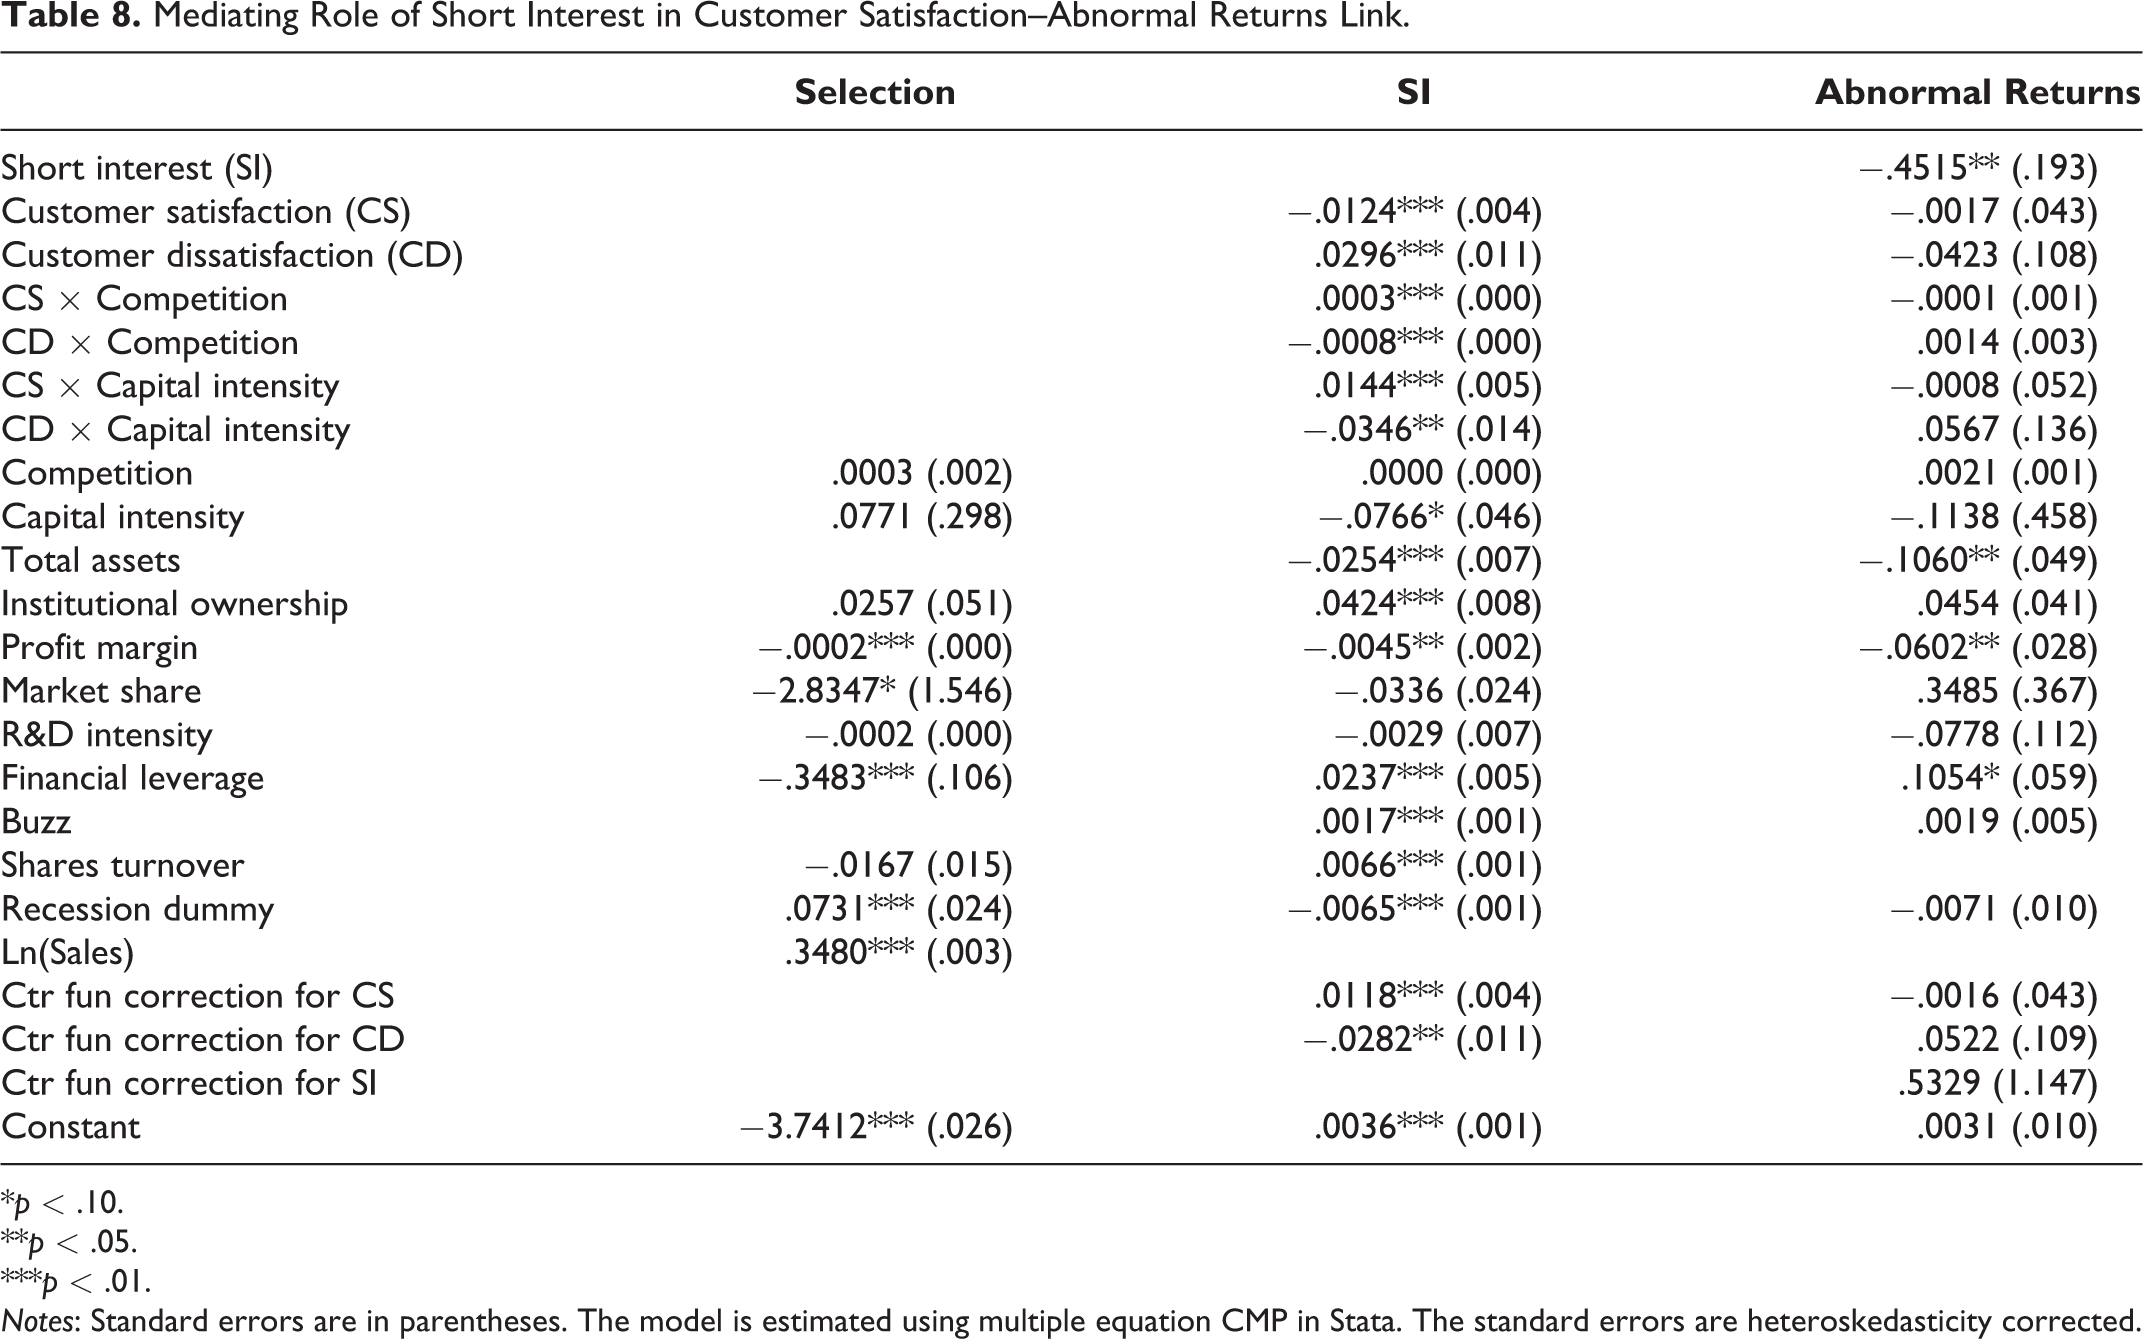
Next, we turn to the results from our main model, as shown in Table 8.
Mediating Role of Short Interest in Customer Satisfaction–Abnormal Returns Link.
*p < .10.
**p < .05.
***p < .01.
Notes: Standard errors are in parentheses. The model is estimated using multiple equation CMP in Stata. The standard errors are heteroskedasticity corrected.
Selection equation
The natural log of sales in Equation 4 is statistically significant (.348, p < .01), indicating that firms with higher sales have a higher probability of YouGov coverage.
We also find that the correlation between quarterly sales and market share is .252, which is reassuringly low. We also find that the variance inflation factors of quarterly sales and market share is less than 2, which further confirms that multicollinearity is not an issue in this analysis.
Test of hypotheses
In support of H1a and H1b, unexpected changes in customer satisfaction are negatively associated with unexpected changes in short interest (−.0124, p < .01), and unexpected changes in customer dissatisfaction are positively associated with unexpected changes in short interest (.0296, p < .01). Furthermore, the association between customer dissatisfaction and short interest is stronger than the association between customer satisfaction and short interest (CS + CD = .0173, p = .028). Thus, H1c is fully supported.
H2a proposes that the association of unexpected changes in customer satisfaction and short interest is more (less) negative for firms operating in industries with lower (higher) competitive intensity (COMP). H2b posits that the association of unexpected changes in customer satisfaction and short interest is more (less) positive for firms operating in industries with lower (higher) competitive intensity. The interaction of customer satisfaction and competition is significant and positive (.0003, p < .01) and the interaction of customer dissatisfaction and competition is significant and negative (−.0008, p < .01). Both H2a and H2b are supported. The customer dissatisfaction × competitive intensity interaction is larger than the customer satisfaction × competitive intensity interaction (CS × COMP + CD × COMP = −.0005, p = .024). Thus, H2c is supported.
H3a proposes that the association of unexpected changes in customer satisfaction and short interest is more (less) negative for firms with lower (higher) capital intensity; H3b posits that the association of unexpected changes in customer dissatisfaction and short interest is more (less) positive for firms with lower (higher) capital intensity. The interaction of customer satisfaction and capital intensity is statistically significant and positive (.0144, p < .01). The interaction of customer dissatisfaction and capital intensity is statistically significant and negative (−.0346, p < .05). Thus, H3a and H3b are supported. A statistical comparison shows the magnitude of the interaction between customer dissatisfaction and capital intensity is larger than that of customer satisfaction and capital intensity (CS × CI + CD × CI = −.0202, p = .045). These results support H3. We also show the Johnson–Neyman plots in Figure 2. They are consistent with the hypothesized relationships. Capital intensity and competition as moderators of the (dis)satisfaction and short interest link (Johnson–Neyman analysis).
Mediating Role of Short Interest in Customer Satisfaction–Abnormal Stock Returns Link
H4a and H4b hypothesize that short interest mediates the link between customer satisfaction/dissatisfaction and abnormal stock returns. Table 8 reports the results for abnormal returns (Equation 2), where short interest has a significant negative impact on abnormal returns (−.4515, p < .05). To formally test mediation, we test the statistical significance of the products of the coefficients of customer satisfaction and dissatisfaction in Equation 3, with the coefficient of short interest in Equation 2. Following Preacher and Hayes (2004), we draw 1,000 bootstrap samples with replacement to obtain the 95% confidence intervals for the indirect effect. The 95% confidence interval [CI] for customer satisfaction (.0056, 95% bootstrap CI = [.0012, .0143]) and customer dissatisfaction (−.0134, 95% bootstrap CI = [−.0349, −.0024]) are as expected and do not include zero. The statistically nonsignificant coefficients of customer satisfaction and customer dissatisfaction suggest that short interest fully mediates their impacts on abnormal returns. All of the interactions of customer satisfaction and dissatisfaction with competitive intensity and capital intensity and are statistically nonsignificant in Equation 2.
These results support moderated mediation (Muller, Judd, and Yzerbyt 2005) such that the strength of mediation between customer satisfaction/dissatisfaction and abnormal returns through short interest varies based on industry competitive intensity and firm’s capital intensity. Figure 3 visually summarizes the results of the mediation analysis, and they fully support H4a and H4b. 4

The mediating role of short interest in the customer (dis)satisfaction–abnormal returns link.
Using Aiken, West, and Reno (1991), we compare the indirect effects of customer satisfaction and dissatisfaction on abnormal returns at high and low levels of the competitive intensity and capital intensity moderators. We use (mean + 2 SDs) of competitive intensity and capital intensity as high levels and (mean − 2 SDs) of competitive intensity and capital intensity as low levels. Because the average value of unexpected changes in every variable is zero due to the least-squares estimation, the mean values of competitive intensity and capital intensity are also 0. This reduces to performing the spotlight analysis at ±2 SDs of competitive intensity and capital intensity.
First, the indirect effect of customer satisfaction on abnormal returns at a high level of competitive intensity is .0022 (CI = [.0005, .0056]) and at a low level of competitive intensity is .009 (CI = [.002, .023]). In addition, the indirect effect of customer dissatisfaction on abnormal returns at a high level of competitive intensity is −.0041 (CI = [−.0107, −.0007]) and at a low level of competitive intensity is −.0226 (CI = [−.0591, −.0044]). Second, the indirect effect of customer satisfaction on abnormal returns at a high level of capital intensity is .0026 (CI = [.0006, .0064]) and at a low level of capital intensity is .0086 (CI = [.0019, .0222]). In addition, the indirect effect of customer dissatisfaction on abnormal returns at a high level of capital intensity is −.0062 (CI = [−.016, −.0013]) and at a low level of capital intensity is −.021 (CI = [−.0537, −.0033]). Thus, the moderating effects of competitive intensity and capital intensity on the indirect impacts of customer satisfaction and customer dissatisfaction on abnormal returns are pronounced and meaningful.
Robustness Checks
Earnings and dividends
We do not include earnings and dividend announcements as control variables in the model, because finance and accounting literature shows that short sellers take their positions before, rather than after, these events and that the events themselves are not value-relevant for short sellers (Christophe, Ferri, and Angel 2004; Desai, Krishnamurthy, and Venkataraman 2006). Nonetheless, we include these variables as controls and find that the results continue to hold (see Web Appendix Table W8).
An aggregated measure of customer satisfaction
Our theorization requires that we use customer satisfaction and customer dissatisfaction separately to capture their asymmetric effects. To assess the robustness of our analysis, we also compute net customer satisfaction. Importantly, most results continue to hold after using net customer satisfaction (Web Appendix Table W9).
Peer measures as instruments
In our primary analysis, we used peer-of-peer firms measures as instruments. Alternatively, recent marketing articles have used the peer-firms instruments (rather than peer-of-peer; see Germann, Ebbes, and Grewal 2015). Peer firms of a focal firm are all the firms that operate in the same primary and secondary industries as the focal firm. As Web Appendix Table W10 shows, our results continue to hold.
Random intercepts and coefficients
Our data may have characteristics of hierarchical or multilevel data in the way that firms are nested within industries. This calls for a multilevel modeling approach. Thus, as a robustness check, we estimate two types of models that can accommodate hierarchical effects. First, we estimate a model with random intercepts for each industry that accounts for firm-industry clustering. Second, we also estimate a model with both random intercepts and random coefficients for customer satisfaction and dissatisfaction to account for the hierarchical effects of industry-level interactions. As Web Appendix Tables W11 and W12 show, the results are consistent.
Deeper lags of customer satisfaction and dissatisfaction
We add second lags of unanticipated changes in customer satisfaction and dissatisfaction in the model and report the results in Table W13. The second lag of customer dissatisfaction has a statistically and economically marginal effect on short interest, but customer satisfaction has no statistically significant effect. We conclude that short sellers rely on recent unanticipated changes in customer satisfaction and dissatisfaction to take their short positions.
Inclusion of advertising expenses
We used Kantar Media’s advertising data set to control for advertising. Although Kantar Media does not naturally cover all our sample firms and has missing observations, we drew on Malshe and Agarwal (2015; Web Appendix) to impute the missing advertising values. These results are robust and reported in Web Appendix Table W14.
Inclusion of ACSI dummy
We include a dummy variable indicating whether ACSI tracks the focal firm. Reassuringly, this ACSI dummy variable is not significant and the main results are unchanged (see Web Appendix Table W15). Short sellers do not distinguish among ACSI and non-ACSI firms.
Alternative estimation method
We also estimate the model with the generalized method of moments, which enables us to use heteroskedasticity and the autocorrelation-corrected variance–covariance matrix. To accommodate the selection equation within generalized method of moments, we use a two-step Heckman procedure. We insert the inverse Mills ratio computed from the selection equation in the system of equations in step two. Our results continue to hold (see Web Appendix Table W16).
Alternative measures of capital intensity
To establish the robustness of our results using alternative measures of capital intensity, we use two indirect measures. First, we use data from a news analytics firm, RavenPack (Warren and Sorescu 2017), which performs text analysis on news stories and press releases and labels them as stories that are relevant for investors. For each firm, we count the number of news stories that are related to announcements of capital expenditure. Our logic is that firms with higher capital intensity will have more stories about capital expenditure. We find that our results continue to hold (see Table W17). Second, we calculate the ratio of the cost of goods sold to the total costs, which is the sum of the cost of goods sold and selling and general administrative expenses. The logic behind using this metric is that the firms with more capital intensity will likely have higher costs of goods sold compared to the service-related costs such as salaries, sales commissions, etc. The results continue to hold (see Table W18).
Separate analysis for ACSI and non-ACSI firms
We argue that firms not covered by ACSI but covered by YouGov should provide an information advantage to the short sellers. Thus, results should replicate for the non-ACSI firms in our data set. Web Appendix Tables W19 and W20 show that customer satisfaction and dissatisfaction have a statistically significant effect for firms in the YouGov database but not in the ACSI. Importantly, the effect is nonsignificant for firms covered in the ACSI.
Firm-clustered standard errors
We also check robustness to clustering the standard errors by firm. We report the results in Web Appendix Table W21 and confirm that the results remain unchanged.
Discussion
This article’s primary contribution is to disentangle the apparent lack of value relevance of customer satisfaction for abnormal returns. Customer satisfaction is theoretically and empirically linked to crucial customer behaviors and financial outcomes such as Tobin’s q, cash flows, revenue, market share, and profitability (Mittal and Frennea 2010). Yet, as we report in the Web Appendix, the direct association of customer satisfaction with abnormal returns has received mixed support, with studies finding positive, zero, and negative association. We show that including the investor route—short selling based on customer satisfaction—may provide guidance in this regard. We theoretically argue and empirically show that short selling is a critical investor behavior that mediates the link between customer satisfaction and abnormal stock returns. Overall, our study provides the following implications.
First, we show that investor behaviors represent a potent mechanism (Cillo, Griffith, and Rubera 2018; Luo et al. 2014) for explaining the association of customer satisfaction and abnormal stock returns through short selling. Whereas customer satisfaction’s effect on outcomes such as Tobin’s q, market share, and sales may primarily manifest through customer behaviors, investor behaviors may be more relevant for outcomes such as abnormal returns. Short sellers may effectively utilize customer satisfaction and dissatisfaction in their investing decisions (Diamond and Verrecchia 1987). Previous research in this area has narrowly examined the information advantage residing in a firm’s financial fundamentals and accounting statements (Boehmer et al. 2020). Our result establishes that customer satisfaction can provide a similar advantage to short sellers. By implication, more detailed reporting of customer satisfaction and dissatisfaction information in annual reports and 10-K forms should be institutionalized to help ordinary investors. Future research should examine additional customer metrics that can provide an information advantage to short sellers and thus more deeply explicate the marketing–finance interface.
Second, our study is the first to replicate behavioral research on customer satisfaction and dissatisfaction (Anderson and Sullivan 1993; Mittal, Ross, and Baldasare 1998) in a stock market context. Linking behavioral phenomenon to stock market returns not only provides generalizable theoretical evidence for satisfaction-dissatisfaction asymmetry but also paves the way for executives to use the asymmetry in their strategy process better. Our work amplifies the work by Anderson and Sullivan (1993) and Mittal, Ross, and Baldasare (1998), showing that satisfaction is not the mere obverse of dissatisfaction. Specifically, a one-unit increase in customer satisfaction is associated with a .56 percentage point increase in abnormal returns, while a one-unit increase in customer dissatisfaction is associated with a 1.34 percentage point decrease in abnormal returns. The value reduction due to customer dissatisfaction is 2.39 times larger than the value enhancement due to an increase in customer satisfaction. This result reinforces the advice from behavioral studies almost two decades ago. Anderson and Sullivan (1993, p. 125) note that “quality which falls short of expectations has a greater impact on satisfaction and repurchase intentions than quality which exceeds expectations.” Echoing their work, Mittal, Ross, and Baldasare (1998, p. 45) ask managers to “optimize and not maximize” satisfaction. To our knowledge, this is the first study linking their results on asymmetry to stock market outcomes.
Practitioners have called on marketers to stop delighting customers and instead focus on learning from disgruntled customers and problem solving (Dixon, Freeman, and Toman 2010). Our work with firms shows that they have very different mechanisms to minimize dissatisfaction (e.g., complaint management, service recovery) and to maximize satisfaction (e.g., relationship management, customer rewards). In our data set, 5.8% of the publicly listed companies base executive compensation on improving customer satisfaction (see the Web Appendix). However, we could not find any company that bases executive compensation on reducing customer dissatisfaction. More generally, this insight—examining the asymmetric association of a construct with financial metrics—should be applied to other domains. Research, for example, could examine the relative effect of a unit increase versus a unit decrease in advertising or R&D on financial performance.
Finally, this work shows that customer satisfaction is not an unconditionally beneficial resource. Instead, its association with abnormal returns is stronger in industries with lower competitive intensity and companies that have lower capital intensity. This presents a nuanced picture suggesting that future scholarship needs to jointly examine the (1) asymmetry of customer satisfaction and dissatisfaction, (2) intervening mechanisms based on the behaviors of investors and other stakeholders, and (3) industry-/firm-relevant moderators. Such a nuanced and complex view can provide a better assessment of the financial implications of marketing resources.
Implications for Business Executives and Regulators
In addition to business executives, shareholders, regulators, and financial reporting agencies may want to monitor short interest as a harbinger of the impact that marketing activities have on stock returns. By fully incorporating the mediating variable—short interest—in their decision making, these stakeholders can more correctly estimate the value relevance of customer satisfaction in at least five ways.
First, executives who ignore short selling may underestimate the magnitude of the impact of customer satisfaction on abnormal stock returns and thus underinvest in customer satisfaction initiatives. This can lead to customer defections, negative word of mouth, and deterioration in long-term firm value. Second, executives may underestimate the speed with which investors incorporate customer satisfaction into their investing strategies and stock prices. This may lead managers to deemphasize customer satisfaction in the short run, thereby harming the short- and long-term strategy of the company.
Third, if executives only focus on increasing customer satisfaction rather than also mitigating customer dissatisfaction, they may harm customer and shareholder value because mitigating customer dissatisfaction is less costly than maximizing customer satisfaction (Anderson and Mittal 2000). Our work with dozens of companies has shown that reducing dissatisfaction, rather than increasing satisfaction, is not only cheaper but also more effective in retaining customers. Fourth, by fully incorporating the characteristics of their company and industry, executives can avoid the one-size-fits-all trap. As an example, executives in industries with low competitive intensity, such as prepackaged software and system design (Standard Industrial Classification codes 7372/7373), will find their stock returns to be more sensitive to changes in customer satisfaction than executives in industries such as financial services (an industry with higher competitive intensity). For regulators, our results support the call for mandating disclosure of intangible assets in financial statements (Bayer, Tuli, and Skiera 2017). Systematically and regularly publicizing information on customer satisfaction, preferably through accounting statements, can level the investing field for ordinary investors. Asking companies to present customer satisfaction information in their earnings calls, other public relations, and investor relations material can play a huge role in this regard.
Fifth, we find that the different customer satisfaction measures such as the ACSI and YouGov tap into the same underlying construct. Nevertheless, due to differences in their frequency of collection and reporting (daily vs. quarterly vs. annual), access to ordinary investors (paid subscription vs. free release), they may have different roles to play in investor decisions. Understanding and examining how these measures are similar and different from each other can help executives and regulators to better understand their value relevance and incorporate them in decision making.
Limitations
First, additional moderators that affect the value relevance of customer satisfaction and dissatisfaction should be examined. Thus, future research should explore other possible moderators that may emanate from resource-based theory. Second, future studies should aim to incorporate antecedents of customer satisfaction and dissatisfaction to evaluate the full chain of effects, from marketing actions to customer satisfaction and dissatisfaction to short interest and financial metrics (see, e.g., Colicev et al. 2018). Specifically, when and why do firms focus more on satisfaction or dissatisfaction? Third, our empirical analysis is conducted using quarterly data due to the nature of the data available to us. In today’s world of high-speed trading, short sellers may use marketing metrics on a weekly or even daily level. Research using higher frequency data may provide a different view of the association of customer satisfaction and short selling. High-frequency data can also enable researchers to examine the time-varying effects of customer satisfaction on short interest. Theoretically, short interest may be more sensitive to a decrease in customer satisfaction during adverse events such as product recalls or service lapses. Fourth, research is needed to examine additional proxies of customer satisfaction that may be value relevant. By comparing and contrasting different measures of the same underlying construct, we can more carefully address the value-relevance debate.
Supplemental Material
Supplemental Material, JMR.18.0105.R3_Updated_Web_Appendix_PDF - How Main Street Drives Wall Street: Customer (Dis)satisfaction, Short Sellers, and Abnormal Returns
Supplemental Material, JMR.18.0105.R3_Updated_Web_Appendix_PDF for How Main Street Drives Wall Street: Customer (Dis)satisfaction, Short Sellers, and Abnormal Returns by Ashwin Malshe, Anatoli Colicev and Vikas Mittal in Journal of Marketing Research
Footnotes
Acknowledgments
The authors thank Natalie Mizik and Shrihari Sridhar for their insightful comments. The authors thank YouGov for providing BrandIndex data.
Associate Editor
Detelina Marinova
Declaration of Conflicting Interests
The author(s) declared no potential conflicts of interest with respect to the research, authorship, and/or publication of this article.
Funding
The author(s) disclosed receipt of the following financial support for the research, authorship, and/or publication of this article: Anatoli Colicev acknowledges funding from Bocconi University as part of a Junior Research Grant for purchasing YouGov BrandIndex data.
Notes
References
Supplementary Material
Please find the following supplemental material available below.
For Open Access articles published under a Creative Commons License, all supplemental material carries the same license as the article it is associated with.
For non-Open Access articles published, all supplemental material carries a non-exclusive license, and permission requests for re-use of supplemental material or any part of supplemental material shall be sent directly to the copyright owner as specified in the copyright notice associated with the article.