
Abstract
The global food system has a large impact on the environment. By converting household grocery purchases into environmental cost factors like greenhouse gas (GHG) emissions and land use, this study examines the sustainability of food purchases over a ten-year period using household panel data in two prosustainability markets (Germany and the Netherlands). The environmental intensity of households’ grocery baskets has not declined over time in these countries. Even though younger and more educated households are starting to shift their diets, the share of plant-based alternatives in food diets remains very low. The authors propose that one contributing factor is a lack of environmental knowledge, which they address by developing an app that gives personalized feedback on the emissions associated with consumers’ food purchases. The app also allows users to create sustainable grocery bundles aligned with their dietary preferences. Two experiments demonstrate that interacting with the app (1) raises subjective and objective environmental knowledge related to food, with much of this improvement persisting for over six months, and (2) reduces GHG emissions associated with stated food choices by up to 33%. These reductions are driven by different information formats within the app, including peer comparisons and detailed information about food-category emissions.
Food production imposes significant environmental costs. It accounts for 26% of greenhouse gas (GHG) emissions, is responsible for 78% of water pollution from overfertilization, uses 50% of global habitable land, and represents 70% of freshwater withdrawals (Ritchie 2019; Ritchie and Roser 2020). Even if nonfood system emissions were immediately stopped, the GHG emissions from food alone would nearly exhaust the carbon budget required to limit global warming to 2° Celsius under the Paris Agreement (Clark et al. 2020).
There is debate about how to most effectively reduce the environmental costs of food production and consumption (Funke et al. 2022; Rockefeller Foundation 2021; Schmutzler and Goulder 1997). However, most scientists agree that this goal requires a dietary transition from animal-based food products to plant-based alternatives (see, e.g., Springmann et al. 2018). The marketing discipline, with its focus on consumer behavior, is in a good position to help understand this transition and reduce potential barriers to it.
This article has two related objectives, each addressing necessary conditions for feasible diet change: (1) measuring and understanding how households’ food purchases translate into environmental costs, and (2) exploring how to make these environmental costs transparent to consumers in a way that changes food choices.
Regarding the first objective, we quantify the environmental costs of households’ grocery baskets and show how these costs are distributed across households. Using a life-cycle assessment of environmental costs per food category—sourced from meta-analyses in food science (Gephart et al. 2021; Poore and Nemecek 2018)—we account for production, transportation, and packaging of the different ingredients of a product. We apply these category-specific cost estimates to observed household grocery purchases to translate grocery baskets into measures of environmental impact, including GHG emissions, eutrophication potential (i.e., the costs of overfertilization in both land and water environments), land use, and freshwater withdrawals. This enables us to track the sustainability 1 of food purchasing behavior at the household level. By monitoring households over time, we can analyze trends in purchasing patterns. In addition, summarizing the environmental costs of grocery purchases across consumers allows us to examine the concentration of these costs. Grouping consumers and comparing sustainability across demographic segments further helps identify target groups, such as those most inclined toward sustainable food alternatives or those contributing the most to the environmental costs of food purchasing.
Focusing on national household panels in Germany and the Netherlands, two markets chosen for their high ranking on the Food Sustainability Index (Economist 2021), and using 2012–2021 data, we find that the GHG intensity and other environmental costs of households’ annual food baskets in Germany and the Netherlands did not decrease between 2012 and 2021. We also find that the environmental cost of grocery purchasing is heavily concentrated across households, with food purchases of the top 20% of households by GHG emission being responsible for 41% (Netherlands) and 47% (Germany) of the total 2021 grocery related GHG emissions in our dataset. Despite the growing availability and declining prices of plant-based products relative to animal-based products, volume shares of plant-based meat and dairy alternatives remain very low (<3%). Older consumers show more resistance to buying plant-based alternatives even though trial rates are high. Younger (Gen Xers and Millennials) and more educated consumers buy comparatively more plant-based alternatives, but even in these segments plant-based meat replacements account for only 3.3% (Germany) and 5.6% (Netherlands) of category purchases in 2021. To visualize these patterns, we report the environmental impact of total food baskets and the purchasing of plant-based alternatives in two high-impact categories (meat and dairy) in a Food Impact Tracker app.
The reported trends in consumer food purchases go against consumers’ stated willingness to consume more sustainably (Leiserowitz et al. 2020; Vermeir and Verbeke 2006). One key barrier to effective diet change is consumers’ lack of knowledge about the absolute and relative environmental consequences of different foods (sometimes referred to as “carbon innumeracy”), making it difficult to turn green values into green behavior (Camilleri et al. 2019; De Boer and Aiking 2022; De Boer, De Witt, and Aiking 2016; Hartmann et al. 2021; World Health Organization 2021a; Winterich, Reczek, and Makov 2023; Wynes, Zhao, and Donner 2020). For instance, consumers underestimate the environmental impact of their own dietary habits by a very large margin, especially for animal-based foods (Camilleri et al. 2019). Thus, educating consumers about these impacts is an important enabling factor to reduce their environmental footprint. For example, the GHG emissions of beef and lamb are approximately 4.2 times as much as other meat and 79.5 times as much as meat replacements (Clark et al. 2022). 2
Regarding our second objective—making environmental costs transparent and measuring their impact on purchase behavior—we investigate ways to communicate the environmental impact of food choices to consumers. For this objective, we use the panel's household distribution of environmental costs (from the first objective of our study) to construct a Compare Your Impact tool within our app. This tool allows consumers to input their weekly servings, after which they receive personalized feedback on the ecological footprint of their shopping habits, benchmarked against their demographic peers. In addition, users can explore alternative food basket compositions aligned with their preferences, receiving dynamic feedback on how these changes would influence their environmental impact.
To evaluate how endowing consumers with environmental knowledge through our app changes carbon innumeracy and behavioral intentions to make sustainable food choices, we conducted two experiments. The first experiment demonstrates that interacting with the app improves both objective and subjective personal knowledge about the environmental costs of different foods, with much of this improvement persisting for at least six months. The second experiment demonstrates that interacting with the app influences purchase intentions, almost doubling choice shares of plant-based alternatives and reducing GHG emissions associated with stated food choices by up to 33%. This study also investigates how different types of environmental feedback on food choices—peer comparison (relative information), category breakdown of emissions (objective information), or driving equivalent (information in familiar units)—independently and interactively contribute to these reductions in GHG emissions.
Our approach highlights both problems and potential solutions related to the environmental impact of food decisions. Despite changes in sustainable attitudes, our descriptive results show that consumers are not shifting to more environmentally friendly food choices. We suggest that closing knowledge gaps is essential to facilitate this shift. We therefore develop a user-friendly app that we believe can inform a variety of stakeholders. We focus our empirical investigation on testing how the app tool affects consumers, in terms of subjective knowledge, objective knowledge, and purchase intentions. In addition, food producers and retailers can also use the descriptive insights in our app to better understand the marketplace for sustainable food categories. Policy makers can use it to understand current societal trends and shape, target, and evaluate potential interventions. This is in line with the European Union’s Farm to Fork Strategy 3 and the United Nations’ 2030 Agenda for Sustainable Development (United Nations 2015), which commits member states to “changing unsustainable consumption and production patterns” (p. 8) in part through technological advancements that can encourage more sustainable consumption and production.
Our work contributes to the literature on sustainable consumption and on the effects of consumer-facing “carbon calculators” (e.g., Mulrow et al. 2019). Unlike existing tools, our app offers users the ability to explore food impacts through several intuitive representations and dynamically evaluate the effects of potential substitutions. This addresses calls for better carbon calculators related to food impacts (Mulrow et al. 2019) with greater transparency, personalization, and interactivity, as well as calls for further research on their effectiveness in changing people's food choices (e.g., Dreijerink and Paradies 2020; Padgett et al. 2008).
Our article is organized as follows. We start with a review of the relevant literature on sustainable consumption trends. The next section outlines details of our dataset. Subsequently, we discuss the descriptive insights on sustainable food choices. Then, to motivate why we study the effect of consumer knowledge, we briefly discuss the literature on carbon innumeracy and its effects on consumption. Following that, we present findings from two experiments on the impact of personalized feedback related to emissions on environmental knowledge and food choices. The final section presents conclusions and future research.
Background Literature on Sustainable Food Developments
There is little doubt among scientists that human activity is warming the planet, with food production and consumption playing a major role (Poore and Nemecek 2018). Meat is among the most environmentally costly foods, and replacing meat (especially beef) with plant-based alternatives offers a promising approach to make grocery purchases more eco-friendly (Sun et al. 2022; Tuninetti, Ridolfi, and Laio 2022). Yet, despite increased interest from policy makers, businesses, and consumers, traditional animal meat continues to dominate consumer choices (Schäufele and Janssen 2021), limiting the environmental benefits. Carbon footprints also vary considerably across households. This section highlights research on the (slow) transition to sustainable food choices and heterogeneity in household food emissions.
Trends in Meat Consumption and Transition to Sustainable Food Choices
The literature reports two important, but seemingly conflicting, developments in meat consumption and sustainable food choices. First, consumers are increasingly willing to adopt plant-based meat alternatives (Leiserowitz et al. 2021; Vermeir and Verbeke 2006; Zhao et al. 2023). Second, beef demand and supply has remained relatively stable, both in richer countries (Lusk et al. 2022; Tonsor and Lusk 2022) and poorer ones (Desiere et al. 2018). The stability in beef consumption underscores the persistence of an attitude–behavior gap in sustainable consumption. While novel plant-based meat alternatives are often priced at a premium, even significant price reductions are unlikely to yield meaningful reductions in emissions (Lusk et al. 2022). Consistent with this, Peacock (2024) challenges the so-called “price, taste, and convenience” (PTC) hypothesis, which holds that most consumers would switch to plant-based meat if it matched animal-based meat on price, taste, and convenience. Instead, Peacock argues that social and psychological factors heavily influence food choices, meaning that even PTC-equivalent plant-based options may not significantly shift consumer behavior.
This article contributes to this literature by first translating purchasing trends into environmental cost trends across demographic groups, time frames, and markets. Our proposed “bottom-up” methodology of tracking sustainable consumption trends in household level shopping baskets has several attractive features. It examines the environmental costs of all grocery purchases, not just meat, and it can be applied uniformly across countries. Measuring the environmental costs of grocery purchasing at the individual level also allows us to separate household-level dietary changes from changes in sample composition. Thus, importantly, our method speaks to whether shifts in environmental intensity of shopping baskets are due to genuine behavioral change or changes in demographic composition.
Our work is related to Yan, Zhu, and Song (2024), who similarly develop a method to compute the environmental impact of household grocery baskets. However, the two studies differ in at least two respects. First, Yan, Zhu, and Song focus on how shopping at club stores affects households’ environmental impact, whereas we focus on the evolution of the environmental impact of households’ grocery shopping across different time frames, demographic groups, and markets. Second, our work aims to understand how making these environmental costs transparent to consumers can empower them to make food choices that are less environmentally harmful.
Household Heterogeneity in Carbon Footprint
While there remains little doubt that demographic factors (e.g., income, education, household composition, age) shape pro-environmental behavior (e.g., Bollinger, Kronthal-Sacco, and Zhu 2024; Panzone et al. 2016; Yan, Zhu, and Song 2024), current research lacks a clear understanding of how these factors systematically influence food-related emissions. Understanding differences in household carbon emission and understanding the extent to which emissions are concentrated in a small subset of household are important to design effective, equitable climate food policies. Our research contributes to the growing literature on emission disparity by examining and tracking the total environmental cost of food consumption by consumer segments with different demographics. Comparing sustainable consumption metrics across households helps identify groups that are appealing for targeted communication. This in turn answers the call to integrate household differences in sustainable consumption patterns into the policy making process (Cash et al. 2003; Nielsen et al. 2024; Sedlacko, Reisch, and Scholl 2013).
Data
Purchase Data
To link food purchases to associated environmental costs, we start with individual-level grocery purchase data from large-scale household panels maintained by YouGov (formerly GfK). Members of the panel scan their grocery purchases at home after each shopping trip. For each household, barcode (European Article Number [EAN]), and shopping trip, we observe the purchase quantity, the monetary value, and the retailer where the purchase was made. The latter covers supermarkets, drug stores, and specialist food stores. For each household, we observe various demographic characteristics including disposable income, education, age, and household size. For each barcode, we observe product category, product size (volume), size units (e.g., grams), and a description of the product. We obtained these data for Germany and the Netherlands. Reports indicate that Germany represents the largest plant-based food retail market in Europe, while the Netherlands leads in per capita spending on plant-based foods (GFI Europe 2022). Both countries feature in the top five most innovative countries for sustainable foods in Europe (Boffey 2022; Eurosoy 2022).
We have access to ten years of purchase data (2012–2021) from representative samples of households in both countries. The panel in Germany contains about 40,000 households each year; the Dutch panel contains about 10,000 households each year.
Converting Households’ Grocery Baskets into Environmental Costs
To quantify the environmental costs of grocery purchases, we calculate the impact of each product at the barcode level using data from Clark et al. (2022). This dataset, based on back-of-package ingredient information, estimates the full life cycle of environmental costs for over 57,000 individual food products sold in the United Kingdom and Ireland. These costs represent all production, packaging, and transportation of the ingredients in a product. Clark et al. note that their estimates cover “the processing and transportation of commodities [e.g., sugar] to retail stores, but do not incorporate postproduction processing, packaging, and transportation of, for example, converting sugar into a sugar-sweetened beverage or flour and butter into a croissant.” Poore and Nemecek (2018) show that the emissions associated with the ingredients (e.g., from land-use change, farming, and cattle feed production) are often 90%–95% of the total emissions of final goods. 4 However, both papers acknowledge that additional costs may exist that affects the reported estimates.
Poore and Nemecek (2018) express environmental costs in four dimensions—GHG emissions (measured in kilograms of CO2 equivalent units, kgCO2eq), eutrophication potential (
For each barcode purchased by the panel members, we multiply the recorded volume by their matched environmental cost per volume from Clark et al. (2022). We then aggregate these environmental costs across all of a household's purchases in a given year. We refer to this measure as the total environmental cost of a household's annual shopping basket.
Although this metric of environmental cost uses a comprehensive and up-to-date dataset of environmental costs of the grocery food supply chain, the year-over-year evolution of the total environmental cost is subject to other consumption trends than substitution behavior across food categories in the supermarket. In particular, there has been significant substitution into delivery and take-out food, especially among the younger generations (Harker et al. 2010), which affects the total volume of grocery purchases, and thus households’ total environmental cost over time. The same is true for the avoidance and closure of restaurants during the COVID-19 pandemic. We therefore also define a metric that normalizes a household's total environmental cost to an average cost per 100 grams of its annual basket. We refer to this measure as the environmental cost intensity (e.g., the GHG intensity) of a household's shopping basket. This metric tracks changes in environmental costs over time that arise from changes in the household's volume shares across aisles (i.e., basket composition) and is insensitive to volume trends in household purchases, including those mentioned previously, but also from, for example, expanding or shrinking household size over time.
Descriptive Results
Basket-Level Insights
Using the food purchase data and the proposed environmental accounting procedure, we compute (1) trends in the GHG intensity of annual shopping baskets, and (2) the degree of dispersion in households’ annual total GHG emissions from food purchases. Descriptives for other environmental cost indicators appear in the Environmental Impact Trends tool of the Food Impact Tracker app accompanying this article. 6 Figure 1 reports the estimated average (across all households in the panel) GHG intensity of shopping baskets in Germany and the Netherlands for the years 2012–2021, with 95% confidence intervals of these estimates. On average, 100 grams of a shopping basket in Germany costs about .44 kgCO2eq in GHG emissions, and these costs are more or less constant for 2012–2021. For the Netherlands, we estimate a lower cost of .41 kgCO2eq in 2012, which increases to .42 kgCO2eq in 2016 and then remains constant. Importantly, we do not observe a reduction in the GHG intensity of shopping baskets. As the app shows, the other environmental cost indicators (land use, freshwater withdrawals, and eutrophication potential) remain more or less constant as well. We interpret this as evidence that households in Germany and the Netherlands do not alter their basket composition toward more environmentally friendly grocery aisles.
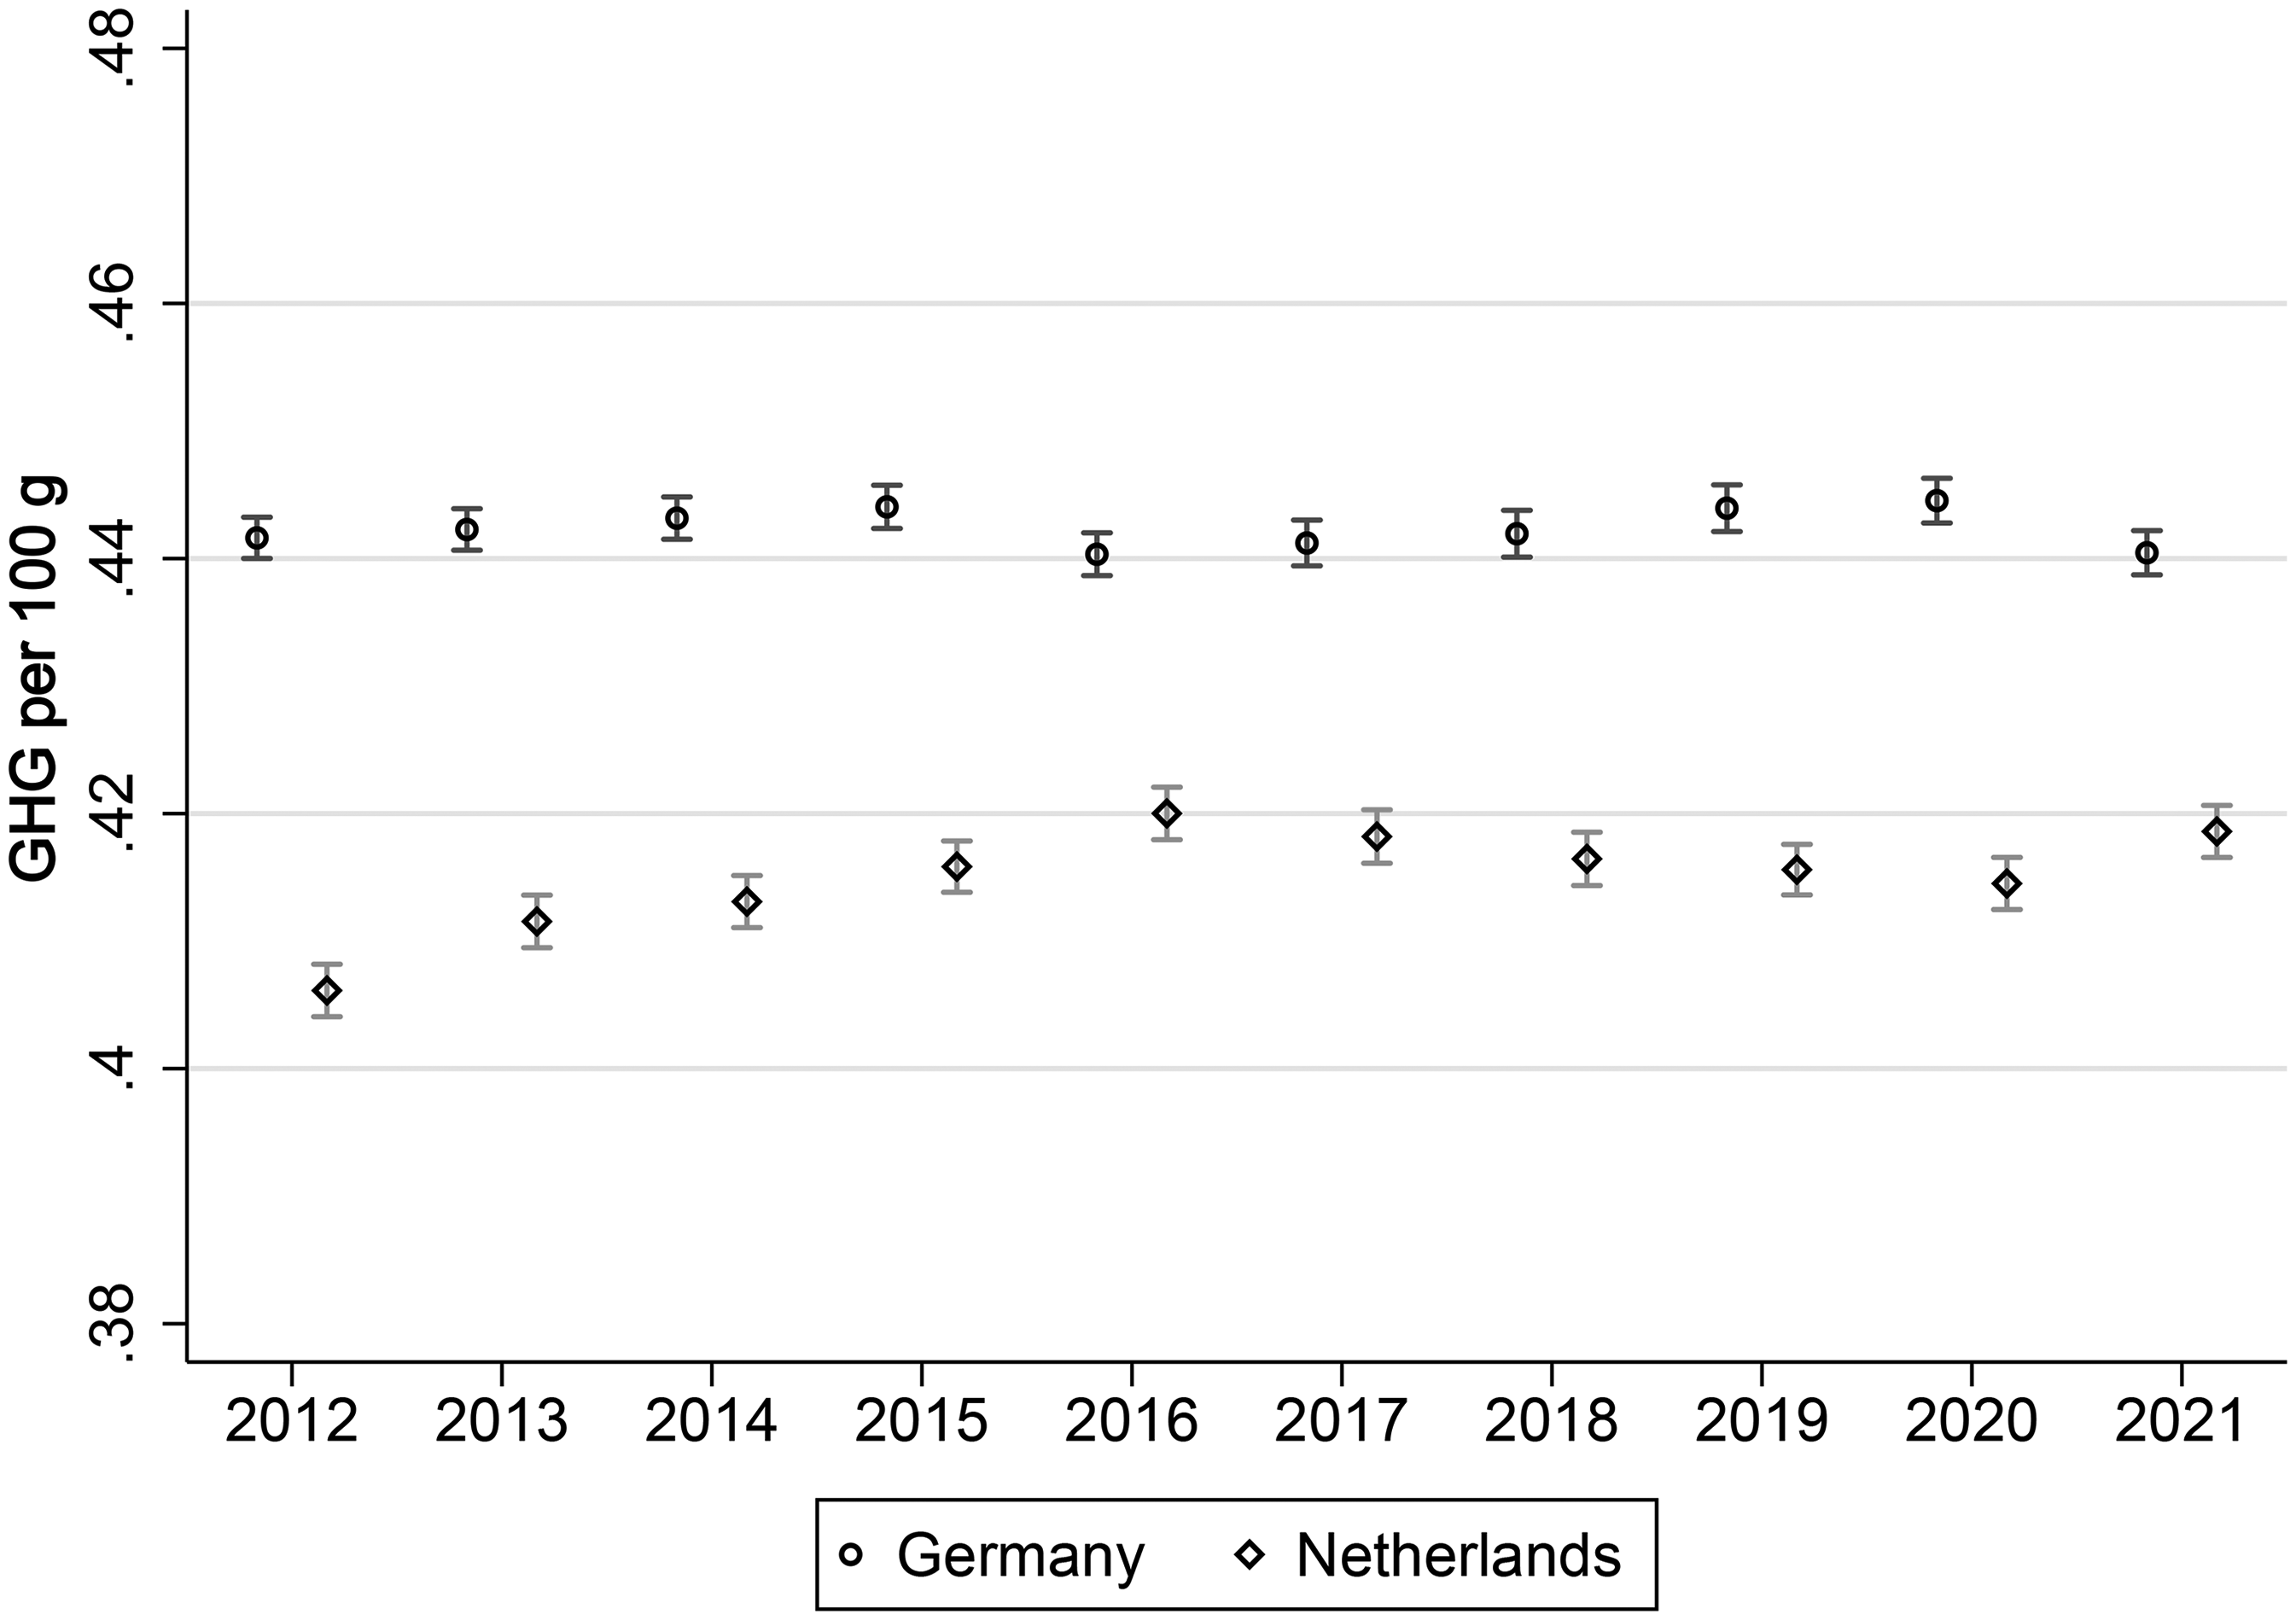
GHG Intensity of Household Grocery Baskets over Time.
The GHG intensity of Dutch shopping baskets is about 5% more environmentally friendly than that in Germany. This is due to differences in purchase habits between the Dutch and German populations for the highest-impact foods. For instance, in 2020 per capita meat available for consumption was 60 kg in the Netherlands versus 79 kg in Germany (Ritchie, Rosado, and Roser 2023).
The data in the app show that the GHG intensity of shopping baskets is persistently different across demographic segments, in particular across households of different generations, 7 with the basket composition of younger shoppers being less GHG intense than that of older shoppers. Taking the Netherlands as an example, the grocery basket of a Millennial averaged .37 kgCO2eq GHG emissions per 100 grams of food in 2012, rising to .39 in 2021. For the Silent Generation, these values are .46 in both years. Similar generational differences in the environmental intensity of shopping baskets are present in Germany.
Next, we report that the total GHG emissions represented by annual shopping baskets are substantially concentrated. Figure 2 shows the 2021 Lorenz curves for households’ annual baskets in Germany and the Netherlands side by side. The Lorenz curve, L(X), represents the fraction of total environmental cost that is attributed to the X% of households with the largest contribution to those costs, and we visualize this curve in Figure 2. This figure also presents the Gini index. 8 The depicted curves apply to concentration in GHG emissions, but similar curves can be viewed in the app for other environmental costs. From the graphs, we observe that there is slightly more concentration in Germany than in the Netherlands. In particular, Figure 2 reports that the 20% most polluting German YouGov panelists account for 47% of the grocery-related GHG emissions of all panelists in 2021. In the Netherlands, this number is 41%. The app shows that these levels of concentration are more or less constant across the years 2012–2021.
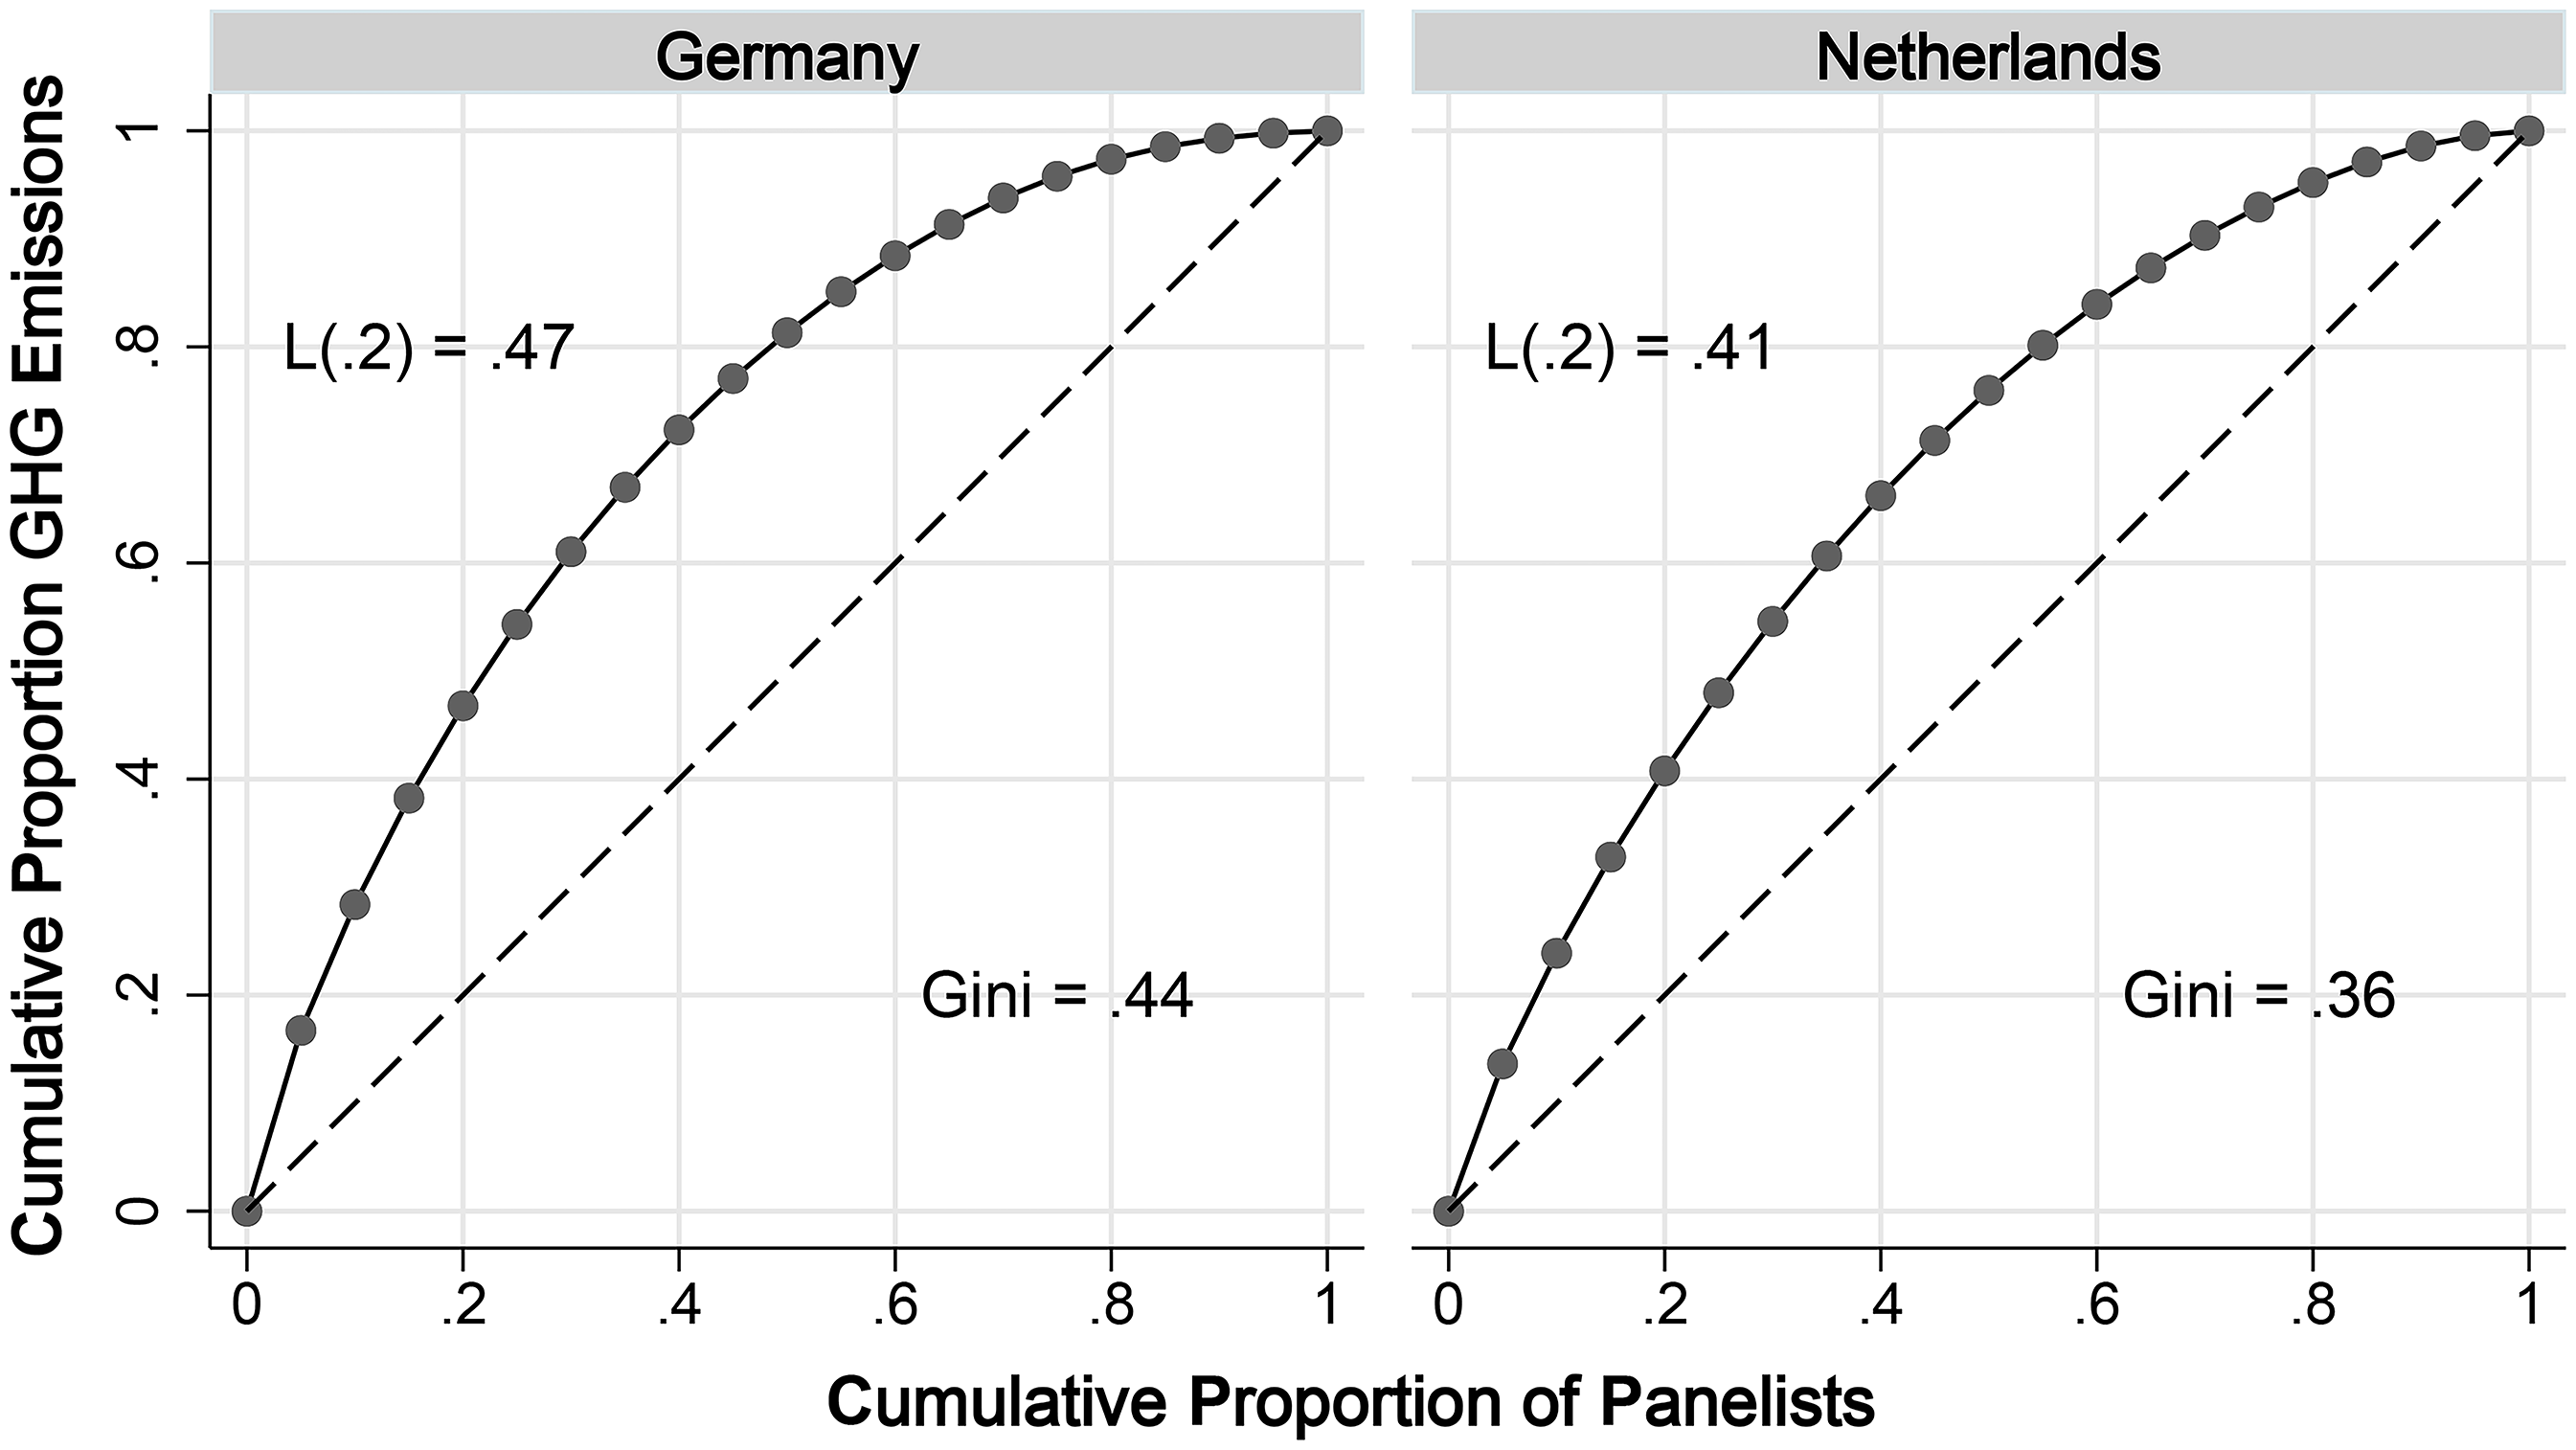
Concentration of Total Environmental Cost in 2021.
Product Category Insights
To better understand households’ sustainable food purchase behavior, we focus on meat and dairy purchases made by households. These categories are among the most environmentally costly and are also frequently purchased in Germany and the Netherlands. Moreover, these categories feature plant-based substitutes (e.g., vegetable burgers, oat milk) with significantly lower environmental costs than their animal-based counterparts. Consequently, shifting to plant-based meat and dairy alternatives in these categories can reduce the environmental impact of grocery purchases substantially.
We categorize meat and dairy products as either “plant-based” or “animal-based” using YouGov's classifications. 9 For dairy products in Germany, where this classification was not available, we relied on text-mining the barcode descriptions.
In the analyses reported next, we track household purchases of plant-based meat and dairy alternatives within each of the two categories. To study the degree of household heterogeneity, we also study purchase patterns by demographic segments defined by generation and tertiles of income and education levels. Lastly, we study national trends in the retail environment—relative pricing and assortment share of plant-based versus animal-based alternatives—to see whether these trends accommodate or hinder a transition toward more sustainable (i.e., plant-based) substitutes for meat and dairy. The figures discussed next are featured in the Product Category Trends tool within the app.
Figure 3 presents trends in the plant-based meat category in the Netherlands. We focus on four metrics: two track households’ purchasing of plant-based versus animal-based products, and two capture trends in the supply of plant-based variants in the overall categories over time (2012–2021). Volume share is the ratio of total volume sales of plant-based alternatives purchased to the combined total of both plant- and animal-based products. Penetration is the fraction of households that purchased plant-based alternatives in the category at least once in the given year. Assortment share is the ratio of the total number of distinct plant-based barcodes in a given category (e.g., meat, dairy) sold at least once in a given year to the number of plant-based plus animal-based products (barcodes) in that category. 10 Relative price is the ratio of the national average price per equivalent unit for all plant-based options in a given category and year to the national average price per equivalent unit for all animal-based options in the same category and year. We computed assortment share and relative prices at the national level because most retailers set prices nationally in the Netherlands and in Germany (Beck, Kotz, and Zabelina 2020; Van Lin and Gijsbrechts 2019), and our data showed no significant differences in these variables between rural and urban areas. 11
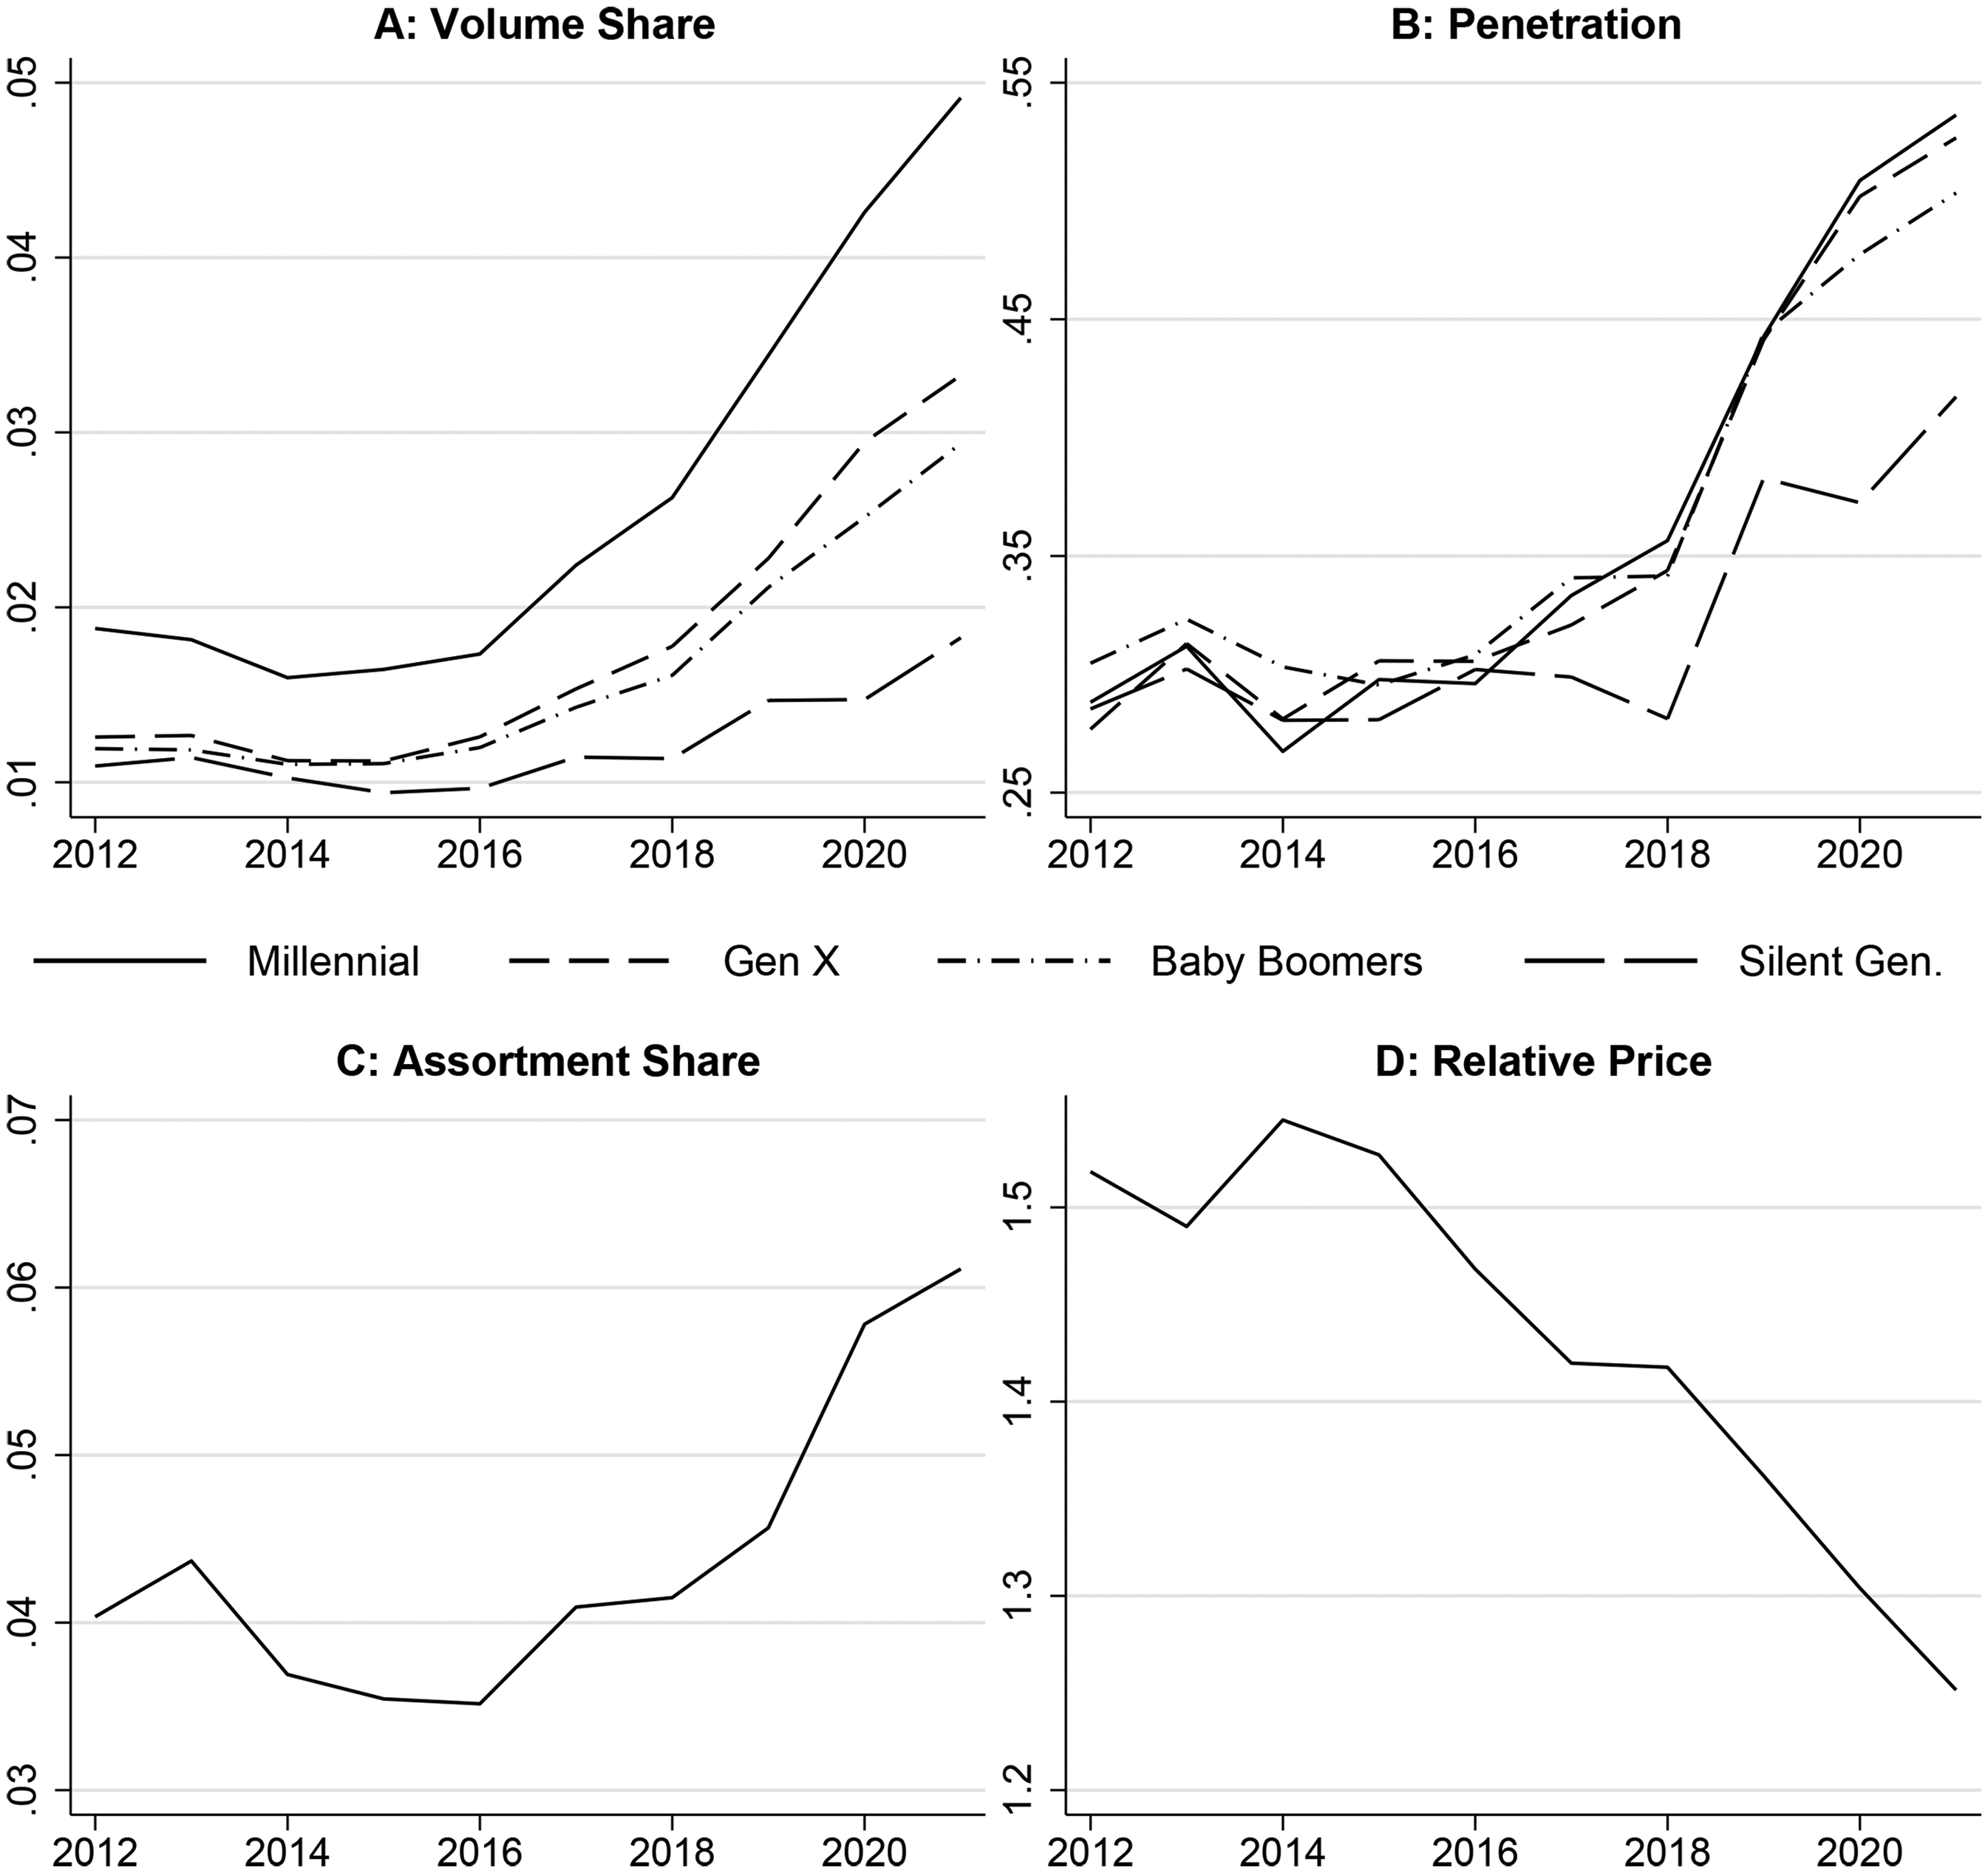
Plant-Based Meat in the Netherlands.
Panel A of Figure 3 reveals an increase, especially after 2015, in the volume share of plant-based meat in the Netherlands. In 2012, plant-based meat accounted for 1% to 2% of total meat purchases by volume. By 2021, Millennials had increased their share to 4.9%, compared with 2.9% for Baby Boomers and 1.8% for the Silent Generation. Despite solid growth (a compound annual growth rate of 10.1% for Millennials between 2012–2021), the overall shares in total category purchases remain small. Notably, these shares are well below the penetration rates even in 2021 (Panel B), which are ten or more times higher than the volume shares for each generation. This substantial gap suggests that while many consumers occasionally purchase plant-based products, they do not make them a regular part of their weekly menus yet (see also, e.g., Neuhofer and Lusk 2022).
One possible explanation for this gap is the retail environment. Indeed, several recent papers have discussed the role of availability and prices in the demand for (new) food products (Allcott et al. 2019; Bollinger, Kronthal-Sacco, and Zhu 2024; Bronnenberg, Dubé, and Joo 2022). Following these studies, we discuss trends in availability and price in the context of choices between plant-based and animal-based substitutes. However, the objective of this article is not to make inferences about the causal impact of these variables. Figure 3, Panel C, shows that the assortment share of plant-based meat rises in a fashion that closely mirrors the rise in volume share, with the assortment share of plant-based meat options increasing in the Netherlands from 4% in 2012 to 6% in 2021. Next, while plant-based products remain more expensive than their animal-based counterparts (Panel D), the price gap narrows substantially between 2012 (52% higher prices) and 2021 (25% higher prices). 12 Although we do not speculate on the demand effects of these 2012–2021 trends, we observe that even with (1) a 25% drop in relative prices, and (2) a 50% rise in assortment share, the 2021 volume share of plant-based substitutes for meat in the Netherlands stands at just 3.5%. As the app shows, similar trends extend to the dairy category and to Germany.
To understand the impact of the demographic differences and growth rates simultaneously, we report descriptive regressions of the volume share of plant-based alternatives on household demographics and years. We do this for the meat (Table 1) and dairy (Table 2) categories in Germany and the Netherlands. The model incorporates year fixed effects, which absorb possible effects of shifts in prices, availability, and other supply-side shifters set nationally by retailers or manufacturers. We clustered standard errors at the household level.
Plant-Based Volume Share for Meat by Demographic Groups and Year.
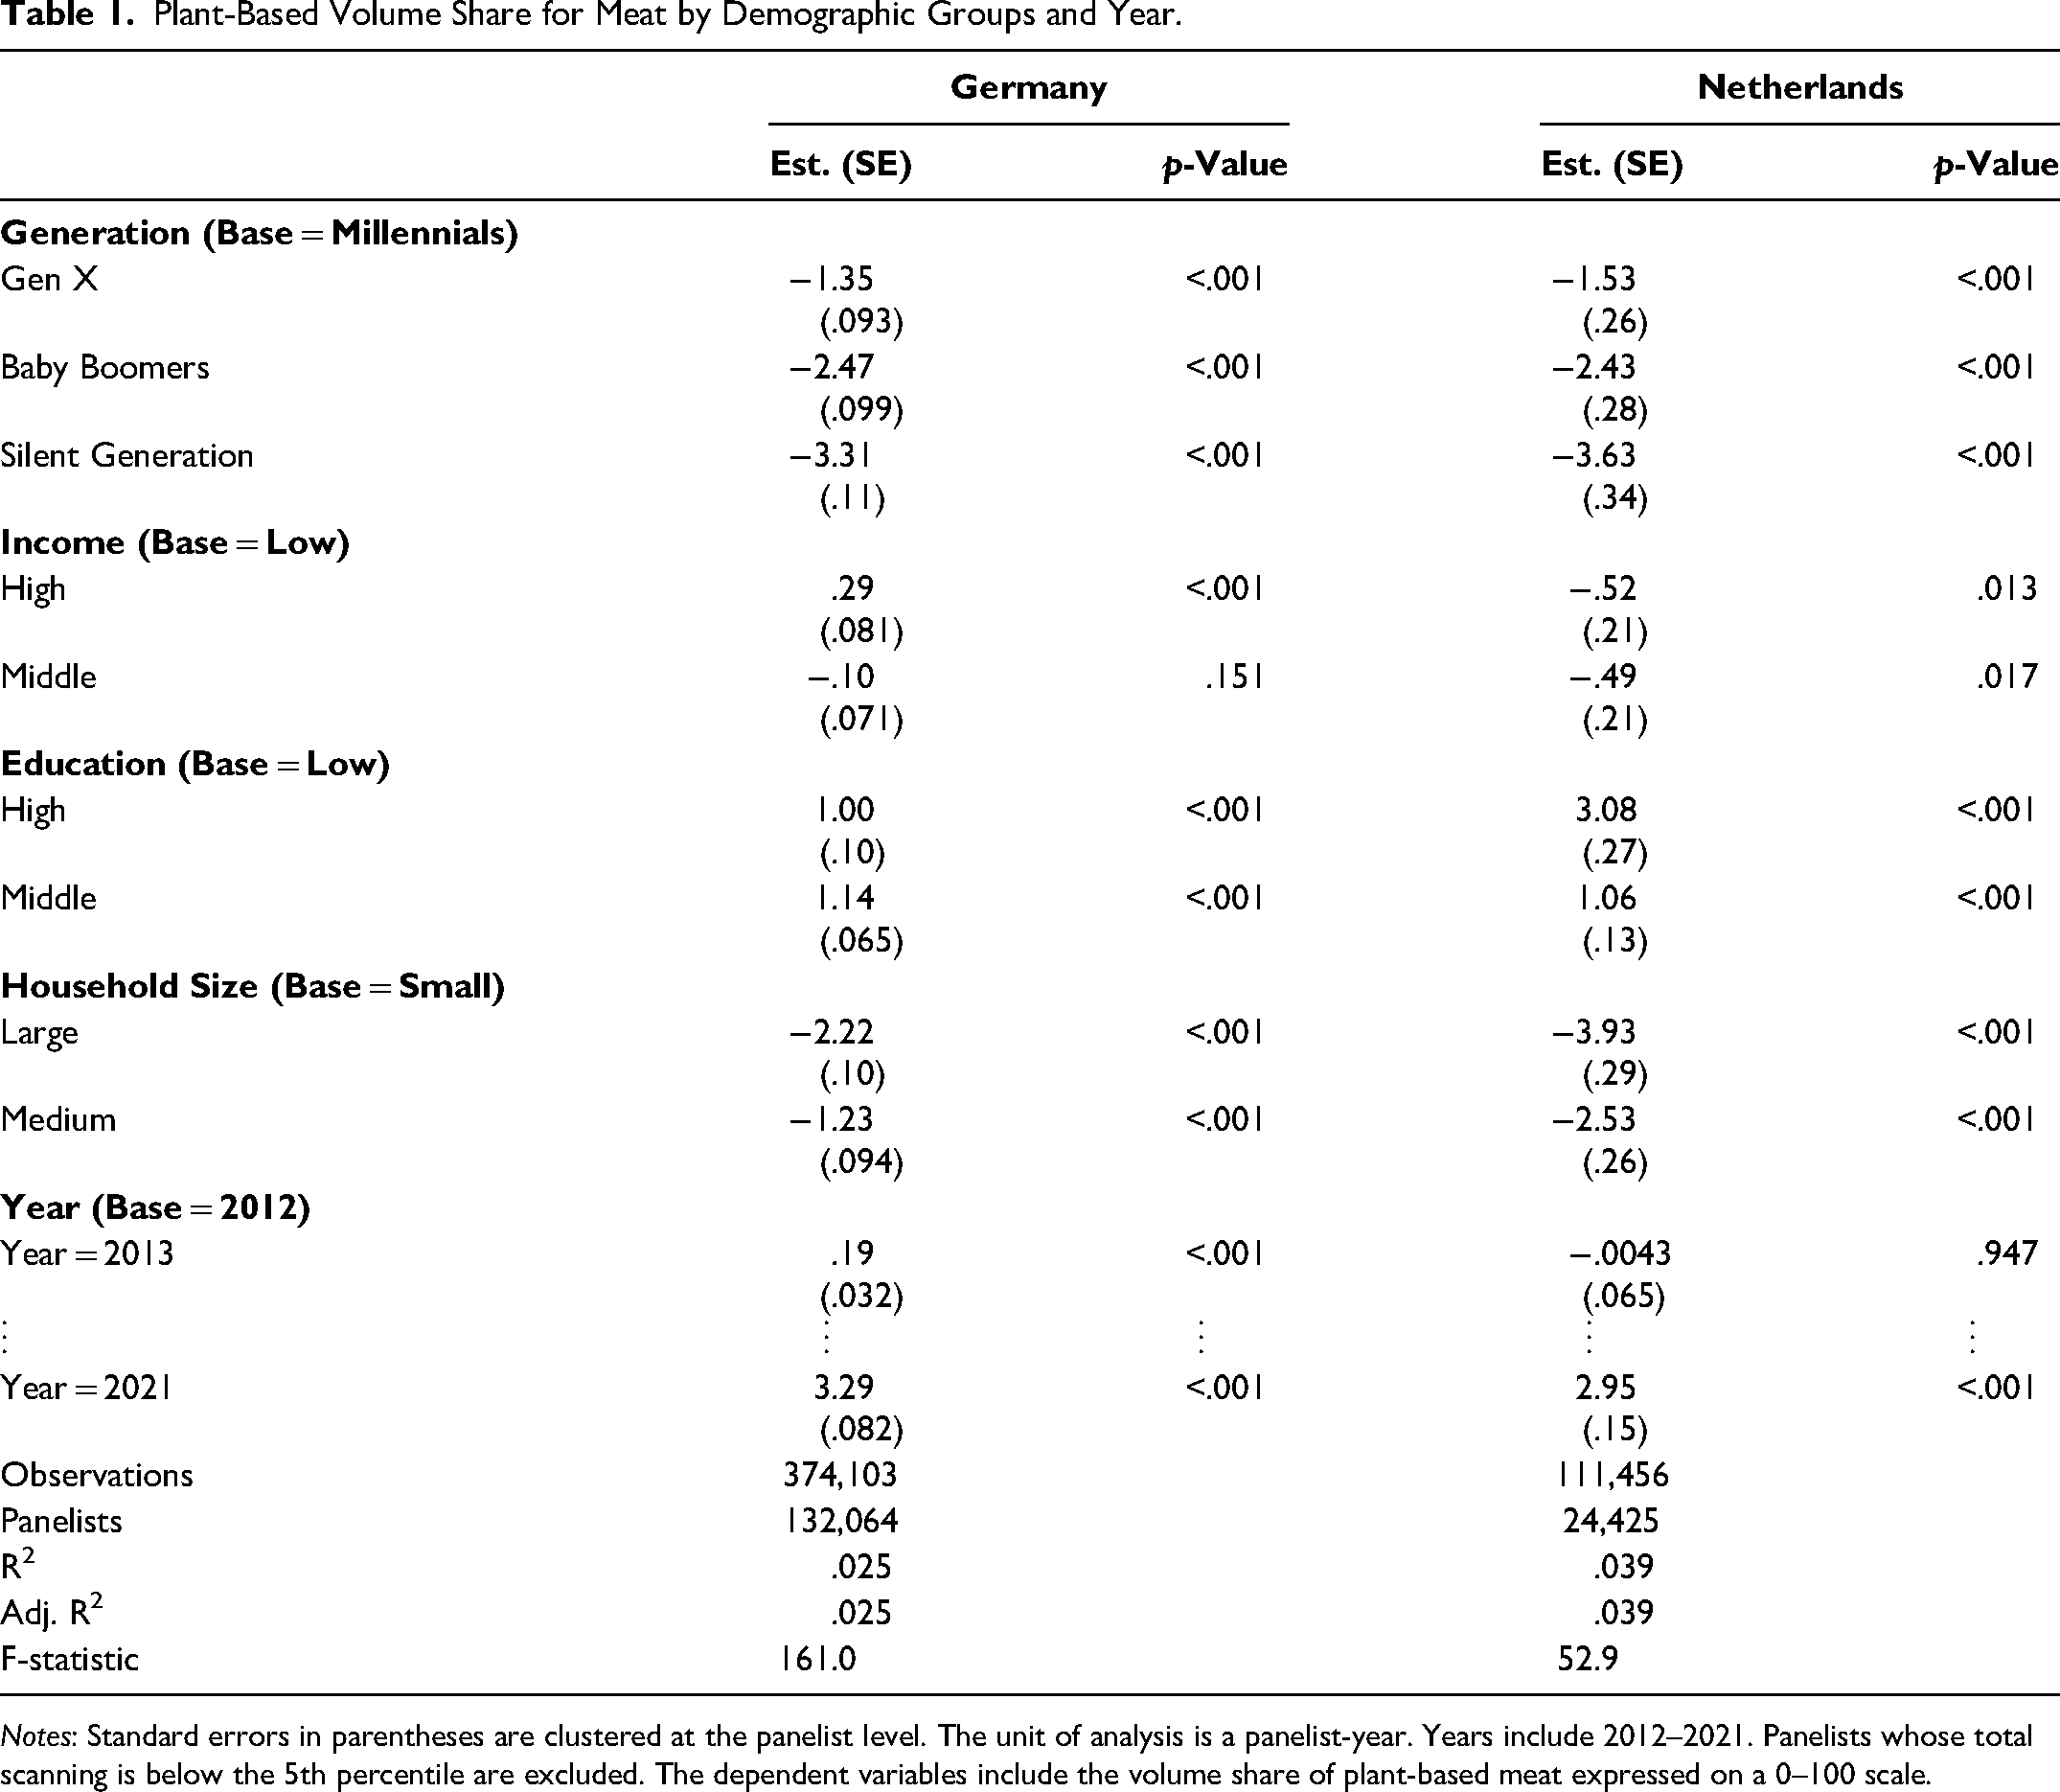
Notes: Standard errors in parentheses are clustered at the panelist level. The unit of analysis is a panelist-year. Years include 2012–2021. Panelists whose total scanning is below the 5th percentile are excluded. The dependent variables include the volume share of plant-based meat expressed on a 0–100 scale.
Plant-Based Volume Share for Dairy by Demographic Groups and Year.
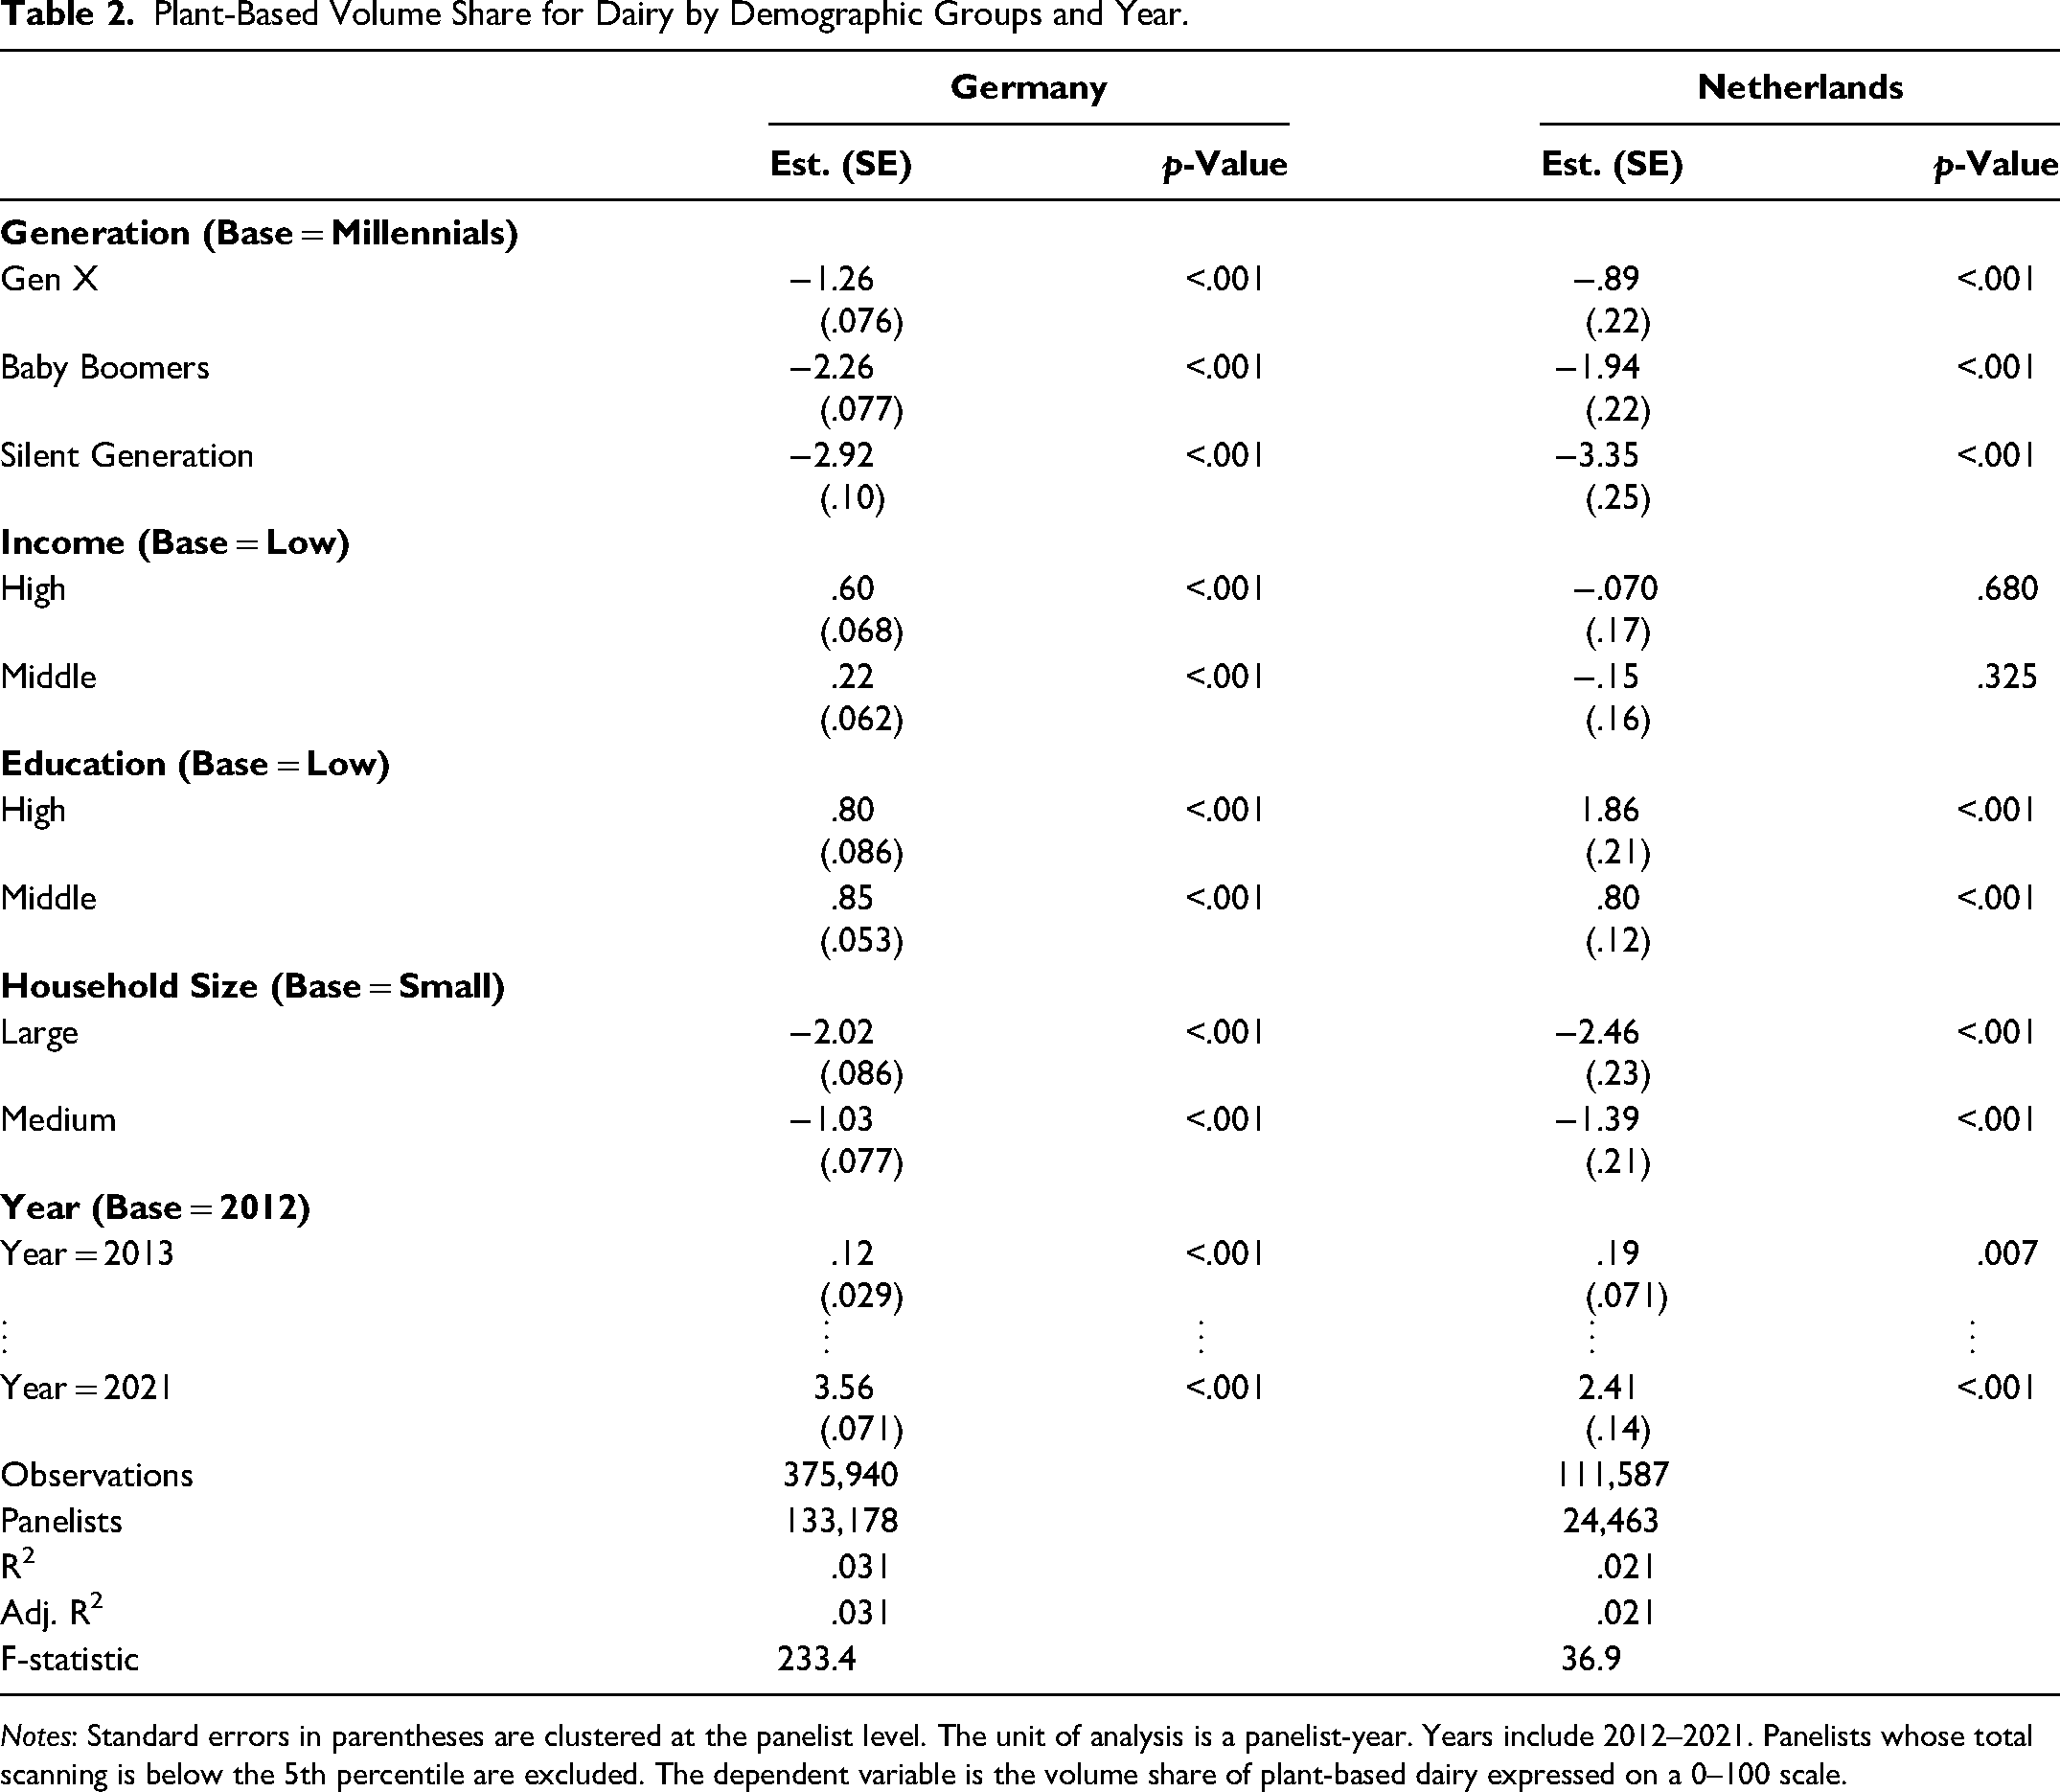
Notes: Standard errors in parentheses are clustered at the panelist level. The unit of analysis is a panelist-year. Years include 2012–2021. Panelists whose total scanning is below the 5th percentile are excluded. The dependent variable is the volume share of plant-based dairy expressed on a 0–100 scale.
Tables 1 and 2 show that the volume share of plant-based alternatives in both countries (1) is greater for younger generations (consistent with Figure 1), (2) increases with education, and (3) decreases with household size. The shares also increase over time. Income effects are relatively small; there is a modest positive effect in Germany, while in the Netherlands, the effect is slightly negative for plant-based meat and negligible for plant-based dairy. In both countries and for both categories, the range of the estimates indicate that education is more important than income in explaining variation in plant-based volume shares.
Discussion of Descriptive Results
We observe that the environmental intensity of household shopping baskets has not decreased between 2012–2021, and households in Germany and the Netherlands have yet to embrace less GHG-intensive diets. At the same time, the literature reports that consumers espouse more favorable attitudes toward environmental sustainability and display an increasing willingness to consume responsibly (Vermeir et al. 2020). Previous research has similarly highlighted an attitude–behavior gap between consumers’ pro-environmental attitudes and their actual food decisions (Schäufele and Janssen 2021; Vermeir and Verbeke 2006; Vermeir et al. 2020).
In addition, on the supply side, relative prices for plant-based alternatives are falling and assortment shares are rising in both Germany and the Netherlands. Theory would predict that these trends impact sustainable food purchases positively. Yet, this has not resulted in a large drop in the environmental intensity of shopping baskets. This is echoed by Peacock (2024), who argues that even after price, availability, and taste become competitive, plant-based alternatives are unlikely to fully replace meat for most consumers.
These research results leave room to speculate on at least two other product-related aspects responsible for the lack of diet change. One of these is food habits. Younger generations have higher volume shares for plant-based food alternatives than older generations. This is consistent with an effect of historically formed consumption capital or habit formation (Bronnenberg, Dubé, and Gentzkow 2012). In the context of sustainable purchase habits, older generations may have formed their preferences in a period when plant-based replacements for meat and dairy were scarce or unavailable. From a marketing perspective, strategies to address these ingrained habits for animal-based foods (e.g., repeated sampling or trial) may be necessary.
The other aspect that might explain the attitude–behavior gap is that the behavior is based on biased information. Research has shown that consumers have incorrect beliefs about the environmental costs of animal-based versus plant-based foods: They often underestimate the environmental costs of their own food choices (e.g., De Boer and Aiking 2022) and are particularly likely to do so for animal-based (vs. plant-based) foods (Camilleri et al. 2019). Providing consumers with information on the environmental impact of different foods may therefore potentially be an effective strategy to prompt behavioral change. This is what we investigate next, starting with a short overview of the literature on the impact of consumer beliefs on sustainable consumption.
Carbon Innumeracy and Sustainable Food Choices
One barrier to dietary change is consumers’ inability to accurately assess the environmental cost of their own food consumption (White, Habib, and Hardisty 2019; Winterich, Reczek, and Makov 2023). We start by reviewing the literature on consumer knowledge of food-related environmental impacts and next investigate the effects of providing consumers with different forms of environmental feedback on their food purchases.
Consumers are not trained as food or environmental scientists. Therefore, it is no surprise that their perceptions of the environmental impact of their food choices is often poor and biased (Camilleri et al. 2019; Grinstein et al. 2018; Wynes, Zhao, and Donner 2020). This is sometimes referred to as “carbon illiteracy” or “carbon innumeracy.” As a case in point, Camilleri et al. (2019) report that people underestimate the impact of the most polluting foods, such as beef and lamb, by a factor of 100, whereas they underestimate the impact of plant-based foods only by a factor of 3, (see, e.g., Camilleri et al. 2019, Figure 2). This lack of accurate knowledge likely inhibits behavioral change even among those who wish to consume more sustainably.
Aside from preferences for sustainable consumption, food decisions are inherently complex, involving consumers’ nutritional needs, personal preferences, prices, convenience, and habits. The presence of unfamiliar (Furst et al. 1996), hard-to-interpret metrics like GHG emissions further complicates these decisions (Grinstein et al. 2018). Reducing food-related emissions requires consumers to make complex trade-offs to meet their nutritional needs and taste preferences. Compared with simpler emission-reduction strategies, such as lowering energy consumption by cutting electricity usage, this process is substantially more challenging (Abrahamse et al. 2005). For example, unlike switching from animal- to plant-based food, switching to renewable electricity does not affect the quality or experience of electricity usage and often does not require the consumer to learn new habits.
Existing approaches to educating consumers have shown mixed results. For example, environmental labels, such as red-yellow-green “traffic light” rating systems, show limited impact (Brunner et al. 2018; Grunert, Hieke, and Wills 2014). Such labels often fail to convey the magnitude of emissions between different foods or to contextualize emissions relative to other behaviors. Similarly, many “carbon footprint calculators” aggregate emissions across broad domains but provide only generic tips, such as the recommendation to “eat seasonally,” that are not quantified or empirically based (Mulrow et al. 2019). In addition, carbon calculators often fail to educate consumers about the trade-offs they can make to reduce their personal footprint (Collins et al. 2020; Luo et al. 2023). For example, Collins et al. (2020) found that while 91% of users rated one popular carbon calculator as useful for knowledge generation, only 23% felt it provided sufficient information to make actual changes to their lives to reduce their ecological footprint. More recently, carbon labels have shown promise by reducing the knowledge gap between the emissions of animal- versus plant-based foods and encouraging lower-emission choices (Cadario, Li, and Klesse 2025). However, consumers still lack knowledge about their own food-related emissions and how specific changes in their diet could lead to meaningful reductions.
One approach to addressing these challenges is to provide personalized feedback that links the environmental impact of specific foods to individual choices. Such feedback allows consumers to learn how to lower food-related emissions in ways that align with their own preferences. In the current work, we therefore integrated a dynamic feedback environment into our app that encourages consumers to explore how changes in their consumption affects their environmental footprint. To determine the nature of this feedback, we next briefly consider the literature on which types of personalized feedback have been used to persuade consumers to change their diet.
Studies show that social comparisons play a crucial role in encouraging sustainable behavior (Allcott 2011; Gifford and Nilsson 2014; White, Habib, and Hardisty 2019). For example, research has found that informing consumers about how their performance compares to others (descriptive norms) can reduce energy consumption (Nolan et al. 2008), increase recycling rates (Viscusi, Huber, and Bell 2011), and influence a wide array of pro-environmental behaviors (Farrow, Grolleau, and Ibanez 2017). We consider whether this is also the case when navigating the complex trade-offs inherent in lowering food-related emissions. Prior research also points to the importance of familiar units. For example, Camilleri et al. (2019) found that when consumers were given simple metrics like carbon emissions (translated into “light-bulb minutes”), they opted for more environmentally friendly products.
Next, we experimentally test the effectiveness of personalized feedback in shifting knowledge and food choices and explore how the presentation format of this information influences its impact.
Exploring Consumer Responses to Different Forms of Personalized Feedback
General Setup
We created a tool within the app, called Compare Your Impact, that provides users with personalized information about the environmental cost of their food choices. Importantly, the tool encourages consumers to explore various counterfactual purchases, allowing them to compare the impact of different choices they enter. Consumers thus are able to improve knowledge regarding the environmental impact of their grocery purchases and discover ways to make less environmentally harmful food choices.
Figure 4 shows the tool's interface, where users begin by entering basic demographic information (i.e., country of origin, generation, net monthly household income, and household size). Next, consumers enter weekly servings (in fixed serving sizes of 100 grams) for their entire household across 13 main food categories. 13 These categories were chosen because our panel data show that they constitute significant components of households’ baskets in terms of volume and our emissions accounting procedure shows they vary widely in their environmental impact. 14 To minimize the potential challenge for consumers of translating foods into 100-gram servings, we provide category-specific information translating 100 grams into more intuitive units (e.g., “Vegetables: 100 grams is about 2 carrots or half a potato,” “Eggs: 100 grams is about 2 eggs”). The tool then generates three types of feedback regarding the environmental cost of their reported food purchases.
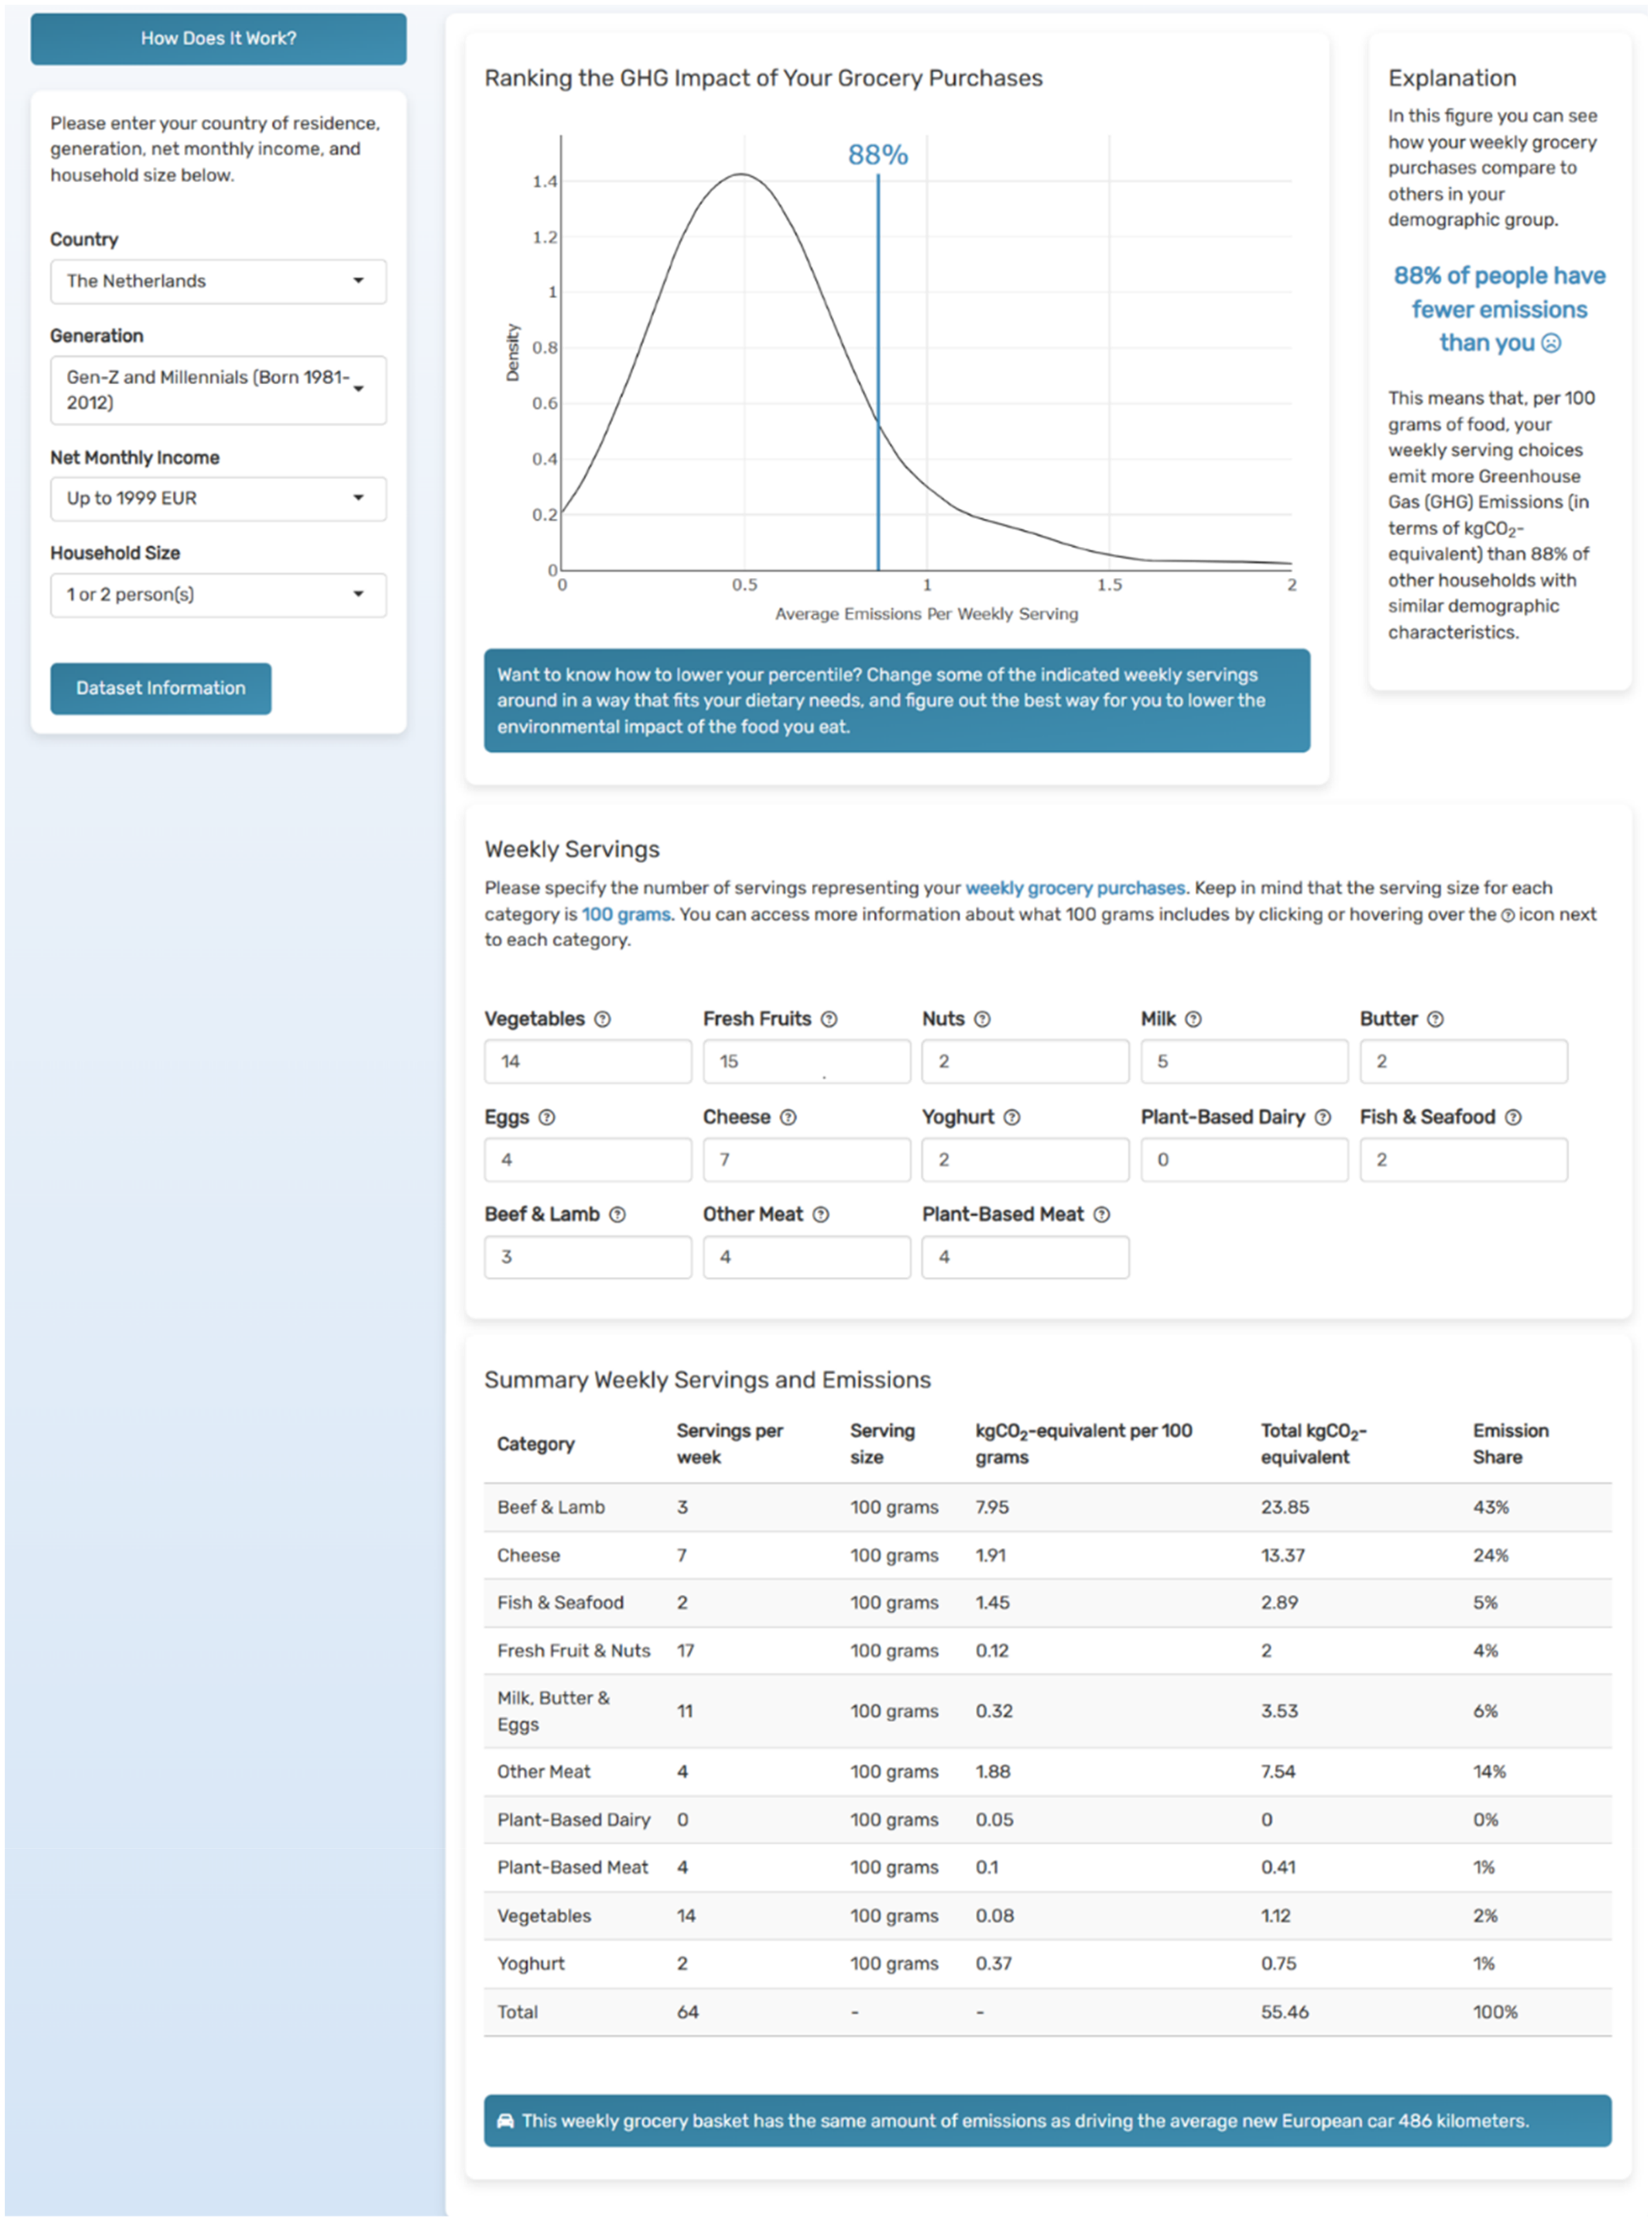
Interface of the Compare Your Impact Tool.
First, the app presents relative information. Drawing on the rich history of the benefits of invoking social norms (see Farrow, Grolleau, and Ibanez [2017] for a review), the app compares the user's GHG intensity (emissions per 100 grams of food) with that of demographically similar households in the dataset. It visualizes this comparison as a kernel-smoothed density plot of GHG intensities among peers, marking the user's GHG intensity and showing the percentage of similar households with a lower environmental impact. This information is easy to understand (Dijksterhuis, Bouwman, and Taufik 2021); social comparisons are most effective when individuals compare themselves with similar others (De Dominicis et al. 2019; Goldstein, Cialdini, and Griskevicius 2008), making this feedback both relatable and actionable.
Second, the app presents objective information to app users by offering total GHG emissions associated with their purchases, plus a breakdown by food category in terms of total GHG emissions and the GHG share of the total basket. Based on Clark et al.’s (2022) measures, users can easily compare, for example, the GHG emissions from 100 grams of beef with 100 grams of a plant-based meat alternative, or how much of their personal emissions come from cheese or fresh fruits and nuts.
Third, because the objective environmental cost information might be difficult to interpret, we translate it to a familiar unit by giving the GHG equivalent of the total emissions in terms of kilometers driven in an average new European gas-powered car (European Environment Agency 2023). This information shares the advantage with the relative information feedback in the app that it is easier to process for consumers who are not yet familiar with the units used to measure environmental costs (e.g., kgCO2eq emissions; see also, e.g., Grinstein et al. 2018; Rondoni and Grasso 2021).
To illustrate these different forms of impact, Figure 4 illustrates the interface of the tool for a Dutch user who self-reported as Gen Z/Millennial, with below-average income, in a one- or two-person household. The relative feedback indicates to this user that the food basket composition of their household is more GHG intense than 88% of demographically similar households. The objective feedback, shown in the table “Weekly servings and emissions,” provides detailed breakdowns, allowing consumers to see immediately which foods carry the highest emission shares, and to what extent. The familiar-unit feedback further reveals that the 64 100-gram servings reported by the user across 13 categories have “the same amount of emissions as driving the average new European car 486 kilometers.”
In addition to presenting information about the environmental costs of consumers’ weekly food purchases, a key aspect of the app is that it encourages consumers to adjust their inputs to explore how substituting different foods alters their environmental impact. If consumers aim to limit the impact of their food choices, then this tool allows them to experiment with the inputs and dynamically-generated outputs to find a personal pathway toward lower emissions. For example, if a user wants to cut food-related emissions but is unwilling to give up animal-based cheese, the tool allows them to explore alternative changes—such as substituting beef with plant-based proteins—to achieve emission goals. This personalized approach empowers consumers to create their own pathway for lower-impact diets while maintaining alignment with their food preferences.
We use the Compare Your Impact tool to conduct two experiments reported next.
Experiment 1: Subjective and Objective Knowledge
Method
In Experiment 1, we measure how interacting with the tool affects consumers’ subjective and objective knowledge about the environmental consequences of their own food choices. Subjective knowledge (how much consumers think they know about a topic) and objective knowledge (how much they actually know) are key drivers of consumer behavior (Ellen 1994; Mitchell and Dacin 1996; Moorman et al. 2004). Our goal was to find out whether using the Compare Your Impact tool influenced either of these variables. To evaluate this, we conducted a within-subjects experiment. We received input from a total of 201 Dutch participants from Prolific Academic (Mage = 29.80 years, SD = 9.26; 53.2% male, 45.8% female, 1.0% other/prefer not to say). The method and analysis were preregistered (https://aspredicted.org/sm9m-8hp8.pdf). We report all measures and do not exclude any participants.
The experiment design features three time-based conditions. In time period 1 (T1), all participants first answered six subjective knowledge questions (Moorman et al. 2004) and six objective knowledge questions about the environmental impact of their food consumption (e.g., subjective knowledge: “How knowledgeable do you feel about how to lower the environmental impact of the food you eat?”; 1 = “Not at all,” and 7 = “Extremely”; objective knowledge: “Which of these foods causes the highest greenhouse gas emissions?” “Red meat [e.g., beef and lamb]” [correct response], “Other meat [e.g., chicken],” “Fish and seafood,” or “Cheese”; see preregistration or Web Appendix B for more details). Participants then used the Compare Your Impact tool for five minutes. After interacting with the app, participants answered the same subjective and objective knowledge questions a second time (T2). Participants then indicated their age and gender. Finally, we added a third time-based condition, 15 where participants completed the same questions a third time, six months after using the app (T1 and T2: November 27, 2023; T3: June 5–12, 2024). Importantly, in T3, respondents did not interact with the app again, ensuring that their responses reflected their sustained impressions without further influence from the app.
Results and discussion
We first created composite measures of subjective knowledge at T1 (α = .92; M = 3.52, SD = 1.11), T2 (α = .93; M = 4.22, SD = 1.10), and T3 (α = .92; M = 4.08, SD = 1.03) and calculated the number of correct answers for the objective knowledge questions at T1 (M = 3.00, SD = 1.16), T2 (M = 4.08, SD = 1.33), and T3 (M = 3.45, SD = 1.10). Paired-sample t-tests comparing T1 and T2 reveal that, as a result of using the tool, participants’ subjective knowledge increased significantly (t(200) = 8.37, p < .001, d = .59). Analyzing only participants who completed the T3 assessment reveals that these gains in subjective knowledge persisted for six months (T1 vs. T3: t(124) = 7.26, p < .001, d = .65) with an insignificant decline over this elapsed time (T2 vs. T3: t(124) = .61, p = .545, d = .05). Further, participants performed significantly better on the objective knowledge test after using the app, answering on average one additional question correctly (T1 vs. T2: t(200) = 9.93, p < .001, d = .70). Some of these gains in objective knowledge persisted for six months (T1 vs. T3: t(124) = 3.32, p = .001, d = .30), though there was some decline over time (T2 vs. T3: t(124) = 6.37, p < .001, d = .57). An exploratory analysis revealed that the effect of our overall treatment (T3 vs. T1) did not vary based on age or gender (p-values > .55).
We acknowledge that attrition in our panel may have led to selection effects. We attempted to minimize this concern by not mentioning the topic of the survey (i.e., environmental impact) when recruiting participants again. It is possible that more conscientious or diligent participants or those who were more likely to have conducted independent research on this topic in the intervening months were overrepresented in the T3 sample compared with the T1/T2 sample, though attrition was not consistently related to subjective or objective knowledge at T1/T2. Further, our subjective knowledge measure may be subject to demand effects if participants recognized that we were interested in the long-term effects of our intervention.
Overall, these results demonstrate that interacting with the tool for only five minutes significantly increased both subjective and objective knowledge about the environmental costs of food choices. The moderate Cohen's d effect sizes above .50 between T1 and T2 for both measures suggest that the knowledge gain is not only statistically significant but also practically relevant. These gains persisted over six months, with negligible loss of subjective knowledge and moderate, but not complete, loss of objective knowledge gains.
Experiment 2: Food Choices
Method
Experiment 2 is designed to address two additional research questions. First, we examine how interacting with the tool affects GHG emissions associated with consumers’ intended purchases. Second, we investigate which specific elements of the tool's feedback are most effective in altering the GHG of consumers’ intended food decisions: the relative information that shows a user's percentile score in the GHG-intensity distribution of their peers, the objective information in the form of a table that summarizes the user's weekly servings and associated emissions, or the familiar-unit information that additionally translates these emissions into an equivalent number of kilometers driven in a car.
To evaluate this, we conducted a between-subjects experiment with 602 Dutch participants from Prolific Academic, disallowing those who completed our first experiment and eliminating 6 participants who did not follow instructions (N = 596; Mage = 29.45 years, SD = 8.21, 2 participants with undisclosed age; 50.5% male, 47.7% female, 1.8% other/prefer not to say). The method, exclusion criteria, and analysis were preregistered (https://aspredicted.org/vx4w-fh3y.pdf), and we report all measures. The protocol of this study welcomed participants to a Qualtrics survey on the environmental impact of foods, providing general instructions. After the introduction in Qualtrics, participants were directed to the app, where they first entered demographic information and their weekly servings of food purchased across 13 categories. They then downloaded this input from the app and uploaded it directly into the Qualtrics survey. The experiment continued in the app, where participants received feedback about the environmental impact of their food choices, based on random assignment to a 2 (relative information: no, yes) × 3 (objective information: no, yes, yes + kilometers driven) between-subjects design. Participants in the control group who received no relative and no objective information were instructed to return to the Qualtrics survey after inputting their weekly food purchases, without receiving any feedback. In the other conditions, participants received some feedback (e.g., only relative, only objective, both types) about their choices and had the opportunity to explore personal pathways toward lower environmental emissions in the app's dynamic environment, similar to Experiment 1.
After spending time in the app and receiving feedback on alternative choices, participants returned to the Qualtrics survey and completed five randomized purchase-intention questions based on a hypothetical context, each involving a choice between 100-gram servings of three ingredient options for a meal (for all stimuli, see Web Appendix B, Experiment 2). For example, one of these questions asked, “Imagine that next week you will cook pasta. You have the noodles and the ingredients for the sauce. Now you are thinking about getting one of the following ingredients for your pasta. Which would you choose?” Three options were presented with both pictures and text: minced beef, minced chicken, and minced plant-based meat. The other questions, shown in Web Appendix B, included similar scenarios. Four questions had participants choose between red meat, white meat or fish, and plant-based meat; the other choice was between whole milk, skim milk, and oat milk. We then calculated for each respondent the total kgCO2-equivalent of their five choices using the category-level estimates from Clark et al. (2022) as well as their share of plant-based ingredients in the five tasks.
Results and discussion
Results of an 3 × 2 ANOVA with the relative and objective information as independent factors and the total GHG emissions (kgCO2-equivalent) of participants’ five choices as the dependent variable revealed a significant main effect of relative information (F(1, 590) = 4.23, p = .040,
Compared with the condition with no feedback, the condition with all three forms of feedback (i.e., the feedback presented in the full version of the app) lowered GHG emissions associated with the five grocery choices by 33%. Participants who were randomly assigned to interact with the full version of the app also chose plant-based alternatives for twice as many meals (44.86%) compared with participants who were randomly assigned to the no-feedback version of the app (22.33%). This doubling of the share of meat alternatives seems like a considerable magnitude, but more research is required to demonstrate the effect of these informational treatments on other measures of purchase intentions or actual purchases and to systematically compare them with other interventions such as price cuts. We also note that these results show higher interest in plant-based foods, even in the no-feedback version, than seen in the household panel data. This may be due to an attitude–behavior gap in sustainable consumption, or to the context of the study where participants choose from just three products. Although the impact of this concern is limited, because we do not expect these factors to systematically vary between conditions, we acknowledge that real-world purchases tend to show less overall sustainable consumption than intention measures like those asked in this survey.
Discussion of the Experimental Results
While many consumers express a willingness to consume more responsibly (Vermeir et al. 2020), our first experiment reveals that consumers are not very knowledgeable about the environmental footprint of their food choices. Participants scored relatively poorly on both subjective and objective environmental knowledge. While they recognize that red meat has a higher emissions cost than other foods, they underestimate the magnitude of this difference relative to low-impact foods. For instance, at T1, 93% of consumers in our experiment correctly identified that red meat is responsible for excessive GHG emissions, but 73% underestimated the extent to which red meat is worse than a plant-based alternative, underscoring the importance of our comparison-focused tool. Thus, consumers tend to underestimate the emissions particularly for high-impact foods like red meat and may not fully realize how much of a difference substitutions from high-impact to low-impact foods can make (see also, e.g., Camilleri et al. 2019).
By providing each user personalized factual information on their past consumption and on their self-chosen alternative baskets, the Compare Your Impact tool helps reduce this knowledge gap. Its dynamic environment also helps consumers find substitutes that are possibly better at balancing their consumption and sustainability goals. This allows them to establish goals and develop a roadmap toward achieving them, which can cultivate better self-regulation skills in individuals (Bandura 1989, 1991).
Interaction with the app led to not only a significant increase in participants’ environmental knowledge but also a decrease of GHG emissions in their intended future choices. By making the environmental impacts of different foods and overall grocery baskets more accessible and actionable, the app allows users to make more informed and environmentally friendly decisions. Such changes represent important steps toward the sustainability targets set forth in the Paris Agreement, demonstrating the potential for personalized feedback tools to facilitate dietary transition.
Conclusions
There is broad consensus among academics (e.g., Clark et al. 2020; Springmann et al. 2018), media reports (e.g., Economist 2024), and governments (De Lorenzo 2023; World Health Organization 2021b) that transitioning consumers to more environmentally sustainable (e.g., plant-based) diets is necessary to reduce the environmental costs of the global food system. While high-quality data exist on nutrition, vehicle fuel efficiency, and even household energy use, equivalent information on the environmental impact of specific foods or on a household's shopping basket is scarce. This lack of transparency is significant, given that the global food system is responsible for a large share of emissions and other environmental costs (Ritchie and Roser 2020). Likewise, consumers often lack access to relevant data on the environmental footprint of alternative diets, hindering their ability to make food choices that align with their personal environmental goals.
Using a unique dataset linking household purchases to relevant environmental costs, this study shows that the environmental intensity of households’ grocery baskets in Germany and the Netherlands has not declined between 2012 and 2021. We find considerable heterogeneity in environmental impacts across households and in households’ adoption of plant-based alternatives. Younger and more educated households are gradually shifting their diets toward less environmentally costly plant-based alternatives, yet the market shares of these products remain low.
We utilize this dataset not only to highlight the problem but to also study a potential solution. We conjecture that this lack of progress in the environmental impact of food is partly due to a lack of environmental knowledge among consumers, and we use the same dataset to develop a tool that helps close the knowledge gap. We then conduct two experiments that demonstrate the impact of informing consumers about the emissions related to their food decisions. Using the tool in our app, participants received personalized feedback on the emissions linked to their food purchases and explored the environmental costs of sustainable alternatives aligned with their dietary preferences. By leveraging the panel purchase data, the tool also provided peer comparisons, showing participants where they stood relative to demographically similar households in terms of GHG emissions. This approach increased both subjective and objective environmental knowledge and led to reductions in GHG emissions from planned choices. By translating consumers’ actual food purchases into their associated environmental costs, our tool provides a dynamic, personalized environment for understanding and acting on sustainability goals.
Our study underscores the extent of the knowledge gap regarding the sustainability of different foods (Camilleri et al. 2019; Winterich, Reczek, and Makov 2023). Importantly, the results demonstrate that this gap can be bridged relatively easily and cost-effectively by distributing an app to consumers. We also show that the acquired knowledge translates to more sustainable purchase intentions. This emphasizes the importance of developing dynamic carbon calculators, particularly those focused on food-related emissions, as well as research into their effectiveness in changing people's diets (Dreijerink and Paradies 2020; Mulrow et al. 2019; Padgett et al. 2008).
Practical Implications for Practitioners and Policy Makers
Companies use information dashboards to monitor relevant indicators over time, set future goals, and communicate with important stakeholders (Hanssens and Pauwels 2016; Pauwels et al. 2009). The information displays in our app integrate frontier knowledge about sustainability metrics with food purchase data and can support sustainability policy at various levels.
Food manufacturers and retailers
Companies are increasingly committing to sustainability initiatives (Gielens et al. 2021; Kronthal-Sacco and Whelan 2022; Vadakkepatt et al. 2021). However, making choices about sustainable product line extensions and promotion strategies requires a thorough understanding of which segments are most likely to purchase these offerings. Our analysis reveals that younger generations, higher-educated households, and smaller households buy more sustainable food alternatives. While these groups demonstrate high trial rates, their low purchase rates highlight the need for more in-depth consumer research.
Policy makers
The slow pace of transition toward sustainable food choices, as reported in our results, highlights the urgency for better-targeted interventions. Policy makers can leverage our insights to develop more effective, data-driven sustainable food policies (Sedlacko, Reisch, and Scholl 2013). For instance, identifying high-emission foods enables policy makers to design more tailored interventions that efficiently reduce overall emissions. In addition, the results of our experiment suggest that small informational interventions can make a large difference in this domain, and that policy makers should consider employing educational interventions like our app.
Planned App Developments, Limitations, and Future Research Directions
A next step is to distribute the app more broadly and track how its information influences actual consumer food choices over time. Expanding awareness of our app could help consumers reduce their environmental footprint, advancing progress toward the goals set out in the Paris Agreement. Regular updates to the dataset will allow us to capture shifts in trends and evaluate the effects of future public policy changes.
Currently, our app includes data from only two countries, Germany and the Netherlands. Future iterations aim to incorporate additional countries to broaden the scope of the analysis.
This study is not without limitations. First, we focus on grocery purchasing behavior, which does not represent out-of-home food options, in constructing our measures of environmental costs. Second, we match grocery purchases over the past decade with a single cross-section of environmental costs representing recent but not historical production technology. While this isolates the effect of household substitution patterns across categories, it ignores the influence of technology shocks, good or bad. Although this assumption is a simplification, holding the environmental technology constant is helpful in isolating the effects of consumer behavior (i.e., diet change), which marketing policy can directly affect. Third, we ignore within-aisle variation in environmental costs. This means that our measures do not represent the effects of consumers switching from less to more sustainable options within an aisle. If households that switch to more sustainable aisles also choose relatively sustainable products within those aisles, the differences across demographic segments reported here are conservative. Analyses of two categories show no evidence of substitution to lower-impact foods (see footnote 5), but future research should analyze such substitution on a larger scale. Lastly, while this article focuses on consumer knowledge and sustainable food choices, we acknowledge that it is important to study the role of prices and retail assortment of plant-based alternatives. We leave this and other issues for future research.
Supplemental Material
sj-pdf-1-jmx-10.1177_00222429251348436 - Supplemental material for Closing the Knowledge Gap: Understanding and Reducing the Environmental impact of Food Choices
Supplemental material, sj-pdf-1-jmx-10.1177_00222429251348436 for Closing the Knowledge Gap: Understanding and Reducing the Environmental impact of Food Choices by Bart J. Bronnenberg, Trang Bùi, Barbara Deleersnyder, Lesley Haerkens, George Knox, Arjen van Lin, Max J. Pachali, Anna Paley, Robert W. Smith and Samuel Stäbler in Journal of Marketing
Footnotes
Acknowledgments
All authors contributed equally and are listed in alphabetical order. The authors thank AiMark and YouGov for access to the YouGov household panel data.
Coeditor
Pradeep Chintagunta
Associate Editor
Bryan Bollinger
Declaration of Conflicting Interests
The author(s) declared no potential conflicts of interest with respect to the research, authorship, and/or publication of this article.
Funding
The author(s) disclosed receipt of the following financial support for the research, authorship, and/or publication of this article: This work was supported by the Netherlands Organization for Scientific Research (grant number 406.21.EB.003).
ORCID iDs
Notes
References
Supplementary Material
Please find the following supplemental material available below.
For Open Access articles published under a Creative Commons License, all supplemental material carries the same license as the article it is associated with.
For non-Open Access articles published, all supplemental material carries a non-exclusive license, and permission requests for re-use of supplemental material or any part of supplemental material shall be sent directly to the copyright owner as specified in the copyright notice associated with the article.