
Abstract
For digital-native fast-moving consumer goods (FMCG) manufacturers that sell through their own online channel and have made headway into supermarkets, brand stores can represent the next step in a multichannel distribution strategy. In this research, the authors investigate the impact of introducing a brand store on a digital-native FMCG brand's sales in its existing company-owned online channel and in independent supermarkets, as well as on the brand's supermarket distribution. By incorporating brand store sales and operational costs, this research also specifies the entry effects on the brand's top-line total brand sales and bottom-line operating profit. Based on before-and-after-with-control-group analyses of the entry of ten brand stores by a digital-native FMCG brand, the authors show that brand store entry boosts supermarket sales, partially driven by a brand store's positive effect on the number of supermarkets listing the brand. Although they cannibalize company-owned online sales, brand store entries generate an influx of own brand store sales that offset online channel losses. Still, accounting for brand stores’ operational costs reveals that top-line growth is not always enough to preserve the bottom line.
Digital-native brands tend to leave their online-only origins once consumer demand is proven and seek more physical distribution channels to reach more consumers and boost sales revenue. This is especially true for digital-native fast-moving consumer goods (FMCG) brands, whose availability in conveniently located brick-and-mortar stores is particularly relevant given the entrenched practice of physical shopping for grocery products (Ailawadi and Farris 2020). Many digital-native FMCG brands therefore enter distribution agreements with independent retail channels (e.g., supermarkets) (Jiang et al. 2019). For example, digital-native personal-care brands Billie and Quip both now sell in Walmart stores (Monteros 2022). Such moves reflect the need of digital-native brands to expand their channel portfolio and increase physical access to their products.
A novel distribution channel for expanding physical presence involves brand stores. Brand stores are brick-and-mortar stores that are owned and operated by the manufacturer, carry only its brand, and are designed to sell the brand profitably in a brand-centric environment (Dolbec and Chebat 2013; Jahn et al. 2018). 1 Especially for digital-native brands that already sell through their own online channel and through independent supermarkets, brand stores represent a next step in their multichannel distribution strategy. In Germany, for example, digital-native food brands Nu3 and MyMuesli have opened such brand stores (Hell 2015).
Brand stores provide several interesting opportunities. Beyond enabling the brand to reach more potential consumers, they also offer physical exposure, which FMCG brands typically require but that digital-native brands might struggle to attain on supermarket shelves given the steep competition from mass-market brands. By spotlighting the brand, brand stores inform and remind consumers of the brand's existence and increase brand awareness. In turn, this can increase sales in the incumbent channels (i.e., the company-owned online channel and the independent supermarkets) (Dolbec and Chebat 2013; Jahn et al. 2018). Brand stores can also spark distributor interest and prompt supermarkets to distribute (more of) the brand on their shelves. Since the number of brand stores that a digital-native FMCG brand can open in the market is limited, such increases in distribution breadth and depth can be an important component to further drive brand sales. Certainly when the sales of the brand store itself are taken into account, a brand store thus has the potential to increase a brand's top-line sales.
Yet brand stores also entail risks. Sales in this novel channel may cannibalize sales in the incumbent channels if consumers migrate to the newly opened brand store. If brand stores signal the manufacturer's encroachment, they also could exacerbate channel conflict (Hibbard, Kumar, and Stern 2001) and prompt supermarkets to reduce their distribution of the brand. Finally, opening and operating brand stores is expensive, and these substantial operational costs put pressure on profits (Pauwels and Neslin 2015).
Despite these diverse potential outcomes, extant multichannel research related to brick-and-mortar store entry has mainly focused on the effects on other company-owned channels, such as a company's own online store or catalog (Avery et al. 2012; Bell, Gallino, and Moreno 2018, 2020; Pauwels and Neslin 2015; Wang and Goldfarb 2017). Such efforts have failed to consider the implications for independent channels (e.g., supermarkets) or brand distribution outcomes (Ailawadi 2021). To address this gap, we investigate the impact of brand store entry on the sales of the brand in its own online channel (hereinafter, “company-owned online channel”) and in the independent supermarket channel (hereinafter, “supermarket”). We also investigate brand store impact on supermarket distribution in terms of both how many supermarkets carry the brand in their assortment (distribution breadth) and how many stockkeeping units (SKUs) of the brand land on the supermarkets’ shelves (distribution depth). We furthermore assess the net impact of a brand store entry on both top-line (brand sales) and bottom-line (operating profit) performance.
Our empirical context features a digital-native FMCG brand that opened multiple brand stores in addition to its company-owned online channel and presence in supermarkets. Using before-and-after-with-control-group analyses, we find, on average, that the brand store entry cannibalizes the brand's company-owned online channel sales but has positive effects on its supermarket sales. The increase in supermarket sales is partially driven by greater distribution breadth for the brand, whereas we find no impact on distribution depth. A follow-up analysis reveals that the brand stores’ own sales compensate for lost sales in the company-owned online channel. However, when accounting for brand stores’ operational costs, top-line growth is not always enough to preserve the bottom line. This decomposition offers valuable insights to digital-native brand manufacturers that are considering opening a brand store.
In the next section, we review related literature to highlight our contributions. After we explain the decomposition framework used to establish the impact of brand store entry, we describe our research setting and the methodology. We then present the results for our empirical case. Finally, we discuss the findings, managerial implications, and directions for future research.
Literature Review and Contributions
In Table 1, we list relevant literature to establish our contributions to research pertaining to brick-and-mortar store entry and manufacturer-owned brick-and-mortar stores.
Relevant Empirical Literature on Brick-and-Mortar Stores.

Study used retail purchase intention (instead of retail sales) as a measure of impact on independent channels.
Notes: WOM = word of mouth.
Literature on brick-and-mortar store entry, so far, has been constrained to investigating the entry effect on the sales of other channels owned by the same company, including the online or catalog channel (Avery et al. 2012; Bell, Gallino, and Moreno 2018, 2020; Pauwels and Neslin 2015; Wang and Goldfarb 2017). Avery et al. (2012) argue that the impact of a brick-and-mortar store entry on other company-owned channels depends on whether the capabilities of the new channel substitute for or complement those of the incumbent(s). These new capabilities can be immediately apparent or learned through experience. Their findings show that brick-and-mortar stores cannibalize a brand's catalog sales in the short run, but increase its catalog and online sales in the long run. Pauwels and Neslin (2015) decompose the sales impact of brick-and-mortar store entry on company-owned channels further into order frequency, order size, returns, and exchanges. Their findings show that only the catalog channel is cannibalized through a decrease in order frequency, leaving the online channel intact. Wang and Goldfarb (2017) attribute the positive impact they find on the company-owned online channel to channel complementarity, which arises because the brick-and-mortar store advertises the brand's existence. Still, they caution that company-owned online channel sales decrease in areas that already had a brand presence prior to the brick-and-mortar store entry. Bell, Gallino, and Moreno (2018, 2020) focus on brick-and-mortar showrooms that fulfill no sales on their own. These are fully complementary with the company-owned online channel, which can increase sales and provide operational benefits, such as fewer returns.
These findings are insightful, but they fail to address at least three important factors that we aim to investigate here. First, prior work has studied effects solely on incumbent company-owned channels, when online-only (and/or catalog-only) firms open physical stores. Our study of brand store entry instead considers the potential impacts on both the incumbent channel that the manufacturer owns (the company-owned online channel) and the nonowned, independent channels run by its retail partners (the supermarket). By investigating both effects, we can assess not only how brand store entry leads to specific outcomes, but also how its impact varies across these channels. Furthermore, since we also investigate effects on supermarkets, we can zoom in on the effects pertaining to a brand's supermarket distribution breadth and depth. Such novel insights are absent from studies that maintain an exclusive focus on company-owned channels.
Second, the impact of brick-and-mortar store entry in prior research was largely driven by the fact that the new entrant and the incumbent store strongly differed on their channel characteristics (e.g., physical vs. nonphysical features). Brand store entry in a multichannel context may not create such a clear difference. Consumers already have access to brick-and-mortar stores (i.e., supermarkets) and a company-owned store (i.e., the company’s own online channel), so the implications of a new company-owned brick-and-mortar brand store are not as obvious. Brand stores have unique features (e.g., combining the immediacy of a brick-and-mortar store with the brand centricity of a company-owned store), but prior literature has not compared brand stores with the features provided by supermarkets or the company-owned online channel.
Third, prior studies of brick-and-mortar store entry involve settings that require consumers to interact with salespeople; touch, feel, or try on products; and receive advice about what to buy, such as accessories, apparel, durables, home furnishings, and optical care (Avery et al. 2012; Bell, Gallino, and Moreno 2018, 2020; Pauwels and Neslin 2015; Wang and Goldfarb 2017). We investigate brand store entry in a grocery setting, where consumers generally exhibit low levels of involvement, make habitual purchases that do not require much additional prepurchase information search, and use simplifying choice heuristics and decision cues (Hoyer, MacInnis, and Pieters 2013). Thus, the benefits attained through physical store features in the shopping contexts under prior investigation may not necessarily apply in the grocery sector.
The impact of manufacturer-owned brick-and-mortar stores on independent channels has received some limited attention in prior literature considering attitudinal measures only. For example, Jahn et al. (2018) and Nierobisch et al. (2017) survey consumers in experimental and field settings, asking about the impact of experiencing a manufacturer-owned brick-and-mortar store on their future purchase intentions in supermarkets. They find the brand-centric features of a manufacturer-owned brick-and-mortar store to be key tools for brand-building, with potentially positive cross-channel effects when evoking sufficient brand attachment or equity. Such findings resonate with prior evidence that manufacturer-owned stores exert positive impacts on attitudinal measures such as brand equity, brand attachment, and word of mouth (e.g., Dolbec and Chebat 2013; Klein et al. 2016). We seek to build on these perceptual insights by using unique sales data and adopting a more explicit focus on the sales effects of a manufacturer-owned brand store entry, which likely is more disruptive than, say, single-visit experiences in established brand stores. Prior literature also has neglected distribution, top-line, and bottom-line effects, probably for lack of data.
A Decomposition Framework of the Impact of Brand Store Entry
The decomposition framework that we propose establishes the various positive and negative ways a brand store entry may impact a digital-native FMCG brand's total brand sales and operating profit, as Figure 1 depicts. The brand store, which represents the new company-owned brick-and-mortar channel, generates brand store sales but comes with operational costs related to staffing, rent, and so forth. 2 Augmenting or detracting from this deterministic impact is the brand store's probabilistic impact on the incumbent channels (the company-owned online channel and the supermarket). Due to different features and capabilities, we anticipate direct but distinct effects of brand store entry on sales in both incumbent channels. The effects of brand store entry on the supermarket are furthermore partially driven by how the brand store entry affects the brand's supermarket distribution. We distinguish between distribution breadth, measured as the number of supermarkets carrying the brand, and distribution depth, measured as the number of brand SKUs appearing on supermarket shelves. Finally, we compare the impact of the brand store entry on the brand's sales in the incumbent channels with the sales and operational costs of the brand store itself to determine the net effect of brand store entry on both the (top-line) total brand sales and (bottom-line) operating profit. We next elaborate on all of these possible effects.

Decomposition Framework for the Effects of Brand Store Entry.
Effect on Sales in Incumbent Channels
Overall, the brand store effect on incumbent channels stems from the physical access and brand-building opportunities that the brand store entails, which helps more consumers take notice of and interact with the brand (Jahn et al. 2018). Serving as an operational billboard, the brand store informs and reminds the market of the brand; its physical presence stands out, which should increase brand awareness and equity (Dolbec and Chebat 2013). On the one hand, this increased brand salience may remind existing consumers to buy the brand in incumbent channels (Jahn et al. 2018; Kwon and Lennon 2009), as well as attract new customers, whose interest could spill over to incumbent channels. On the other hand, brand stores may draw their sales from the same pool of consumers who are already buying in incumbent channels. In this sense, brand stores may cannibalize sales in incumbent channels (Shriver and Bollinger 2022; Wang and Goldfarb 2017). The dominant effect then should depend on each incumbent channel's capabilities and their relation to the brand store's own capabilities. In the following sections, we elaborate on the possible effects of brand store entry on sales in incumbent channels. We refrain from determining which effect dominates, which we leave to the empirics.
Effect on company-owned online channel sales
Compared with brand stores, the company-owned online channel has distinct features, such as a fuller brand assortment, without any physical space constraints, along with easy browsing and search options (Pauwels and Neslin 2015). Shoppers can visit the company-owned online channel irrespective of time or location (Alba et al. 1997; Pitt, Berthon, and Berthon 1999), and in many cases, manufacturers encourage customers to create and order customized products in their own online channels (Kozinets et al. 2002). Such benefits could make the company-owned online channel attractive for customers and may trigger consumers to visit it (more) after being exposed to the brand through the brand store.
However, while similarly devoted to one brand, brand stores provide a richer, more pleasurable shopping experience compared with the company-owned online channel (Dolbec and Chebat 2013), during which customers can interact with expert, brand-affiliated personnel. Furthermore, consumers can receive their products instantly, without having to wait for delivery or pay for shipping and handling (Avery et al. 2012). These brand store capabilities may appeal to existing customers who already shop in the company-owned online channel (Shriver and Bollinger 2022). This implies a risk of cannibalization from consumers who seek the immediacy that physical channels provide, but that only the brand store can offer without compromising on the assortment depth, expertise, or engagement that comes with brand stores’ brand centricity.
Effect on supermarket sales
Supermarkets offer appealing features compared with brand stores, particularly regarding convenience, ease of one-stop shopping, and attractive pricing. That is, supermarkets carry multiple categories, each represented by various brands, which supports comparison and choice options (Alba et al. 1997). Furthermore, supermarkets typically charge lower prices for the same product or offer more promotions, compared with company-owned channels that typically avoid devaluing their own brand (Gielens and Steenkamp 2019; Wang, Bell, and Padmanabhan 2009). Supermarket consumers, seeking convenience, ease of one-stop shopping, and attractive prices (Messinger and Narasimhan 1997), thus might respond to the brand exposure and salience triggered by a brand store entry, by seeking out and purchasing the brand more readily on their next supermarket shopping trip (Jahn et al. 2018), whereas otherwise, the brand would have remained just another option among the mass-market brands on supermarket shelves.
However, with their singular focus on one brand, brand stores provide a deeper assortment of that brand's products, whereas supermarkets typically only offer a subset (Rodríguez and Aydin 2015). The brand store's brand-affiliated personnel also can share unique expertise and offer dedicated customer service, such as product trial and sampling opportunities, in contrast to the all-purpose sales support found in supermarkets (Dolbec and Chebat 2013). These brand store features may draw consumers away from the supermarket, suggesting a risk of cannibalization from consumers who seek the assortment depth and brand-centricity that company-owned channels provide, but that only the brand store can offer without compromising on immediacy.
Effect on Supermarket Distribution
Due to brand and product proliferation, as well as private label growth, shelf space in supermarkets constitutes a scarce resource (Sudhir and Rao 2006). Supermarkets seek to optimize their brand and product assortment, and brand manufacturers are at the mercy of these optimization strategies (Gölgeci, Malagueno, and Fearne 2021). Brand store entry may influence these distribution decisions. Because brand stores spotlight the manufacturer's brand, they inform and remind supermarket managers of its existence and patronage. Such brand exposure could increase supermarket interest and encourage them to distribute the brand in their stores, such that they might increase both the brand's distribution breadth by listing the brand and its distribution depth by expanding the brand's presence on their shelves.
Yet supermarket supply chains are also inherently contested spaces, and a new brand store represents a kind of warning shot that signals the next step in brand manufacturers’ disintermediation strategies. Online competition from brand manufacturers has evolved into an expected nuisance for supermarkets (Amrouche and Yan 2012), but competition through a brand’s own physical store is relatively new and may create a channel conflict (Tahirov and Glock 2022). In particular, brand stores’ dedicated profit-centric nature may cause supermarkets to disengage from the relationship (Hibbard, Kumar, and Stern 2001). In turn, they might also decide to delist the brand or shrink the assortment to oppose the brand that encroaches on their terrain or to anticipate lost sales. Studies of online encroachment predict such reactions (e.g., Kumar and Ruan 2006; Pötzl 2000; Rodríguez and Aydin 2015), which may arise in brick-and-mortar settings too. These distribution effects, positive or negative, may indirectly affect supermarket sales, beyond the direct sales effect.
Net Effect
The combined impact of brand stores’ direct and indirect (via supermarket distribution) effects on the sales of the brand in the incumbent channels can augment or detract from the brand stores’ own sales. That brand stores generate sales is obvious. Their strong local visibility and reach, typical locations in attractive streets with high foot traffic (Wang, Bell, and Padmanabhan 2009), and appeal to customers who lack opportunities or incentives to order online or visit supermarkets (e.g., tourists, business travelers, consumers unfamiliar with the brand) increase the odds of consumers entering these stores. Furthermore, their sales-centric approach and lack of competing brands also suggest a heightened chance that brand store visitors actually buy the brand.
Still, opening and running brand stores is a capital-intensive operation (Pauwels and Neslin 2015), especially for manufacturers that might not yet have gained extensive expertise with physical retail channels. Although gross margins (i.e., the price that consumers pay minus the cost of goods sold) are higher in company-owned channels than in the supermarket channel, the store rental cost, sales staff wages, and potential cannibalization of sales in incumbent channels represent additional cost factors that need to be taken into account when considering the brand store's impact on the brand's bottom line. Whether brand stores can enhance both top-line brand sales and bottom-line operating profit thus depends on how their sales and operational costs measure up against their impacts on incumbent channels.
Data and Methodology
Research Setting
We investigate the outcomes of our decomposition framework in the context of a well-known (top-ten), digital-native German national brand manufacturer of breakfast cereals. The brand initially launched as an online-only brand and then quickly started to expand into supermarkets within its first three years. Therefore, well before it opened any brand stores, this manufacturer sold its products both directly, through its own online channel, and indirectly, through a retailer network of supermarkets. In the company-owned online channel, consumers may purchase prepacked cereals or mix ingredients to order their own custom-made cereal. In the more than 5,000 supermarkets where the brand is listed, only a selection of prepacked boxes is offered (all of which are available in the company-owned online channel too).
During the observation window, January 2014–December 2016, the manufacturer opened ten physical brand stores in ten major cities throughout Germany, all of which already were being served by the company-owned online channel and independent supermarkets. None of these cities had an existing company-owned brick-and-mortar store of the focal brand. Through personal interviews with the brand manager, we affirmed that the brand stores’ primary goal was to be stand-alone profit centers; secondary goals included the acquisition of additional online direct channel sales, creation of brand awareness, and the ability to provide product sampling opportunities to consumers in a cost-efficient way. The manufacturer did not consciously aim to increase its bargaining power relative to supermarkets via the opening of the brand stores. The interviewed manager also confirmed that they were not aware of price or promotional changes made by the supermarkets at the time of the brand store entries, nor did they implement any such changes in their company-owned online channel. All brand stores offer brand-centric environments, supported by brand-affiliated personnel, where consumers can purchase prepacked cereals (similar to offerings at the supermarket, but with a deeper assortment) and some location-specific products that cite local landmarks (all of which are also available in the company-owned online channel).
Data
To investigate the impact of brand store entry on sales in the company-owned online channel and in supermarkets from customers living in the trading area of the brand store, we set a five-kilometer driving time radius, starting from the location of each brand store. This distance is not uncommon in FMCG literature (e.g., Ellickson and Grieco 2013; Singh, Hansen, and Blattberg 2006), especially for studies that analyze data from Europe (e.g., Haans and Gijsbrechts 2011; Van Lin and Gijsbrechts 2014; Vroegrijk, Gijsbrechts, and Campo 2013), where the majority of customers live within this radius of stores they patronize. This radius was also confirmed in our empirical setting; five kilometers is the median distance that consumers drive to pick up their online orders. 3 Still, we recognize our study's limitation that online customers and supermarkets beyond five kilometers could also be affected. Our findings are thus conservative. Table 2 lists the demographic, retail, and brand store characteristics for the ten brand stores and the trading areas surrounding these brand stores (hereinafter, “treated trading areas”).
Demographic and Retail Characteristics of the Treated Trading Areas and Brand Store Characteristics.
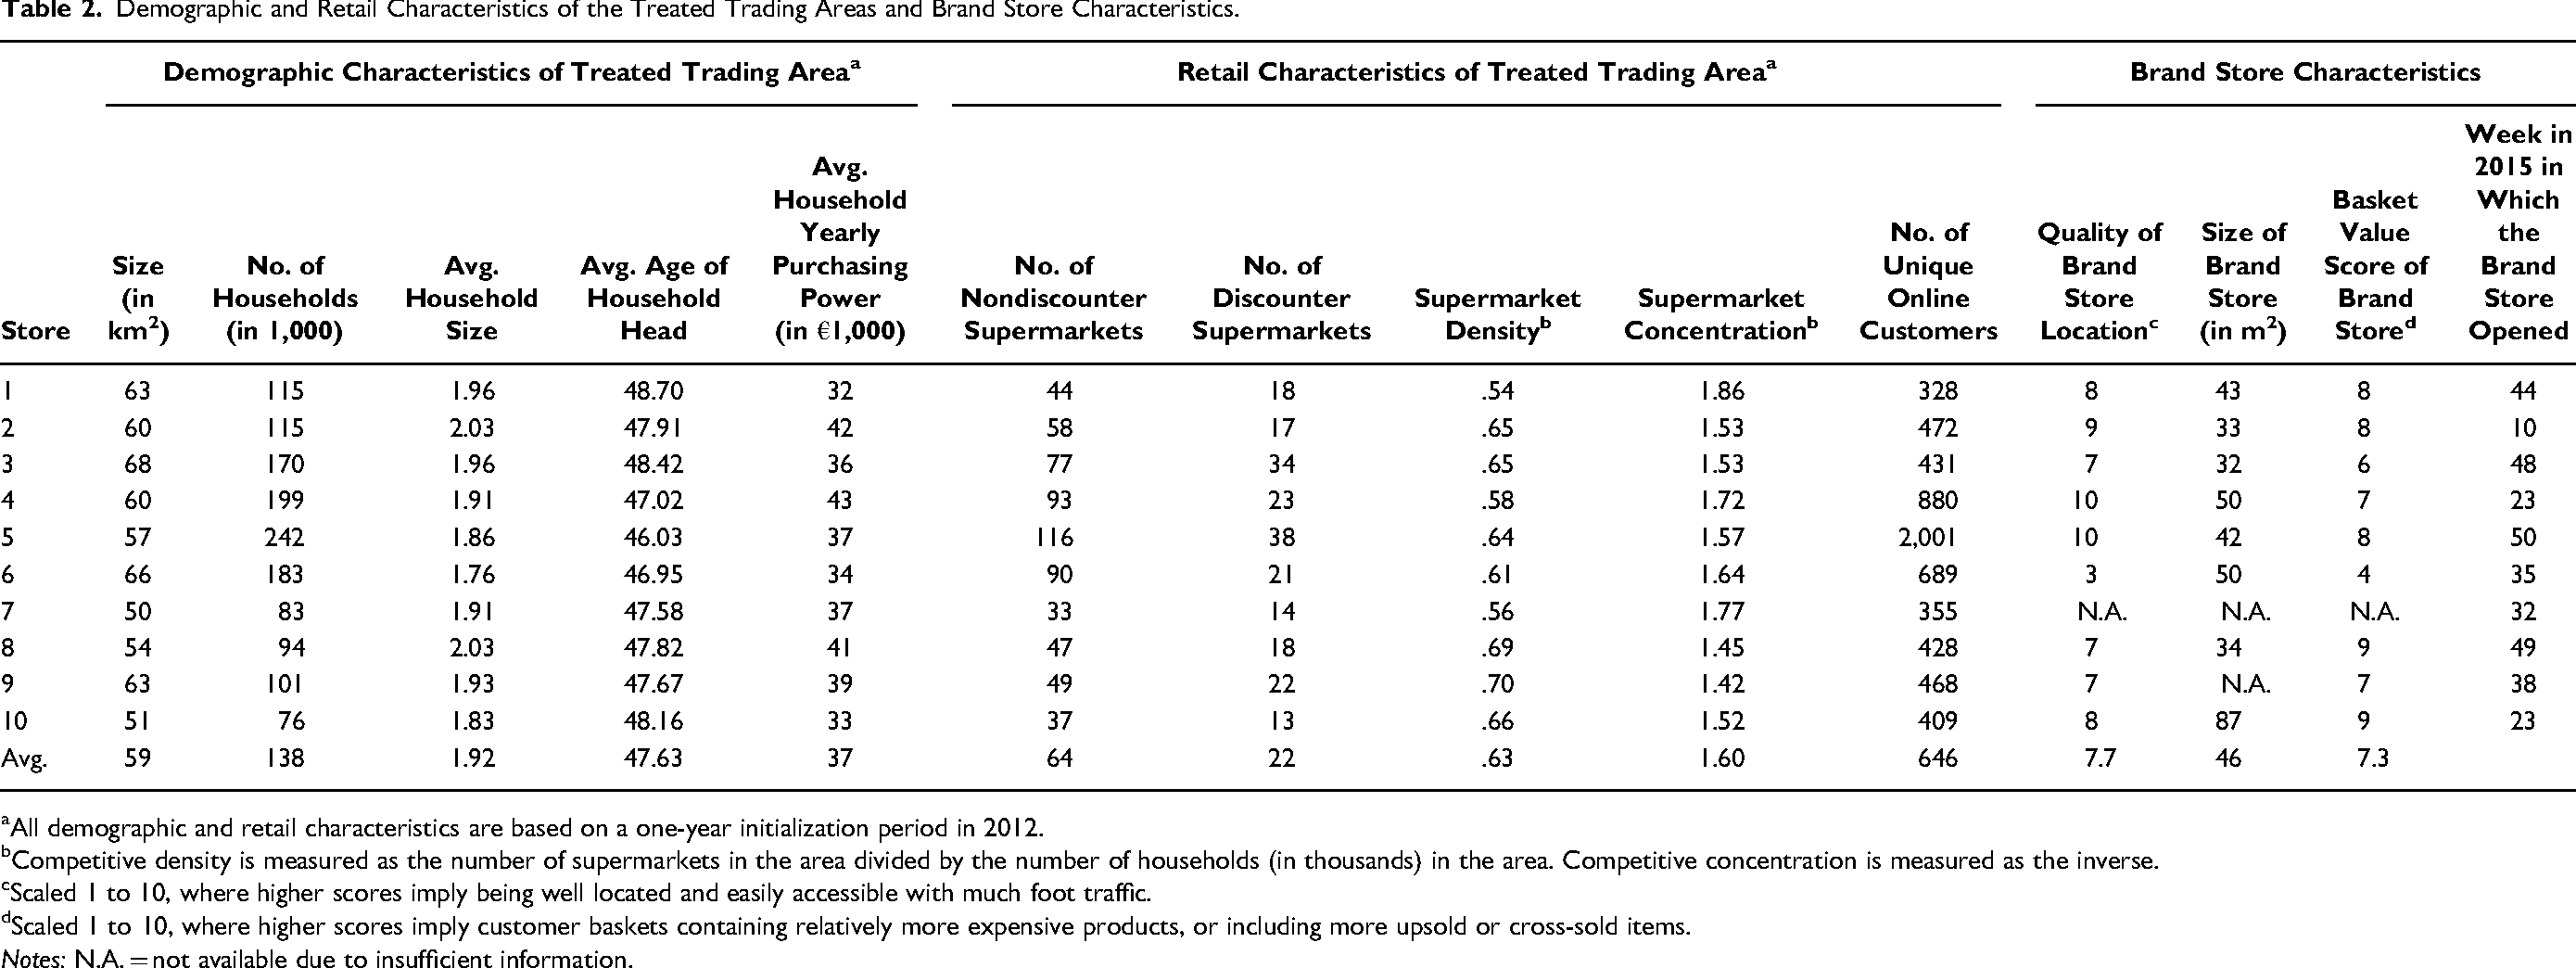
All demographic and retail characteristics are based on a one-year initialization period in 2012.
Competitive density is measured as the number of supermarkets in the area divided by the number of households (in thousands) in the area. Competitive concentration is measured as the inverse.
Scaled 1 to 10, where higher scores imply being well located and easily accessible with much foot traffic.
Scaled 1 to 10, where higher scores imply customer baskets containing relatively more expensive products, or including more upsold or cross-sold items.
Notes: N.A. = not available due to insufficient information.
From the manufacturer, we obtained a data set of purchases by online customers through the company-owned online channel between January 2011–December 2017, including information about where the customers are located, the euro value of their purchases, and additional metadata. We aggregated these data over time and location to obtain the weekly company-owned online channel sales per treated trading area. Information Resources Inc. (IRI) provided the weekly aggregated supermarket (euro) sales of the focal brand, the weekly number of supermarkets carrying the focal brand, and the weekly average number of SKUs of the focal brand available in each supermarket, for each treated trading area during our observation window. We aggregate the latter two distribution measures to monthly (four-week) averages to try to ensure that variation is driven by actual distribution changes and not just by weeks with zero sales of some SKUs. 4
In turn, we have four distinct outcome measures as dependent variables: (1) weekly (euro) company-owned online channel sales value of the focal brand in the treated trading area, (2) weekly supermarket (euro) sales value of the focal brand in the treated trading area, (3) monthly number of supermarkets that carry the focal brand in the assortment in the treated trading area, and (4) average monthly number of SKUs of the focal brand offered across the supermarkets in the treated trading area. The first two variables capture the impact on sales in the incumbent channels; the latter two pertain to supermarket distribution. To report these outcome variables, we scaled each by an undisclosed factor (a for incumbent channel sales, b for supermarket breadth, and c for supermarket depth), to preserve confidentiality of the actual values.
We isolate the impact of the brand store entry by separating it from other effects that might have led to changes, using a before-and-after-with-control-group analysis (as detailed further in the “Method” section). Each treated trading area therefore must match with a control trading area, comparable to the treated trading area in all characteristics except for brand store entry. From IRI, we obtained weekly aggregated supermarket sales and distribution data for the focal brand during our observation window for a large sample of 88 trading areas in German cities or boroughs where no brand stores opened (hereinafter, “control trading areas”). In line with the approach for the treated trading area, we aggregated the distribution data into a monthly average per control trading area. We aggregated the manufacturer's online consumer sales data over time and location to obtain weekly company-owned online channel sales per control trading area. For the control trading areas, we determined a five-kilometer driving time radius, starting from the middle point of the city or borough center. According to our personal interviews with the manufacturer's management, this point offers the best approximation of where a brand store would have been located if one existed in the control trading area. We checked all control trading areas for confounding events or missing data and removed any that raised any issues. 5
Table 3 presents descriptive statistics for the treated and control trading areas (see Tables WA.1 and WA.2 in Web Appendix A for an overview per treated trading area). For the average week in the average treated trading area, the percentage of sales from the company-owned online channel after the brand store entry dropped from 65% to 59%; it increased from 35% to 41% for the supermarket channel. In the average control trading area, that percentage split remained much more stable: 76% before versus 78% after brand store entry for the company-owned online channel, and 24% before versus 22% after for supermarkets. These percentage splits illustrate the brand's online beginnings and meaningful supermarket presence. In terms of supermarket distribution, in the average treated trading area in an average month, the distribution breadth changed from 20 to 27 stores after brand store entry (or, expressed as the percentage of the total number of supermarkets available in a trading area, from 24% to 34%), and distribution depth changed from 31 SKUs to 28 SKUs. In the average control trading area, the brand's distribution breadth changed from 12 to 14 stores (or from 24% to 28%), while its distribution depth stood at 27 SKUs before and 27 SKUs after brand store entry. These statistics provide model-free evidence of the impact of brand store entry on company-owned online channel sales (decreased), supermarket sales (increased), and supermarket distribution breadth (increased) and depth (decreased), ahead of our formal estimation. We subsequently discuss the estimation model and implications of the observed magnitude differences between the treated and control trading areas.
Comparison of Treated and Control Trading Areas.
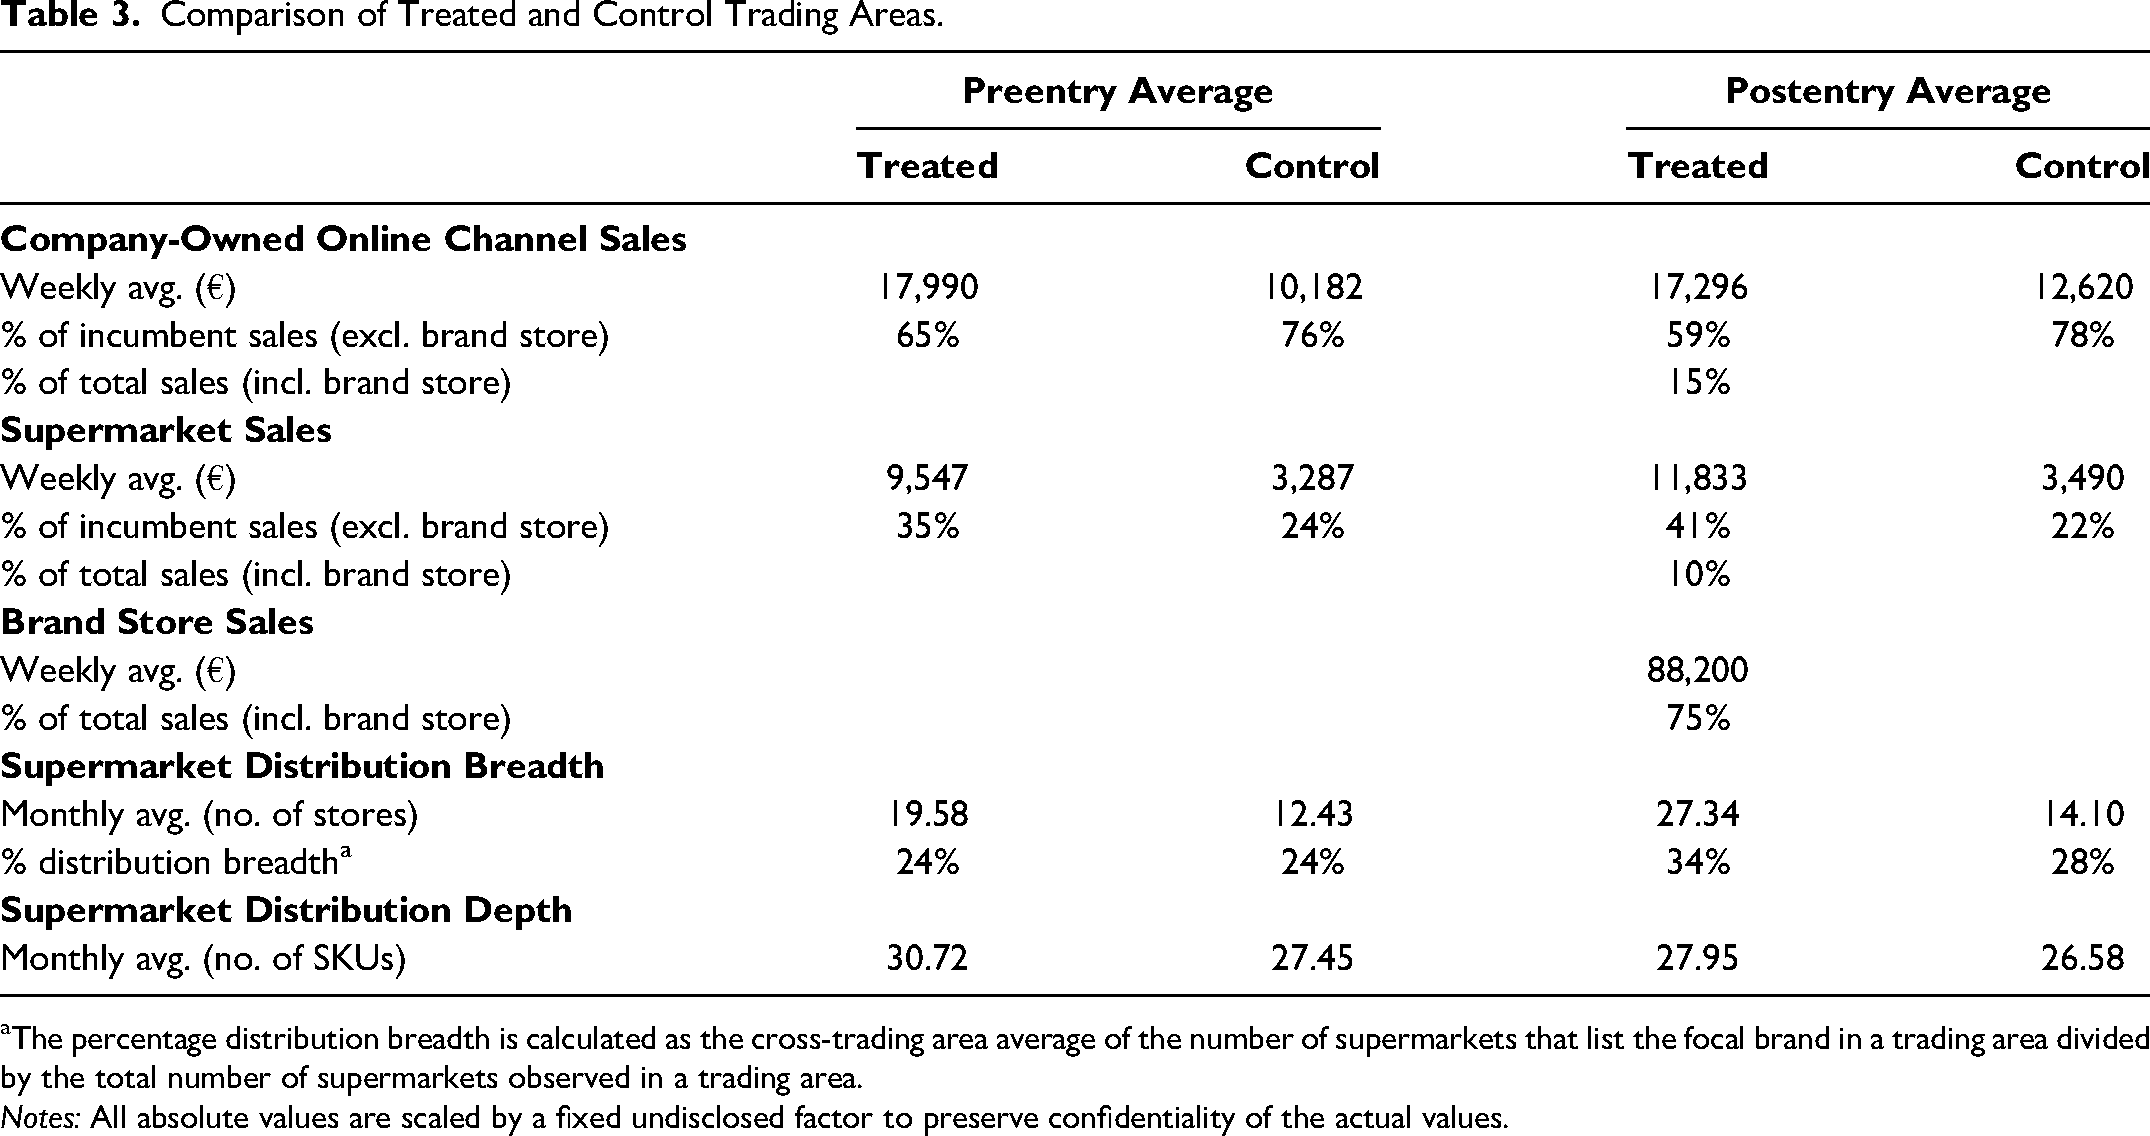
The percentage distribution breadth is calculated as the cross-trading area average of the number of supermarkets that list the focal brand in a trading area divided by the total number of supermarkets observed in a trading area.
Notes: All absolute values are scaled by a fixed undisclosed factor to preserve confidentiality of the actual values.
Method
Total effect of brand store entry
To isolate the effect of brand store entry on the four outcome measures in the treated trading area around the brand store, we used trading areas without brand stores as the pool of potential controls. The manufacturer had already opened brand stores in big shopping areas in major German cities. 6 Therefore, the population from which we can sample control trading areas consists of either same-city areas with less commercial activity or shopping areas in dissimilar, less urban cities, as alluded to in the descriptive statistics (Table 3). Noting the challenge of finding a single, unexposed control trading area that matches the characteristics of the treated trading areas, we adopt the synthetic control method.
The rationale behind the synthetic control method is that “a combination of unaffected units often provides a more appropriate comparison than any single unaffected unit alone” (Abadie 2021, p. 393). Therefore, rather than selecting a single control trading area as the optimal solution, we construct a synthetic match as a weighted combination, inferred from multiple control trading areas, such that the synthetic match closely resembles the treated trading area in terms of the pretreatment outcome. In our study, these synthetic controls represent hypothetical outcome measures in the treated trading area if no brand store had entered. By comparing these counterfactual outcomes with the actual observed outcomes in the treated trading area, we obtain an estimate of the treatment effect of brand store entry.
As outlined by Abadie (2021) and Abadie, Diamond, and Hainmueller (2015), a suitable donor pool of control trading areas for estimating the synthetic controls consists of (1) structurally similar trading areas (2) that are not exposed to the intervention, (3) that do not experience other isolated events, and (4) that provide a sufficient number of pretreatment and posttreatment observations of the outcome measures. Our donor pool of control trading areas is suitable in that it (1) came from the same country, was vetted to identify any (2) disrupting interventions or (3) other disrupting events, and was (4) limited to areas with no missing data in the pretreatment and posttreatment periods.
Because our analysis involves applying synthetic control to multiple treated units, we use the generalized synthetic control (GSC) method (Xu 2017) that can simultaneously estimate the brand store entry effect across all treated trading areas. We run the GSC method four times, once for each outcome measure. GSC starts by factorizing the complete sequence of the outcome variable in the control trading areas; that is, it decomposes the outcome variable into a common set of unobserved factors of length t. Next, given the plausible assumption that the same set of factors influences outcomes in the treated trading areas (to different degrees, through different linear combinations), GSC estimates factor loadings for each treated trading area from a linear projection of the preentry treated outcomes onto the space spanned by the factors. Finally, GSC predicts the synthetic outcome for each treated trading area for each period (week or month) in the postentry window, based on the factors estimated from the control trading areas and the factor loadings estimated from the preentry outcome of that treated trading area. These predicted values represent the counterfactual in each treated trading area per period, had there been no brand store entry. By comparing these counterfactual values with actual values observed in each treated trading area and period, we obtain an estimate of the individual treatment effect of brand store entry per period per treated trading area, which can be averaged to obtain an average treatment effect (ATE) per treated trading area and/or postentry period, as well as an overall ATE across all treated trading areas and the postentry window.
Formally, we specify the GSC model as follows:
The individual treatment effect δit of brand store entry for each treated trading area i in period t (where t ≥ T0) captures the difference between the observed outcome, Outcomeit(1), in each individual trading area i at period t when Treatmentit = 1 and the counterfactual synthetic outcome, Outcomeit(0), in each individual trading area i at period t when Treatmentit = 0. We use these individual treatment effects to obtain the ATE throughout the postentry window per treated trading area, for each postentry period across treated trading areas, and across the postentry window and treated trading areas. For more details about the estimation procedure, we refer readers to Web Appendix B and Xu (2017).
Indirect effect of brand store entry
To explore the indirect effects of brand store entry on supermarket sales through supermarket distribution, we estimate the following equations using ordinary least squares:


To calculate the indirect effect of brand store entry on supermarket sales through distribution breadth, we multiply the brand store entry coefficient β1 in Equation 3 by the distribution breadth coefficient α2 in Equation 2. Similarly, for the indirect effect of brand store entry on supermarket sales through the brand's distribution depth, we multiply the brand store entry coefficient γ1 in Equation 4 by the distribution depth coefficient α3 in Equation 2. The direct effect of brand store entry on supermarket sales is the brand store entry coefficient α1 in Equation 2, while the total effect is the sum of the direct and indirect effects. We consider the significance of the products (to get the indirect effects) and sum (to get the total effect) of these coefficients by generating an empirical sampling distribution of each (Preacher and Hayes 2004, 2008; Zhao, Lynch, and Chen 2010). Specifically, we draw from our sample with replacement to create a bootstrapped sample, and run the seemingly unrelated regression of Equations 2, 3, and 4 for each bootstrap sample, allowing estimation of the direct effect α1, the indirect effects via the products β1 × α2 and γ1 × α3, and the total effect via the sum α1 + β1 × α2 + γ1 × α3. After drawing 500 bootstrap samples and estimating the specified products and sum of coefficients for each bootstrap sample, we rely on the sample standard deviation and confidence intervals from the empirical distribution of the products and sum to establish their significance.
Results
To ensure the reliability of the ATE estimated by GSC, we first run the necessary diagnostic checks as recommended by Xu (2017) (see Web Appendix A for more details). For each treated trading area, we confirm that there is no significant difference between the treated and synthetic control trading areas’ preentry outcome values. The treated trading areas also fall within reasonable intervals of the donor pool of control trading areas in their pretreatment outcome values and estimated factor loadings. These diagnostics confirm that the imputed synthetic counterfactuals are produced by reliable interpolations, which also confirms the reliability of the GSC method to provide accurate predictions.
Figure 2 plots the outcome variables of interest, averaged across all treated trading areas (solid line) and their average synthetic counterfactuals (dotted line). We also include a plot of the average brand store sales across the treated trading areas for comparison. In the preentry window, the average values of the synthetic control trading areas closely follow the average values of the treated trading areas for all four outcome variables. After brand store entry, the average sales and distribution breadth patterns of the synthetic control trading areas start to diverge from those of the treated trading areas, revealing that the treated trading areas exhibit weaker effects on company-owned online channel sales, stronger effects on supermarket sales and distribution breadth, and seemingly no effects on distribution depth.

Effect of Brand Store Entry on Sales in Incumbent Channels and Supermarket Distribution.
Table 4 lists the estimated ATE of brand store entry on the focal brand's company-owned online channel sales (Panel A), supermarket sales (Panel B), supermarket distribution breadth (Panel C), and supermarket distribution depth (Panel D), averaged across the postentry window for each treated trading area. We also report the overall ATE across all treated trading areas and the postentry window. For ease of comparison (and to factor in differences in sales magnitude across treated trading areas), we translate the absolute ATE into relative ATE (expressed in percentages), by dividing the absolute ATE by the postentry predicted synthetic control outcome (i.e., hypothetical outcome in the treated trading area if no brand store had entered). These percentages readily display how the brand store entry affected the outcome variables, irrespective of absolute sales or distribution levels in that trading area.
Effect of Brand Store Entry on Sales in Incumbent Channels and Supermarket Distribution.

*p < .10.
**p < .05.
***p < .01.
Notes: ATE = average treatment effect. All absolute values are scaled by a fixed undisclosed factor to preserve confidentiality of the actual values.
Effect on sales in incumbent channels
Regarding the impact of brand store entry on the company-owned online channel (Table 4, Panel A), on average, sales significantly decreased by 23.06% in the year after brand store entry, relative to what the channel would have sold in its absence (p < .01). All ten trading areas reveal statistically significant negative impacts of brand store entry. For the impact of brand store entry on sales of the supermarket channel (Table 4, Panel B), we find that, on average, sales of the focal brand significantly increased by 11.79% in the year after brand store entry compared with what the supermarkets would have sold if no brand store had been introduced (p < .01). This increase emerged in most trading areas (eight of ten), and three trading areas displayed significant increases.
In our research setting, we thus find that adding a brand store caused significant cannibalization of the company-owned online channel sales but significant positive spillovers for supermarket sales, on average. The aggregate increase in supermarket sales does not suffice to cover the online losses. A paired-sample t-test confirms that the difference between sales effects in the company-owned online channel and supermarket is significant (Δ = −34.95%; t = −25.40, p < .01). 9 Given our empirical context, these results fit the narrative of our framework. For digital-native brands with lower physical presence elsewhere, brand stores and the company-owned online channel overlap considerably, in terms of the assortment offered, brand centricity, and the product and category involvement of consumers. The resulting substitutability likely drives switching behavior between these channels. In contrast, in supermarkets, digital-native brands do not receive brand-specific attention and instead could be overshadowed by the presence of bigger brands. Our results suggest that brand stores can help remedy this risk and enhance supermarket sales, possibly due to increased brand awareness and equity. Another driver may be that they trigger supermarkets to list the brand (more), an issue we investigate next.
Effect on supermarket distribution
Regarding supermarket distribution breadth (Table 4, Panel C), on average, we find that brand store entry causes a significant increase of 17.41% (p < .05) in the number of supermarkets that carry the brand in the year after brand store entry, compared with how many would have carried it if no brand store had been introduced. Across the ten trading areas, we find increases in distribution breadth in six trading areas (two are significant), whereas four trading areas reveal decreased breadth, although none of these effects are significant. Turning to distribution depth (Table 4, Panel D), we find no clear pattern. Brand store entry causes distribution depth to decrease in half of the trading areas under study (only one is significant) and increase in the other half (again, only one is significant). On average, distribution depth does not appear to change significantly in the year after brand store entry (p = .657).
Thus, for our setting of a digital-native brand, expanded brand exposure from brand stores seems to drive distributor interest rather than generating frustration with the act of encroachment. With their online origins, digital-native brands typically achieve only low market penetration and might not have expansive supermarket sales force teams. Our results identify brand stores as a potential means to demonstrate consumer interest to supermarket partners, a positive outcome that the brand manufacturer that we study did not plan for strategically. Digital-native brands are established direct sellers already, so additional direct channels, including brand stores, may be less likely to prompt channel conflict. It is also interesting to note that the brand's distribution depth in supermarkets remained unaffected and that supermarkets in which the brand previously was not present started to carry it.
Indirect effect of supermarket distribution on supermarket sales
Table 5 decomposes the positive and significant total effect of brand store entry on supermarket sales into direct and indirect effects. Brand store entry has a positive and significant direct effect on supermarket sales (α1 = 888.68, p < .01). Thus, even if the brand's supermarket distribution remains constant after the brand store entry, supermarket sales increase significantly. Yet our results show that brand store entry causes an aggregate increase in the brand's distribution breadth, which has an additional positive and significant indirect effect on supermarket sales (β1 × α2 = 345.46, p < .01). In line with the nonsignificant impact of brand store entry on the brand's supermarket distribution depth, we do not find a significant indirect effect through distribution depth (γ1 × α3 = 14.23, p = .181). The combination of these direct and indirect effects culminates in a positive and significant total effect (α1 + β1 × α2 + γ1 × α3 = 1,248.37, p < .01), equal to the total brand store entry effect in Table 4, Panel B. In summary, the indirect effect of brand store entry on supermarket sales through supermarket distribution is clearly important to consider; supermarket distribution breadth accounted for 3.26% of the 11.96% increase in supermarket sales, or 27.67% of the total effect.
Decomposition of the Effect of Brand Store Entry on Supermarket Sales.

*p < .10.
**p < .05.
***p < .01.
Notes: Results are based on Equation 2 (n = 1,040, R2 = .170), Equation 3 (n = 1,040, R2 = .142) and Equation 4 (n = 1,040, R2 = .003). Standard errors are bootstrapped and based on 500 replications.
Robustness Checks
To substantiate the robustness of our key results, we ran two robustness checks. First, we compared the matching quality of the GSC and our key results with the findings of several alternative matching algorithms (nearest-neighbor, genetic, optimal, and traditional synthetic control method; see Web Appendix C). Matching quality is determined by the standardized mean difference (SMD) value of the outcome variables between the treated and control trading areas in the preentry period. The SMD indicates the percentage of standard deviation between the treatment value and control value. When the SMD is closer to 0, the match is better. Table 6 reports the SMDs for the GSC method and the alternative matching algorithms; GSC outperforms all of them. The SMDs are clearly lower than those of other matching algorithms and far below the standard cutoff of .25 (Ho et al. 2011) or even below the stringent cutoff of .10 (Austin 2011). Thus, GSC provides the best match between the treated and control trading areas across all outcome variables. Our results also remain substantially robust when we use other matching algorithms with an acceptable SMD.
Robustness Check on Alternative Matching Algorithms.

*p < .10.
**p < .05.
***p < .01.
Notes: All absolute values are scaled by a fixed undisclosed factor to preserve confidentiality.
Second, our model does not account for feedback loops, whereby the impact of brand store entry on supermarket distribution is influenced by changes in supermarket sales. Therefore, we reran our analyses with a much shorter 12-week (three-month) postentry window, in which feedback effects of the change in supermarket sales on supermarket distribution are unlikely to take place. This approach also enables us to assess the sensitivity of the results to the chosen one-year postentry window. The results for the total effects on all four outcome measures (Table 7) and the indirect effect of brand store entry on supermarket sales through the impact on supermarket distribution (Table 8) remain robust for the shorter estimation window.
Robustness Check with Shorter Estimation Window: Total Effects.

*p < .10.
**p < .05.
***p < .01.
Notes: All absolute values are scaled by a fixed undisclosed factor to preserve confidentiality of the actual values.
Robustness Check with Shorter Estimation Window: Indirect Effects.

*p < .10.
**p < .05.
***p < .01.
Notes: Standard errors are bootstrapped and based on 500 replications.
Heterogeneous Impact of Brand Store Entry
In the aggregate, the brand stores we investigate cannibalized the company-owned online channel sales but also created positive effects on supermarket sales, partially driven by the positive effect on the brand's distribution breadth. Yet we observe some notable variation in the magnitude, significance, and—to a lesser degree—sign of the brand store entry effects across different trading areas. To understand these differences, we conducted an exploratory analysis of characteristics associated with brand stores (e.g., the size of the brand store, the quality of its location) or their trading area (e.g., the number of households in the trading area, the number of supermarkets in the trading area) that may lead to lower or higher sales in incumbent channels or distribution breadth effects. 10 In addition to the demographic and retail characteristics of the trading area and the brand store characteristics that are reported in Table 2, we inspect associations with the preentry outcome measures (e.g., the preentry sales share of the incumbent channels, the preentry distribution breadth), which are reported in Tables WA.1 and WA.2 of Web Appendix A. We explore whether there is a pattern of association between these characteristics and the ATEs of brand store entry on the outcome measures. We note that our sample contains too few observations to test for significance and advise caution in drawing strong and statistical conclusions.
We compare trading areas with low versus high relative ATEs of brand store entry on sales in the incumbent channels (based on a median split; see Figures 3 and 4). Our exploratory endeavor revealed that brand store entries that cannibalize the sales in the company-owned online channel and supermarket more (or create less positive effects on sales in these incumbent channels) are associated with higher-rated store locations (on a scale from 1 to 10, where higher scores imply being well located and easily accessible, with a lot of foot traffic), trading areas with higher competitive density (operationalized as the number of supermarkets per household, so higher scores signal more fragmented competition), and trading areas with greater purchasing power (operationalized as the average household's disposable income available for retail purchases).

Exploratory Analysis of Low and High Brand Store Entry Impact on Company-Owned Online Channel Sales.

Exploratory Analysis of Low and High Brand Store Entry Impact on Supermarket Sales.
This evidence is consistent with the managerial and theoretical notion that foot traffic enhances brand store sales (Drèze and Hoch 1998; Pan and Zinkhan 2006), that competition and cannibalization increase in competitively dense and commercially appealing areas (Voss and Voss 2008), and that higher-income households better match the premium shopping experience of a brand store and patronize it more. In such settings, the brand store appears more attractive and performs better, which hurts the incumbent channels more (more negative effects on company-owned online channel sales and less positive effects on supermarket sales).
Similar observations emerge when we compare trading areas with low versus high relative ATEs of brand store entry on distribution breadth (based on a median split; see Figure 5). When impacts of brand store entry on distribution breadth are more positive, brand stores are associated with higher-rated store locations, trading areas with higher competitive density, and trading areas with higher purchasing power. As prior managerial and theoretical expectations would suggest, premium retail real estate catches the eyes of distributors more easily and increases the brand's equity. Supermarkets also are more likely to adopt new brands when they face more dense competition (Voss and Voss 2008), and supermarkets in high-income areas are more likely to offer premium products such as those that are sold in brand stores.

Exploratory Analysis of Low and High Brand Store Entry Impact on Distribution Breadth.
Figure 5 supports the notion that brand stores with greater sales potential (i.e., at quality locations where there is greater competitive density and purchasing power) tend to lead to higher increases in their trading area's supermarket distribution breadth. While increases in distribution breadth positively impact supermarket sales, Figure 4 shows that brand store locations with greater sales potential display lower increases in supermarket sales compared with brand stores at lower-rated locations. This suggests that there are likely two forces at work. On the one hand, brand store locations with greater sales potential draw the attention of supermarket managers (who are not yet listing the brand) more. On the other hand, brand store locations with greater sales potential also draw consumers to the brand store more, thereby not allowing supermarket sales to increase as much after brand store entry. Because this sales effect may be stronger than the distribution effect, characteristics that improve the effect on supermarket distribution breadth do not necessarily improve the effect on supermarket sales as well.
The preceding findings are supported by a noteworthy correlation we observe between an internal measure used by the brand manufacturer, that is, the basket value score, and the company-owned online channel sales and supermarket sales (negative correlation) and distribution breadth (positive correlation).11,12 The basket value score of customers in the brand store is a score from 1 to 10 that brand managers use to assess the composition of the items in customers’ brand store baskets compared with baskets collected at other brand stores in the same time period. A higher basket value score indicates that customers’ baskets in a particular brand store tend to contain relatively more expensive products or include more up- or cross-selling items. Our results suggest that brand stores that extract more sales from customers (stores that have higher basket value scores) compete more intensely with incumbent channels and better showcase the sales potential of the brand to supermarket partners. The basket value score is thus an interesting composite measure of other metrics that consumers and distributors pick up on and that signal the brand's sales potential. Given that it is known only to the brand manufacturer, it is a good internal proxy to use when assessing brand store entry effects on company-owned and independent channels. Our results, though exploratory, support the notion that brand stores with greater sales potential draw the attention of consumers and distributors more. With our limited number of observations though, these results should be interpreted with caution.
Top- and Bottom-Line Impact of Brand Store Entry
Even if brand store entry increases supermarket sales, the greater sales losses in the company-owned online channel still lead to an overall negative impact of brand store entry on incumbent channel sales. We therefore also study the sales and operational costs of the brand stores themselves to determine the net impact on top-line brand sales and bottom-line operating profit over the entire sales network.
Table 9 shows the net impact of brand store entry on top-line total brand sales, where we add brand store sales generated during the postentry observation window (one year after brand store entry) to the postentry sales of the incumbent company-owned online and supermarket channels (i.e., actual focal brand's total sales after entry), then divide this total by the postentry total synthetic sales of the incumbent channels (i.e., hypothetical sales if no brand store had entered). Ratios greater than 1 indicate that sales of the brand store more than compensate for the losses incurred in the incumbent channels. We determine that the presence of brand stores leads, on average, to higher sales across all channels in the five-kilometer trading area surrounding the store, by a factor of 4.09. In other words, if the brand had generated €100 previously, it would now earn €409 in the network that contains brand stores. In none of the trading areas we study did this ratio drop below 1, which would indicate a situation where the brand is worse off with brand stores, in terms of top-line total brand sales. Despite the overall drop in the incumbent channels’ sales induced by the brand store entry, sales in the brand store more than compensate for the sales losses in the company-owned online channel. Adding brand stores to the total network thus appears to be an effective measure to grow top-line brand sales, which we can attribute to the brand stores’ higher local visibility, expanded reach to new customers, and increased purchase probability.
Effect of Brand Store Entry on Top-Line Total Brand Sales.
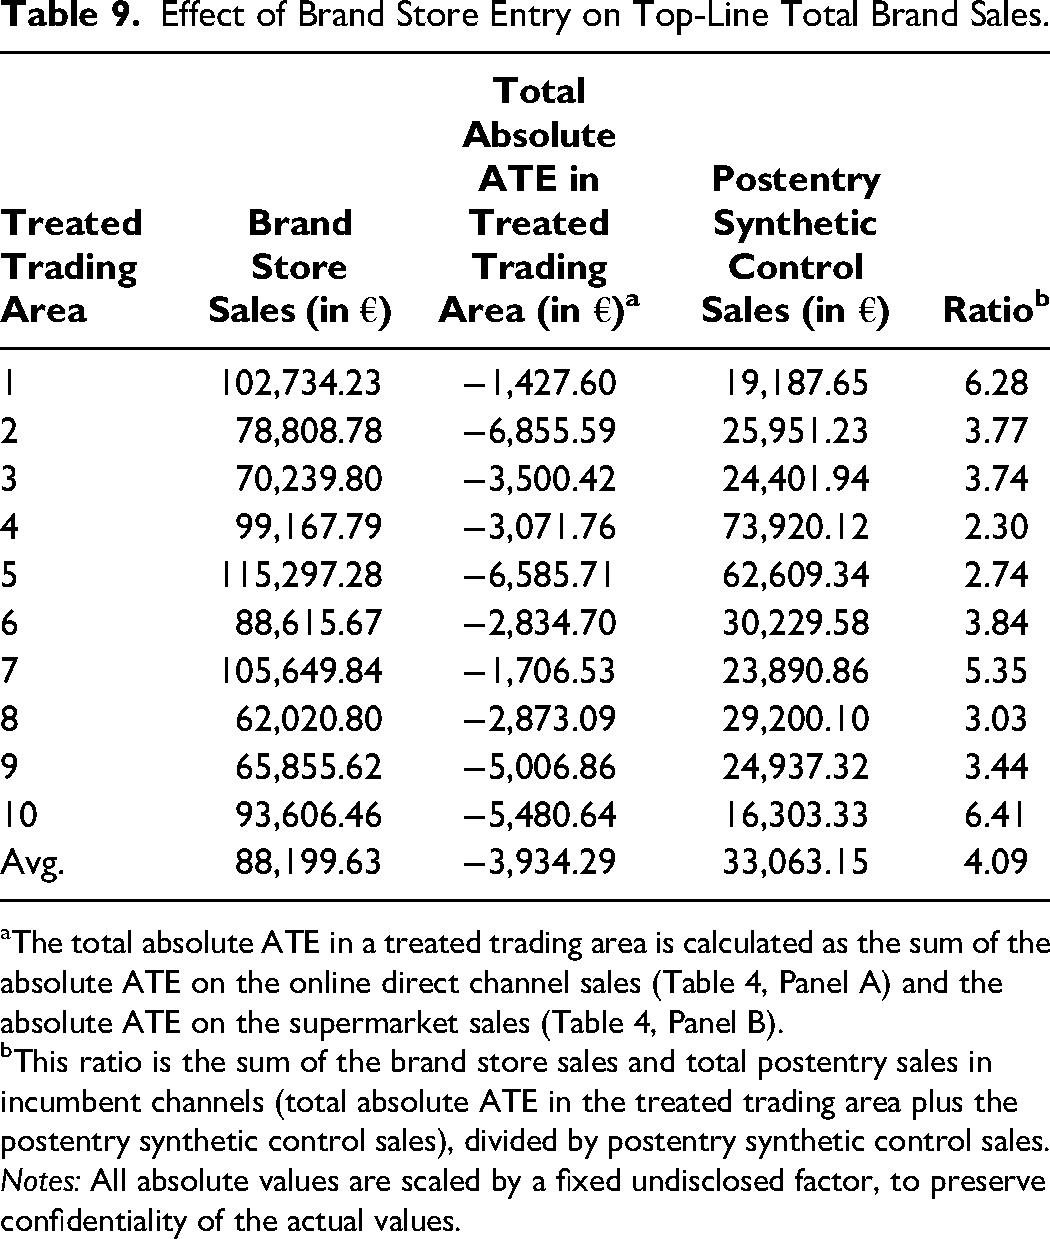
The total absolute ATE in a treated trading area is calculated as the sum of the absolute ATE on the online direct channel sales (Table 4, Panel A) and the absolute ATE on the supermarket sales (Table 4, Panel B).
This ratio is the sum of the brand store sales and total postentry sales in incumbent channels (total absolute ATE in the treated trading area plus the postentry synthetic control sales), divided by postentry synthetic control sales.
Notes: All absolute values are scaled by a fixed undisclosed factor, to preserve confidentiality of the actual values.
Still, the question remains whether brand store entry remains effective after accounting for the operational costs of opening and operating the brick-and-mortar stores (Pauwels and Neslin 2015), as well as the costly cannibalization of incumbent channels’ sales. For the brand store to have a positive impact on brand profits, its profit contributions must be greater than the change in the brand's profit in its incumbent channels. We define channel profit as the difference between the channel's sales revenue and its total fixed and variable costs (e.g., cost of goods sold, personnel, rent, advertising, transport). 13 To determine the minimum profit level needed to offset the change in incumbent channels’ profits, we first calculate the change in the brand's profits in its incumbent channels as the change in sales in the incumbent company-owned online channel and supermarket channel (Table 4), multiplied by profit margins of 30% and 20%, respectively, which represent reasonable margins to assume for a premium FMCG brand based on discussions with industry experts. Table 10 reports this change in incumbent profit as a percentage of the brand store's revenue for all treated trading areas.
Effect of Brand Store Entry on Bottom-Line Operating Profit.

Notes: All absolute values are scaled by a fixed undisclosed factor to preserve confidentiality of the actual values.
Due to the losses endured in the company-owned online channel, the brand store needs to reach, on average, a minimum operating profit margin of 1.55% to break even; for every €100 in sales in the brand store, €1.55 should be preserved to cover losses in incumbent channels’ profits. We compare this minimum profit margin with the actual brand store profit margins that the manufacturer reported in the calendar year following entry. Due to confidentiality agreements, we cannot reveal the true brand store profit (margin) and thus report only whether the actual brand store profit margin is above (+) or below (−) the calculated minimum. Among the ten brand stores, six reported a profit margin high enough to meet the minimum, but four brand stores ended up in the red. One of these brand stores reported a positive profit margin that it could not preserve after accounting for the negative change in incumbent channel profit.
Exploratory analyses and discussions with management suggest that the profitability of a brand store depends on its location (higher profits for better located stores that attract more foot traffic), size (more profits for stores with more square meters), and costs (more profits for stores with lower rent prices). These results reveal an important caveat to prior evidence related to the top-line growth that brand stores can achieve: Brand stores might enhance top-line total brand sales, but there is no guarantee that bottom-line operating profit will follow. Firms need to be aware of the hefty impact that comes with operating a brand store, especially given their potential to harm the profits of incumbent channels.
Conclusion
The deployment of brick-and-mortar stores has gained momentum among digital-native brands, and brand stores are a novel and interesting option in that regard. Especially for digital-native FMCG brands that maintain their initial company-owned online channel and have made headway into supermarkets, brand stores can help reach potential consumers and gain additional physical exposure that FMCG brands typically require.
This article offers the first investigation of the impact of opening brick-and-mortar brand stores by a digital-native brand manufacturer. So far, most research on brick-and-mortar stores of brand manufacturers deals with qualitative and perceptual outcomes, while the literature on brick-and-mortar store entry centers on investigating the effects of channel additions on company-owned channels only. We add to this research by investigating the various impacts of a brand store entry by a digital-native brand manufacturer on sales in the company-owned online channel and in supermarkets, as well as on supermarket distribution breadth (number of supermarkets listing the brand) and depth (number of SKUs offered on the shelves). We thus account for the indirect effect of changes in distribution on supermarket sales. Further, our inclusion of both the top-line total brand sales and bottom-line operating profit reflects prior acknowledgments that these insights represent “a crucial area for future research” (Pauwels and Neslin 2015, p. 195).
Discussion of Findings
We empirically investigate the case of a digital-native brand manufacturer that introduced ten brand stores in a setting where a company-owned online channel and supermarkets were already available to consumers. On average, we find that brand store entry cannibalizes company-owned online channel sales and enhances supermarket sales, partially driven by brand stores’ positive effect on the number of supermarkets that carry the brand (positive distribution breadth effect).
Our framework offers reasoning for these results: For digital-native brands, brand stores and the company-owned online channel overlap in their assortment, brand centricity, and customers’ product and category involvement. Thus, for consumers seeking a more elevated consumption experience, brand stores offer an interesting alternative, which causes cannibalization of the company-owned online channel. In supermarkets, instead, we find grocery store buyers, mainly concerned with price and convenience. For these consumers and the supermarkets where they shop, brand stores offer an opportunity to learn about a digital-native brand that otherwise would have remained anonymous among bigger mass-market brands, which causes supermarket sales and distribution breadth to increase. The results furthermore suggest that brand stores that are able to extract more sales from their clientele compete more strongly with incumbent channels, while also showcasing their sales potential more strongly in ways that incentivize supermarket partners to start carrying the brand (although we cannot draw causal relations with our limited sample of ten brand stores).
In a follow-up analysis, we show that brand stores increase the brand's top-line sales despite any lost sales in incumbent channels. For brands in startup or growth markets that want to draw investors’ attention, brand stores offer a ready way to improve their valuation, despite the cannibalizing impact on incumbent channels. Our finding that brand store entry enhances distribution breadth underscores the leverage that brand stores exert in terms of gaining other stakeholders’ interest. This finding is particularly remarkable, given that the brand manufacturer in our empirical case did not strategically target supermarkets to impact their distribution decisions and did not seek to increase its bargaining power by opening brand stores. However, explicitly doing so and actively reaching out to distributors may be strategically effective. In contrast, if profitability is valued over growth, even if brand stores prove successful and earn profits on their own, the total bottom line still may be negative when negative sales effects in the incumbent channels are taken into account.
The effects we observe are context-specific, but offer particular scientific merit and valuable insights for similar settings (for a justification of context-specific marketing studies, see Stremersch et al. [2023]). For digital-native FMCG brands whose supermarket distribution is established before the introduction of brand stores, and whose sales in the company-owned online channel clearly exceed sales in the supermarket channel, we postulate that the increased salience may alert supermarkets to carry the brand and make consumers more likely to seek and purchase the brand in their next supermarket shopping trip. Those consumers buying already via the company-owned online channel, in contrast, can now get products immediately at a brand store, without having to wait for delivery or pay for shipping and handling or without compromising on the assortment depth, expertise, or engagement that comes with the brand stores’ brand centricity.
These findings may not necessarily generalize to digital-native FMCG brands that already have a stronger and more established supermarket distribution that possibly outperforms the company-owned online channel. Still, we believe our framework proposed in the current research provides an interesting starting point when investigating brand store entry effects in such a setting. It depicts the various positive and negative ways in which the entry of a brand store may impact both company-owned online channel and supermarket sales as well as supermarket distribution of the brand. Applying this framework, we speculate that the brand stores’ exposure and salience effects would play less of a role when supermarket distribution is already well established. Although it remains to be investigated, this would imply that the risk of cannibalization of supermarket sales becomes more prominent and that the positive effects of informing and reminding consumers and supermarket managers about the brand's existence and patronage are likely to be smaller. Hence, this could deflate brand stores’ positive effect on incumbent channel sales and distribution. It could even increase the chances of a channel conflict.
Limitations and Directions for Further Research
Several limitations of our research suggest other research directions. First, similar to prior studies of channel additions (Avery et al. 2012; Biyalogorsky and Naik 2003; Pauwels and Neslin 2015; Wang and Goldfarb 2017), we focus on only one manufacturer in one category. Further research is needed to confirm whether our results generalize to other digital-native FMCG brands and categories. In addition, our framework applies to digital-native brands within a grocery setting. For the sake of greater external validity, future research should investigate brand store entry impact for traditional brand manufacturers and/or in nongrocery settings. Traditional brand manufacturers in FMCG, such as Estée Lauder and PepsiCo (despite the fact that they have added company-owned online channels to complement their supermarket distribution [Amrouche and Yan 2012]), engage with customers and supermarket partners that are much less familiar with them selling directly to consumers. This presents different circumstances that warrant future research. Future research also needs to investigate how findings transfer to brand store additions in nongrocery settings, such as apparel or consumer electronics, where consumers are much more likely to interact with salespeople; touch, feel, or try on products; and receive advice about what to buy. Furthermore, we focus on sales and distribution of brick-and-mortar supermarkets instead of online supermarkets, due to the low penetration of online supermarket sales in our observation window (Syndy 2015).
Second, we did not have access to detailed marketing-mix (e.g., price, promotion, advertising) or supply-side (e.g., wholesale prices, shelf space, promotional pass-through) metrics. Our collaborating company indicated no changes in these metrics in response to the brand store entry, but it would be interesting to investigate this in future research. Our inability to observe changes in any indirect costs caused by brand store entry (e.g., changes in trade promotions, sales force expenses, or online delivery costs) also limits our investigation to operating profit only. We also did not include attitudinal (e.g., brand equity, brand awareness) or shareholder (e.g., stock prices) measures that might reflect secondary objectives for brand stores, such as brand building or increased company valuation.
Third, we did not have access to consumer (panel) data for the supermarkets, nor did we know who bought (what and when) in the brand store. Such disaggregated data would enable investigation of how the impact of brand store entry on the incumbent channels differs across individual consumers, and whether and how consumers jointly patronize them over time. This would enable managers to develop consumer profiles for each of the brand's channels to improve consumer targeting and segmenting across these channels.
Fourth, we welcome future research that can operationalize supermarket distribution measures more precisely and at a higher frequency. More detailed distribution data would also enable researchers to estimate possible feedback loops between the sales and distribution of the different channels more accurately. Future research should also account for the potential endogeneity of distribution when the indirect effects of brand store entry are estimated.
Finally, we do not observe sales to consumers or distribution decisions by supermarkets beyond the five-kilometer radius. Because we focus on the area that is closest to the brand store and thus is likely to be impacted most, our results are a conservative estimate of brand store entry effects.
Supplemental Material
sj-pdf-1-jmx-10.1177_00222429231193371 - Supplemental material for Assessing the Multichannel Impact of Brand Store Entry by a Digital-Native Grocery Brand
Supplemental material, sj-pdf-1-jmx-10.1177_00222429231193371 for Assessing the Multichannel Impact of Brand Store Entry by a Digital-Native Grocery Brand by Michiel Van Crombrugge, Els Breugelmans, Florian Breiner and Christian W. Scheiner in Journal of Marketing
Footnotes
Associate Editor
Kusum Ailawadi
Declaration of Conflicting Interests
The authors declared no potential conflicts of interest with respect to the research, authorship, and/or publication of this article.
Funding
The authors disclosed receipt of the following financial support for the research, authorship, and/or publication of this article: This work was supported by the Fonds Wetenschappelijk Onderzoek (grant number G069617N).
1
This goal differs from that of flagship stores that aim to provide emotional brand experiences, typically without much regard for operational profitability (![]() ). In practice, the line between brand stores and flagship stores often blurs, but we focus on brand stores that have a clear profit-centric goal.
). In practice, the line between brand stores and flagship stores often blurs, but we focus on brand stores that have a clear profit-centric goal.
2
In this research, we focus on direct operational costs of the brand store and do not consider other indirect changes in costs caused by brand store entry (e.g., changes in trade promotions or online delivery costs).
3
The pickup option became available in each trading area at the moment the brand store opened. Previously, all online orders in the trading area were delivered to consumers’ homes.
4
A robustness check in which we calculate averages over a quarter-rolling window yields substantially robust results.
5
This step resulted in 88 control trading areas for the company-owned online channel sales and 59 for the supermarket outcome variables; 29 control trading areas were dropped because they had too many missing observations in the pretreatment period.
6
Outside our observation window, the manufacturer already had opened brand stores in 12 other cities between 2012 and 2014. These cities are not part of the donor pool of control trading areas. We also did not include in the donor pool any of the trading areas that were not yet treated.
7
To match the weekly periodicity of the sales variable with the monthly periodicity of the distribution variables, we assume that the values of distribution breadth and depth remain constant in each of the four weeks in a month. Our results are robust when we include sales measured at a monthly level of aggregation.
8
Because we use one year before and one year after each brand store entry, the step dummy variable equals 1 for each area i in the same t (after 52 weeks), even though the timing of the entry is specific to each area i.
9
In the paired-sample t-test, we compare the 52 postentry per-week relative ATEs (average across treated trading areas per week) between the company-owned online channel sales and supermarket sales. We investigate the difference in relative, rather than absolute, ATE to account for sales magnitude differences between the company-owned online channel and an average supermarket.
10
We exclude distribution depth because it does not have a significant effect, and the exploratory analyses do not indicate any notable variation in the ATEs on this measure for any of the considered characteristics.
11
The basket value score is primarily based on the average order value of a brand store. Due to confidentiality agreements, the manufacturer could not give us access to the detailed average order values.
12
With the limited number of observations, we are cautious about reporting correlations. However, the correlation between the average basket value score amounts to ρ = −.46 for company-owned online channel sales, ρ = −.52 for supermarket sales, and ρ = .52 for distribution breadth.
13
In Germany, this is known as Deckungsbeitrag II, which is closely related to operating profit.
References
Supplementary Material
Please find the following supplemental material available below.
For Open Access articles published under a Creative Commons License, all supplemental material carries the same license as the article it is associated with.
For non-Open Access articles published, all supplemental material carries a non-exclusive license, and permission requests for re-use of supplemental material or any part of supplemental material shall be sent directly to the copyright owner as specified in the copyright notice associated with the article.