
Abstract
What are the effects of a brand's owned social media? This meta-analysis examines the impact of owned social media on social media engagement and sales. Whereas the findings support some current beliefs (e.g., owned social media are more effective to boost sales for new [vs. mature] products), it highlights several novel insights. Contrary to popular beliefs that owned social media mainly drive engagement and hardly affect sales, the results show the opposite, with an average elasticity of .137 for social media engagement and .353 for sales. In addition, the results suggest ways to better adapt owned social media content to communication goals. To create engagement, content needs to focus on emotional needs and steer away from deals, which are the least effective content type. To stimulate sales, content should be more functional, rather than emotional, in nature and communicate product benefits. Surprisingly, the authors find that growing a large social media community is not essential for boosting sales, as owned social media are more effective for brands with fewer followers. Furthermore, while using one global social media strategy is tempting, owned social media are more effective in countries with high power distance, calling for a less uniform approach.
With more than three billion social media users worldwide, brands have long recognized social media’s ability to generate strong marketing outcomes, such as social media engagement and sales (Moorman 2018). Many brands have established an active social media presence that allows them to interact directly with their customers. This type of brand-controlled social media is commonly termed “owned social media” (Stephen and Galak 2012). Recent surveys indicate that social media marketing budgets will increase in the next three years (for 91% of firms) and that 62% of consumers believe that brands will succeed in the long run only if they have a strong social media presence (Sprout Social 2021). While brands are increasingly investing in owned social media, they may still question the overall return on their social media presence, as well as how they can design more effective owned social media campaigns along the purchase funnel (Appel et al. 2020). In this article, we address three major questions that social media marketers are facing: First, brands that share their content through social media channels expect this content to stimulate social media engagement (likes, comments, or shares; De Vries, Gensler, and Leeflang 2017). Yet are owned social media also able to affect sales, or do they affect only social media engagement?
Second, regardless of whether owned social media can significantly affect different brand metrics, such as engagement and sales, not all owned social media content is created equal: content that generates social media engagement may not necessarily lead to additional sales. While social media marketing courses tend to highlight the importance of using “social” content (e.g., “End your posts with a question,” “Make use of hashtags,” “Involve your customers in online competitions”) or relying on deals, generalizable knowledge on this topic is lacking. Can social content and deals engage customers more than other types of content? Are they also a more effective way to lift sales than other owned social media messages?
Finally, different types of brands likely need different types of strategies: what works for hedonic brands may not work for more functional brands, and what works for products may not apply to services. Managers changing industries or searching across industries for inspiration may want to know whether owned social media are equally effective across different settings, enabling them to build on their or other brands’ experience, or whether they must rethink the contribution of owned social media to their brand performance.
To address these questions, we conduct a meta-analysis on the large body of research on the effectiveness of owned social media to integrate studies’ findings and explain their differences along three dimensions: variation along owned social media content, context (brand, industry, platform, and country), and study characteristics (see Figure 1). In addition, we contribute to the literature in three ways. First, research on the effectiveness of owned social media provides divergent results. For example, whereas some studies suggest that owned social media have a positive effect on sales (e.g., Hewett et al. 2016), others do not find a significant impact (e.g., Stephen and Galak 2012) or observe a negative relationship (e.g., Goh, Heng, and Lin 2013), further contributing to managers’ uncertainty about the sales effectiveness of owned social media. Using meta-analytical techniques that enable us to generalize across a large variety of settings, we focus on elasticities to quantify the impact of owned social media volume (the number of posts) while also capturing the impact of different operationalizations of owned social media, such as valence (degree of positivity) and presence (vs. absence) of a brand social media post. We do so for two marketing outcomes: social media engagement and sales. Our findings are based on a meta-analysis on 1,641 elasticities across 86 studies spanning from 2011 to 2021 and covering 31 industries, 14 platforms, and 17 countries. Contrary to managerial beliefs that owned social media are primarily an engagement tool, we observe a stronger impact of owned social media on sales.

Conceptual Framework.
Second, to consolidate the literature, we examine how owned social media content and context characteristics moderate the impact of brands’ owned social media. Several studies have examined how owned social media content influences various performance measures (e.g., Akpinar and Berger 2017; De Vries, Gensler, and Leeflang 2012; Homburg, Ehm, and Artz 2015; Lee, Hosanagar, and Nair 2018; Meire et al. 2019), but systematic comparisons are lacking. Our results emphasize that different objectives (i.e., enhance social media engagement or lift sales) require different content (i.e., emotional content for social media engagement and informational content for sales). This study supports managers in making an informed decision on how to leverage owned social media by revealing not only which owned social media content is more effective but also which brand, platform, and country characteristics have stronger elasticities.
Third, our findings highlight study characteristics, such as the use of a lagged dependent variable in a model, that are linked to differential effectiveness of owned social media for social media engagement and for sales. This provides scholars with an overview of the consequences of their methodological choices. Finally, coding the available primary studies on the impact of owned social media on social media engagement and sales allow us to uncover important gaps in the literature.
Theoretical Background and Literature Review
Brands use owned social media to communicate with consumers. To better understand the effect of owned social media on marketing outcomes, we distinguish between the content used by brands (i.e., functional vs. hedonic content) and the context (i.e., brand characteristics, industry characteristics, platform characteristics, and country characteristics that may affect owned social media; see Figure 1). In this section, we conceptualize the effects of these dimensions on consumers’ engagement with the brand's own social media, as well as its downstream impact on sales.
Owned Social Media Outcomes
Owned social media may elicit a different response among consumers along the purchase funnel, resulting in a different effectiveness of owned social media on social media engagement and sales (e.g., Akpinar and Berger 2017; Van Doorn et al. 2010). To account for this, we distinguish between these two outcomes. 1
Social media engagement
To gauge the extent to which consumers are receptive to the content that a brand shares on social media, managers tend to keep track of the level of engagement their posts attain. Consumers can interact with these posts by “liking” or “favoriting” them, by commenting on them, or by sharing them with others. These behaviors, referred to as social media engagement (Muntinga, Moorman, and Smit 2011; Srinivasan, Rutz, and Pauwels 2016), constitute a desirable response to brand content, as they help the content spread or “cascade” to other consumers.
Sales
Ultimately, brand communication is intended to increase sales. Indeed, a large body of research indicates that brands’ social media has a positive impact on sales (e.g., Hewett et al. 2016; Mochon et al. 2017) by, for example, enhancing brand salience, creating awareness of relevant product offerings (Colicev et al. 2018), and building customer–firm relationships (Kumar et al. 2016).
Types of Owned Social Media Content
Marketing communication literature generally divides communication content into informational and emotional appeals. The first type of appeals focuses on the communication of a product's instrumental or functional benefits (i.e., the problems it solves), while the second type focuses on the emotional and experiential aspects of consumption, related to the excitement and pleasure the product provides (e.g., MacInnis, Rao, and Weiss 2002; Rossiter, Percy, and Bergkvist 2018). Research in the social media domain (see Web Appendix A) has built on this distinction, dividing owned social media messages into functional and hedonic content (e.g., De Vries, Gensler, and Leeflang 2012; Lee, Hosanagar, and Nair 2018; Meire et al. 2019; Stephen, Sciandra, and Inman 2015; Tellis et al. 2019).
Within functional content, we distinguish between two types of product-related information: content that provides consumers with information about (1) the attributes of the product or service (e.g., Eigenraam, Eelen, and Verlegh 2021; Lee, Hosanagar, and Nair 2018; Meire et al. 2019) or (2) deals and other aspects of pricing (e.g., Tellis et al. 2019). Within hedonic content, we distinguish between emotional and social orientations. Some hedonic content is more emotion oriented, providing entertainment value or triggering emotional responses (e.g., Akpinar and Berger 2017; Eigenraam, Eelen, and Verlegh 2021; Stephen, Sciandra, and Inman 2015). Other hedonic content has a social orientation, focused on community building and dialogue. This latter type of hedonic content is also referred to as “social” or “social oriented” (e.g., De Vries, Gensler, and Leeflang 2012; Homburg, Ehm, and Artz 2015). Web Appendix B provides brand and industry examples of functional and hedonic types of content.
Functional and hedonic content differ in the extent to which they are suitable for achieving engagement and sales goals. For social media engagement, we predict that hedonic content is more effective than functional content (both information and deal related). Compared with functional messages, hedonic content with an emotional message provides more of the emotional arousal that fosters message liking and sharing (Berger and Milkman 2012; Bernritter, Verlegh, and Smit 2016). While hedonic content that emphasizes a social motivation may provide less emotional arousal, it is still likely to be effective in creating social media engagement because it makes social connections more salient in the minds of consumers and thus provides a call to “engage” with others, which may foster commenting and sharing of content.
For sales, we predict that functional content is more effective than hedonic content. Akpinar and Berger (2017) explain that functional messages provide persuasive information about a product's attributes that aids consumers in their purchase decisions. Hedonic messages provide less decision-relevant information and therefore are a less potent driver of sales. Akpinar and Berger focus on functional messages providing information on product attributes rather than information about deals, but we expect their findings to hold for the latter type of functional messages: content about deals aligns more with a purchasing goal than an engagement goal (Van Doorn et al. 2010), and information on deals has a positive impact on sales (Ailawadi et al. 2009; Van Heerde, Leeflang, and Wittink 2004). We expect this effect also to occur for owned social media content.
Brand Characteristics
Brand type: utilitarian versus hedonic
Brands are typically classified into utilitarian versus hedonic types (Chen, Lee, and Yap 2017; Kronrod and Danziger 2013). Utilitarian brands fulfill practical consumer needs or necessities (Mehta, Zhu, and Meyers-Levy 2014) and are often associated with traits such as efficiency, skill, confidence, and intelligence (Cuddy, Fiske, and Glick 2008). Hedonic brands address customer needs linked to pleasure, fun, enjoyment, or other attractive emotional states (Babin, Darden, and Griffin 1994). They are associated with traits such as friendliness and sociability (Cuddy, Fiske, and Glick 2008), and research has shown that consumers are more prone to interact with such brands on social media (Bernritter, Verlegh, and Smit 2016). Given this congruency or “fit” effect, we expect hedonic brands to be more effective for social media engagement than utilitarian brands.
Brand community size
The effectiveness of social media content is governed not only by the type of brand that publishes it but also by the size of the brand community. Brands often strive to grow their follower base, because larger social media communities can increase the reach of their message. For a brand with more followers, a one-unit increase in owned social media will have a greater unit effect on social media engagement and sales than for a brand with fewer followers. However, the percentage change in social media engagement and sales due to a percentage change in owned social media is not necessarily larger for a brand with more followers, as it may be relatively easier for the smaller brand to lift its lower base level (Bolton 1989). In this sense, message effectiveness is likely to decrease with size, suggesting a ceiling effect. Smaller brand communities are more tight-knit and more closely linked to the brand at the center, which causes consumers to identify and engage more with the brand (Algesheimer, Dholakia, and Herrmann 2005). As the size of a brand community increases, it becomes more difficult for brands to maintain strong connections with their follower base and target messages to followers’ needs. This is likely to reduce the engagement with the brand's social media messages and their effect on sales.
Industry Characteristics
Product type: products versus services
Because services are less tangible, less consistent, and more difficult to evaluate (Zeithaml, Parasuraman, and Berry 1985), owned social media are likely to be more critical to establish the relationship and trust that service brands require. Even if service and product brands’ posts are similar in terms of content, consumers may respond differently to them because they have a greater need for information for services. Therefore, we expect the impact of owned social media on engagement and sales to be greater for services than for products (De Oliveira Santini et al. 2020; Palmatier et al. 2006).
Product life cycle: new versus mature
Drawing from advertising literature that shows larger advertising elasticities for new versus mature products (Köhler et al. 2017; Sethuraman, Tellis, and Briesch 2011), we expect consumers to be more responsive to owned social media for new products. This is because consumers have not yet formed their preferences and have less knowledge about the brands’ products (Sethuraman, Tellis, and Briesch 2011), making them both more malleable and motivated to process information for new than mature products (Moldovan, Goldenberg, and Chattopadhyay 2011) and leading to greater engagement. This also results in an increase in consumers’ attention to and interest in buying the new product (Köhler et al. 2017).
Platform Characteristics
Type of platform: social networks versus microblogs
Social media channels differ from other digital channels in terms of their social community structure and ties among participants (see Web Appendix C), though not all social media are created equal. Important distinctions between social networks (e.g., Instagram, Facebook) and microblogs (e.g., Twitter, Sina Weibo) are audience expectations and goals (e.g., Hennig-Thurau, Wiertz, and Feldhaus 2015; Marchand, Hennig-Thurau, and Wiertz 2017). Social networks revolve around users’ social ties, which creates trust and personal connections and relates to the goal of building relationships (Buzeta, De Pelsmacker, and Dens 2020). By contrast, microblogs are content-based and focused on broadcasting: they are more publicly visible and allow wider access than other types of social media (Kaplan and Haenlein 2011).
These differences between social media channels are likely to translate into differential effects of owned social media content on engagement and sales. It is difficult, however, to predict the direction of these effects. One prediction may be that content shared on social networks like Facebook and Instagram is more impactful than content shared on microblogs, because the former channels are characterized by stronger social ties and higher levels of trust. In contrast, microblogs are more suited to wider dissemination of content and generally reach larger numbers of consumers in a shorter time span. These characteristics have opposite and competing influences on channel-level elasticities, and we therefore refrain from a priori predictions about the resulting differences in these elasticities.
Advertising introduction (platform specific)
In addition to the type of platform, which influences how consumer process owned social media messages, platforms themselves have changed over time. Social media sites have evolved over the years, and this evolution may have altered their effectiveness (Voorveld 2019). After the novelty of the first years, the effectiveness of owned social media may have reached a plateau, as social media sites have become a crowded space for brands. The introduction of advertising on a given social media platform is a key event in these developments that may influence the effectiveness of social media content in different ways. Providing an a priori prediction of the direction of this effect is difficult. On the one hand, the introduction of advertising on a social media platform may reduce the audience's attention, as the “sponsored” ad is explicitly communicated to consumers, serving as an external cue and distracting consumers from the relationship-building nature of the social media posts (Kanuri, Chen, and Sridhar 2018). It may also reduce consumer trust in the medium because its commercial nature is incongruent with the context of social media (Buzeta, De Pelsmacker, and Dens 2020). The introduction of advertising on a platform may therefore activate persuasion knowledge and induce skepticism, making consumers less responsive to branded content (Tuk et al. 2009). On the other hand, the introduction of advertising entails a clearer distinction of “pure” advertising and a brand's owned social media content, which may help rather than hurt consumer trust in the latter (Boerman, Willemsen, and Van Der Aa 2017).
Country Characteristics
Social media accessibility and economic progress
Social media access can be facilitated through greater mobile phone penetration, linking this indicator to consumers’ ability to access branded social media content (Kim, Moon, and Iacobucci 2019). Economic progress is another important factor that captures the average level of economic resources per person in a country, signaling consumers’ possibility to take more risks, especially in their purchases (Datta et al. 2022). Marketing literature captures economic progress through the gross domestic product (GDP) per capita (Tellis, Stremersch, and Yin 2003). We expect both social media accessibility and economic progress to contribute to consumers’ capability to access and act on owned social media, enhancing the impact of brand-related content across the two owned social media outcomes.
Cultural factors
In addition to socioeconomic variables, country-level differences may be due to cultural factors. In his pioneering work, Hofstede (1991) identified four major dimensions of national culture: power distance, uncertainty avoidance, masculinity, and individualism. Recently, Datta et al. (2022) find that power distance has a large and significant impact on elasticities across a range of marketing variables while other variables have no significant effect. 2 We therefore focus on power distance. Power distance, which describes the extent to which a culture is tolerant to inequality (Hofstede 1991), pertains to openness to sharing experience or knowledge (Hofstede and McCrae 2004). Thus, high-power-distance consumers may be more cautious about openly sharing their opinions online, signaling their identity (Eelen, Özturan, and Verlegh 2017), and expressing themselves freely during brand interactions (Hollebeek 2018). In addition, cultures high in power distance ascribe more importance to wealth and status and thus attach greater importance to the consumption of (national) brands, which enable consumers to signal their wealth to others (Wang, Torelli, and Lalwani 2020). We therefore expect owned social media content to have a weaker effect on social media engagement but a stronger effect on sales in high-power-distance than low-power-distance countries.
Control Variables: Study Characteristics
Several methodological characteristics could moderate the impact of owned social media on social media engagement and sales. Following previous meta-analyses (e.g., Edeling and Fischer 2016; You, Vadakkepatt, and Joshi 2015), we identify control variables that allow us to capture changes in consumers’ responses to owned social media over time (the year of data collection) and to model choices signaling whether a study included a brand's previous standing (the inclusion of a lagged dependent variable in the model) or addressed causality (the inclusion of endogeneity controls). We also control for model differences, such as the number of variables used (the number of parameters) and the way they operationalize the dependent variable, social media engagement (valence vs. volume), and the independent variable, owned social media (valence, presence, and volume). Finally, we control for sample size by including the inverse of the number of observations, which is used in meta-analyses as a publication bias control (Stanley and Rosenberger 2009), the research field, and whether the paper was published in a top journal.
Data
Data Collection and Coding
For our meta-analysis, we collected studies that empirically investigate the impact of owned social media. In Web Appendix D, we outline the detailed procedure of the database construction (preferred reporting items for systematic reviews and meta-analyses; Moher et al. 2009), and in Web Appendix E, we report the final list of studies. First, we conducted a full literature search for published and unpublished work in academic databases, including EBSCOhost and Web of Science, and also searched SSRN, Marketing Science Institute, EconPapers, RePEc, and Google Scholar. Second, we performed a manual issue-by-issue review of Journal of Marketing, Journal of Marketing Research, Marketing Science, and Management Science (for a similar approach, see Babić-Rosario et al. [2016]). Third, we applied a snowballing procedure to identify additional studies from the reference lists. Fourth, we posted a call on the ELMAR platform to identify unpublished work on the topic. We completed the search process in August 2021.
Of the initial articles identified, we included those that met the following criteria: (1) the primary study considered the impact of owned social media, (2) the context was social media platforms, and (3) the study reported statistical information that enabled us to compute the elasticities. When we could not calculate the elasticities, we contacted the authors of the studies to retrieve the missing information.
We identified two major owned social media outcomes: social media engagement and sales. We excluded outliers outside the interval of the mean elasticity plus or minus three standard deviations for each of the two dependent variables (43 for social media engagement, 8 for sales; Bijmolt, Van Heerde, and Pieters 2005; Edeling and Fischer 2016). This process resulted in a sample of 86 papers published between 2011 and 2021 and 1,641 elasticities based on 95,295,208 observations (M = 58,071, SD = 175,061). We used 2008 as the starting date for our literature search because it represents the milestone when large brands first joined social media (see Web Appendix F), as well as the date of the first article published on owned social media (Porter and Donthu 2008). For the first three studies on the topic, we could not retrieve the information needed to calculate elasticities, moving the starting date of our data set to 2011. Approximately 81% of articles were published between 2016 to 2021, showing the growing importance of social media in recent years. Nearly all studies reported multiple effects (M = 19, min = 1, max = 150). Of the obtained elasticities, 46% derive from marketing literature, 23% from management and strategy, and 31% from information systems and computer science. Approximately 10% of the elasticities derive from working papers and conference proceedings papers.
To reduce error when collecting information from each study, we specified a coding protocol (Rubera and Kirca 2012) with agreed-on inclusion criteria, definitions, and guidelines on how to derive elasticities (see Web Appendix G for the elasticity calculation). Two coders validated the whole data set, and another independent coder validated 80% of the data set. The intercoder reliability reached 93%, with the disagreements resolved through discussion (Geyskens et al. 2009).
Variable Operationalization
Table 1 presents the operationalization of the variables. For the link between owned social media and social media engagement, we retrieved 1,349 elasticities (110 focus on owned social media volume, 227 on owned social media valence, and 1,012 on the presence of owned social media). A few papers focusing on social media engagement operationalize the dependent variable in terms of valence (e.g., positivity scales) rather than volume of social media engagement (e.g., number of comments). To account for this difference, we include a dummy variable to capture valence. (As a robustness check, we also excluded social media engagement operationalized as valence and obtained robust results.) We collected 292 elasticities between owned social media and sales (211 focus on owned social media volume, 19 on owned social media valence, and 62 on the presence of owned social media; for a similar number of elasticities, see You, Vadakkepatt, and Joshi [2015]). We coded actual sales and related proxies (e.g., number of categories sold, sales rank). For studies using sales rank (18 elasticities), we reverse-coded the effect size to account for the inverse relationship (Brynjolfsson, Hu, and Smith 2003). Web Appendix H lists the summary statistics, and Web Appendix I reports the correlation matrices for the moderating variables.
Operationalization of Variables.

Notes: The percentages in the first column represent the frequencies of the dummy variables in our data set.
Owned social media
For 1,058 (of 1,641) elasticities, we code owned social media content into functional or hedonic categories. We further operationalize functional (27% of all effects) as content that is (1) informational (i.e., including information about the brand, the firm, the product, or events and other related topics) or (2) related to deals (i.e., price promotions or price information, labeled “deals” for brevity). We operationalize hedonic content (38% of all effects) as (1) emotional (i.e., contains emotions, evokes emotions, is high in arousal, or is entertaining) or (2) related to social content (i.e., focuses on community building, calls to action for engagement or contests, or interactivity and dialogue). We use dummy variables to define the content characteristics (with hedonic content as a reference), and we include one dummy to use whenever the content was not specified. Removing this unspecified content from the analysis does not alter the results.
Brand characteristics
To capture brand type, we include a dummy variable for utilitarian brands, leaving hedonic brands as reference. To classify brands, two marketing experts coded each elasticity in our sample as belonging to a hedonic brand (67% of the sample) or utilitarian brand (33% of the sample) following previous literature (e.g., Bart, Stephen, and Sarvary 2014; Khamitov, Wang, and Thomson 2019). Thus, they assigned a brand as utilitarian if it is predominantly purchased for practical reasons fulfilling functional needs and assigned a brand as hedonic if it is predominantly purchased for pleasure, fun, or enjoyment. For missing brand names, we inferred the brand type from the information provided in the primary studies about the category and type of purchase need (functional or hedonic). When an elasticity captured the average owned social media impact across multiple brands, we first classified each brand as hedonic or utilitarian and then assigned the brand type from the average score (e.g., if 30 of 50 brands could be classified as utilitarian, the average utilitarian score is .6, and the assigned brand type would be utilitarian). Whenever we needed more information, we contacted the authors. If we still had no information to classify the brands, we replaced the missing values by the mean of our sample.
To capture the brand community size, we include the number of followers (log-transformed) for every brand, platform, and year of data collection combination reported in the primary study. When the information was missing, we contacted the authors. If they did not have this information, we used the Wayback Machine (https://web.archive.org/) to retrieve the number of followers for the given brand and year, compiling a unique data set. This time-varying information can serve as a proxy for brand community power at the time of the original data collection. This is critical in meta-analytic work because retrieving time-specific information that matches the primary studies is often impossible.
Industry characteristics
The elasticities are linked to brands from 31 categories: airlines, alcohol and beverages, apparel, automotive, banking, beauty and personal care, consumer goods, candy, cooking services, do-it-yourself, durable goods, electronics, financial services (including microloans), garden center, health care, hotel services, luxury fashion, movies, museum, music, newspaper, restaurant services, retailing, sports, stationary, telecommunication services, transport, travel and tourism, TV shows, video games, and wellness provider. Most of the elasticities are coded for automotive (9%), apparel (9%), and retailing (6%). We divided the categories into three groups using two dummy variables for service (20%) and mixed (44%), leaving product (36%) as the reference.
We capture new product activity of brands (9%; i.e., a recent product introduction) with a dummy variable coded as 1 whenever the primary studies specified that the elasticity was related to a new product introduction/launch (this includes products that typically adhere to new product activity characteristics, such as movies, music, TV shows, or video games; Babić-Rosario et al. 2016). If the primary studies did not specify whether the product was recently introduced to the market, we classified the product as mature (91%; reference) (for a similar approach, see Köhler et al. [2017] and Sethuraman, Tellis, and Briesch [2011]).
Platform characteristics
The primary studies found elasticities on 14 social media sites: Facebook, Instagram, Kiva, Myspace, Reddit, Sina Weibo, Snapchat, Tumblr, Twitch, Twitter, WeChat, Weitao, YouTube, and unnamed forums, as well as social media in general, with the most frequent platforms being Facebook (60%), Twitter (17%), and YouTube (6%). To capture the platform type, we included two dummies, one for microblogs (22%) and one for mixed platform types (social networks, microblogs in any combination together, blogs, forums, online communities, and social media in general; 8%), with social networks as the reference (70%). Prior research has mostly examined the impact of owned social media on social media engagement on the same platforms (for an exception, see Tellis et al. [2019]).
To further account for changes in social media platform policies that may have affected brands’ social media content management on the one hand and consumers’ reaction to owned social media content on the other hand, we include a dummy variable to account for the introduction of brand advertising on a given social media site. Eighty-seven percent of elasticities were retrieved from platforms at a time when social media advertising was already introduced.
Country characteristics
We harvest elasticities from 17 countries across North America (44%), Europe (17%), Asia (14%), and other regions (e.g., Africa, Australia/Oceania, Middle East, 3%; missing country information, 22%). We capture social media accessibility and economic progress by including mobile phone penetration and GDP per capita (log-transformed) per country at the time of data collection. Furthermore, to assess cultural differences across the 17 countries, we include the power distance dimension (Hofstede, Hofstede, and Minkov 2010). We replaced the missing values whenever the country was not specified by the mean of our sample (Khamitov, Wang, and Thomson 2019).
Study characteristics
The primary studies’ data were collected between 2007 and 2019 (M = 2014, SD = 1.98). We used the year of data collection to explore whether effects vary over time; we also included a quadratic effect to capture possible nonlinear effects (Leeflang et al. 2000). In 21% of the cases, the primary studies included a lagged dependent variable in their response models, and in 31% of the cases, they controlled for endogeneity. The studies included 73 parameters on average (SD = 291.847) in their response models. In 7% of the cases, the dependent variable for social media engagement was operationalized as valence instead of volume (93%). Owned social media was operationalized as volume for 20% of the cases, as valence for 15%, and as presence for 65% (Hewett et al. 2016). We include two dummy variables to capture whether owned social media was operationalized as valence or presence instead of volume (reference). To control for differences in sample sizes across studies (often used as a proxy for publication selection bias; Stanley and Rosenberger 2009), we include the mean of the inverse of the square root of the sample size of the primary studies (M = .027, SD = .023). We include dummies for the research field, distinguishing among management (23%), information systems and computer science (31%), and marketing (46%, used as reference). Finally, for 32% of the cases, the data were published in a top journal outlet (based on the Financial Times Research rank list (Ormans 2016).
Method
Computation of Elasticities
We retrieved elasticities (η) from the primary studies when reported. If elasticities were not available, we computed the elasticities from the parameter estimates and descriptive statistics as outlined in Web Appendix G (e.g., Edeling and Fischer 2016; Kremer et al. 2008). We corrected for measurement error of the elasticities based on constructs by dividing them by the square root of the product of the reliabilities pertaining to the two constructs (Hunter and Schmidt 2004).
Meta-Analytic Model and Estimation
Our analysis follows a two-step approach (Edeling and Fischer 2016; You, Vadakkepatt, and Joshi 2015). First, we compute the average owned social media elasticities for each dependent variable and analyze the distribution of the elasticities. Second, we identify significant moderators using a two-level hierarchical linear meta-analysis model (HiLMA; Bijmolt and Pieters 2001), with elasticities (Level 1) nested within papers (Level 2).
3
We estimate the following model for social media engagement and sales separately: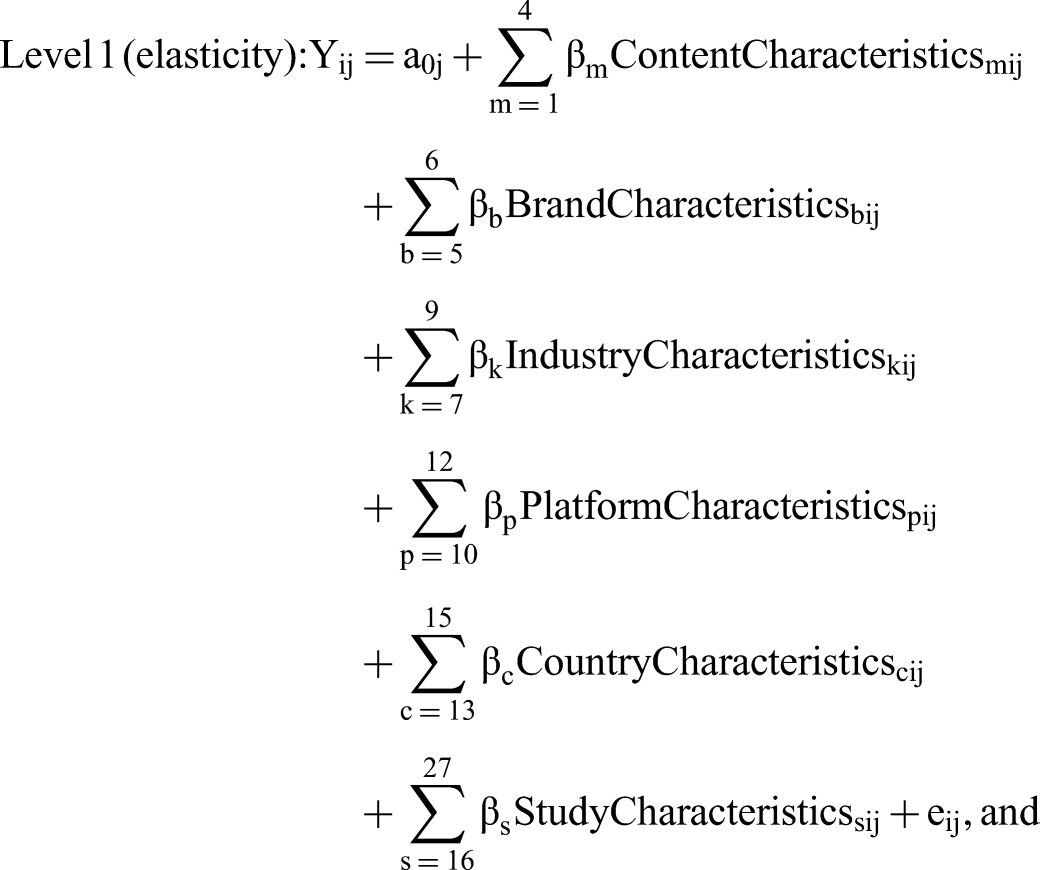

Results
Descriptive Analysis
In Figure 2, we present the distribution of the social media engagement and sales elasticities corrected for measurement error. Together with the overview reported in Table 2, these descriptive statistics provide first model-free evidence that owned social media have a positive impact across both outcomes. While, on average, the elasticities are positive, they are negative in 37% of the cases for social media engagement and 16% of the cases for sales. Web Appendix J illustrates the variation of the elasticities over time.

Frequency Distribution of the Observed Elasticities of Owned Social Media.
Descriptive Statistics of Owned Social Media Elasticities on Social Media Engagement and Sales.
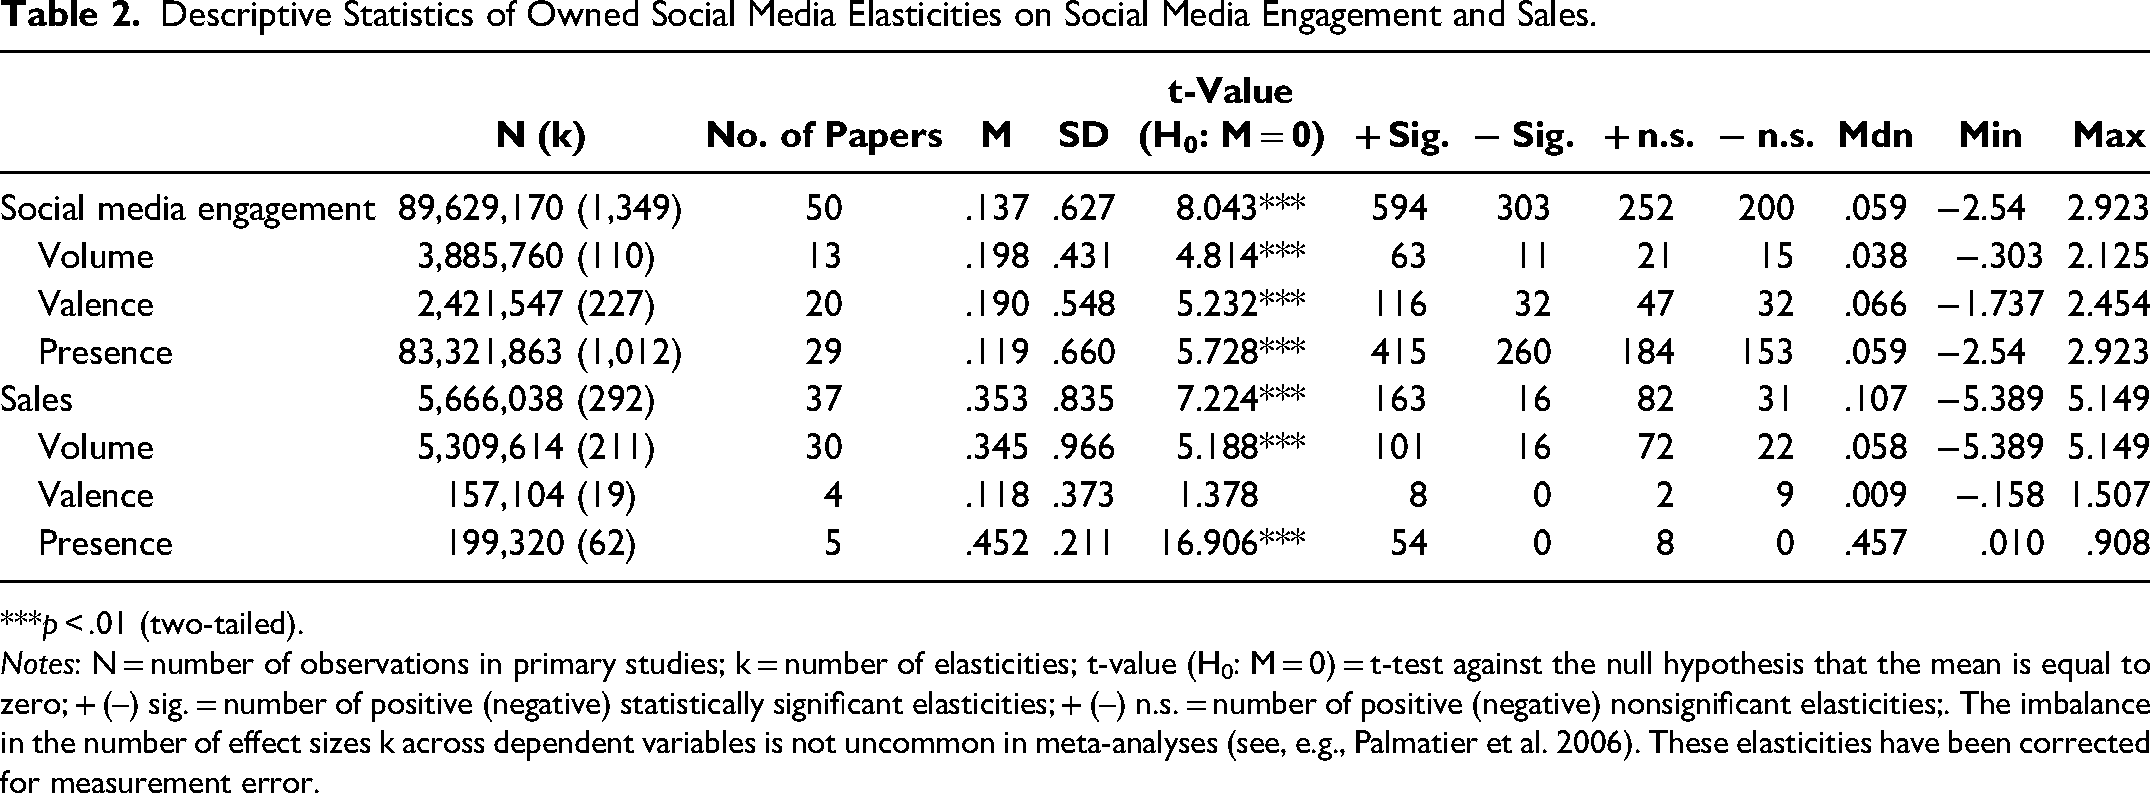
***p < .01 (two-tailed).
Notes: N = number of observations in primary studies; k = number of elasticities; t-value (H0: M = 0) = t-test against the null hypothesis that the mean is equal to zero; + (–) sig. = number of positive (negative) statistically significant elasticities; + (–) n.s. = number of positive (negative) nonsignificant elasticities;. The imbalance in the number of effect sizes k across dependent variables is not uncommon in meta-analyses (see, e.g., Palmatier et al. 2006). These elasticities have been corrected for measurement error.
Overall, we find that increasing owned social media by 1% leads to an increase in social media engagement by .137% and in sales by .353% (the effects are significantly different from each other; p < .001). We find similar significant effects when we focus on owned social media volume (p < .10) and presence (p < .001), but the effect of valence does not significantly differ between engagement and sales. The stronger effect on sales may seem surprising because social media are often considered a tool to drive engagement rather than sales. It should be noted, however, that comparison across outcomes is not straightforward, as different outcomes refer to different levels of analysis. This stronger elasticity for sales may be the result of two effects: a “self-competition” effect and a “fan base versus customer base” effect. In the first case, if a brand increases the number of owned social media posts—for example, from one to five posts in a day—a given customer may react to one post but not to all five; these additional posts compete with each other for consumers’ engagement (“self-competition”). In addition, social media allows everyone to engage with a brand, even if they do not consume the brand. This leads to the “fan base versus customer base” effect: the number of consumers engaging with a brand on social media tends to be higher than the number of consumers actually buying a brand, leading to a smaller impact of owned social media on social media engagement than sales.
Figure 3 shows considerable variation among the elasticities of owned social media across content types. We observe significantly larger social media engagement elasticities for hedonic content (M = .179, SD = .557) than for functional content (M = .003, SD = .650; p < .001). Within hedonic content, we observe higher elasticities for emotional content (M = .249, SD = .534) than for social content (M = .103, SD = .572; p < .001), while we observe no significant differences within functional content (informational content: M = .003, SD = .609; deals content: M = .003, SD = .767). For sales, we observe the opposite: significantly larger elasticities for functional (M = .327, SD = .396) than for hedonic (M = .087, SD = .232; p < .001) content. We find no significant differences within functional (informational content: M = .377, SD = .449; deals content: M = .236, SD = .259) and hedonic (emotional content: M = .060, SD = .205; social content: M = .101, SD = .248) content.

Average Observed Elasticities per Message Content (Model-Free Evidence).
Overall, the descriptives indicate that owned social media have a positive effect on social media engagement and sales. They also reveal that the effect is not always positive, suggesting that the wrong social media post can decrease engagement and reduce sales, jeopardizing a firm's branding efforts. Moreover, the different impact of content type across owned social media outcomes underscores the importance of clearly defining the target outcome variable to create the most effective owned social media content. Finally, the large variation observed within each dependent variable calls for a moderation analysis. For example, we also observe that even within the same paper, owned social media is not always positive depending on the context (e.g., platform observed [Wang et al. 2021], modeling choices [Goh, Heng, and Lin 2013]; see also Web Appendix K).
The Moderating Role of Content and Context
Table 3 reports the results of the multilevel random-effect model, together with the predicted elasticities (η) retrieved by setting all other variables at their sample means (see Bijmolt, Van Heerde, and Pieters 2005). Our models explain between 12% and 42% of the Level 1 variance (Snijders and Bosker 1994), which is in line with other meta-analyses (e.g., 16% in Bijmolt, Van Heerde, and Pieters [2005], 26% in Babić-Rosario et al. [2016], 11% in You, Vadakkepatt, and Joshi [2015]). Overall, multicollinearity does not severely affect the model, with an average variance inflation factor between 3.32 and 4.34 (max = 9.57). To check the stability of the results, we conduct robustness checks, outlined at the end of this section.
The Moderating Role of Message Content and Context (HiLMA Results).

*p < .10. **p < .05. ***p < .01.
We removed variables with fewer than seven observations and fewer than three studies (Edeling and Himme 2018).
The predicted elasticity is computed considering both year of data collection and year of data collection squared, and setting year of data collection at the 25th and 75th percentiles and everything else at the mean.
The number of parameters is divided by 100.
Notes: Expected sign: + = positive relationship (compared with base level); – = negative relationship; ? = ambiguous relationship; for empty cells we do not have expectations; for continuous variables, the 25th and 75th percentile of the predicted elasticities are displayed; the significance level is computed using the delta method (see Bijmolt, Van Heerde, and Pieters 2005; Greene 2003). Base = reference category; DV = dependent variable; N = number of observations in primary studies; k = number of elasticities.
For owned social media content, the results align closely with our expectations. For social media engagement, we find that informational content (β = −.248, p < .01; η = .018), deals (β = −.254, p < .01; η = .012), and social content (β = −.154, p < .01; η = .112) are less effective than emotional content. This finding is important because it contrasts conventional wisdom suggesting that managers focus on deals or social content to boost their social media engagement. We find that informational content (β = .652, p < .05; η = .580) and social content (.461, p < .10; η = .338) affect sales more than emotional content does. Yet the effects for informational and social content are not significantly different from each other (p > .10).
Brand characteristics
Surprisingly, we do not observe significant results for brand type across the dependent variables. 4 Instead, for the brand community size, we find larger sales elasticities for a smaller number of followers (β = −.067, p < .01; ηlow = .411, ηhigh = .268). This may be because our elasticities are relative effect sizes, indicating that a percentage change in sales due to a percentage change in owned social media is not necessarily larger for a brand with more followers, due to a ceiling effect for larger brands. While it may be easier for the smaller brand to lift its lower base level, larger brands are confronted with a ceiling effect, preventing them from exerting the same level of growth.
Industry characteristics
Although we find no significant differences across product versus service versus mixed industries, we observe that studies based on multiple industries tend to report smaller elasticities than studies focusing on only one industry (β = −.215, p < .05). For new products, we find larger sales elasticities (β = .545, p < .01; η = .650) than for mature products. This might be because social media may be more relevant for new products, as brands can provide more content to consumers who have not yet formed their preferences and have less knowledge about the products (Sethuraman, Tellis, and Briesch 2011).
Platform characteristics
In line with our predictions, owned social media on microblogs are less effective at stimulating social media engagement than that on social networks (β = −.164, p < .05; η = .028). Moreover, we find that the presence of advertising on a social media platform reduces the effect of owned social media on sales (β = −.600, p < .01; η = .211). This suggests that rather than reinforcing brand trust, the presence of advertising reduces consumer trust in the social media content, because it is incongruent with the social nature of the social media context, as we discussed in our conceptual framework.
Country characteristics
Some of the effects of economic progress may be due to the level of mobile penetration. For social media engagement, we find a negative effect of mobile phone penetration (β = −.014, p < .01; ηlow = .216; ηhigh = −.008), which may indicate that in countries with a higher mobile phone penetration, consumers are more passively using social media on their mobile phones, rendering them less likely to like, share, and comment on content (Shankar et al. 2016). However, the level of mobile penetration positively affects the influence of owned social media on sales (β = .054, p < .01; ηlow = −.241, ηhigh = .968). Contrary to our expectations, we find that owned social media exert a stronger effect on sales in countries with lower GDP per capita than in countries with higher GDP per capita (β = −.221, p < .10; ηlow = .612, ηhigh = .201). A possible explanation is that social media use in countries with a higher GDP per capita is at a mature phase, which leaves little room for growth (Poushter, Bishop, and Chwe 2018). Moreover, the findings on the impact of power distance suggest that high-power-distance consumers rely more on branded social media content for sales to satisfy their materialistic needs (β = .024, p < .01; ηlow = .127, ηhigh = .559).
Study characteristics
We test the moderating impact of study characteristics in the primary studies (Edeling and Fischer 2016). The impact of social media increases over time for social media engagement (β = .083, p < .05), suggesting that brands become more sophisticated with the use of owned social media. However, we also observe a diminishing effect, as indicated by the negative quadratic term (β = −.039, p < .01; ηlow = .174, ηhigh = .155). For sales, we find a negative effect (β = −.204, p < .01), and this effect is further decreasing over time in a concave shape (β = −.034, p < .01; ηlow = .616, ηhigh = .046).
Studies that include the lagged dependent variable for social media engagement find stronger effects than studies that do not include it (β = .247, p < .05; η = .337). For sales, for studies that include a lagged dependent variable to control for carryover effects, the effects tend to be smaller (β = −.279, p < .10; η = .145). For both outcomes, controlling for endogeneity does not significantly alter the impact of owned social media. For studies with a higher number of parameters, we observe smaller elasticities for sales (β = −.022, p < .05; ηlow = .404, ηhigh = .368). When studies operationalize social media engagement as valence instead of volume, the elasticities tend to be larger (β = .494, p < .01; η = .600). Furthermore, when owned social media are operationalized as presence instead of volume, the sales elasticities tend to be smaller (β = −.963, p < .01; η = −.411). Finally, although we do not observe any significant difference across fields for social media engagement, we find that information systems and computer science studies tend to report larger effects than marketing studies for sales (β = .365, p < .10; η = .533).
Robustness checks
In Web Appendix O, we report an intercept-only model. The intercepts can be interpreted as the average predicted elasticities and are aligned with the average observed elasticities reported in Table 2 (ηengagement = .157, ηsales = .394). To assess the stability of our results, we conducted several robustness checks. First, we ran the models using ordinary least squares (see Web Appendix O). Second, we conducted sensitivity analyses by rerunning the models after removing one paper at a time; the results remained substantially the same (see Web Appendix P). Third, two papers investigated the impact of owned social media on TV show viewing (12 elasticities). Although previous research has used TV show viewing as a proxy for sales (You, Vadakkepatt, and Joshi 2015), we exclude these elasticities and find robust results (see Web Appendix Q). Fourth, with regard to social media engagement, not all elasticities are based on engagement volume. Excluding social media engagement operationalized as valence leads to substantively similar results (see Web Appendix R). Fifth, more variables could be used to capture brand, industry, platform, country, and study characteristics. We report the full list of variables coded but not included due to multicollinearity, lack of variation, and systematic nonsignificance in Web Appendix S and example results when including these variables in Web Appendix T. Sixth, we used an alternative hierarchical structure by nesting elasticities within the data set (instead of within the paper). This led to the same results of the models displayed (see Web Appendix U).
Discussion
Social media are an important marketing tool to sustain customer relationships and, consequently, to enhance firm performance. John Legere, former chief executive officer of T-Mobile USA, for example, turned the company's performance around through his social media strategy: “We’ve got a relationship on Twitter that's growing with customers, and that's something that many people are interested in” (Hanley Frank 2014). Other successful brands, such as Wendy's, Nike, Netflix, and National Geographic, have similar high-profile social media strategies. As such, in the last decade, marketing scholars have paid increased attention to social media, uncovering the effect of owned social media on different marketing outcomes. We offer new empirical generalizations on the impact of owned social media and also provide insights into when and how owned social media affect engagement and sales.
Key Takeaways and Their Managerial Implications
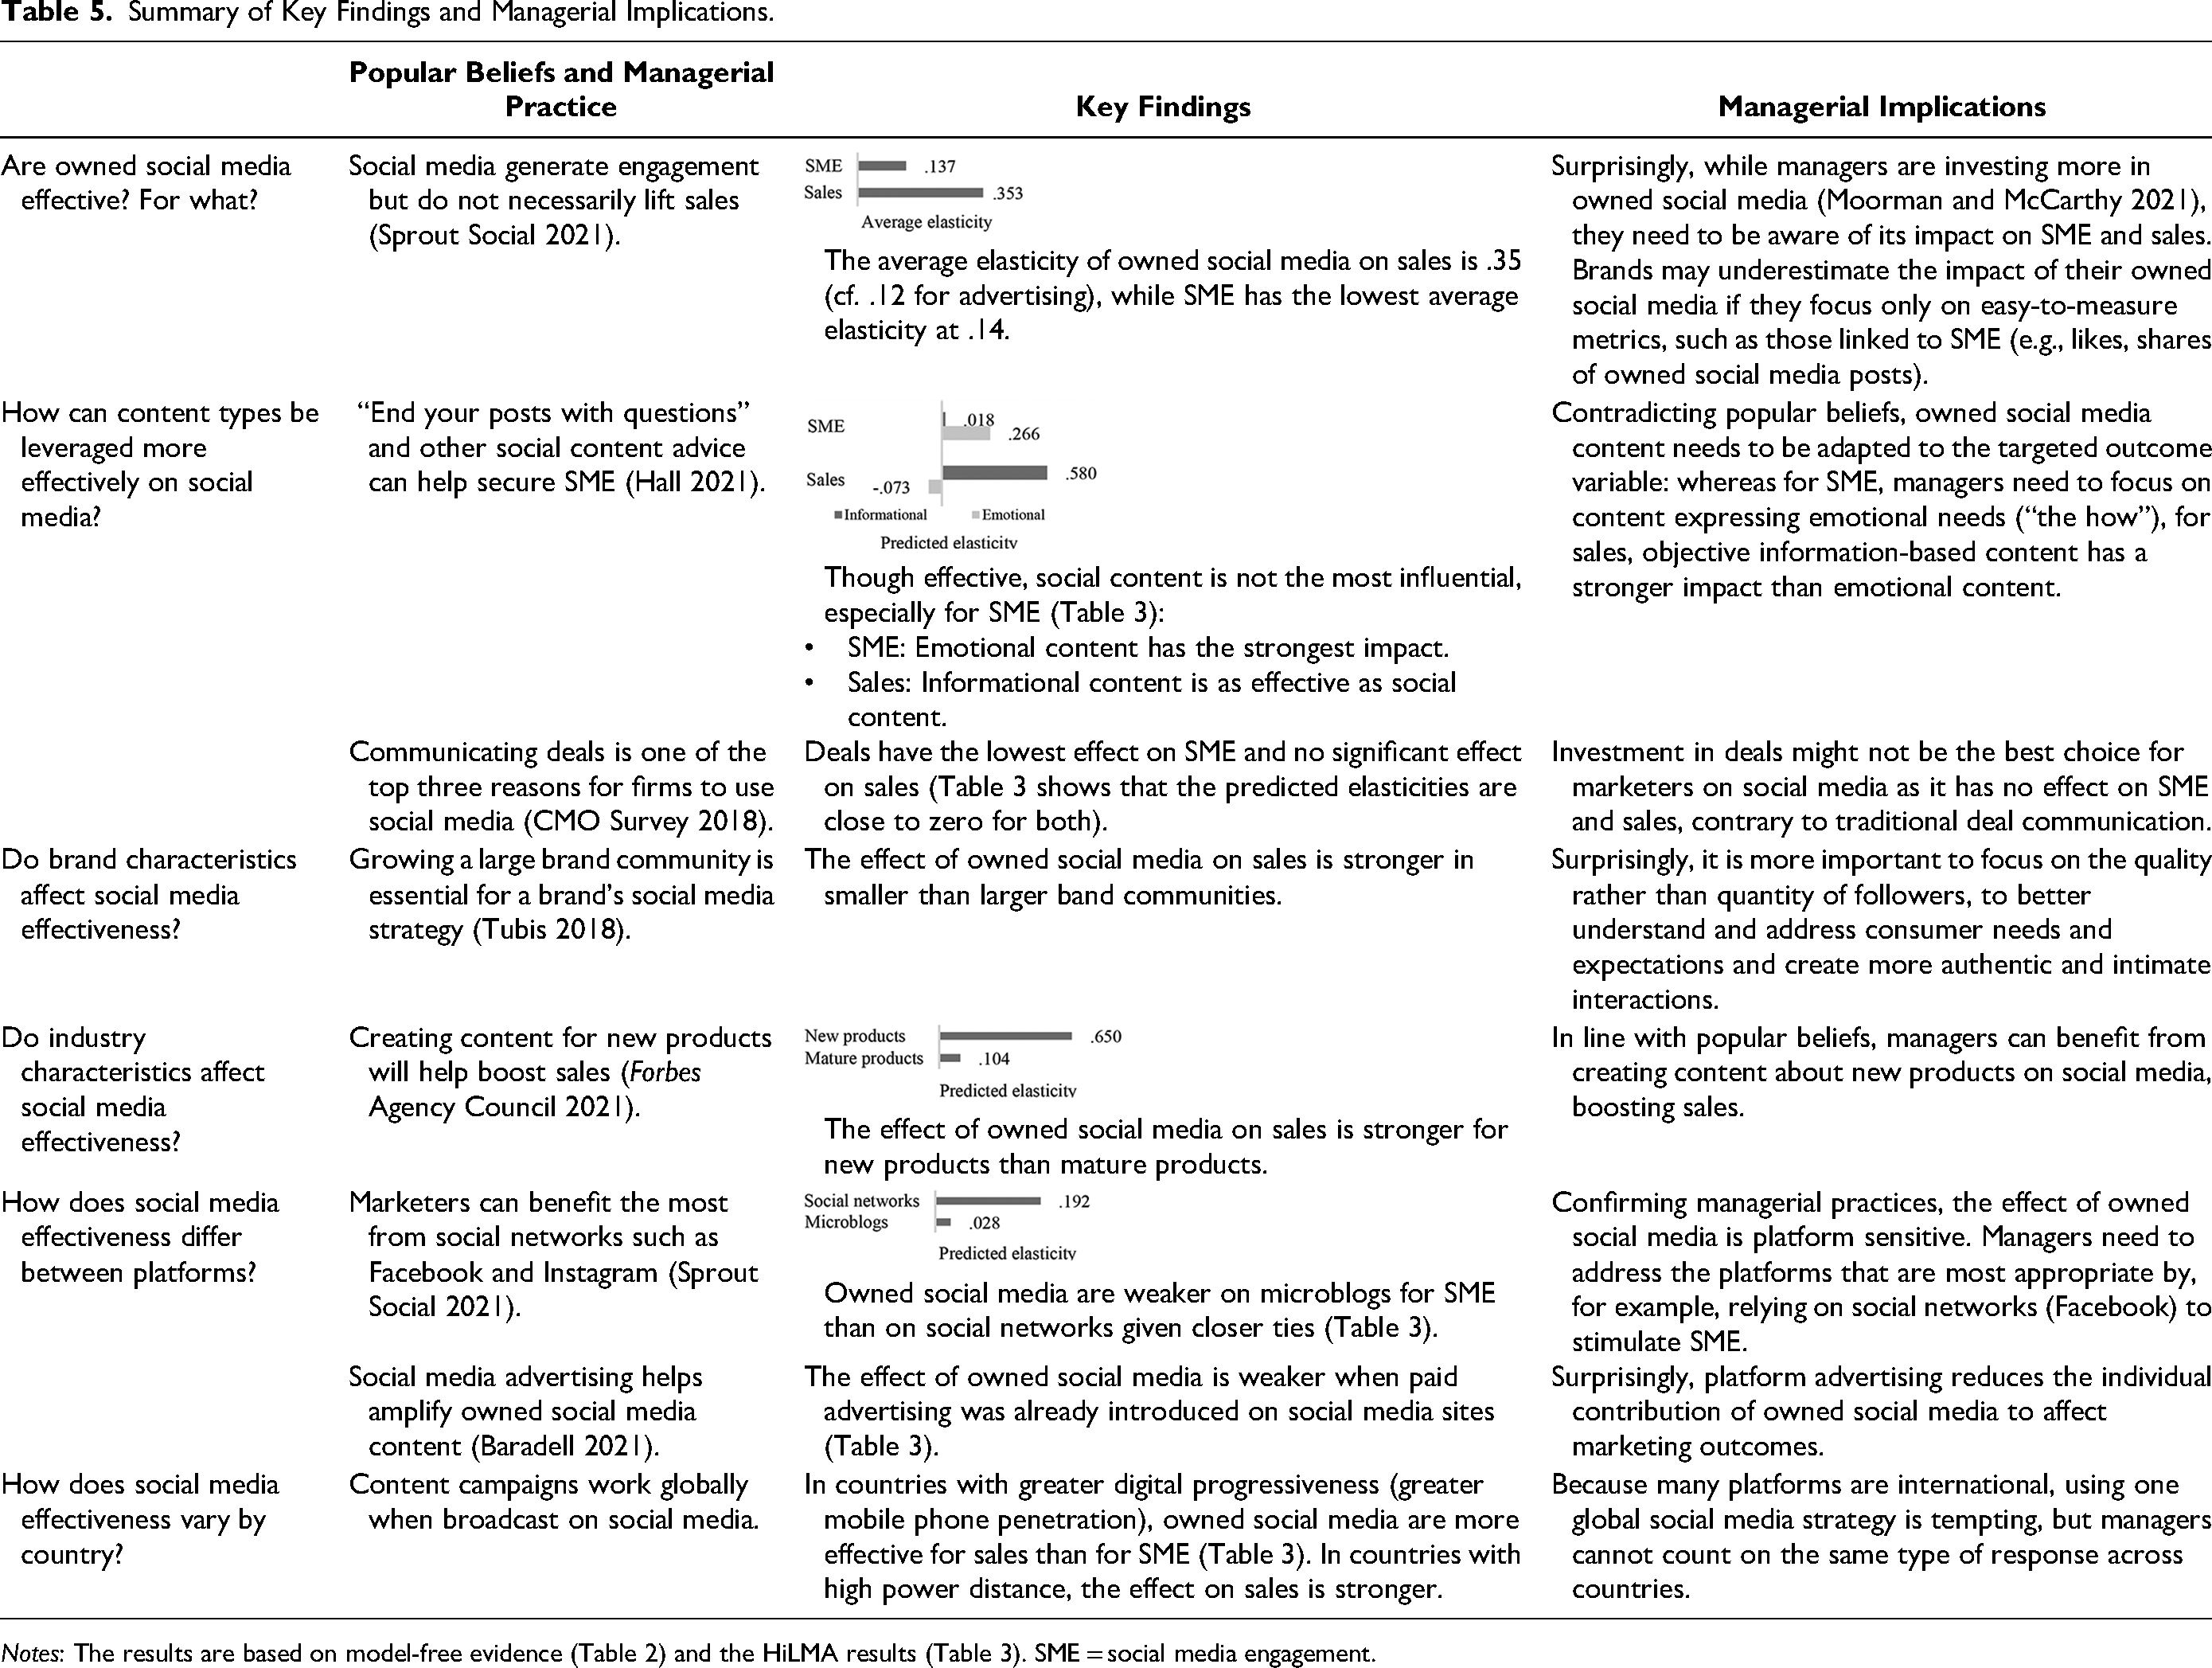
Overall, owned social media have a positive and significant impact on social media engagement and sales, and this effect is weaker for social media engagement (η = .14) than sales (η = .35; p < .001). Although managers are investing increasingly more in owned social media (Moorman and McCarthy 2021), they tend to monitor the effectiveness of their owned social media posts using metrics that are relatively easy to gather, such as those linked to social media engagement (e.g., likes, comments, shares; Sprout Social 2021). Not assessing the impact on sales may lead to misinterpretation of the effectiveness of owned social media and to the wrong use of content (as we conclude from our moderator analysis).
Table 4 summarizes the importance of different marketing instruments to managers, reporting the average sales elasticities for tools that can be directly controlled—such as price, advertising, and owned social media—and tools that cannot be directly controlled, such as electronic word of mouth (eWOM). Our results indicate that owned social media are a powerful tool to stimulate sales. While the effects are comparable to those of eWOM, marketers’ control over brands’ owned social media is considerably greater than their control over eWOM, which is in the hands of consumers. Moreover, our meta-analysis shows a large variation in effects, which suggests that managers need to be aware that not all owned social media campaigns are equally effective (see Table 5 for key findings).
Comparison with Other Marketing Instrument Elasticities.

Summary of Key Findings and Managerial Implications.
Managerial Guidelines for Owned Social Media
Contrary to popular beliefs and managerial practices:
How can content types be leveraged more effectively on social media? One of the most common mistakes of social media campaigns is the lack of an overall content strategy. Without content strategies, owned social media lose their effectiveness and may even lead to significant brand performance damage (Womack 2017). Our results can help managers develop such strategies by focusing on variables they can control directly. For example, they can balance “what they say” and “how they say it” depending on their goal: They can focus on the “how” to engage consumers with more emotional content and on the “what” to stimulate sales with more informational content (e.g., the hedonic brand Oreo recently boosted its sales using an informational post on Facebook [social network] about a recipe featuring its limited-edition red velvet flavor [new product]; Laroya 2020). Surprisingly, this guidance is not aligned with most social media content recommendations to “end posts with questions,” “ask customers to vote,” or “ask customers to send in pictures.” Although social content helps brands stand out online (Hall 2021), it is significantly less powerful than emotional content at stimulating social media engagement. We also find no evidence for a superior impact of deals, which marketers have named as one of their top three reasons for using social media (CMO Survey 2018). Do brand characteristics affect social media effectiveness? Because the effectiveness of owned social media seems equally important across brand types, brand managers can build on the experience of other brands. Moreover, brands try to grow their brand communities to reach as many consumers as possible (Tubis 2018). This has even spawned an industry of agents selling followers to brands. However, to stimulate sales, these growth strategies are counterproductive, as we find that owned social media are more effective for small brand communities (consumers reward the intimacy of a small community with greater trust in the brand and its messages). This contradicts the popular belief of “the larger, the better,” highlighting the need to focus more on the quality rather than quantity of followers. How does social media effectiveness differ between platforms? Owned social media are more effective on social networks than on microblogs, suggesting that tie strength and trust provided by social networks are more important than the open access and wide dissemination facilitated by microblogs. This reflects current practice, as brands are mostly active on social networks such as Instagram and Facebook, with microblogs such as Twitter receiving less attention by marketers (Sprout Social 2021). Moreover, managers should be mindful that future changes in the platform environment can alter the way consumers interact with branded content. We observe that the introduction of advertising on the different social media platforms weakened the effect of owned social media on engagement. Although social media advertising may amplify the reach and engagement of owned social media content (Baradell 2021), it can distract the audience, reducing the contribution of owned social media. How does social media effectiveness vary by country? Because social media platforms are often international, managers may be tempted to use one global social media strategy. Instead, our results show that managers should adapt owned social media content strategies to account for differences in country characteristics to process branded content. The increasing use of social media on smartphones (Kübler et al. 2018) amplifies the impact of owned social media on sales. Not surprisingly, managers can expect stronger effects on sales in countries with a greater mobile phone penetration. Furthermore, for countries with high power distance, we find that owned social media exert stronger effects on sales. High power distance is indeed related to greater receptiveness of branded communication fulfilling materialistic and status needs (Datta et al. 2022). Together, these results urge marketers to consider cross-national differences when developing their social media strategies. Do study characteristics matter? Scholars and practitioners need to be careful when comparing the impact of owned social media across time—our results indicate that owned social media face a saturation effect, requiring a more sophisticated and integrated marketing strategy. Finally, our results show that several study characteristics may affect their conclusions, such as using a lagged dependent variable or controlling for endogeneity. This is important for both scholars and practitioners, because 85% of managers report that social media data will be a primary source of business intelligence moving forward (Sprout Social 2021).
In line with practice and previous research:
Limitations and Further Research
Our empirical generalization uncovers several promising avenues for further research (see Table 6). First, the nature of meta-analytical data forced us to focus on relatively broad constructs to explain heterogeneity in effects. For example, we separated owned social media into content types. Nevertheless, the effectiveness of new owned social media formats (e.g., brand live sessions, stories) or more content types than just traditional broad-stroke content dimensions (e.g., emotional vs. informational; Berger et al. 2020) remains unknown.
Future Research on Owned Social Media Effectiveness.
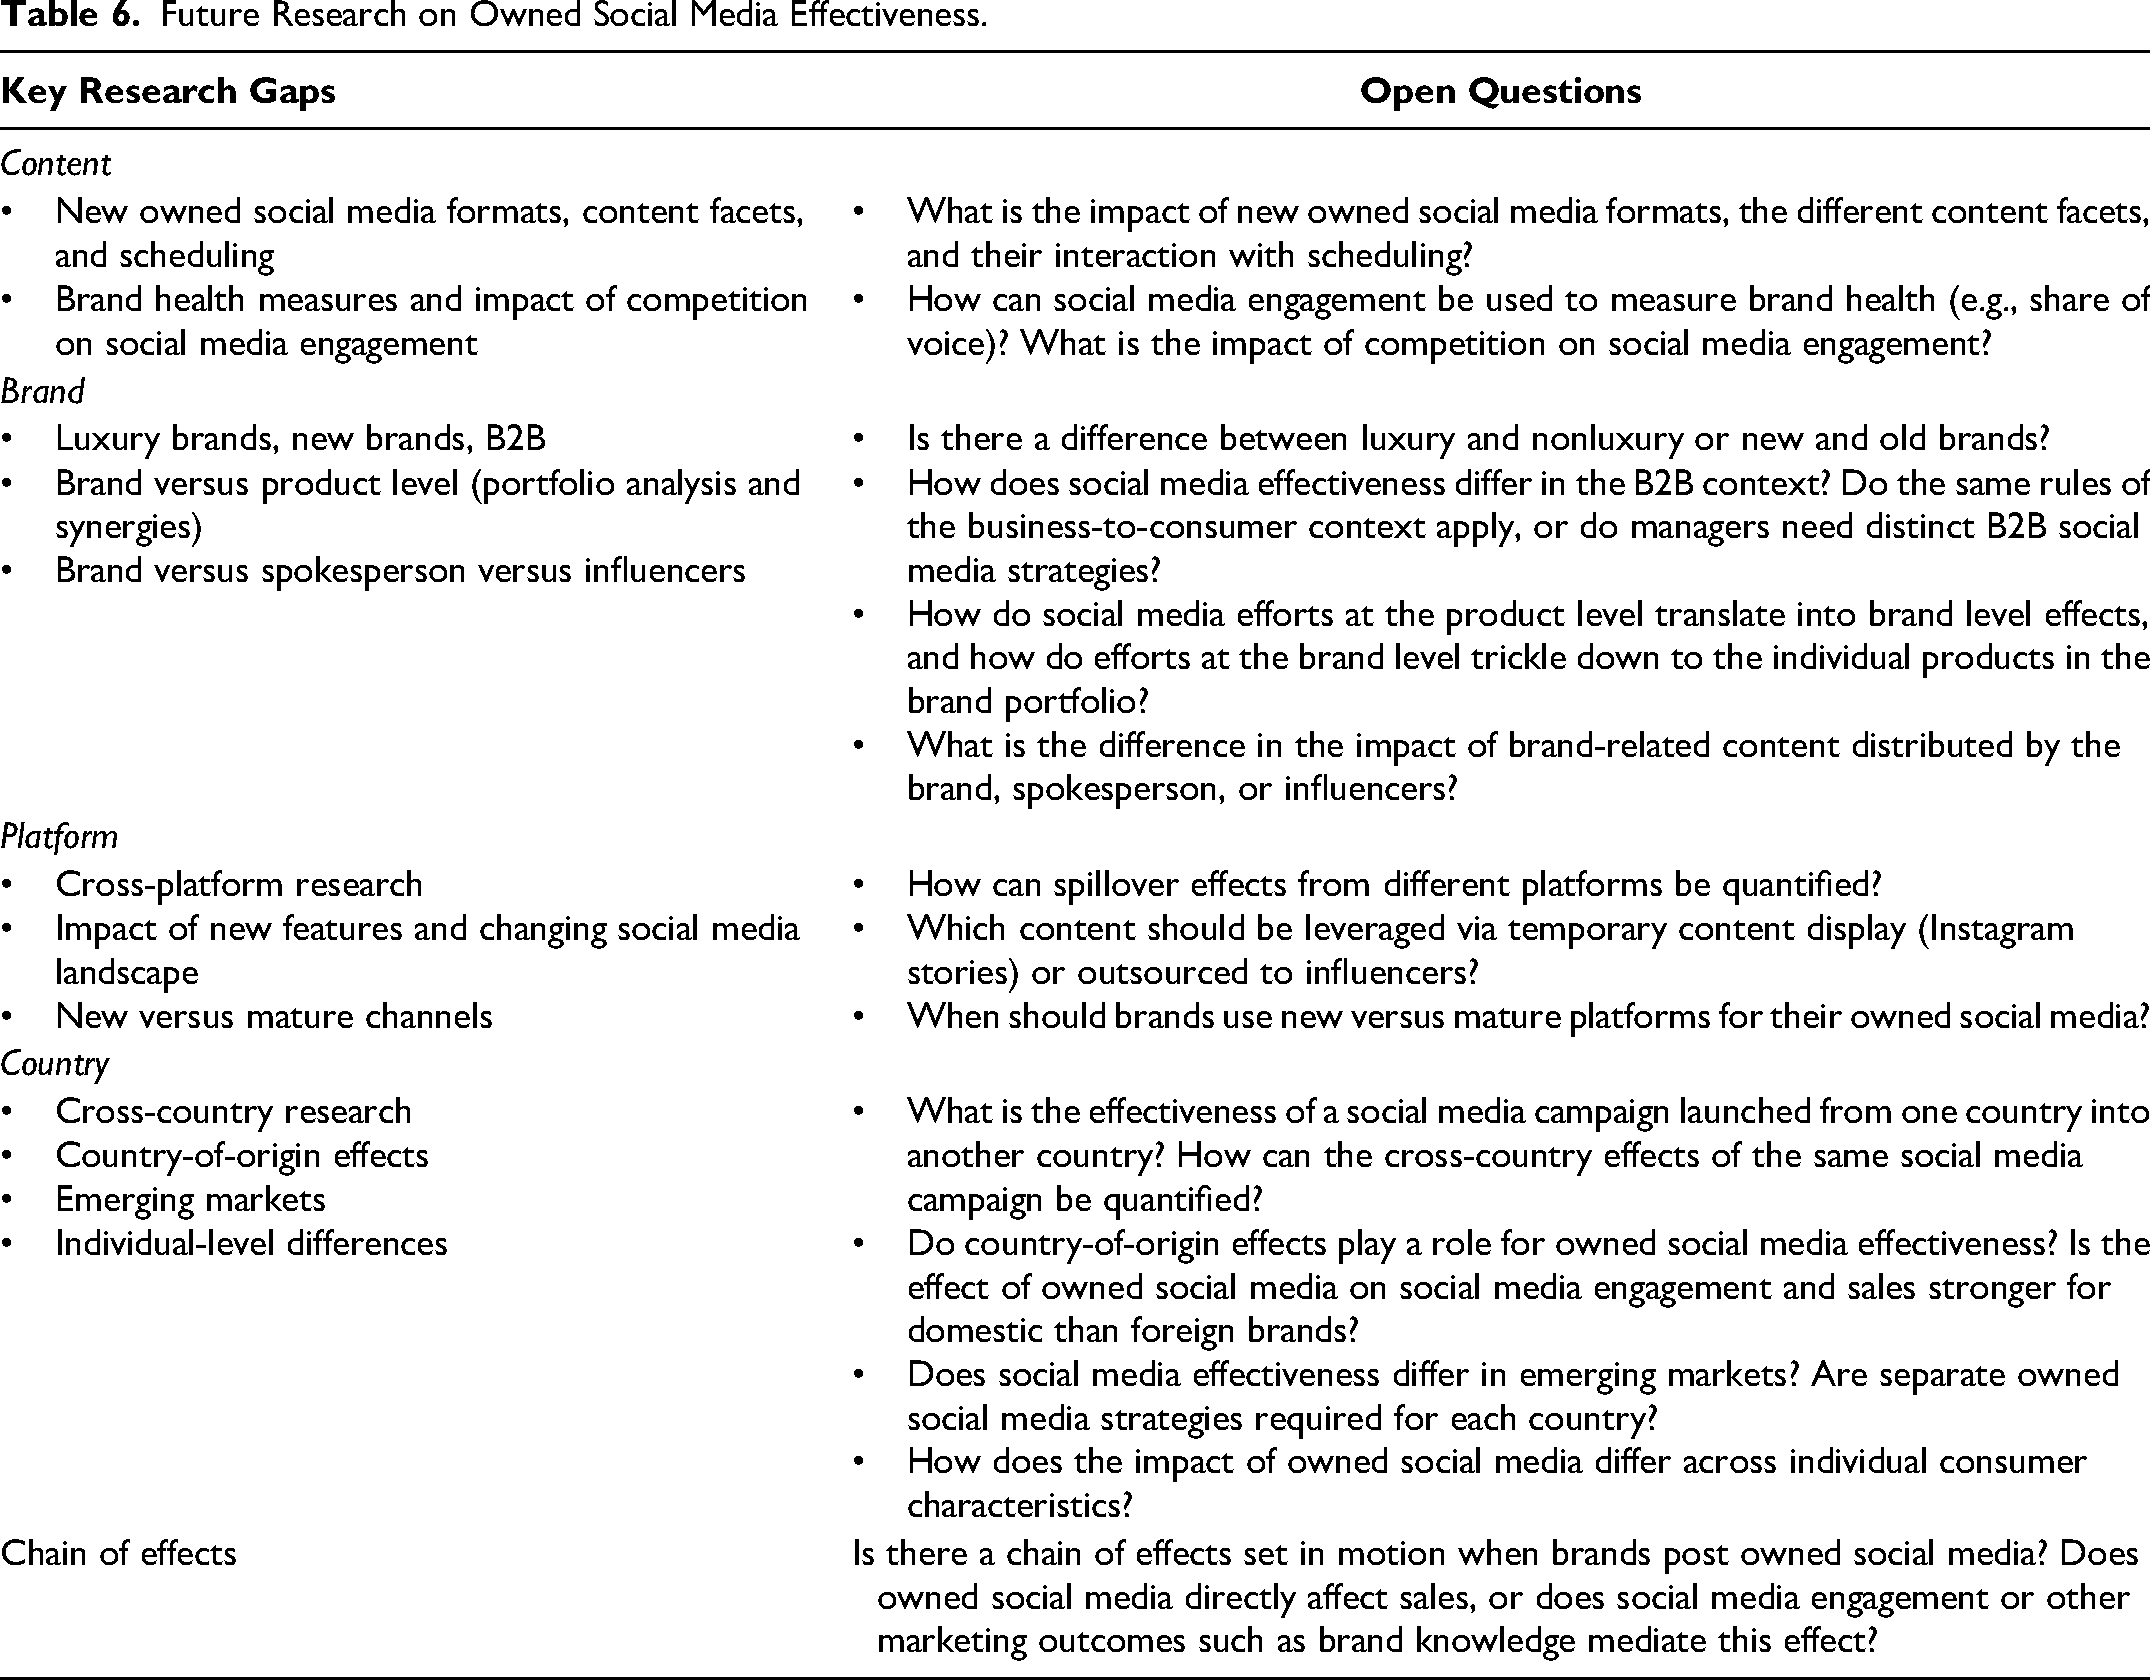
Second, examining the impact of owned social media on a broader range of marketing outcomes, such as brand health (e.g., Hanssens et al. 2014), would be highly relevant. Analyzing which brands obtain the largest share of social media engagement among a similar customer base, while accounting for the dynamic competitive setting, may improve understanding of owned social media.
Third, we found limited work that analyzed different brand types, such as luxury (e.g., Kim and Ko 2012) versus nonluxury brands or newer versus older brands. Yet these different types may differ in their use of owned social media to stimulate engagement and sales and may require very different content. Moreover, industry-specific differences deserve more research attention. We urge future studies to focus on the role of owned social media in a business-to-business (B2B) context, which is only partly covered in extant literature (e.g., Dholakia et al. 2009), as B2B firms heavily use social media to interact with their stakeholders, and insights based on business-to-consumer firms may not translate to their context.
Fourth, while we focused on brand characteristics, a more nuanced picture can be drawn by extracting information at the product level and analyzing its impact at the brand level. Social media are also home to behemoths such as Coca-Cola and Nike, which would benefit greatly from having a better understanding of how social media efforts at the product level translate into brand-level effects and how efforts at the brand level trickle down to the individual products in the brand portfolio.
Fifth, it would be useful to establish how the impact of brand-related content on engagement and sales is affected when content is distributed by the brand itself rather than a spokesperson or (macro- and micro-) influencers (Leung et al. 2022; Leung, Gu, and Palmatier 2022) to capture the different degree of official brand representation. With the role of influencers increasing, more work could focus on comparing the effectiveness (and interaction) between owned social media content and branded content posted by influencers. Influencers display brand-related content in different ways (from more functional to hedonic) and differ in terms of the number of followers (nano-, micro-, and macro-influencers) and personality type (some are followed for their knowledge and expertise [utilitarian characteristics] and some for their hedonic characteristics).
Sixth, the effect size distribution of the different platforms was not equal across variables, with most studies focusing on one platform at a time, mostly social networks. Further research could explore a more diversified set of platforms, enabling cross-platform comparisons and quantifying spillover effects from one platform to another. Moreover, studying the evolution of platforms (and their features) may shed new light on how the effectiveness of brands’ social media posts changes over time. While we find, for example, that deals are the least effective owned social media content, the use of temporary content displays (e.g., Instagram stories) may provide brands with innovative tools that allow them to expose consumers to limited-time deals. The common practice of outsourcing deals to influencers may also limit brand equity erosion.
Seventh, limited work has examined cross-country differences. Given the global scenario that most brands operate in, research could focus on cross-country effects of owned social media to determine whether country-of-origin effects play a role, by comparing domestic versus foreign brands. Furthermore, social media research in less digitally and economically advanced countries would enrich current understanding of country differences. Studies could focus on the role of owned social media in emerging markets to emphasize which levers marketers should use in such settings. Moreover, it is relevant to understand how the impact of social media content varies across different types of consumers, leveraging and testing insights from experimental research on individual-level differences.
Eighth, to uncover the underlying mechanism at play, future research should focus on the chain of effects set in motion by owned social media, considering its ability to affect brand knowledge, as well as the mediating role of engagement.
Finally, we call for more complete reporting of studies. Meta-analyses rely on published and unpublished studies from a wide list of databases and journals. Although we made every effort to include all relevant research, some works may have eluded our search or could not be used because of the lack of information to compute elasticities. We therefore call attention to the importance of full reporting and disclosure of descriptive statistics in marketing research (Grewal, Puccinelli, and Monroe 2018).
Supplemental Material
sj-pdf-1-jmx-10.1177_00222429221123250 - Supplemental material for A Meta-Analysis of the Effects of Brands’ Owned Social Media on Social Media Engagement and Sales
Supplemental material, sj-pdf-1-jmx-10.1177_00222429221123250 for A Meta-Analysis of the Effects of Brands’ Owned Social Media on Social Media Engagement and Sales by Georgia Liadeli, Francesca Sotgiu and Peeter W.J. Verlegh in Journal of Marketing
Footnotes
Acknowledgments
The authors thank the JM review team as well as Katrijn Gielens, Kelly Hewett, Koen Pauwels, Jan-Benedict Steenkamp, and the participants of the 2020 AMA Winter Academic conference in San Diego and the 2021 AMA Global SIG conference in Taormina for their constructive feedback on previous versions of the manuscript.
Associate Editor
Donald R. Lehmann
Declaration of Conflicting Interests
The author(s) declared no potential conflicts of interest with respect to the research, authorship, and/or publication of this article.
Funding
The author(s) received no financial support for the research, authorship, and/or publication of this article.
Notes
References
Supplementary Material
Please find the following supplemental material available below.
For Open Access articles published under a Creative Commons License, all supplemental material carries the same license as the article it is associated with.
For non-Open Access articles published, all supplemental material carries a non-exclusive license, and permission requests for re-use of supplemental material or any part of supplemental material shall be sent directly to the copyright owner as specified in the copyright notice associated with the article.