
Abstract
Advertising and research and development (R&D) benefit firms by increasing sales and shareholder value. However, when a firm is in bankruptcy, the cumulative effects of its past advertising and R&D can be a double-edged sword. On the one hand, they increase the firm’s expected future cash flow, which increases the likelihood that the bankruptcy court will decide the firm can survive. On the other hand, they increase the liquidation value of the firm’s assets, which decreases the likelihood that the bankruptcy court will decide that the firm can survive. The author argues that the ability of advertising and R&D to either increase or decrease bankruptcy survival is contingent on the influence that the firm’s suppliers have, relative to other creditors, on the bankruptcy court’s decision. Advertising and R&D increase (decrease) bankruptcy survival when suppliers have a high (low) level of influence. Empirical analyses, conducted on 1,504 bankruptcies, show that advertising (R&D) increases bankruptcy survival when at least 35%−38% (18%−21%) of the bankrupt firm’s debt has been borrowed from suppliers, whereas it decreases bankruptcy survival below this point. Out-of-sample machine learning validation shows that the ability to predict whether a bankrupt customer will survive is substantially improved by considering the firm’s advertising and R&D.
Bankruptcy survival (i.e., emerging from bankruptcy instead of being liquidated) is critical to not only the bankrupt firm but also stakeholders such as suppliers, customers, partners, investors, and creditors. For example, a supplier suffers if its bankrupt customer does not survive, as the supplier loses the future revenue stream from the customer, loses the value of any relationship-specific investments it has made in the customer, incurs increased costs associated with trying to replace the customer, and loses any payments that were due from the customer.
Because marketing assets comprise a large portion of the value for many firms, understanding how investments in marketing assets affect bankruptcy survival is critically important for managers. Given the prominent role that advertising and research and development (R&D) play in building a firm’s shareholder value (e.g., Joshi and Hanssens 2010; Rubera and Kirca 2012) and in protecting a firm from the risk of entering bankruptcy (Jindal and McAlister 2015), in this article I study the impact of advertising and R&D on bankruptcy survival. 1 I show that, after controlling for the financial predictors from extant bankruptcy survival research, advertising and R&D have an additional impact on bankruptcy survival.
Although one might expect advertising and R&D to increase bankruptcy survival in the same way they increase shareholder value, I argue that this is not the case. This is because, in contrast to shareholder value, bankruptcy survival is a function of the relative value that creditors expect to receive if the bankrupt firm survives versus gets liquidated. Because suppliers have greater noncontractual revenue and generally do not require collateral whereas banks have less noncontractual revenue and generally do require collateral, the value received if the bankrupt firm survives versus gets liquidated differs for suppliers versus banks. I show that the cumulative effects of a firm’s past advertising and R&D are a double-edged sword that can either increase or decrease bankruptcy survival and that this difference depends on the influence that the bankrupt firm’s suppliers have, relative to other creditors, on the bankruptcy court’s decision of whether to allow the firm to emerge from bankruptcy. If the suppliers have a large influence on the bankruptcy court’s decision, advertising and R&D increase the probability that the bankrupt firm will survive. In contrast, if the suppliers have a small influence on the bankruptcy court’s decision, advertising and R&D decrease the probability that the bankrupt firm will survive.
This research makes several contributions to marketing theory and generates actionable insights for managers. First, it contributes to the discipline’s knowledge on the value of advertising and R&D. It adds to theory on how advertising and R&D create shareholder value by showing how they can either increase or decrease bankruptcy survival. To explain how and why their impact on bankruptcy survival differs from their impact on shareholder value, I develop a conceptual framework that shows how advertising and R&D influence the bankruptcy court’s decision of whether the bankrupt firm survives versus gets liquidated.
Second, this research sheds additional light on the relationship between a firm’s marketing and finance decisions (Moorman and Rust 1999). It provides managers with insight into how their firm’s financing decisions (i.e., deciding the extent to which the firm borrows from suppliers vs. banks) influence the impact of their firm’s marketing decisions (i.e., deciding how much to spend in advertising and R&D) on bankruptcy survival.
Third, in addition to providing insight for a bankrupt firm’s marketing managers, this research provides actionable insight for marketing managers who are managing a relationship with a bankrupt customer or partner. Because the value of any relationship-specific investments would be lost if the bankrupt customer or partner does not survive, the bankruptcy filing triggers marketing managers to reassess the extent to which their firm should maintain, reduce, or enhance their investments in the relationship. For example, if marketing managers do not expect the bankrupt customer to survive, they may reduce or eliminate their investments that are specific to that customer and redeploy critical resources (e.g., sales forces) to other customers. In contrast, if marketing managers expect the customer to survive, they may maintain or even strengthen their investments in the relationship with the customer.
A key challenge marketing managers face in these scenarios is predicting whether the bankrupt customer or partner will survive. To provide insight for marketing managers in these scenarios, I use random forests machine learning to predict bankruptcy survival. The out-of-sample validation results indicate that marketing managers can improve their ability to predict whether their bankrupt customer or partner will survive by considering the firm’s advertising, R&D, and suppliers’ influence on the bankruptcy court’s decision, in addition to the usual financial predictors.
Related Literature
This research lies at the intersection of two streams of marketing research: the impact of advertising and R&D on a firm’s financial performance and marketing’s role in the context of bankruptcies. In the following subsections, I review these streams of research and discuss how the current study contributes to them.
The Impact of Advertising and R&D on Financial Performance
Marketing research shows that the cumulative effects of a firm’s past advertising and R&D generally improve the financial performance of the firm (e.g., Edeling and Fischer 2016; Jindal and McAlister 2015; Sethuraman, Tellis, and Briesch 2011). As summarized in Table 1, marketing literature has shown that advertising and R&D generally increase a firm’s sales and market share (e.g., Sethuraman, Tellis, and Briesch 2011; Steenkamp and Fang 2011) as well as shareholder value (e.g., Edeling and Fischer 2016; Rubera and Kirca 2012). Marketing research has found mixed results for advertising’s effect on stock return risk, with some studies finding that advertising decreases stock return risk (e.g., Frennea, Han, and Mittal 2019) and others finding that advertising increases stock return risk (Osinga et al. 2011). Marketing literature has also shown that R&D decreases stock return risk (e.g., McAlister, Srinivasan, and Kim 2007) and that advertising and R&D reduce a firm’s risk of entering bankruptcy (Jindal and McAlister 2015).
Marketing Literature on Financial Outcomes of Advertising and R&D.

Marketing theory argues that advertising and R&D increase a firm’s shareholder value by enhancing, accelerating, reducing the volatility of, and reducing the vulnerability of the firm’s expected future cash flows (Srivastava, Shervani, and Fahey 1998). In the current research, I build on this theory to develop conceptual arguments for how advertising and R&D affect the relative value creditors expect to receive if the bankrupt firm survives versus gets liquidated and, consequently, creditors’ votes on whether the bankruptcy court should allow the bankrupt firm to survive.
Marketing’s Role in the Context of Bankruptcies
In contrast to the wide body of marketing literature on the financial outcomes of advertising and R&D, there has been relatively little marketing research on bankruptcies. A contribution of the current article is that it builds on an emerging stream of research that studies marketing’s role in the context of bankruptcies (Table 2). Research in this area has shown how marketing variables can influence a firm’s risk of entering bankruptcy and how a rival entering bankruptcy affects marketing reactions of other firms in the industry. This research has shown that the mechanisms through which advertising and R&D protect a firm from the risk of entering bankruptcy differ from the mechanisms through which they build shareholder value (Jindal and McAlister 2015), that ability- and motivation-influencing governance mechanisms influence bankruptcy risk spillover between franchisors and franchisees (Antia, Mani, and Wathne 2017), that prices increase after a rival enters bankruptcy (Özturk, Venkataraman, and Chintagunta 2016), and that sales decrease after a rival enters bankruptcy (Özturk, Chintagunta, and Venkataraman 2019).
Marketing Literature on Bankruptcy.
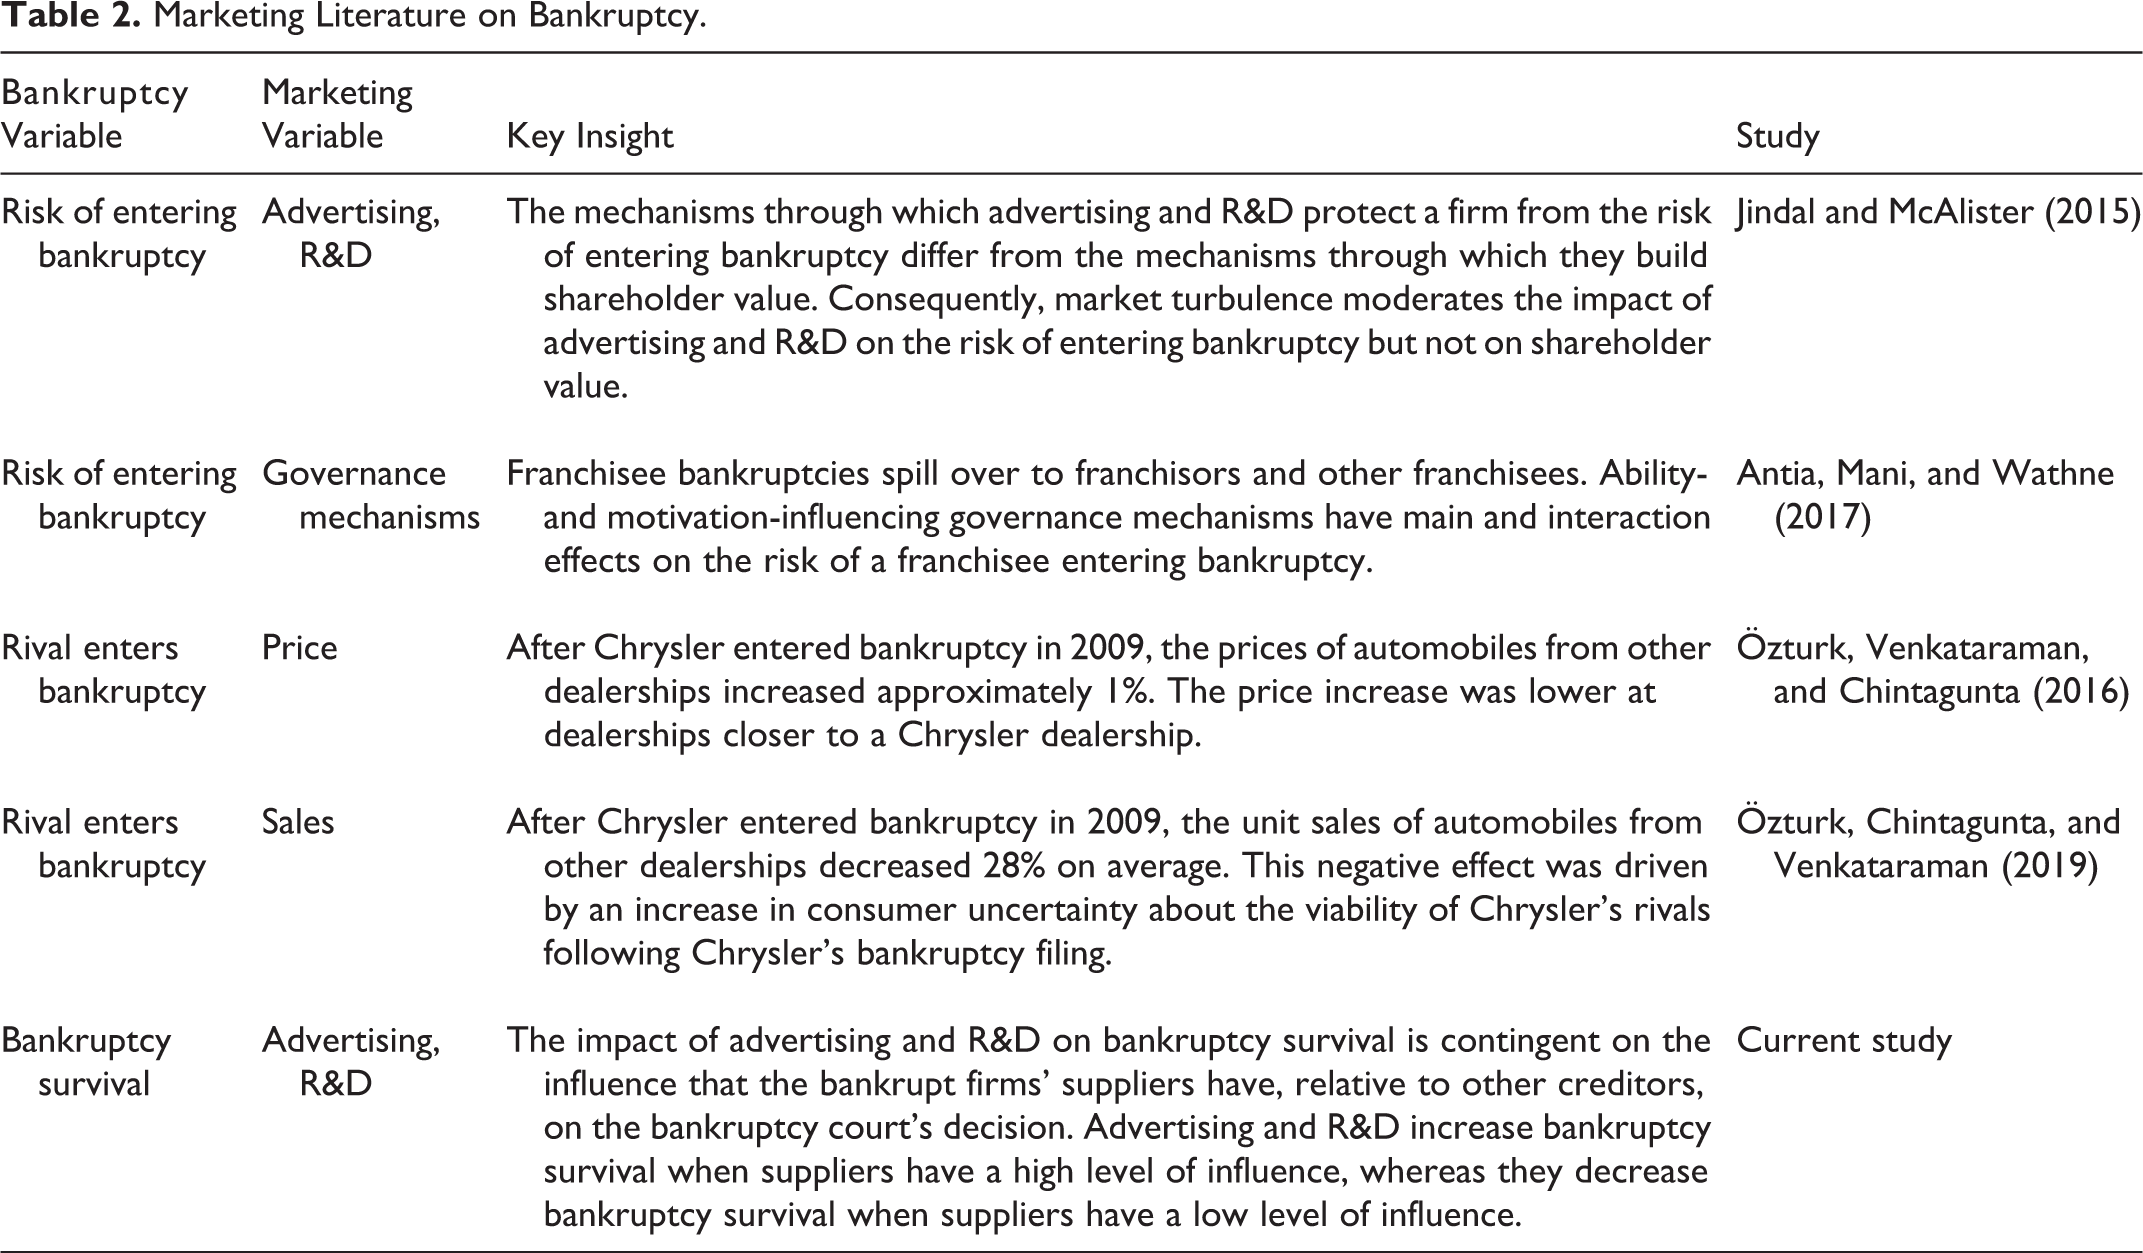
Whereas extant marketing research has focused solely on antecedents and consequences of entering bankruptcy, the current article adds to this stream of research by studying marketing’s role in exiting (i.e., surviving) bankruptcy. Because the risk of entering bankruptcy is very different from surviving bankruptcy, marketing’s role in these two scenarios differs. The risk of entering bankruptcy is the risk that the firm will not generate enough cash in the near term to pay its financial and operating commitments (Beaver 1966; D’Aveni and Ilinitch 1992). Advertising and R&D have been shown to reduce this risk by enhancing a firm’s expected near-term cash flow (Jindal and McAlister 2015).
In contrast, bankruptcy survival is the probability that the bankruptcy court will decide to approve the bankrupt firm to emerge from bankruptcy. Unlike the risk of entering bankruptcy, bankruptcy survival is a function of the relative value that creditors expect to receive if the bankrupt firm survives versus gets liquidated, and these expected values differ for creditors that are suppliers versus banks (Evans and Koch 2007). In the next section, I review the bankruptcy process, and in the following section I develop conceptual arguments for how advertising and R&D affect bankruptcy survival. I show that the cumulative effects of a bankrupt firm’s past advertising and R&D are a double-edged sword that can either increase or decrease bankruptcy survival and that this difference depends on the influence that the bankrupt firm’s suppliers have, relative to other creditors, on the bankruptcy court’s decision.
Bankruptcy Survival
A firm that does not have sufficient funds to pay its financial commitments can enter bankruptcy (i.e., file for Chapter 11 in a U.S. bankruptcy court) to seek court protection from creditors’ collection efforts. After a firm enters bankruptcy, it submits a debt reorganization plan to the court that outlines how the firm will pay back its creditors. If the bankruptcy court approves the plan, the firm survives (i.e., it emerges from bankruptcy and pays back its creditors from the proceeds of its future earnings according to the approved debt reorganization plan). If the bankruptcy court does not approve the plan, the firm does not survive (i.e., its assets are liquidated and the creditors are paid back from the proceeds of the liquidation sale).
The bankruptcy court’s decision of whether to approve the firm’s debt reorganization plan is based on the court’s judgment of whether the creditors will receive more if the firm survives rather than is liquidated. To aid the court’s decision, the bankruptcy court requests each creditor to vote on whether the court should accept the plan (and let the firm survive) or reject the plan (and order the firm to be liquidated). The details of this process, which are specified in the United States Bankruptcy Code, are summarized in the “Chapter 11 Bankruptcy” section in the Web Appendix. In brief, creditors play the primary role in influencing the court’s decision.
Creditors who will receive less than the full value owed to them or whose payment terms are modified under the debt reorganization plan are entitled to vote on the plan. Creditors who will receive the full value owed to them under the original payment terms are deemed to have accepted the plan. After the votes are tallied, the bankruptcy court determines whether to approve the plan. The court considers whether the plan is feasible, legal, not likely to be followed by liquidation, and not likely to need further debt reorganization. Furthermore, the bankruptcy court assesses whether the expected value creditors receive under the plan is at least as large as the expected value that would be received if the bankrupt firm’s assets were liquidated.
If the plan meets these criteria and all classes of creditors (e.g., banks, suppliers) have accepted the plan, the bankruptcy court will approve the plan, and the bankrupt firm will emerge from bankruptcy. Otherwise, the bankruptcy court generally orders a liquidation sale of the bankrupt firm’s assets. Although the law allows the bankruptcy court to approve the debt reorganization plan even if one or more classes do not accept the plan (as long as the plan does not unfairly discriminate and is fair and equitable), this is uncommon in the cases of large public firms (LoPucki and Whitford 1993).
Creditor Priority
Not all creditors are treated equally in bankruptcy. A creditor’s priority determines the payment it is entitled to if the bankrupt firm is liquidated. Bankruptcy law favors creditors that have a secured debt contract (i.e., a debt contract that was secured with one or more of the bankrupt firm’s assets as collateral). These creditors receive the full proceeds from liquidating the assets used as collateral. Bankruptcy law places a lower priority on claims from an unsecured debt contract (i.e., a debt contract that was not secured with an asset as collateral). A creditor that has an unsecured debt contract is entitled to a portion of the liquidation value of only the bankrupt firm’s assets that were not used as collateral with other creditors. In practice, the proceeds from liquidation received by creditors that have an unsecured debt contract are generally substantially lower than the amount due to the creditor (Evans and Koch 2007).
Creditor Roles
Creditors have two primary roles in bankruptcy. Their first role is to work with the bankrupt firm to develop the debt reorganization plan. This includes specifying the terms, time frames, and conditions for how the debt will be repaid. In some instances, this may also include a plan that forgives a portion or all of the debt. The bankrupt firm has the incentive to work closely with its creditors to increase the likelihood that the creditors will vote to approve the plan and let the firm survive. Creditors have the incentive to work closely with the bankrupt firm to negotiate a plan that best benefits them.
The second role of creditors in bankruptcy is to vote on whether they accept the bankrupt firm’s debt reorganization plan. Each creditor’s vote is influenced by their expected contractual payment under the plan and their noncontractual revenue from the bankrupt firm (Evans and Koch 2007; Wilner 2000). For example, if a supplier had provided the bankrupt firm 30 days to make payment on a $100 purchase, the supplier’s contractual payment due is $100. The debt reorganization plan may state that the bankrupt firm will pay this $100 over the next 18 months after the firm emerges. When forming expectations of their contractual payment under the plan, the supplier would assess the risk that the bankrupt firm will not be able to make some or all of this $100 payment and the risk that the payment will be delayed past 18 months. The supplier would also consider its noncontractual revenue from the bankrupt firm, which is the future cash flow the supplier expects to receive if the bankrupt firm emerges that is above and beyond the $100 payment stipulated in its credit contract (often referred to as “quasi-rents” [Evans and Koch 2007]). The supplier’s noncontractual revenue is influenced by its expectations of the bankrupt firm’s future cash flows. 2
The Impact of Advertising and R&D on Bankruptcy Survival
Advertising raises customer awareness of a firm’s offerings and communicates the firm’s point of difference, which support the development of the firm’s intangible assets (e.g., brands, customer relationships, channel relationships). For example, the cumulative effect of a firm’s past advertising contributes to the firm’s brand equity by building a network of strong, favorable, and unique associations in customers’ minds that differentiate the firm and its offerings (Keller 1993). The intangible assets built through advertising enhance the firm’s expected future cash flows and increase the firm’s shareholder value (McAlister et al. 2016; Srivastava, Shervani, and Fahey 1998).
R&D enables a firm to develop processes, technologies, and products (goods and services) that meet customer preferences and differentiate the firm. The cumulative effect of a firm’s past R&D supports the development of intangible assets such as intellectual property and patents. The intangible assets built through R&D enhance the firm’s expected future cash flows and increase the firm’s shareholder value (e.g., Rubera and Kirca 2012).
Advertising and R&D affect bankruptcy survival by influencing creditors’ votes on whether the bankrupt firm should survive or be liquidated. Because the cumulative effects of a firm’s past advertising and R&D increase the firm’s expected future cash flows, they increase the noncontractual revenue that creditors expect to receive if a bankrupt firm survives. Furthermore, by enhancing the value of a bankrupt firm’s assets that would be sold off in a liquidation (e.g., brands, trademarks, customer lists, intellectual property, patents), 3 advertising and R&D also increase the proceeds that creditors expect to receive if the bankrupt firm is liquidated. Because advertising and R&D increase the value to creditors both if the bankrupt firm survives and if the bankrupt firm is liquidated, their impact on creditors’ votes—and consequently bankruptcy survival—depends on the relative value that advertising and R&D create for creditors if the bankrupt firm survives versus is liquidated.
The Impact of Advertising and R&D on Bankruptcy Survival Differs Between Suppliers and Banks
Suppliers differ from banks on two key attributes that are relevant to the impact of advertising and R&D on bankruptcy survival. First, suppliers tend to have greater noncontractual revenue with a business customer than do banks (Wilner 2000). Suppliers receive revenue from a business customer primarily by selling products to the customer, not by collecting interest from the supplier debt contract with the customer. In contrast, banks primarily receive revenue from a business customer from the interest that is specified in the bank debt contract with the customer, not by selling products to the customer.
Second, suppliers generally do not require a business customer to provide assets as collateral, whereas banks generally do (Evans and Koch 2007). 4 Suppliers do not require collateral because a supplier can protect itself by threatening to stop the supply of goods if the business customer does not meet the terms of its credit contract (Petersen and Rajan 1997). In contrast, a bank provides the full amount of the loan to the customer upfront and therefore is unable to protect itself in a similar manner. A bank requires collateral to give it the protection to seize those assets that were pledged as collateral if the business customer does not meet the terms of its contract with the bank. Consequently, banks generally require that their business loans are secured with collateral (Bradley and Roberts 2015; Chava and Roberts 2008).
Because of these differences between suppliers and banks, advertising and R&D have a differential effect on whether suppliers and banks vote to accept the bankrupt firm’s debt reorganization plan. In the following subsections, I first develop conceptual arguments for how advertising and R&D influence suppliers’ votes on the bankrupt firm’s debt reorganization plan and then develop arguments for how they influence banks’ votes. I then propose hypotheses for how the impact of advertising and R&D on bankruptcy survival is contingent on the suppliers’ influence on the bankruptcy outcome (Figure 1).

Conceptual framework for the impact of advertising and R&D on bankruptcy survival.
Advertising and R&D Increase the Likelihood of Suppliers Voting for the Bankrupt Firm to Survive
Advertising and R&D increase the likelihood that suppliers will vote for the bankrupt firm to survive (i.e., vote to accept the bankrupt firm’s debt reorganization plan) for three reasons. First, advertising and R&D increase the noncontractual revenue that suppliers expect to receive if the firm emerges from bankruptcy. If the bankrupt firm is not approved to survive, suppliers would lose this expected future revenue.
Second, although advertising and R&D also increase the liquidation values of the bankrupt firm’s assets, suppliers generally receive minimal payment from liquidation due to their unsecured debt contracts having a lower priority than banks’ secured debt contracts (Evans and Koch 2007). Therefore, the impact of advertising and R&D on the payment that suppliers expect to receive is generally smaller if the bankrupt firm is liquidated than if it survives. Third, advertising and R&D increase a firm’s point of differentiation. To the extent that the bankrupt firm’s differentiation is due in part to products (goods, services, raw materials, or other inputs) from suppliers, suppliers are better positioned than banks to enforce any repayment agreements in the debt reorganization plan. Unlike banks, suppliers can credibly enforce payment through the threat of stopping the supply of products that are critical for the firm’s differentiation (Petersen and Rajan 1997).
Advertising and R&D Increase the Likelihood of Banks Voting for the Bankrupt Firm to Liquidate
All else being equal, advertising and R&D increase the likelihood that banks will vote for the bankrupt firm to be liquidated (i.e., vote to reject the bankrupt firm’s debt reorganization plan) for three reasons. First, advertising and R&D increase the liquidation values of the bankrupt firm’s assets. Because banks’ secured debt contracts have a higher priority in liquidation, advertising and R&D increase the likelihood that banks will receive the full amount of payments that are due to them if the firm is liquidated. Second, although advertising and R&D increase the noncontractual revenue that suppliers expect to receive if the bankrupt firm survives, banks tend to have less (and in some cases no) noncontractual revenue that would be lost if the bankrupt firm does not survive. Third, unlike its effect on suppliers, advertising and R&D do not improve banks’ ability to enforce repayment agreements in the debt reorganization plan. Banks face a higher risk from letting the bankrupt firm make repayments from future earnings and a lower risk from receiving repayments from the immediate liquidation of the bankrupt firm’s assets.
Resolving the Conflict that Advertising and R&D Create Between Suppliers and Banks
Because advertising and R&D have differential effects on suppliers’ and banks’ votes, they create a conflict between them in the bankruptcy process. This conflict results in the suppliers and banks either (1) negotiating a compromise and working with the bankrupt firm to develop a debt reorganization plan they both approve or (2) submitting opposing votes to the bankruptcy court. The resolution of the conflict is contingent on the portion of the bankrupt firm’s debt that is owed to its suppliers (what the finance literature refers to as the firm’s “supplier debt ratio,” or the ratio of the firm’s supplier debt to the firm’s total debt from suppliers and banks [Gilson, John, and Lang 1990]).
If a large portion of the bankrupt firm’s debt is due to suppliers, then suppliers have a large influence on the bankruptcy outcome because they can influence banks’ votes by making sufficient concessions to banks when negotiating the debt reorganization plan. For example, the bankrupt firm’s supplier debt may be large enough that suppliers can agree to a plan that allows the banks to be fully paid in cash immediately, to reduce their risk, while suppliers get paid over a longer period of time after the firm emerges from bankruptcy. Indeed, research shows that suppliers are more likely than banks to allow a bankrupt firm to reduce or delay its debt repayments (Evans and Koch 2007; Wilner 2000). However, if suppliers have a small influence (i.e., only a small portion of the bankrupt firm’s debt is due to suppliers), then suppliers do not have the ability to influence banks’ votes because they are not owed large amounts that enable them to make sufficient concessions to the banks when negotiating the debt reorganization plan.
In summary, advertising and R&D have differential effects on suppliers’ and banks’ votes. Advertising and R&D increase the likelihood that suppliers will vote to accept the plan. Their impact on the banks’ vote, however, is contingent on the suppliers’ influence. If suppliers have sufficient influence to negotiate a favorable plan for the banks, advertising and R&D increase the likelihood that suppliers will make concessions so that banks will vote to accept the plan and allow the bankrupt firm to survive. If the suppliers do not have sufficient influence to negotiate a favorable plan for the banks, advertising and R&D increase the likelihood that the banks will vote against the plan and that the bankrupt firm will be liquidated. Thus,
Empirical Methodology
To test my hypotheses, I specify bankruptcy survival models that are functions of the bankrupt firm’s advertising, R&D, suppliers’ influence, and control variables found to influence bankruptcy survival in prior literature. In this section, I first present the measures I use for each of the variables. Then, I specify the bankruptcy survival models and describe the data set assembled to estimate the models.
Dependent Variable
The variable Survivali is a nominal variable that is set to 1 if bankrupt firm i survived bankruptcy (i.e., emerged) and 0 if bankrupt firm i did not survive bankruptcy (i.e., it was liquidated). The variable Survivali is set to −1 if the court dismissed bankrupt firm i’s case without either approving the debt reorganization plan or ordering liquidation and −2 if bankrupt firm i’s case is still ongoing (i.e., its outcome is not yet known). 5 As subsequently discussed, I model bankruptcy survival using a logit analysis and a competing risks analysis. The logit analysis uses only the two cases in which Survivali equals 1 (survived) or 0 (liquidated).
Predictor Variables
Consistent with extant bankruptcy survival research, the predictor variables are measured using data from the firm’s most recent financial report prior to its bankruptcy filing (Dahiya et al. 2003; Denis and Rodgers 2007).
Advertising, R&D
The variables Advertisingi and R&Di represent the cumulative effects of bankrupt firm i’s past advertising and R&D, respectively. Following extant marketing literature, I calculate Advertisingi as advertising stock divided by assets and R&Di as R&D stock divided by assets for bankrupt firm i (Jindal and McAlister 2015; Martin et al. 2018). Advertising stock is measured as a Koyck-type (i.e., geometric) distributed lag function of annual advertising expenditures with a decay parameter of .60 and R&D stock is measured as a Koyck-type distributed lag function of annual R&D expenditures with a decay parameter of .80. 6
Because the U.S. Security and Exchange Commission requires firms to disclose material advertising expenditures and the FASB (Financial Accounting Standards Board) requires firms to disclose material R&D expenditures, I assume that when a firm does not disclose its spending in these areas, its expenditures in advertising or R&D are, or are close to, zero. 7 Consequently, I set missing values of advertising and R&D expenditures to zero to reduce sample selection bias. I test the robustness of this assumption by subsequently reporting results in which missing values are set to alternative values and in which the models are estimated on the subset of the data that does not include missing values for advertising and R&D.
Suppliers’ influence
The variable Supplier influencei represents the suppliers’ influence on the bankruptcy court’s decision of whether to allow the firm to emerge from bankruptcy. Because the suppliers’ influence depends on the amount the bankrupt firm owes to suppliers versus other creditors, Supplier influencei is measured as the percentage of bankrupt firm i’s debt that is owed to suppliers. Following extant finance literature, I calculate Supplier influencei using the supplier debt ratio, which is accounts payable divided by total liabilities for bankrupt firm i (Evans and Green 2000; Gilson, John, and Lang 1990). A Supplier influencei value of .10 indicates that 10% of bankrupt firm i’s debt is owed to suppliers. The value of Supplier influencei that is sufficient to affect the bankruptcy court’s decision is not a predetermined fixed value (e.g., 50%) but is an empirical question.
Control variables
Extant bankruptcy survival research has shown that a bankrupt firm’s leverage, liquidity, profit, size, and industry affect bankruptcy survival (see the “Bankruptcy Survival Literature” section in the Web Appendix). Therefore, I control for each of these variables in my models. I summarize each of the variables and their measures in Table 3.
Variable Measures, Descriptive Statistics, and Correlation Matrix.
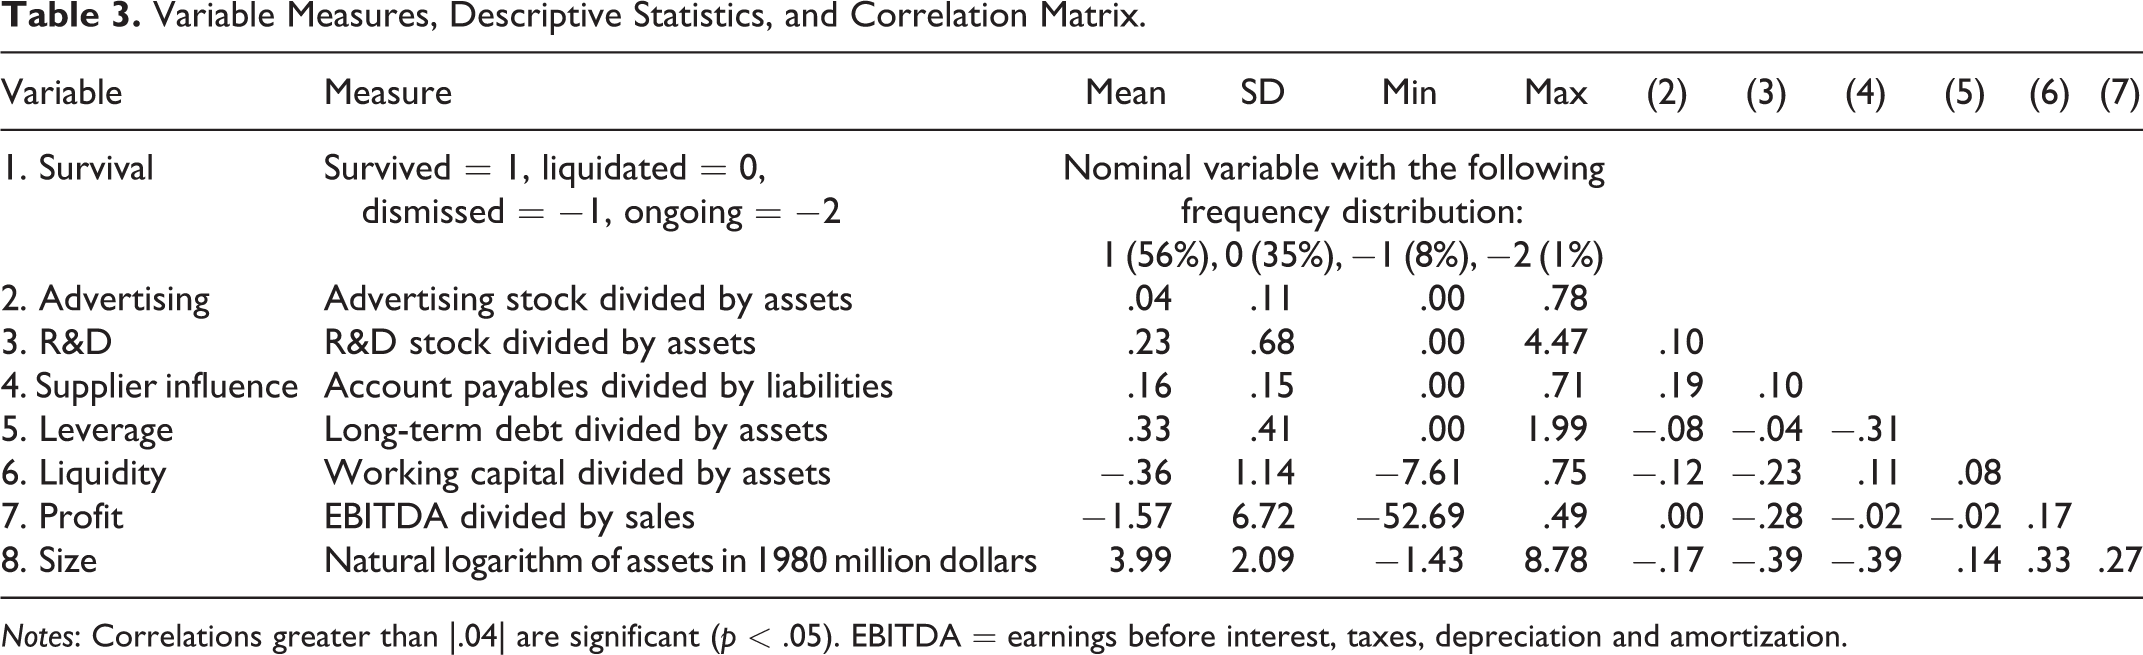
Notes: Correlations greater than |.04| are significant (p < .05). EBITDA = earnings before interest, taxes, depreciation and amortization.
Bankruptcy Survival Models
To test my hypotheses, I model bankruptcy survival as a function of advertising, R&D, suppliers’ influence, firm control variables that have been used in prior bankruptcy survival research, industry dummy variables, and year dummy variables.
Bankruptcy survival logit model
Because bankruptcy survival can be viewed as a binary outcome (survival or liquidation), recent research on bankruptcy survival uses logit or probit models (Campbell 1996; Casey, McGee, and Stickney 1986; Dahiya et al. 2003; Denis and Rodgers 2007; LoPucki and Doherty 2015). 8 Therefore, I model a bankrupt firm’s survival probability using the following logit model specification. 9

where pi ≔ Pr(Survivali = 1) is the probability that bankrupt firm i will survive, and
While the logit model distinguishes between bankrupt firms that survive versus those that are liquidated, it has two limitations in the context of bankruptcy survival. First, bankruptcy cases that were dismissed are eliminated from the analysis because they neither survived nor were liquidated (e.g., Denis and Rodgers 2007). 10 Second, although the logit model distinguishes between bankrupt firms that survive versus those that are liquidated, the model treats all bankrupt firms that survive as having the same outcome. However, because the duration of time that a firm spends in bankruptcy can be costly to the firm, surviving bankruptcy after a shorter amount of time in bankruptcy may be more valuable than after a longer amount of time (Bris, Welch, and Zhu 2006; Franks and Torous 1989). In my data set, there is substantial variation in the length of time a firm spends in bankruptcy, with durations ranging from less than six months to over eight years (see the “Bankruptcy Duration” section in the Web Appendix). Therefore, in the next subsection I also model a bankrupt firm’s hazard of surviving, which accounts for both whether the bankrupt firm survived and the duration of time the firm spends in bankruptcy (Bowman 2004). 11
Bankruptcy survival competing risks model
In a context such as bankruptcy survival, which has three different outcomes (survived, liquidated, and dismissed), traditional hazard models treat the cases in which the bankrupt firm does not survive as censored, which biases results. That is, a bankrupt firm that is liquidated or dismissed would be incorrectly treated as a firm that would later survive bankruptcy, even though that is impossible. Therefore, I use a competing risks model to account for the fact that liquidation and dismissed are competing outcomes that prevent bankruptcy survival from occurring altogether.
The bankruptcy survival subdistribution hazard function is expressed as

where t is the length of time since entering bankruptcy, Ti, survival is a random variable for the length of time to bankruptcy survival, and Ti, survival’ is a random variable for the length of time to a competing event (liquidation, dismissal) for firm i. Therefore, hi(t) gives the instantaneous rate of surviving bankruptcy for firm i at time t given that the firm has not already emerged from bankruptcy (i.e., survived) or has been liquidated or had its case dismissed. I use this subdistribution hazard function to specify the bankruptcy survival competing risks model as
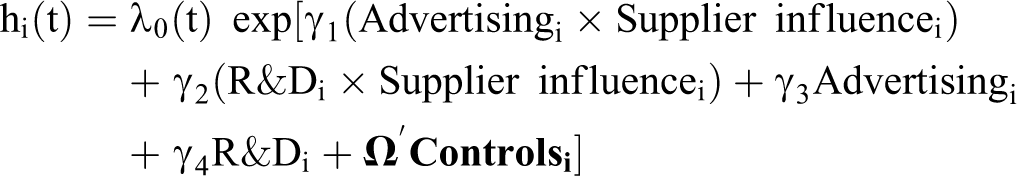
where λ0(t) is an unspecified baseline survival subdistribution hazard function (Fine and Gray 1999). Positive coefficient estimates indicate that the associated predictor increases the “hazard” of surviving bankruptcy. A positive and significant estimate for γ1 would support H1 and a positive and significant estimate for γ2 would support H2.
Identification
My objective is to identify the causal effects of advertising and R&D on bankruptcy survival. This requires that Advertisingi and R&Di are exogenous in the bankruptcy survival models. Because variables that influence bankruptcy survival might also be correlated with advertising or R&D, I include control variables that have been shown to influence bankruptcy survival in prior literature. There are other variables that are unobserved which also influence bankruptcy survival (e.g., macroeconomic conditions, industry conditions, the firm’s relationships with its creditors). If these variables are correlated with advertising or R&D, omitting them may result in issues of endogeneity (e.g., Wooldridge 2002). Therefore, I adopt two approaches to establish the causal links for advertising and R&D with bankruptcy survival.
First, I include industry and year dummy variables to the models to capture unobserved industry and macroeconomic effects. Second, I specify the models with instrumental variables to account for the possibility that there may be unobserved firm characteristics that affect bankruptcy survival that may be correlated with advertising or R&D. Standard instrumental variables approaches for linear models, such as two-stage least squares, would provide inconsistent results for my nonlinear models (Abrevaya, Hausman, and Khan 2010). Therefore, I use a control function approach, which has been used in extant nonlinear marketing models (e.g., Jindal and McAlister 2015).
Following recent literature (Jindal and McAlister 2015; Sridhar et al. 2016; Srinivasan, Wuyts, and Mallapragada 2018), I use the competitor-average advertising (the average advertising for other firms that operate in the same industry), the competitor-average R&D (the average R&D for other firms that operate in the same industry), and their interactions with Supplier influencei to obtain four instruments. For the instruments to be valid, they must be relevant and exogenous. Competitor-average advertising and competitor-average R&D are exogenous because they should not affect other omitted variables that might be correlated with advertising or R&D (e.g., the firm’s relationships with its creditors). I find that the coefficient estimates for the associated instruments in each of the first-stage regressions are significant (p < .01), indicating that the instruments are relevant.
Data
To estimate the models, I create a data set that combines a firm’s bankruptcy data with the firm’s financial data. I obtain bankruptcy data from New Generation Research’s BankruptcyData database, which has been used in finance (Jiang, Li, and Wang 2012), accounting (Demers and Joos 2007), management (Houston, Lin, and Zhu 2016), and law (Cole 2002) research. I extract financial data from Standard & Poor’s Capital IQ Compustat database.
I Winsorize all continuous variables at the 99% level to reduce the influence of outliers. Observations higher than the 99th percentile of each variable are set to the 99th percentile value, and observations lower than the 1st percentile of each variable are set to the 1st percentile value. 12 The data set has 1,672 bankruptcy cases for public firms that filed under Chapter 11 of the U.S. Bankruptcy Code from January 1, 1996 to November 8, 2019. 13 The data set has 934 (56%) firms that survived bankruptcy (i.e., they emerged from bankruptcy), 577 (35%) firms that did not survive bankruptcy (i.e., they were liquidated), 139 (8%) firms that had their bankruptcy case dismissed, and 22 (1%) firms that do not have an outcome because their bankruptcy case is still ongoing. 14 I present the details of the process used to assemble the data set and the procedure used to control for potential sample selection bias in the “Data Sample” section in the Web Appendix.
The correlation matrix and descriptive statistics are presented in Table 3. To diagnose multicollinearity, I compute variance inflation factors, condition indices, and correlations. The maximum variance inflation factor is 1.63, which is below the “rule of thumb” of 10 (Marquardt 1970), and the maximum condition index is 10.33, which is below the “rule of thumb” of 30 (Belsley, Kuh, and Welsch 1980), suggesting that multicollinearity is not a problem. I estimate the models using the 1,504 bankruptcies from 1996 to 2015 and use the 168 bankruptcies from 2016 to 2019 for out-of-sample bankruptcy survival prediction validation. The logit model is estimated on the subsample of data for which the bankruptcy cases are not dismissed or ongoing (1,371 bankruptcy cases from 1996 to 2015). Further details on the data set, including descriptive statistics by bankruptcy outcome, number of bankruptcies by year, average value of assets in bankruptcy by year, and number of bankruptcies by industry, are presented in the “Additional Data Information” section in the Web Appendix.
Estimation Results
In Table 4, I present the estimation results for four models: a baseline logit model that does not include the interaction terms (i.e., β1 = β2 = 0), the bankruptcy survival logit model, a baseline competing risks model that does not include the interaction terms (i.e., γ1 = γ2 = 0), and the bankruptcy survival competing risks model.
The Impact of Advertising and R&D on Bankruptcy Survival is Contingent on Supplier Influence.

*p < .10.
**p < .05.
***p < .01.
Notes: Standard errors are in parentheses. AIC = Akaike information criterion.
Key Predictor Variables
I find that the coefficient estimates for the interaction between advertising and supplier influence are positive and significant (β1 = 31.28, p < .01; γ1 = 19.11, p < .01), providing support for H1: advertising’s impact on bankruptcy survival is contingent on supplier influence. I also find that the coefficient estimates for the interaction between R&D and supplier influence are positive and significant (β2 = 6.67, p < .01; γ1 = 3.23, p < .05), providing support for H2: R&D’s impact on bankruptcy survival is contingent on supplier influence.
The coefficient estimates for advertising and R&D are negative. The coefficient estimates in Table 4, Columns I and III, are for the average impact of advertising and R&D on bankruptcy survival, without controlling for their contingencies on supplier influence, and the coefficient estimates in Columns II and IV are for the impact of advertising and R&D on bankruptcy survival when Supplier influence equals zero (i.e., when there is no debt that is owed to suppliers). The negative and significant coefficient estimates in Columns II and IV provide support for my argument that when suppliers have no influence, advertising and R&D decrease bankruptcy survival.
The coefficient estimates show that the boundary between the regions of monotonicity and nonmonotonicity for advertising (i.e., the crossover point where advertising switches from increasing to decreasing bankruptcy survival) is Supplier influencei = .35 (11.00 ÷ 31.28) in the logit model and Supplier influencei = .38 (7.24 ÷ 19.11) in the competing risks model. This indicates that advertising increases bankruptcy survival for a firm that owes more than 35%−38% of its debt to suppliers, whereas it decreases bankruptcy survival for a firm that owes less than 35%−38% of its debt to suppliers, providing further support for H1: advertising increases bankruptcy survival when supplier influence is high, whereas it decreases bankruptcy survival when supplier influence is low.
The boundary between the regions of monotonicity and nonmonotonicity for R&D is Supplier influencei = .18 (1.18 ÷ 6.67) in the logit model and Supplier influencei = .21 (.69 ÷ 3.23) in the competing risks model. This indicates that R&D increases bankruptcy survival for a firm that owes more than 18%−21% of its debt to suppliers, whereas it decreases bankruptcy survival for a firm that owes less than 18%−21% of its debt to suppliers, providing further support for H2: R&D increases bankruptcy survival when supplier influence is high, whereas it decreases bankruptcy survival when supplier influence is low.
Control Variables
The results indicate that leverage increases bankruptcy survival, which is consistent with findings in some previous studies (Denis and Rodgers 2007; LoPucki and Doherty 2015) but differs from the insignificant effect found in other studies (Dahiya et al. 2003). The results indicate that liquidity decreases bankruptcy survival, which is consistent with findings in prior literature (Dahiya et al. 2003). The results also indicate that profitability does not significantly influence bankruptcy survival, which is consistent with findings in some previous studies (Casey, McGee, and Stickney 1986; Denis and Rodgers 2007) but differs from the positive effect found in other studies (Campbell 1996; LoPucki and Doherty 2015; Mouton and Thomas 1993). Finally, the results indicate that the bankrupt firm’s size increases bankruptcy survival, which is consistent with findings in the majority of previous studies (Campbell 1996; Dahiya et al. 2003; LoPucki 1983; LoPucki and Doherty 2015; Moulton and Thomas 1993) but differs from the insignificant effect found in some previous studies (Casey, McGee, and Stickney 1986; Denis and Rodgers 2007).
Effect Sizes
To quantify the effect size of each of the predictor variables, I compute the difference in predicted bankruptcy survival associated with an increase in each variable from one standard deviation below its mean value to one standard deviation above its mean value. I compute the effects of advertising and R&D separately for bankrupt firms with high versus low Supplier influence, and I define high (low) Supplier influence as greater (less) than 50%. The results for the logit model, presented in Table 5, indicate that on average the increase in advertising increases the predicted probability of surviving bankruptcy 44.99% for a firm with high supplier influence and decreases the predicted probability of surviving bankruptcy 26.21% for a firm with low supplier influence. On average, the increase in R&D increases the predicted probability of surviving bankruptcy 74.76% for a firm with high supplier influence and decreases the predicted probability of surviving bankruptcy 5.20% for a firm with low supplier influence.
Difference in Average Predicted Bankruptcy Survival Associated with an Increase in Each Predictor Variable.
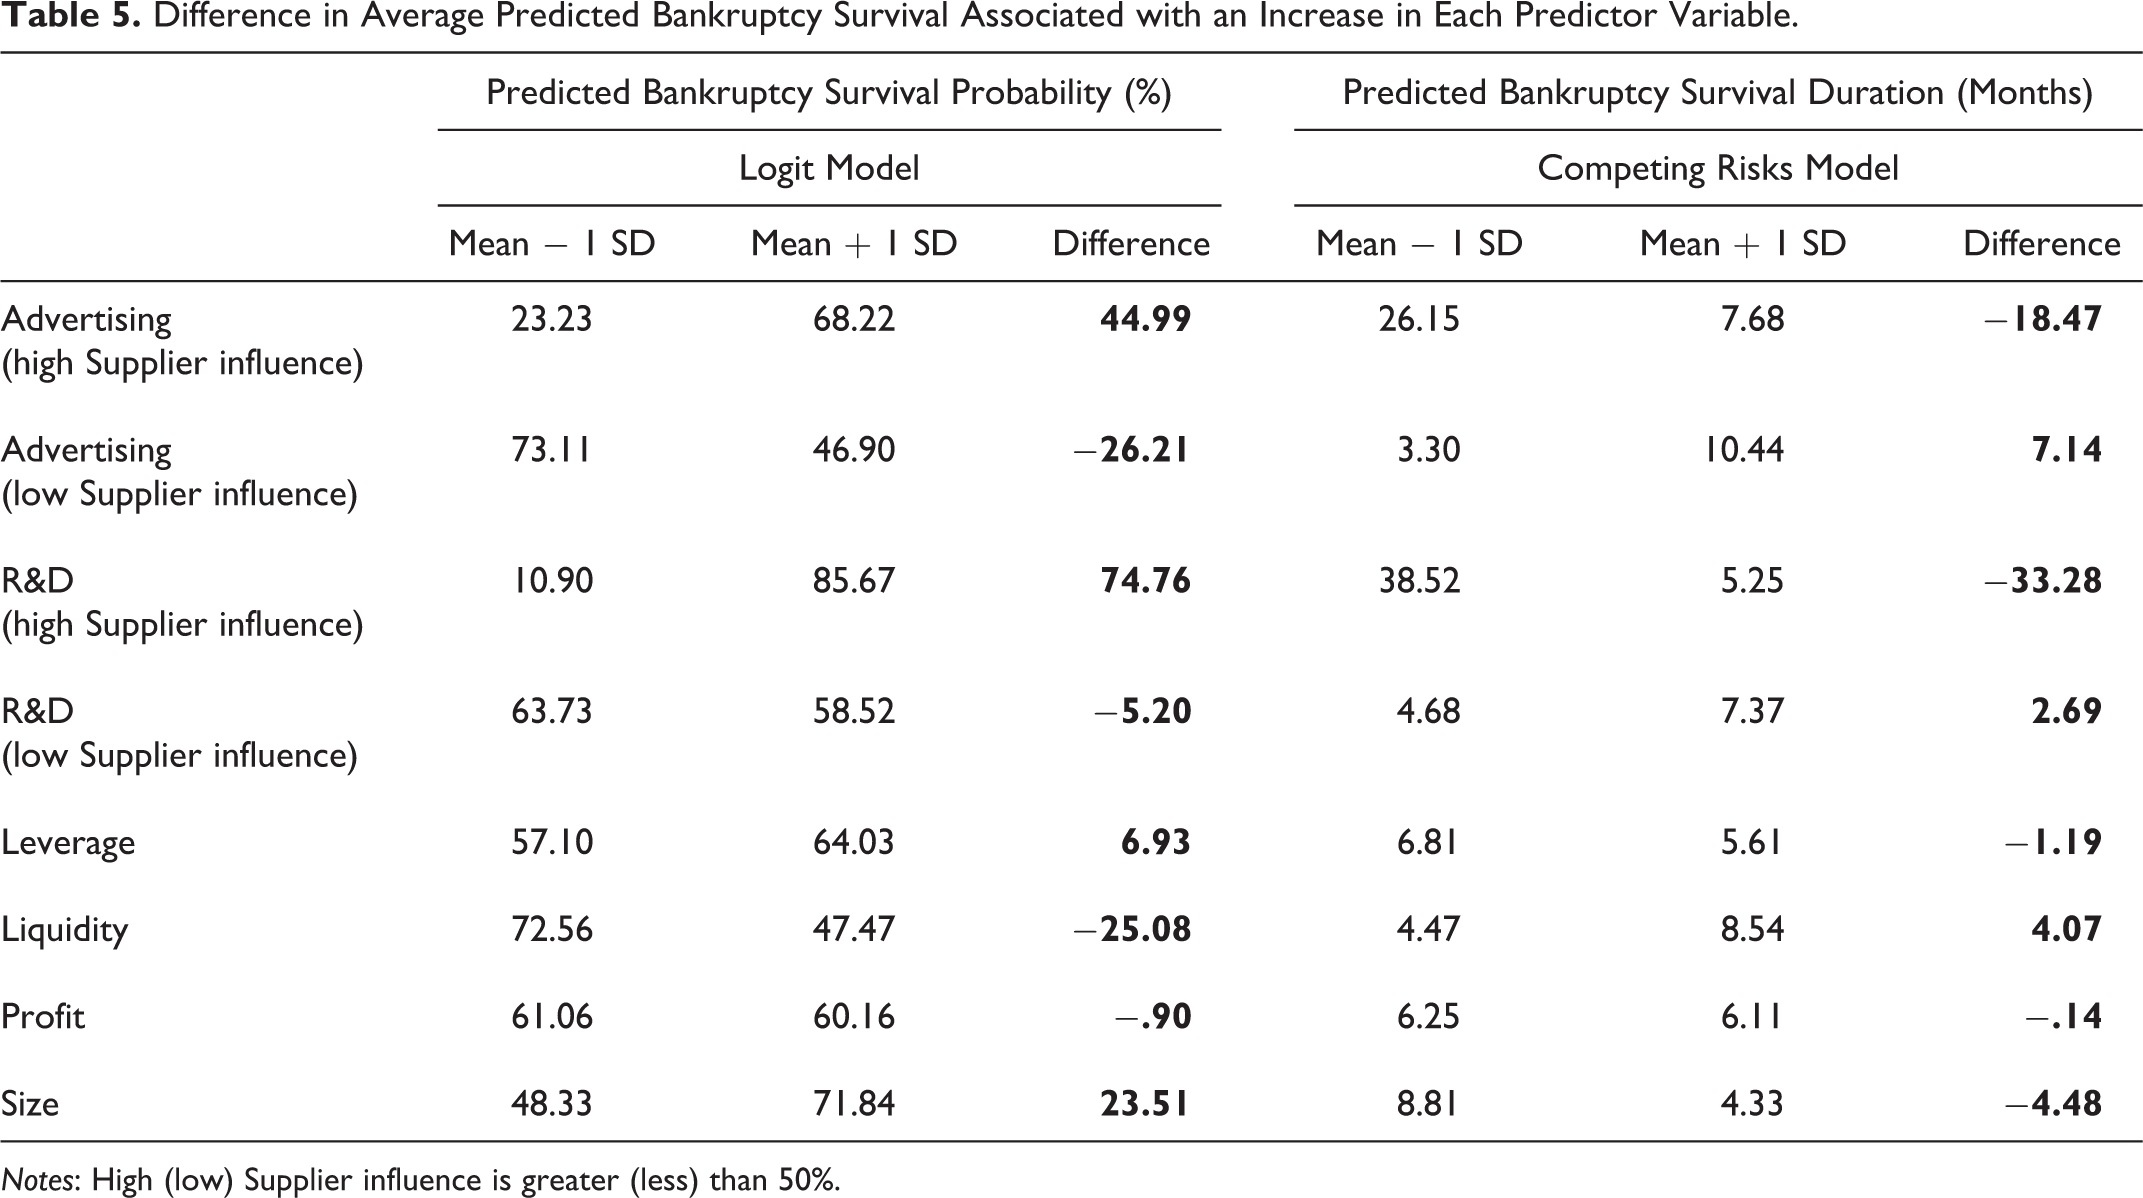
Notes: High (low) Supplier influence is greater (less) than 50%.
These findings provide further support for H1 and H2: advertising and R&D increase bankruptcy survival when supplier influence is high, whereas they decrease bankruptcy survival when supplier influence is low. For comparison, the results indicate that, on average, the increase in leverage increases the predicted bankruptcy survival probability 6.93%, the increase in liquidity decreases the predicted bankruptcy survival probability 25.08%, the increase in profit decreases the predicted bankruptcy survival probability .90%, and the increase in size increases the predicted bankruptcy survival probability 23.51%.
The dependent variable in the competing risks model is the bankruptcy survival subdistribution hazard function, which is the instantaneous rate of surviving bankruptcy at time t given that the firm has not already emerged from bankruptcy (i.e., survived) or has been liquidated or had its case dismissed. To quantify the effect sizes of the predictor variables in the competing risk model, I use the reciprocal of the hazard function, which gives the predicted bankruptcy survival duration (i.e., the expected length of time from entering bankruptcy until the bankrupt firm survives). A smaller predicted bankruptcy survival duration indicates that the firm has a greater likelihood of surviving bankruptcy whereas a larger predicted duration indicates that the firm has a lower likelihood of surviving bankruptcy.
The results for the competing risks model indicate that on average the increase in advertising decreases the predicted bankruptcy survival duration 18.47 months for a firm with high supplier influence and increases the predicted bankruptcy survival duration 7.14 months for a firm with low supplier influence. On average, the increase in R&D decreases the predicted bankruptcy survival duration 33.28 months for a firm with high supplier influence and increases the predicted bankruptcy survival duration 2.69 months for a firm with low supplier influence. For comparison, I note that the results indicate that on average the increase in leverage decreases the predicted bankruptcy survival duration 1.19 months, the increase in liquidity increases the predicted bankruptcy survival duration 4.07 months, the increase in profit decreases the predicted bankruptcy survival duration .14 months, and the increase in size decreases the predicted bankruptcy survival duration 4.48 months. For reference, the duration of time spent in bankruptcy for the firms in my data set ranges from 1.02 months to 79.35 months, with an average of 15.42 months.
Bankruptcy Survival Prediction
Although extant research has modeled the impact of advertising and R&D on shareholder value (e.g., Joshi and Hanssens 2010; Rubera and Kirca 2012) and the risk that a firm will enter bankruptcy (Jindal and McAlister 2015), this study is the first to model the impact of advertising and R&D on bankruptcy survival. Therefore, to provide insight to marketing managers who are managing a relationship with a bankrupt customer or partner, I validate the out-of-sample prediction performance of the bankruptcy survival models and compare them with the performance of a baseline model that does not include the marketing variables (advertising, R&D, and their interactions with supplier influence).
Unlike research that focuses on predicting whether a firm will enter bankruptcy, predicting bankruptcy survival has received little research attention. Some attribute this to the fact that distinguishing between bankrupt firms that survive versus bankrupt firms that are liquidated is more difficult than distinguishing between firms that are healthy and firms that are financially distressed because firms that are in bankruptcy share the characteristics of financial distress (Barniv, Agarwal, and Leach 2002). Therefore, drawing on recent research that has shown that machine learning can improve the ability to predict whether a firm enters bankruptcy (Barboza, Kimura, and Altman 2017), I also consider the out-of-sample prediction performance of random forests (details of this machine learning algorithm are presented in the “Bankruptcy Survival Prediction Using Random Forests Machine Learning” section in the Web Appendix).
Because the data set I used for estimating the bankruptcy survival models ends in December 2015, I validate the models using new data from January 2016 to November 2019. This new data has 168 bankruptcy cases. I eliminate cases that are ongoing because their outcome is not yet known, which results in a validation data set of 140 bankruptcy cases. To assess the bankruptcy survival prediction performance of the models, I calculate the accuracy and discrimination for each model.
Accuracy
Accuracy in bankruptcy survival prediction is the percentage of cases the model correctly classifies as surviving versus not surviving. I calculate the logit model’s predicted outcome for each bankruptcy case in the validation data set using the coefficient estimates from Column II of Table 4. Because the logit model provides a predicted probability that falls in the range from 0 to 1, I follow standard practice and classify a bankruptcy case that has a predicted probability greater than or equal to .50 as predicted to survive and a bankruptcy case that has a predicted probability of less than .50 as predicted to not survive. I calculate the logit model’s prediction accuracy as the percentage of bankruptcy cases that it classifies correctly.
The predicted outcome from the competing risks model is the predicted subdistribution hazard of bankruptcy survival after t days in bankruptcy, which is the instantaneous risk of a bankrupt firm surviving bankruptcy given that it has not already emerged from bankruptcy or has been liquidated or had its case dismissed. Because the competing risks model provides a predicted subdistribution hazard that falls in the range from 0 to infinity, there is not a midpoint cutoff that can be used to classify whether the bankruptcy case is predicted to survive. Consequently, following standard practice, I do not calculate accuracy for the competing risks model.
For the random forests machine learning model, I first train the algorithm on the estimation data set. I then use the algorithm to classify each bankruptcy case in the validation set as predicted to survive or not survive. Finally, I calculate the random forests’ prediction accuracy as the percentage of bankruptcy cases that it classifies correctly.
The out-of-sample bankruptcy survival prediction performance results are presented in Table 6. I find that random forests with the variables in the full model have the greatest accuracy (78.57%) and that the marketing variables improve accuracy for both the logit model (by 6.07%) and random forests (by 11.12%).
Out-of-Sample Validation of Bankruptcy Survival Prediction Performance.

Discrimination
In addition to calculating the accuracy of the models, which measures the percentage of bankruptcy cases that are correctly classified, I calculate the discrimination of the models. Discrimination measures how well the model’s prediction separates cases that survive from those that do not survive. I calculate the area under the receiver operating characteristic curve, which is the predominant measure for discrimination, for each model. For bankruptcy survival prediction, this discrimination measure is the probability that a bankruptcy case that actually survived had a higher predicted probability than did a bankrupt case that actually did not survive. I find that random forests with the variables in the full model have the greatest discrimination (79.17%) and that the marketing variables improve discrimination for the logit model (by 19.58%), the competing risks model (by 18.03%), and random forests (by 7.83%).
Robustness Checks and Additional Analyses
Alternative Advertising and R&D Measures
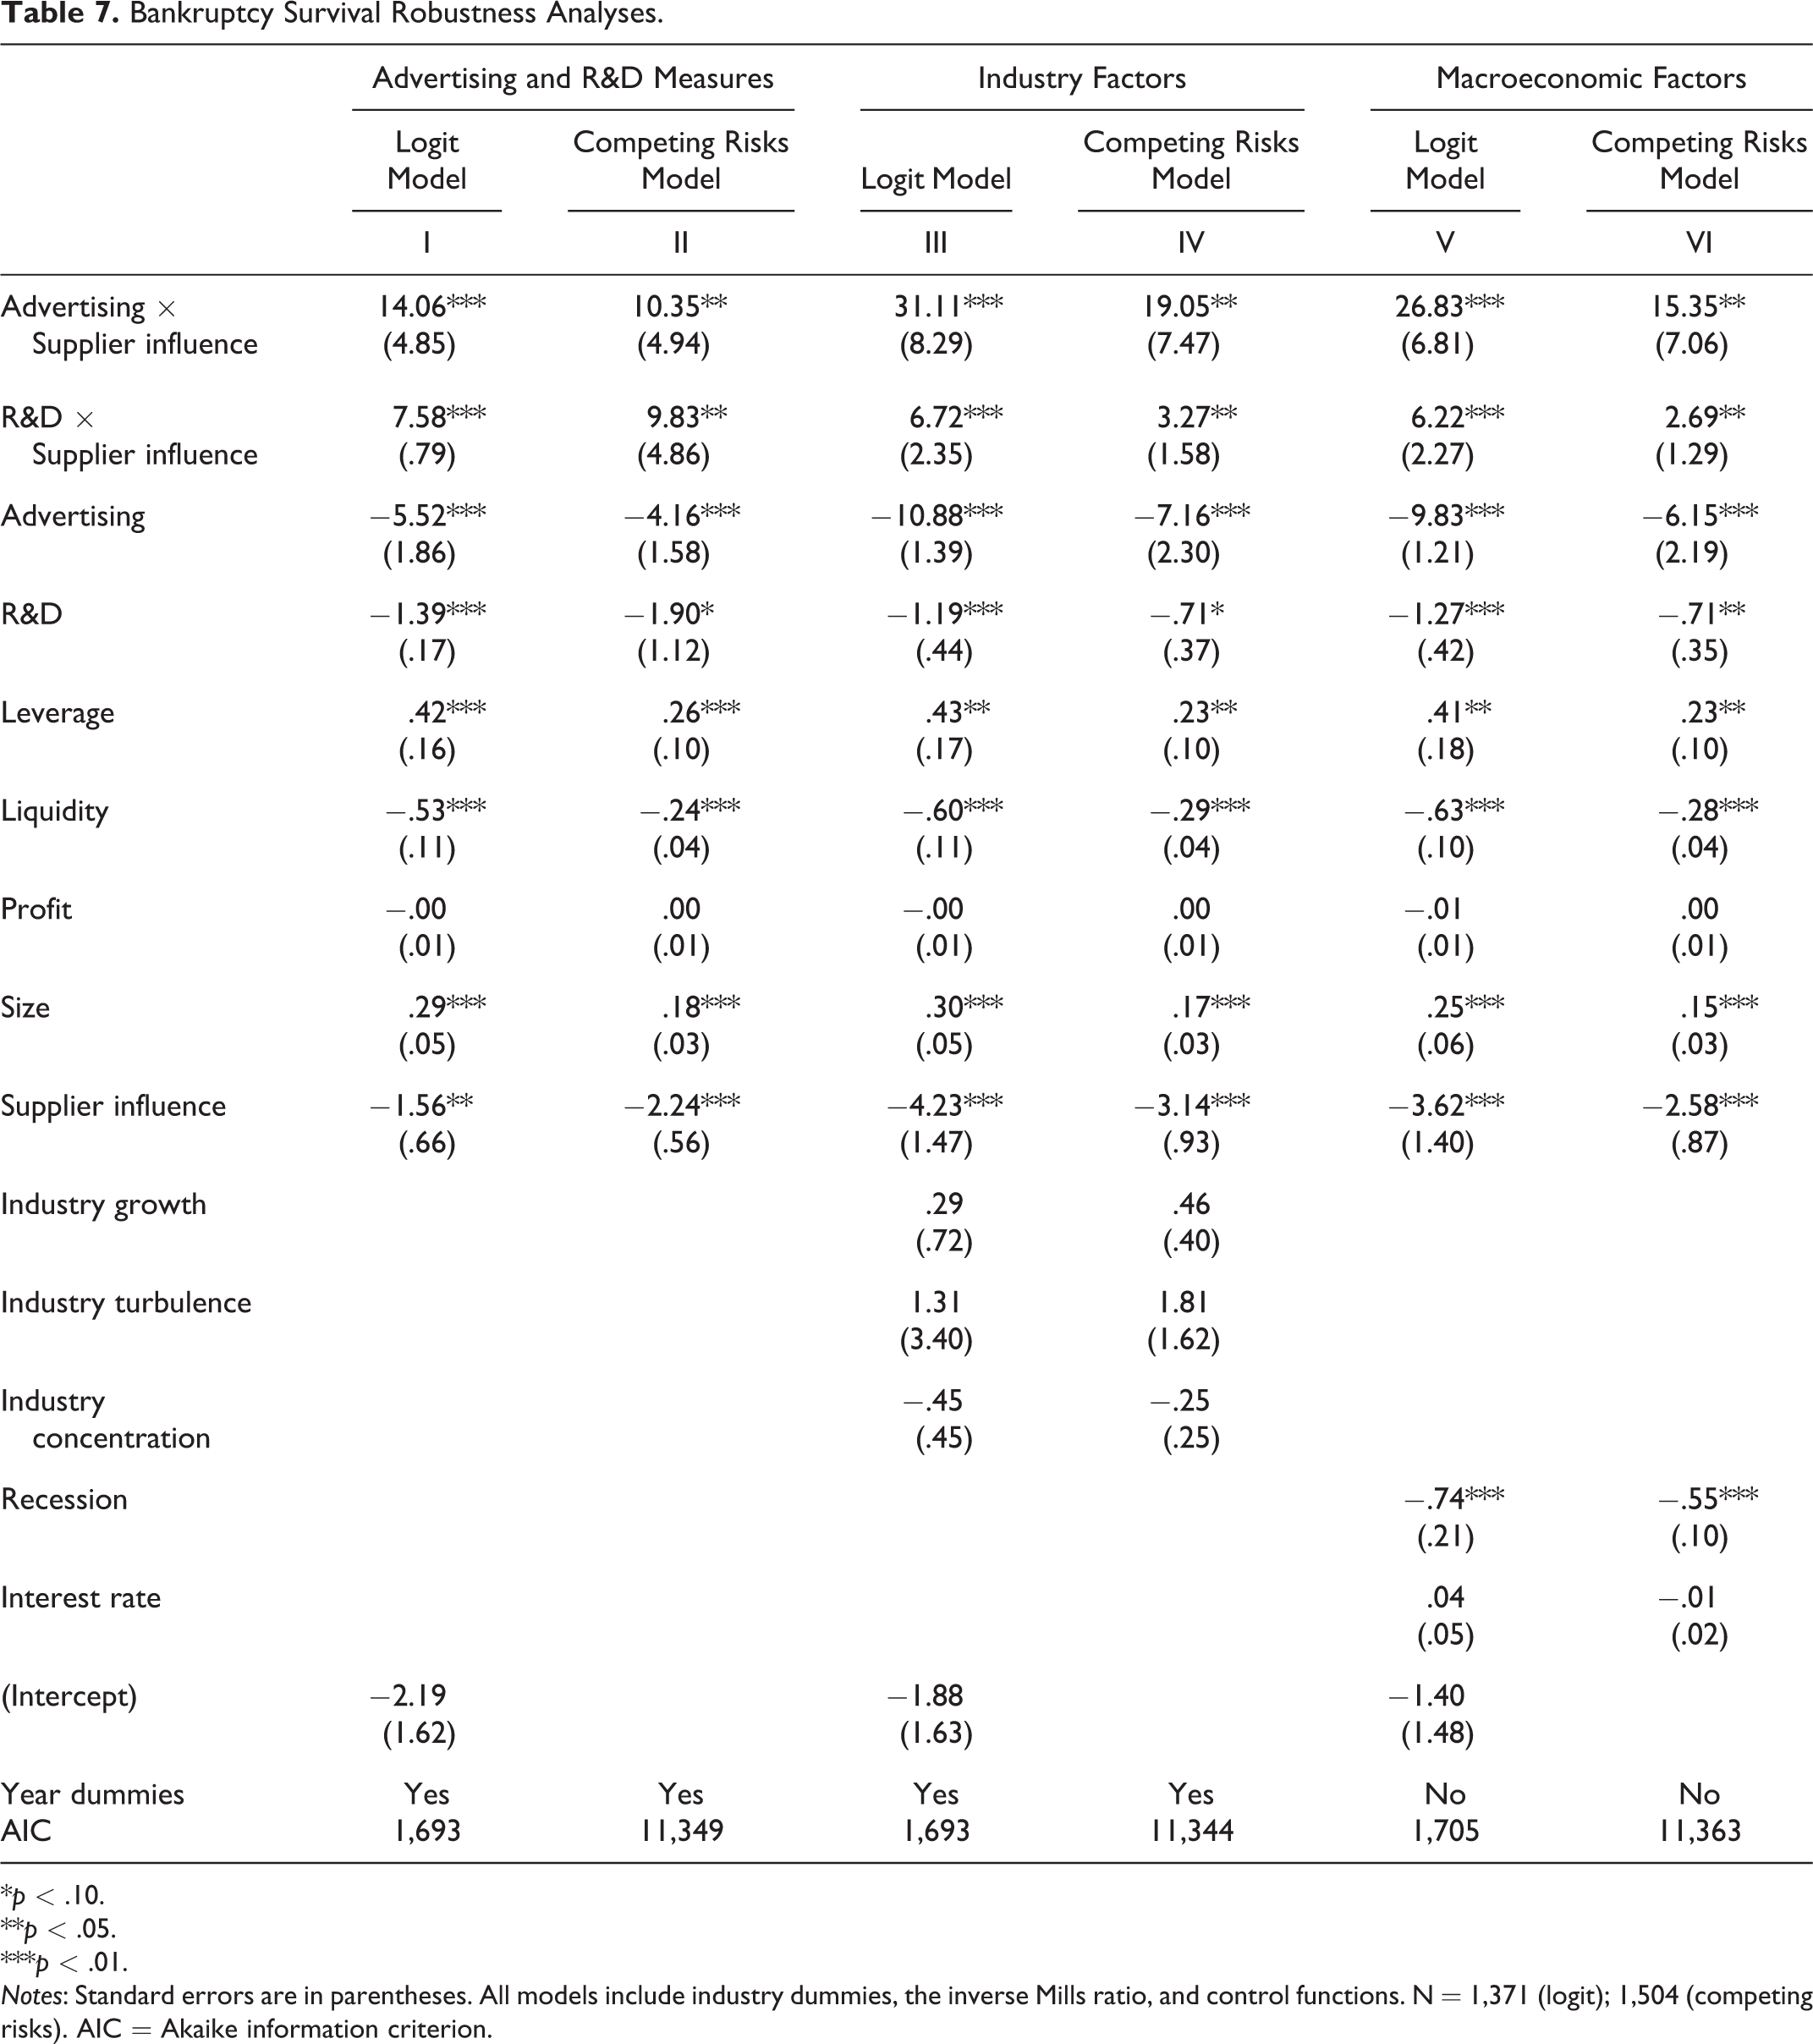
I measure advertising and R&D using Koyck-type distributed lag functions with decay parameters of .60 and .80, respectively. I also ran analyses with decay parameters in the range of .40 to .85 and found that the results are robust to these alternatives. As an additional robustness check, I considered distributed lag functions that do not assume a Koyck-type decay by measuring advertising and R&D using the Erickson and Jacobson (1992) weights of .70 and .30 for advertising in the bankruptcy filing year and one year prior, respectively, and .25, .21, .18, .14, .11, .07, and .04 for R&D in the bankruptcy filing year and one to six years prior, respectively. Estimation results using these alternative advertising and R&D measures, presented in Columns I and II of Table 7, are consistent with the coefficient estimates in Columns II and IV of Table 4 in terms of signs and significance. The difference in magnitudes indicates the importance of considering the distributed lag weights used when interpreting effect sizes.
Bankruptcy Survival Robustness Analyses.
*p < .10.
**p < .05.
***p < .01.
Notes: Standard errors are in parentheses. All models include industry dummies, the inverse Mills ratio, and control functions. N = 1,371 (logit); 1,504 (competing risks). AIC = Akaike information criterion.
I also assessed the sensitivity of the results to setting missing advertising and R&D values to zero. First, following Srinivasan and Ramani (2019) and Ramani and Srinivasan (2019), I set missing advertising and R&D values to .0001 and reestimated my models. I found the results consistent with the coefficient estimates in Columns II and IV of Table 4. Second, I eliminated observations with missing advertising and R&D values and reestimated my models on this subsample. I found the results from this analysis were also consistent with the coefficient estimates in Columns II and IV of Table 4 in terms of sign and significance.
Additional Industry and Macroeconomic Control Variables
Following extant bankruptcy survival literature, I include industry dummy variables in the models to control for unobserved industry effects (Campbell 1996; Dahiya et al. 2003; LoPucki and Doherty 2015). As an additional robustness check, I added industry growth, turbulence, and concentration and reestimated the models. Estimation results with these additional industry variables, presented in Columns III and IV of Table 7, are consistent with the coefficient estimates in Columns II and IV of Table 4.
I include year dummy variables in the models to control for unobserved macroeconomic effects. As an additional robustness check, I replaced the year dummy variables in the models with the following macroeconomic variables: Recessiony, which is a binary variable that is set to 1 if the bankruptcy filing year y is a recession year and 0 otherwise, and Interest ratey, which is the lending rate in bankruptcy filing year y. Following extant marketing literature (Jindal and McAlister 2015; Srinivasan, Lilien, and Sridhar 2011), I classify 1980, 1982, 1990, 2001, and 2008 as recession years because the majority of the year occurred during a recession as classified by the National Bureau of Economic Research. For the interest rate, I use the London Interbank Offered Rate, which is the primary benchmark used by creditors for short-term interest rates. Estimation results with these alternative macroeconomic variables, presented in Columns V and VI of Table 7, are consistent with the coefficient estimates in Columns II and IV of Table 4.
Past Bankruptcy History
Some firms file for bankruptcy again after emerging. These bankruptcies are sometimes referred to as “Chapter 22” filings (if this is the firm’s second time filing for bankruptcy), “Chapter 33” filings (if this if the firm’s third time filing for bankruptcy), and so on. In my data set, 143 (8.6%) of the bankruptcy cases were for firms that had previously filed for bankruptcy (127 [7.6%] had filed for bankruptcy once before, 14 [<1%] had filed for bankruptcy twice before, and 2 [<1%] had filed for bankruptcy three times before). Therefore, as an additional robustness check, I assessed whether a firm’s past bankruptcy history influences the impact of advertising and R&D on bankruptcy survival.
I created a dummy variable, Prior bankruptcyi, that I set equal to 1 if firm i had previously been in bankruptcy and 0 otherwise. I added this as a control variable to the models and found that it was not significant (p > .10) and that the other coefficient estimates remained consistent with the coefficient estimates in Columns II and IV of Table 4. I also included the interaction between Advertisingi and Prior bankruptcyi; the interaction between R&Di and Prior bankruptcyi; the interaction between Supplier influencei and Prior bankruptcyi; the three-way interaction between Advertisingi, Supplier influencei, and Prior bankruptcyi; and the three-way interaction between R&Di, Supplier influencei, and Prior bankruptcyi and found that the associated coefficient estimates for these interactions were not significant.
Long-Term Versus Short-Term Bankruptcy Survival
As previously noted, not all firms that emerge from bankruptcy survive in the long term (i.e., some firms file for bankruptcy once again after emerging). As an additional analysis, I classified bankruptcy survival into long term versus short term and reestimated the models. Because about half the firms that refile for bankruptcy survive four years or less (see the “Bankruptcy Refiling” section in the Web Appendix), I defined short-term bankruptcy survival as emerging from bankruptcy and then refiling for bankruptcy within the next four years and long-term bankruptcy survival as emerging from bankruptcy without refiling for bankruptcy within the next four years. I replaced Survivali with Long-term survivali in my models, where Long-term survivali equals 2 for long-term survival, 1 for short-term survival, 0 for did not survive (liquidated), −1 for dismissed, and −2 for ongoing. Since there are three relevant outcomes in this analysis (long-term survival, short-term survival, and did not survive), I used ordered logit and competing risks models. I found the coefficient estimates from this analysis consistent with the coefficient estimates in Columns II and IV of Table 4.
I also ran an additional analysis to assess whether advertising and R&D have an impact on the risk that a firm that survives bankruptcy will refile for bankruptcy again in the future. For this analysis, I modeled the hazard of refiling for bankruptcy using the same predictor variables as those in my main models. I estimated this model using the subsample of firms that survived bankruptcy and found that the coefficient estimates for the advertising and supplier influence interaction and the R&D and supplier influence interaction were not significant.
In summary, the empirical evidence consistently supports H1 and H2 and is robust to using alternative measures of advertising and R&D, adding additional industry control variables, using alternative macroeconomic variables, controlling for a firm’s past bankruptcy history, and classifying bankruptcy survival into long-term versus short-term.
Discussion
The value of assets that public firms have under bankruptcy protection is now at its highest level in at least 24 years (see the “Additional Data Information” section in the Web Appendix), making research on marketing’s impact on bankruptcy survival ever more important. While one might expect advertising and R&D to increase bankruptcy survival in the same way that they increase shareholder value, I show that this is not the case. I find robust evidence that the impact of advertising and R&D on bankruptcy survival is contingent on the influence of the bankrupt firm’s suppliers. Advertising and R&D increase bankruptcy survival when suppliers have a large influence, whereas they decrease bankruptcy survival when suppliers have a small influence. Out-of-sample validation shows that the ability to predict whether a firm will survive bankruptcy is substantially improved by considering advertising, R&D, and their interactions with supplier influence, in addition to the usual financial predictors.
Implications
This research has implications for managers of financially distressed firms, managers of firms that have a bankrupt customer or partner, marketing theory on the value of advertising and R&D, and marketing theory in the context of bankruptcy.
Managers of financially distressed firms
Because a financially distressed firm is unable to generate sufficient funds from its operating activities to fund its ongoing operations and invest in growth opportunities, managers of financially distressed firms often borrow funds from outside sources. This research shows that, should the firm later enter bankruptcy, these financing decisions play an important role in determining how the firm’s marketing assets influence the probability the firm will survive bankruptcy. Because advertising and R&D have a differential effect on suppliers’ and banks’ votes on whether to accept a bankrupt firm’s debt reorganization plan, a manager of a financially distressed firm that has made large investments in advertising and R&D should consider the influence that the firm’s suppliers have relative to its other creditors. The results in this article indicate that managers need to be aware that their advertising will only help them in bankruptcy if at least 35%−38% of their firm’s debt has been borrowed from suppliers and their R&D will only help them in bankruptcy if at least 18%−21% of their firm’s debt has been borrowed from suppliers, as these are the points at which advertising and R&D cross over from decreasing to increasing the probability of surviving bankruptcy.
Managers of firms that have a bankrupt customer or partner
An understanding of marketing’s impact on bankruptcy survival is critical not just for managers of the bankrupt firm but also for managers of firms that have a bankrupt customer or partner. If a supplier has a bankrupt customer that does not survive, the supplier loses the future revenue stream from that customer, loses the value of any relationship-specific investments it has made in the customer, incurs increased costs associated with trying to replace the customer, and loses any payments that were due from the customer. If a firm has a bankrupt channel or alliance partner that does not survive, it loses the value of any relationship-specific investments it has made in the partnership and incurs increased costs associated with trying to replace the partner. When a firm has a bankrupt customer or partner, the firm’s managers decide either to invest in the relationship (if they expect the customer or partner to survive) or to minimize their exposure to the bankrupt customer or partner (if they expect them to not survive).
A key challenge faced by a manager who has a bankrupt customer or partner is predicting whether the customer or partner will survive. The manager likely has information on the customer’s credit rating from when the manager’s firm loaned money to the customer and could also obtain a partner’s credit rating. However, once a firm files for bankruptcy, the credit rating agencies set the bankrupt firm’s credit rating to the lowest level (“default”) and do not provide any insight into whether the firm will survive. Therefore, the manager needs to use an alternative approach to assess the firm’s bankruptcy survival odds. The results of the out-of-sample validation indicate that managers can improve their ability to predict whether their customer or partner will survive bankruptcy by considering the firm’s advertising, R&D, and suppliers’ influence, in addition to the usual financial predictors.
Marketing theory on the value of advertising and R&D
This research extends theory on how advertising and R&D create shareholder value by showing how they affect bankruptcy survival. Extant theory on how advertising and R&D build shareholder value suggests that they increase both survival values and liquidation values, which have opposing effects on bankruptcy survival. Therefore, I develop a conceptual framework to explain the conditions under which advertising and R&D increase versus decrease the probability of surviving bankruptcy. By shedding light on the differences in noncontractual revenue and collateral between suppliers and banks, this article extends extant marketing theory by showing that advertising and R&D increase bankruptcy survival when suppliers have a large influence, whereas they decrease bankruptcy survival when suppliers have a small influence.
Marketing theory in the context of bankruptcy
An emerging stream of research has begun to develop theories about marketing’s role in the context of bankruptcy (Antia, Mani, and Wathne 2017; Jindal and McAlister 2015; Özturk, Chintagunta, and Venkataraman 2019; Özturk, Venkataraman, and Chintagunta 2016). This stream of research has focused solely on marketing’s role in the context of entering bankruptcy. Because the risk of entering bankruptcy is a function of a firm’s expected near-term cash flow, marketing theory in this area has focused on how marketing influences a firm’s expected near-term cash flow (Jindal and McAlister 2015). The current research adds to the theory on marketing’s role in the context of entering bankruptcy by developing theory on marketing’s role in the context of exiting (i.e., surviving) bankruptcy. Importantly, this work shifts from contributing to theory on marketing’s impact on expected near-term cash flow to contributing to theory on marketing’s impact on the relative value that a creditor receives if a bankrupt firm survives versus gets liquidated.
Limitations and Areas for Future Research
This is the first study of how a firm’s marketing investments affect its likelihood of surviving bankruptcy. Given the importance of this topic, further research on the relationship between marketing investments and bankruptcy survival is warranted. Following the predominant approach in extant literature on the impact of advertising and R&D on shareholder value, I used aggregated measures of advertising and R&D. Future research should consider the impact of more disaggregated measures of advertising and R&D on bankruptcy survival. For example, research could study whether certain types of advertising (e.g., price-oriented vs. brand-building) or certain types of R&D (e.g., process vs. product) have differential impacts on bankruptcy survival. Future research should also consider more aggregated marketing assets (e.g., brand equity) that are built through a combination of advertising and R&D that might affect bankruptcy survival. Future research could also consider whether a firm’s marketing capabilities influence the extent to which advertising and R&D affect bankruptcy survival.
As the first study on marketing’s influence on bankruptcy survival, the current article identifies the independent effects of advertising and R&D on bankruptcy survival. Future research could explore more nuanced effects of advertising and R&D in this context. For example, research could explore whether there are positive or negative interaction effects between advertising and R&D (i.e., whether they accentuate each other’s effects or whether they are redundant) on bankruptcy survival. Future research could also consider whether the relative amount that a firm spends on advertising versus R&D influences bankruptcy survival.
Research could also study alternative mechanisms through which advertising and R&D influence creditor behavior, such as the spillover effects documented for investors (e.g., Joshi and Hanssens 2010). Furthermore, research could consider whether changes to a firm’s advertising and R&D spending while the firm is in bankruptcy have an influence on the firm’s postbankruptcy performance if it survives. Bankruptcy might also tarnish a firm’s image and reputation in a similar manner as a product recall or brand scandal. Future research could study whether bankruptcy reduces the effectiveness of a firm’s advertising and R&D spending in building and maintaining brand equity with customers.
The current research uses data from firms that filed for bankruptcy in the United States. It may be the case that marketing’s link with bankruptcy survival might differ in countries that have different bankruptcy laws. Future research should address this question.
The conceptual arguments for how marketing influences liquidation value focused on the context of bankruptcy in this article. Future research should also consider the liquidation value of marketing assets outside of bankruptcy. For example, the liquidation value of a marketing asset determines the terms of a loan that is secured with the marketing asset as collateral. With the growth in the number of loans that are being secured with marketing assets as collateral (Graham, Marco, and Myers 2018), future research should extend the conceptual arguments in this article to consider the liquidation value of a marketing asset outside of bankruptcy and, consequently, how it influences the size and terms of the loan that a firm can obtain.
Supplemental Material
Supplemental Material, Bankruptcy_survival_web_appendix - The Impact of Advertising and R&D on Bankruptcy Survival: A Double-Edged Sword
Supplemental Material, Bankruptcy_survival_web_appendix for The Impact of Advertising and R&D on Bankruptcy Survival: A Double-Edged Sword by Niket Jindal in Journal of Marketing
Footnotes
Acknowledgments
The author thanks Neil Morgan, Rebecca Slotegraaf, and the JM review team for their comments and suggestions.
Associate Editor
Alina Sorescu
Declaration of Conflicting Interests
The author(s) declared no potential conflicts of interest with respect to the research, authorship, and/or publication of this article.
Funding
The author(s) received no financial support for the research, authorship, and/or publication of this article.
Notes
References
Supplementary Material
Please find the following supplemental material available below.
For Open Access articles published under a Creative Commons License, all supplemental material carries the same license as the article it is associated with.
For non-Open Access articles published, all supplemental material carries a non-exclusive license, and permission requests for re-use of supplemental material or any part of supplemental material shall be sent directly to the copyright owner as specified in the copyright notice associated with the article.